Embed Size (px)
Citation preview
432
Section B: National and District Profiles
432
Section B: Profile KwaZulu-Natal Province
19 KwaZulu-Natal Province
Ugu District Municipality (DC21)
Ugu District is situated in KwaZulu-Natal Province and has a population of 759 134, with a population density of 150.4 persons per km2. The district comprises six health sub-districts, namely Vulamehlo, Umdoni, uMzumbe, Hibiscus Coast, Ezinqoleni and uMuziwabantu, and falls in socio-economic Quintile 2. Estimated medical scheme coverage is 8.6%.
Social determinants of healtha
Unemployment ratea 35.2%
Youth unemployment rate (15-34 years)a 45.1%
No schooling 8.4%
Matric 31.9%
Higher education 8.1%
Households 175 146
Female-headed households 49.9%
Formal dwellings 58.6%
Flush toilet connected to sewerage 20.8%
Weekly refuse removal 19.7%
Piped water inside dwellings 21.1%
Electricity for lighting 84.1%
Blue Drop water score 66.3%
Source: StatsSA. 2014 Blue Drop Report.
Population distribution sub-district boundaries and health facility locations
a Statistics South Africa. Census 2011 Municipal fact sheet. Report No. 03-01-58. Pretoria: Statistics SA; 2012.
Population per selected category
Population category 2017 2018 2019 2020
under 1 year 18 983 18 972 18 810 18 463
under 5 years 97 112 96 564 95 635 94 423
05-09 years 95 652 96 284 96 686 97 078
10-14 years 86 028 88 692 91 092 93 063
15-19 years 73 264 74 314 76 489 79 305
20-24 years 82 044 78 778 75 236 72 388
25-29 years 84 243 84 823 85 017 84 319
30-34 years 67 685 71 848 75 817 79 722
35-39 years 44 912 48 726 52 503 55 755
40-44 years 29 981 31 340 32 957 35 038
45-49 years 22 787 23 216 23 857 24 668
50-54 years 20 575 20 300 19 991 19 761
55-59 years 18 125 18 119 18 115 18 063
60-64 years 14 941 14 901 14 936 14 982
65-69 years 13 173 12 657 12 146 11 752
70-74 years 9 924 9 942 9 869 9 647
75-79 years 6 206 5 928 5 753 5 703
80 years and older 4 473 4 255 4 053 3 864
Total 771 116 780 676 790 154 799 522
Estimated pregnant women* 20 312 20 300 20 127 19 755
Source: Mid-Year Population Estimates 2016 StatsSA. * Under 1 year population X 1.07.

Section B: National and District Profiles
433
Section B: Profile KwaZulu-Natal Province
433
Number of facilities by level, 2016/17
Ward based outreach
teams Clinic CHCDistrict Hospital
Regional Hospital
Central/Tertiary
HospitalsOther
Hospitals
Ezinqoleni SD 4 4 0 0 0 0 0
Hibiscus Coast SD 17 16 1 1 1 0 4
Umdoni SD 5 6 0 1 0 0 0
uMuziwabantu SD 12 11 0 1 0 0 0
Umzumbe SD 17 13 1 0 0 0 1
Vulamehlo SD 6 5 0 0 0 0 0
Ugu 61 55 2 3 1 0 5
Source: DHIS.
Human resources – filled posts, 2016
Community Health
WorkersNursing
assistantsEnrolled
nurseProfessional
nurseMedical
practitioners PharmacistsDental
practitionersOccupational
therapy Physiotherapy
Speech Therapy and Audiology
Ugu 795 463 696 1 229 241 79 16 16 22 22
Source: Persal, DHIS.
Management and efficiency indicators for the service delivery platform, 2016/17
PHC Management
Output Process & input
PHC utilisation rate (No)
Percentage Ideal clinics
(%)
Percentage of assessed PHC facilities with 90% of tracer
medicines available (%)
Provincial and LG
District Health Services
expenditure per capita
(uninsured) (Rand)
Provincial and LG PHC expenditure per capita
(uninsured) (Rand)
Provincial and LG PHC expenditure
per PHC headcount
(Rand)
2016/17 2016/17 2016/17 2016/17 2016/17 2016/17
Ezinqoleni SD Indicator 3.7 - - - - -
Numerator 206 533 - - - - -
Denominator 666 747 - - - - -
Hibiscus Coast SD Indicator 3.2 - - - - -
Numerator 875 723 - - - - -
Denominator 3 243 690 - - - - -
Umdoni SD Indicator 3.0 - - - - -
Numerator 250 832 - - - - -
Denominator 995 412 - - - - -
uMuziwabantu SD Indicator 3.1 - - - - -
Numerator 313 852 - - - - -
Denominator 1 228 329 - - - - -
Umzumbe SD Indicator 2.8 - - - - -
Numerator 477 766 - - - - -
Denominator 2 025 225 - - - - -
Vulamehlo SD Indicator 2.2 - - - - -
Numerator 175 051 - - - - -
Denominator 974 316 - - - - -
Ugu Indicator 3.0 30.4 84.9 2 334 1 421 429
Numerator 2 299 757 17 45 1 619 354 793 986 288 405 986 288 405
Denominator 9 133 719 56 53 693 914 693 914 2 299 757
KwaZulu-Natal Indicator 2.7 47.8 90.8 1 879 1 213 397
South Africa Indicator 2.3 29.8 78.4 1 726 1 054 389
Source: DHIS.
2008 2010 2012 2014 2016 2018Year
1_M
anag
emen
t
1_Im
pact
Inpatient crudedeath rate
2_O
utco
me
Average lengthof stay (districthospitals)
Expenditure perpatient dayequivalent(districthospitals)
3_O
utpu
t
Inpatient bedutilisation rate(districthospitals)
OPD new clientnot referred rate(districthospitals)
4_P
roce
ss_i
nput
PercentageIdeal clinics
Provincial andLG DistrictHealth Servicesexpenditure percapita(uninsured)
Provincial andLG PHCexpenditure percapita(uninsured)
Provincial andLG PHCexpenditure perPHC headcount
2
4
6
8
2
4
6
8
1K
2K
3K
4K
50
100
0
50
100
0
50
100
1K
2K
3K
500
1000
1500
200
400
KZN, DC21, Ugu District Municipality, SEQ 2 (deprived)
Measure NamesIndValueProv_avZA_av
Meas ure NamesIndV alue
P rov_av
ZA_av
434
Section B: National and District Profiles
434
Section B: Profile KwaZulu-Natal Province
Hos
pita
l
Dis
tric
t Hos
pita
lR
egio
nal H
ospi
tal
Tert
iary
/Cen
tral
Hos
pita
l
Aver
age
leng
th o
f st
ay -
tota
l (D
ays)
Expe
nditu
re
per p
atie
nt
day
equi
vale
nt
(Ran
d)
Inpa
tient
bed
ut
ilisa
tion
rate
- to
tal
(%)
Inpa
tient
cr
ude
deat
h ra
te (%
)
OPD
new
cl
ient
not
re
ferr
ed ra
te
(%)
Aver
age
leng
th o
f st
ay -
tota
l (D
ays)
Expe
nditu
re
per p
atie
nt
day
equi
vale
nt
(Ran
d)
Inpa
tient
bed
ut
ilisa
tion
rate
- to
tal
(%)
Inpa
tient
cr
ude
deat
h ra
te (%
)
OPD
new
cl
ient
not
re
ferr
ed ra
te
(%)
Aver
age
leng
th o
f st
ay -
tota
l (D
ays)
Expe
nditu
re
per p
atie
nt
day
equi
vale
nt
(Ran
d)
Inpa
tient
bed
ut
ilisa
tion
rate
- to
tal
(%)
Inpa
tient
cr
ude
deat
h ra
te (%
)
OPD
new
cl
ient
not
re
ferr
ed ra
te
(%)
Hib
iscu
s C
oast
SD
Indi
cato
r6.
22
178
73.4
6.4
38.6
5.3
3 47
971
.85.
222
.9 -
- -
- -
Num
erat
or80
330
231
836
357
80 3
3082
37
453
88 0
9353
8 59
7 43
888
093
866
7 32
6 -
- -
- -
Den
omin
ator
12 8
6510
6 46
110
9 51
212
865
19 3
1016
763
154
809
122
653
16 7
6331
948
- -
- -
-
Um
doni
SD
Indi
cato
r5.
62
689
50.3
6.7
20.4
- -
- -
- -
- -
- -
Num
erat
or68
796
282
733
460
68 7
9682
85
376
- -
- -
- -
- -
- -
Den
omin
ator
12 3
5410
5 15
313
6 89
012
354
26 3
23 -
- -
- -
- -
- -
-
uMuz
iwab
antu
SD
Indi
cato
r5.
82
315
56.3
6.0
77.2
- -
- -
- -
- -
- -
Num
erat
or43
244
161
233
267
43 2
4445
318
374
- -
- -
- -
- -
- -
Den
omin
ator
7 50
269
660
76 7
507
502
23 7
87 -
- -
- -
- -
- -
-
Ugu
In
dica
tor
5.9
2 40
359
.56.
444
.95.
33
479
71.8
5.2
22.9
- -
- -
-
Num
erat
or19
2 37
067
5 80
3 08
519
2 37
02
104
31 2
0388
093
538
597
438
88 0
9386
67
326
- -
- -
-
Den
omin
ator
32 7
2128
1 27
432
3 15
232
721
69 4
2016
763
154
809
122
653
16 7
6331
948
- -
- -
-
KwaZ
ulu-
Nat
alIn
dica
tor
5.4
2 56
656
.25.
449
.46.
12
935
67.9
5.5
34.6
8.0
5 98
271
.75.
526
.8
Sout
h Af
rica
Indi
cato
r4.
42
568
67.4
5.1
59.3
5.3
2 89
478
.35.
037
.26.
94
227
84.3
5.4
20.3
Sour
ce:
DH
IS a
nd B
AS.
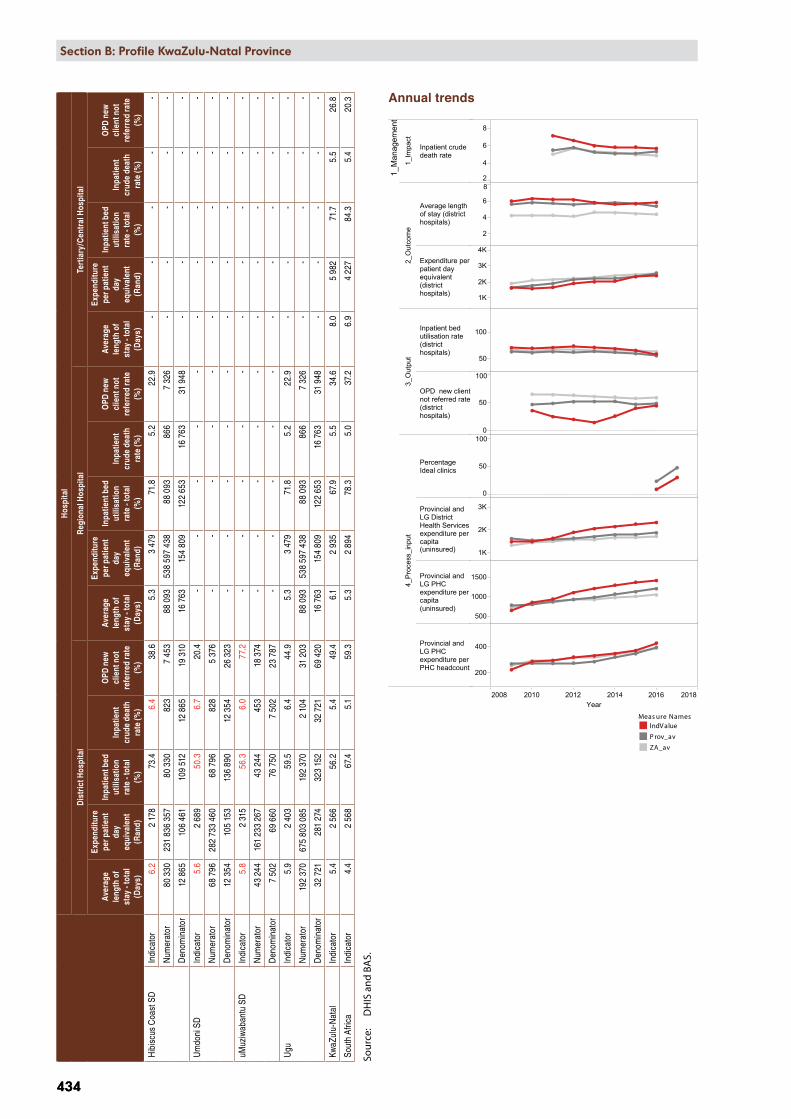
Annual trends
Section B: National and District Profiles
435
Section B: Profile KwaZulu-Natal Province
435
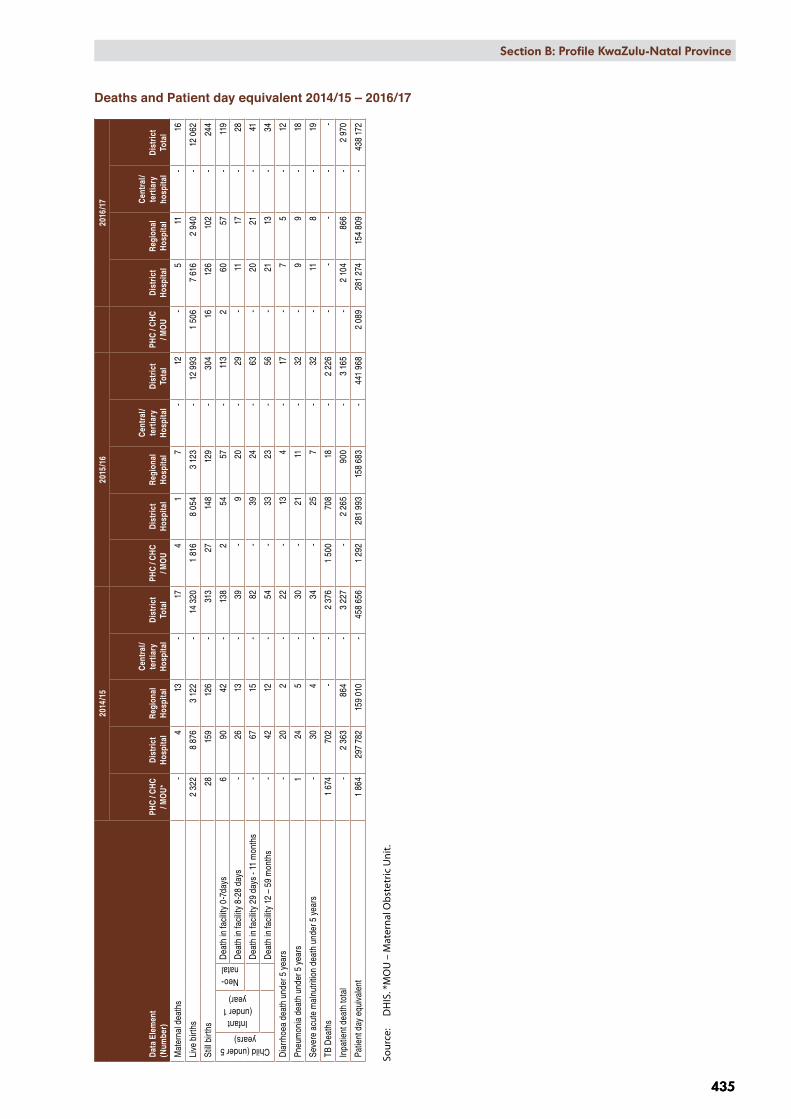
Deaths and Patient day equivalent 2014/15 – 2016/17
D
ata
Elem
ent
(Num
ber)
2014
/15
2015
/16
2016
/17
PHC
/ CH
C / M
OU
*D
istr
ict
Hos
pita
lR
egio
nal
Hos
pita
l
Cen
tral
/te
rtia
ry
Hos
pita
lD
istr
ict
Tota
lPH
C / C
HC
/ MO
UD
istr
ict
Hos
pita
lR
egio
nal
Hos
pita
l
Cen
tral
/te
rtia
ry
Hos
pita
lD
istr
ict
Tota
lPH
C / C
HC
/ MO
UD
istr
ict
Hos
pita
lR
egio
nal
Hos
pita
l
Cen
tral
/te
rtia
ry
hosp
ital
Dis
tric
t To
tal
Mat
erna
l dea
ths
-4
13-
174
17
-12
-5
11-
16
Live
birt
hs2
322
8 87
63
122
-14
320
1 81
68
054
3 12
3-
12 9
931
506
7 61
62
940
-12
062
Still
birth
s28
159
126
-31
327
148
129
-30
416
126
102
-24
4
Child (under 5 years)
Infant (under 1
year)
Neo-natal
Dea
th in
faci
lity
0-7d
ays
690
42-
138
254
57-
113
260
57-
119
Dea
th in
faci
lity
8-28
day
s -
2613
-39
-9
20-
29-
1117
-28
Dea
th in
faci
lity
29 d
ays
- 11
mon
ths
-67
15-
82-
3924
-63
-20
21-
41
Dea
th in
faci
lity
12 –
59
mon
ths
-42
12-
54-
3323
-56
-21
13-
34
Dia
rrho
ea d
eath
und
er 5
yea
rs
-20
2-
22-
134
-17
-7
5-
12
Pneu
mon
ia d
eath
und
er 5
yea
rs1
245
-30
-21
11-
32-
99
-18
Seve
re a
cute
mal
nutri
tion
deat
h un
der 5
yea
rs
-30
4-
34-
257
-32
-11
8-
19
TB D
eath
s 1
674
702
--
2 37
61
500
708
18-
2 22
6-
--
--
Inpa
tient
dea
th to
tal
-2
363
864
-3
227
-2
265
900
-3
165
-2
104
866
-2
970
Patie
nt d
ay e
quiv
alen
t1
864
297
782
159
010
-45
8 65
61
292
281
993
158
683
-44
1 96
82
089
281
274
154
809
-43
8 17
2
Sour
ce:
DH
IS. *
MO
U –
Mat
erna
l Obs
tetr
ic U
nit.

AgeGroup.. Female Male<5 years
5-1415-2425-64
65+Total 18%
12%15%
20%36%
71%
29%6%
47%53%
27%11%
48%80%
34%14%
19%11%
5%3%5%
13%17%
7%
18%11%14%
11%28%
70%
32%10%
44%23%
29%12%
36%75%
27%12%
19%10%
15%4%
15%54%
24%8%
KZN, Ugu: DC21, 2010 - 2015
Rank.. Female Male
<5 y
ears
12345678910
5-14
12345678910
15-2
4
12345678910
25-6
4
12345678910
65+
12345678910
Other perinatal conditions (2.4%)
Sepsis/other newborn infectious (3.4%)
Birth asphyxia (7.3%)
Protein-energy malnutrition (6.0%)
Preterm birth complications (10.3%)
Septicaemia (2.4%)
Diarrhoeal diseases (22.6%)Lower respiratory infections (15.1%)
Tuberculosis (4.3%)
HIV/AIDS (7.2%)
Drowning (4.7%)
Epilepsy (2.6%)
Asthma (3.5%)
Meningitis/encephalitis (4.6%)
Accidental threats to breathing (2.9%)
Road injuries (4.3%)
Diarrhoeal diseases (19.0%)
Lower respiratory infections (9.6%)
Tuberculosis (15.5%)HIV/AIDS (13.2%)
Epilepsy (1.7%)
Meningitis/encephalitis (3.3%)Accidental threats to breathing (4.1%)
Interpersonal violence (1.9%)Road injuries (1.8%)
Diarrhoeal diseases (5.5%)
Cerebrovascular disease (1.2%)
Lower respiratory infections (7.6%)Tuberculosis (24.9%)
HIV/AIDS (29.5%)
Cervix (2.2%)
Nephritis/nephrosis (1.9%)
Hypertensive heart disease (2.5%)Diabetes mellitus (4.7%)Diarrhoeal diseases (4.9%)
Ischaemic heart disease (2.1%)
Cerebrovascular disease (7.0%)Lower respiratory infections (6.6%)
Tuberculosis (19.9%)HIV/AIDS (26.8%)
Asthma (2.5%)COPD (2.9%)
Nephritis/nephrosis (4.2%)
Hypertensive heart disease (9.1%)Diabetes mellitus (8.8%)
Diarrhoeal diseases (3.3%)
Ischaemic heart disease (6.8%)
Cerebrovascular disease (26.7%)
Lower respiratory infections (6.6%)
Tuberculosis (4.1%)
Other perinatal conditions (2.3%)
Sepsis/other newborn infectious (3.9%)
Birth asphyxia (6.7%)Protein-energy malnutrition (6.3%)
Preterm birth complications (10.3%)
Septicaemia (2.4%)
Diarrhoeal diseases (22.4%)Lower respiratory infections (14.4%)
Tuberculosis (3.8%)
HIV/AIDS (8.0%)
Drowning (8.0%)
Epilepsy (3.2%)
Asthma (4.4%)
Meningitis/encephalitis (3.5%)Accidental threats to breathing (3.7%)
Road injuries (6.2%)
Diarrhoeal diseases (11.5%)Lower respiratory infections (9.4%)
Tuberculosis (16.5%)HIV/AIDS (14.2%)
Drowning (4.1%)Epilepsy (3.0%)
Mechanical forces (6.6%)
Accidental threats to breathing (15.0%)Interpersonal violence (18.0%)
Road injuries (6.0%)
Diarrhoeal diseases (2.5%)
Lower respiratory infections (4.6%)
Tuberculosis (14.6%)HIV/AIDS (9.2%)
Mechanical forces (3.1%)Accidental threats to breathing (3.2%)Interpersonal violence (3.6%)
Diabetes mellitus (2.2%)
Diarrhoeal diseases (4.3%)
Ischaemic heart disease (2.8%)
Cerebrovascular disease (4.7%)Lower respiratory infections (7.2%)
Tuberculosis (25.0%)HIV/AIDS (18.9%)
Prostate (3.0%)Asthma (3.1%)
COPD (4.5%)Nephritis/nephrosis (3.6%)
Hypertensive heart disease (5.1%)Diabetes mellitus (6.9%)
Ischaemic heart disease (10.6%)Cerebrovascular disease (17.4%)
Lower respiratory infections (7.3%)Tuberculosis (8.5%)
Rank.. Maternal conditions All other causes
Fem
ale
15-4
9
12345678910
Maternal sepsis (6.8%) n=9
Abortion (15.6%) n=20Maternal haemorrhage (8.5%) n=11
Hypertension in pregnancy (18.0%) n=23Other maternal (17.9%) n=23
Indirect maternal (33.1%) n=43
Asthma (1.3%) n=139Accidental threats to breathing (1.4%) n=143
Diabetes mellitus (1.6%) n=173Cervix (1.5%) n=156
Cerebrovascular disease (2.5%) n=258Meningitis/encephalitis (2.4%) n=248
Diarrhoeal diseases (5.8%) n=607Lower respiratory infections (7.4%) n=777
Tuberculosis (24.7%) n=2 598HIV/AIDS (34.1%) n=3 583
Percentage ofdeaths by broad
causes andsingle leading
causes
BroadcauseInjury
NCD
HIV and TB
Comm_mat_peri_nut
Prov, DistrictKZN, Ugu: DC21
Show history
Percentages are shownaccording to all the deaths
within the age/gendercategory of each box,
although only the leading10 causes are displayed.
436
Section B: National and District Profiles
436
Section B: Profile KwaZulu-Natal Province
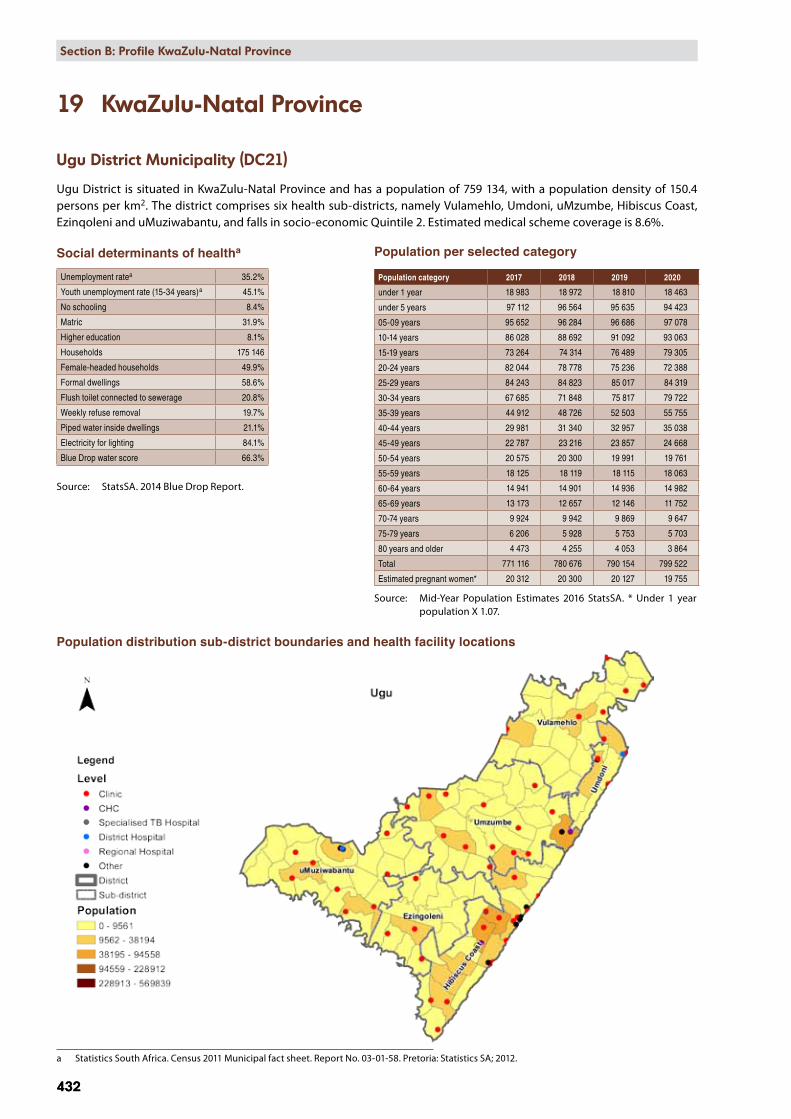
Burden of disease profile
For the percentage of deaths by broad cause, deaths are classified into four groups namely: (i) injuries; (ii) non-communicable diseases; (iii) HIV and TB; and (iv) communicable diseases together with maternal perinatal and nutritional conditions. Data are given by gender and age group for the period 2010–2015. The second part of the graph shows the 10 leading single causes of death within each age group (both genders) for 2010–2015 combined.
Percentage of deaths by broad cause and leading causes 2010–2015
2009 2010 2011 2012 2013 2014 2015 2016Year
2_M
ater
nal a
nd w
omen
's h
ealth
1_Im
pact Maternal
mortality infacility ratio
2_O
utco
me
Antenatal 1stvisit before 20weeks rate
Couple yearprotection rate(WHO)
Delivery infacility under 18years rate
Motherpostnatal visitwithin 6 daysrate
3_O
utpu
t
Antenatal clientinitiated on ARTrate
Cervical cancerscreeningcoverage
0
200
400
600
800
20
40
60
80
100
200
5
10
15
0
100
200
50
100
150
200
50
100
150
KZN, DC21, Ugu District Municipality, SEQ 2 (deprived)
Measure NamesIndValueProv_avZA_av
Section B: National and District Profiles
437
Section B: Profile KwaZulu-Natal Province
437
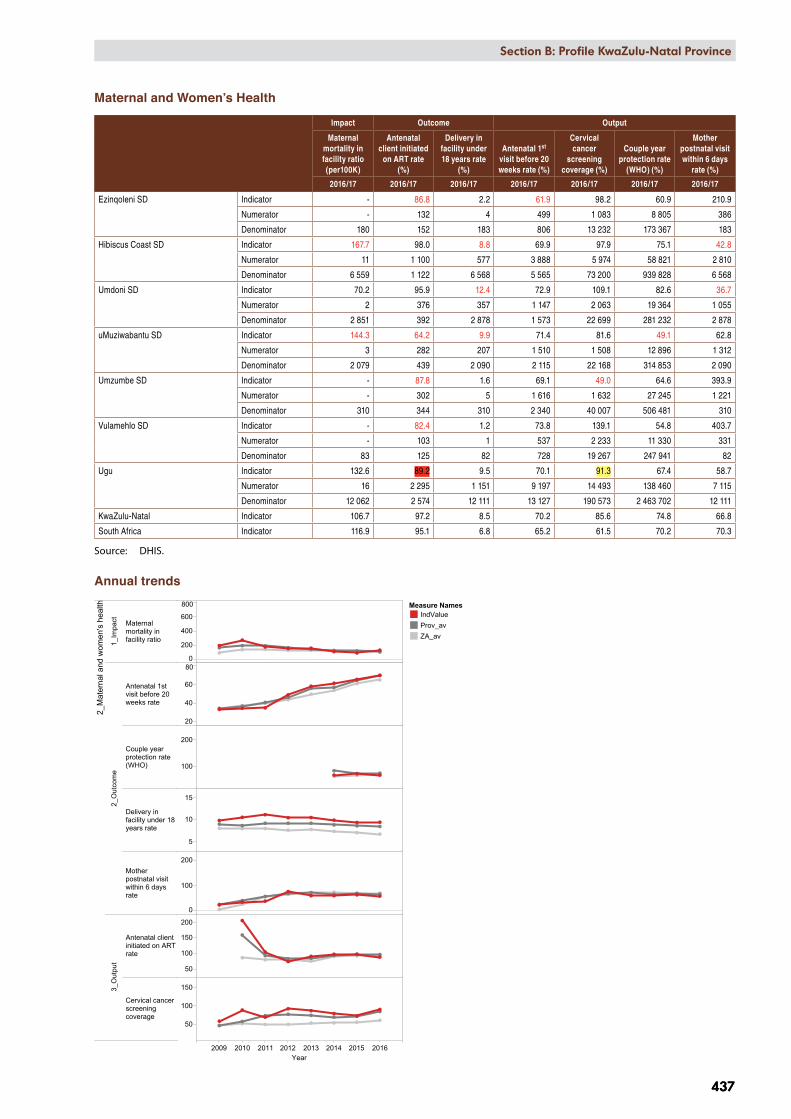
Maternal and Women’s Health
Impact Outcome Output
Maternal mortality in facility ratio (per100K)
Antenatal client initiated
on ART rate (%)
Delivery in facility under 18 years rate
(%)
Antenatal 1st visit before 20 weeks rate (%)
Cervical cancer
screening coverage (%)
Couple year protection rate
(WHO) (%)
Mother postnatal visit within 6 days
rate (%)
2016/17 2016/17 2016/17 2016/17 2016/17 2016/17 2016/17
Ezinqoleni SD Indicator - 86.8 2.2 61.9 98.2 60.9 210.9
Numerator - 132 4 499 1 083 8 805 386
Denominator 180 152 183 806 13 232 173 367 183
Hibiscus Coast SD Indicator 167.7 98.0 8.8 69.9 97.9 75.1 42.8
Numerator 11 1 100 577 3 888 5 974 58 821 2 810
Denominator 6 559 1 122 6 568 5 565 73 200 939 828 6 568
Umdoni SD Indicator 70.2 95.9 12.4 72.9 109.1 82.6 36.7
Numerator 2 376 357 1 147 2 063 19 364 1 055
Denominator 2 851 392 2 878 1 573 22 699 281 232 2 878
uMuziwabantu SD Indicator 144.3 64.2 9.9 71.4 81.6 49.1 62.8
Numerator 3 282 207 1 510 1 508 12 896 1 312
Denominator 2 079 439 2 090 2 115 22 168 314 853 2 090
Umzumbe SD Indicator - 87.8 1.6 69.1 49.0 64.6 393.9
Numerator - 302 5 1 616 1 632 27 245 1 221
Denominator 310 344 310 2 340 40 007 506 481 310
Vulamehlo SD Indicator - 82.4 1.2 73.8 139.1 54.8 403.7
Numerator - 103 1 537 2 233 11 330 331
Denominator 83 125 82 728 19 267 247 941 82
Ugu Indicator 132.6 89.2 9.5 70.1 91.3 67.4 58.7
Numerator 16 2 295 1 151 9 197 14 493 138 460 7 115
Denominator 12 062 2 574 12 111 13 127 190 573 2 463 702 12 111
KwaZulu-Natal Indicator 106.7 97.2 8.5 70.2 85.6 74.8 66.8
South Africa Indicator 116.9 95.1 6.8 65.2 61.5 70.2 70.3
Source: DHIS.
Annual trends
438
Section B: National and District Profiles
438
Section B: Profile KwaZulu-Natal Province
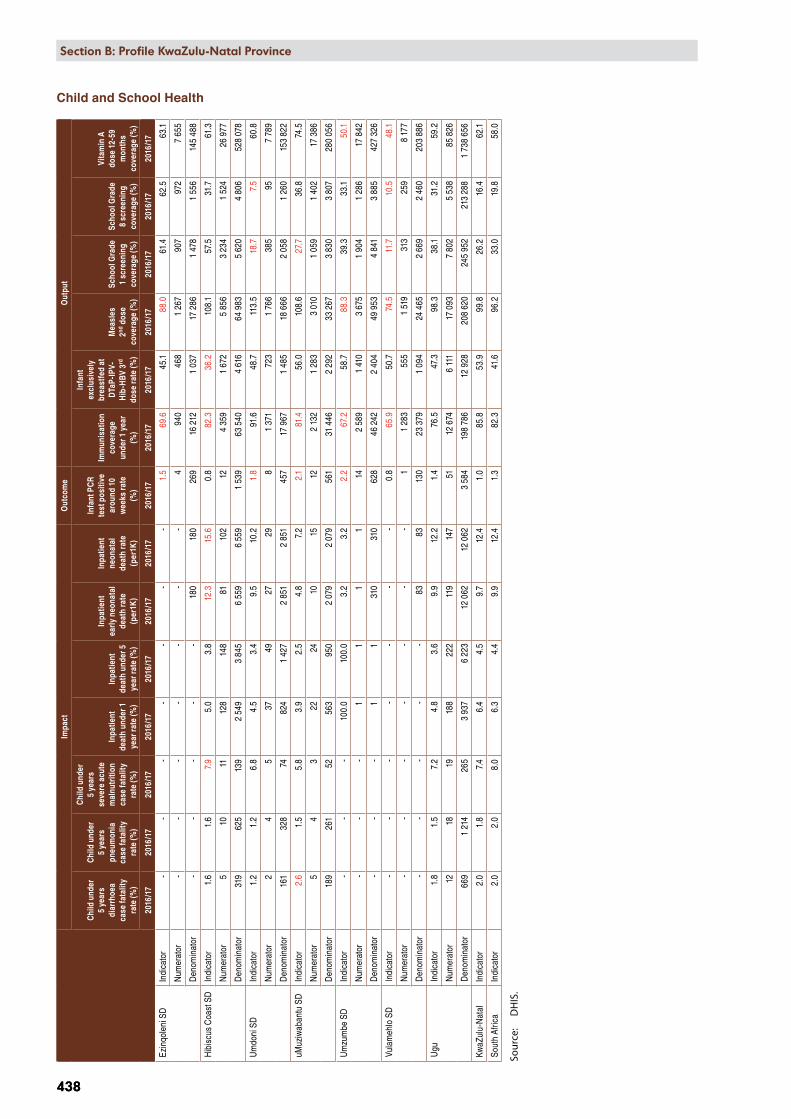
Child and School Health
Im
pact
Out
com
eO
utpu
t
Chi
ld u
nder
5
year
s di
arrh
oea
case
fata
lity
rate
(%)
Chi
ld u
nder
5
year
s pn
eum
onia
ca
se fa
talit
y ra
te (%
)
Chi
ld u
nder
5
year
s se
vere
acu
te
mal
nutr
ition
ca
se fa
talit
y ra
te (%
)
Inpa
tient
de
ath
unde
r 1
year
rate
(%)
Inpa
tient
de
ath
unde
r 5
year
rate
(%)
Inpa
tient
ea
rly n
eona
tal
deat
h ra
te
(per
1K)
Inpa
tient
ne
onat
al
deat
h ra
te
(per
1K)
Infa
nt P
CR
test
pos
itive
ar
ound
10
wee
ks ra
te
(%)
Imm
unis
atio
n co
vera
ge
unde
r 1 y
ear
(%)
Infa
nt
excl
usiv
ely
brea
stfe
d at
D
TaP-
IPV-
Hib
-HB
V 3rd
do
se ra
te (%
)
Mea
sles
2nd
dos
e co
vera
ge (%
)
Scho
ol G
rade
1
scre
enin
g co
vera
ge (%
)
Scho
ol G
rade
8
scre
enin
g co
vera
ge (%
)
Vita
min
A
dose
12-
59
mon
ths
cove
rage
(%)
2016
/17
2016
/17
2016
/17
2016
/17
2016
/17
2016
/17
2016
/17
2016
/17
2016
/17
2016
/17
2016
/17
2016
/17
2016
/17
2016
/17
Ezin
qole
ni S
DIn
dica
tor
- -
- -
- -
-1.
569
.645
.188
.061
.462
.563
.1
Num
erat
or -
- -
- -
- -
494
046
81
267
907
972
7 65
5
Den
omin
ator
- -
- -
-18
018
026
916
212
1 03
717
286
1 47
81
556
145
488
Hib
iscu
s C
oast
SD
Indi
cato
r1.
61.
67.
95.
03.
812
.315
.60.
882
.336
.210
8.1
57.5
31.7
61.3
Num
erat
or5
1011
128
148
8110
212
4 35
91
672
5 85
63
234
1 52
426
977
Den
omin
ator
319
625
139
2 54
93
845
6 55
96
559
1 53
963
540
4 61
664
983
5 62
04
806
528
078
Um
doni
SD
Indi
cato
r1.
21.
26.
84.
53.
49.
510
.21.
891
.648
.711
3.5
18.7
7.5
60.8
Num
erat
or2
45
3749
2729
81
371
723
1 76
638
595
7 78
9
Den
omin
ator
161
328
7482
41
427
2 85
12
851
457
17 9
671
485
18 6
662
058
1 26
015
3 82
2
uMuz
iwab
antu
SD
Indi
cato
r2.
61.
55.
83.
92.
54.
87.
22.
181
.456
.010
8.6
27.7
36.8
74.5
Num
erat
or5
43
2224
1015
122
132
1 28
33
010
1 05
91
402
17 3
86
Den
omin
ator
189
261
5256
395
02
079
2 07
956
131
446
2 29
233
267
3 83
03
807
280
056
Um
zum
be S
DIn
dica
tor
- -
-10
0.0
100.
03.
23.
22.
267
.258
.788
.339
.333
.150
.1
Num
erat
or -
- -
11
11
142
589
1 41
03
675
1 90
41
286
17 8
42
Den
omin
ator
- -
-1
131
031
062
846
242
2 40
449
953
4 84
13
885
427
326
Vula
meh
lo S
DIn
dica
tor
- -
- -
- -
-0.
865
.950
.774
.511
.710
.548
.1
Num
erat
or -
- -
- -
- -
11
283
555
1 51
931
325
98
177
Den
omin
ator
- -
- -
-83
8313
023
379
1 09
424
465
2 66
92
460
203
886
Ugu
In
dica
tor
1.8
1.5
7.2
4.8
3.6
9.9
12.2
1.4
76.5
47.3
98.3
38.1
31.2
59.2
Num
erat
or12
1819
188
222
119
147
5112
674
6 11
117
093
7 80
25
538
85 8
26
Den
omin
ator
669
1 21
426
53
937
6 22
312
062
12 0
623
584
198
786
12 9
2820
8 62
024
5 95
221
3 28
81
738
656
KwaZ
ulu-
Nat
alIn
dica
tor
2.0
1.8
7.4
6.4
4.5
9.7
12.4
1.0
85.8
53.9
99.8
26.2
16.4
62.1
Sout
h Af
rica
Indi
cato
r2.
02.
08.
06.
34.
49.
912
.41.
382
.341
.696
.233
.019
.858
.0
Sour
ce:
DH
IS.

2009 2010 2011 2012 2013 2014 2015 2016Year
3_C
hild
and
sch
ool h
ealth
1_Im
pact
Child under 5years diarrhoeacase fatality rate
Child under 5yearspneumoniacase fatality rate
Child under 5years severeacutemalnutritioncase fatality rate
Inpatient earlyneonatal deathrate
3_O
utpu
t
Immunisationcoverage under1 year
Infantexclusivelybreastfed atDTaP-IPV-Hib-HBV 3rd doserate
Measles 2nddose coverage
School Grade 1screeningcoverage
0
50
100
0
10
20
30
0
20
40
60
0
10
20
50
100
150
20
40
60
80
50
100
150
0
50
100
KZN, DC21, Ugu District Municipality, SEQ 2 (deprived)
Measure NamesIndValueProv_avZA_av
2009 2010 2011 2012 2013 2014 2015 2016Year
4_H
IV
4_P
roce
ss_i
nput
HIV testingcoverage(including ANC)
Male condomdistributioncoverage
Medical malecircumcisionrate
20
40
60
100
200
0
20
40
6080
KZN, DC21, Ugu District Municipality, SEQ 2 (deprived)
Measure NamesIndValueProv_avZA_av
Section B: National and District Profiles
439
Section B: Profile KwaZulu-Natal Province
439
Annual trends Child and School Health
Annual trends HIV
440
Section B: National and District Profiles
440
Section B: Profile KwaZulu-Natal Province
HIV
3rd
90-
90-9
02nd
90-
90-9
01st
90-9
0-90
Out
com
eO
utpu
tPr
oces
s &
inpu
t
Adu
lt w
ith v
iral
load
com
plet
ion
rate
at 1
2 m
onth
s (%
)
Chi
ld w
ith v
iral
load
com
plet
ion
rate
at 1
2 m
onth
s (%
)
Adu
lt w
ith v
iral
load
sup
pres
sed
rate
12
mon
ths
(%)
Chi
ld w
ith v
iral
load
sup
pres
sed
rate
12
mon
ths
(%)
Adu
lt pe
rcen
tage
on
AR
T af
ter 1
2 m
onth
s (%
)
Chi
ld p
erce
ntag
e on
AR
T af
ter 1
2 m
onth
s (%
)C
lient
s re
mai
ning
on
AR
T ra
te (%
)
HIV
test
pos
itive
cl
ient
15
year
s an
d ol
der r
ate
(incl
udin
g A
NC
) (%
)
HIV
test
ing
cove
rage
(in
clud
ing
AN
C)
(%)
Mal
e co
ndom
di
strib
utio
n co
vera
ge (N
o)
Med
ical
mal
e ci
rcum
cisi
on ra
te
(per
1K)
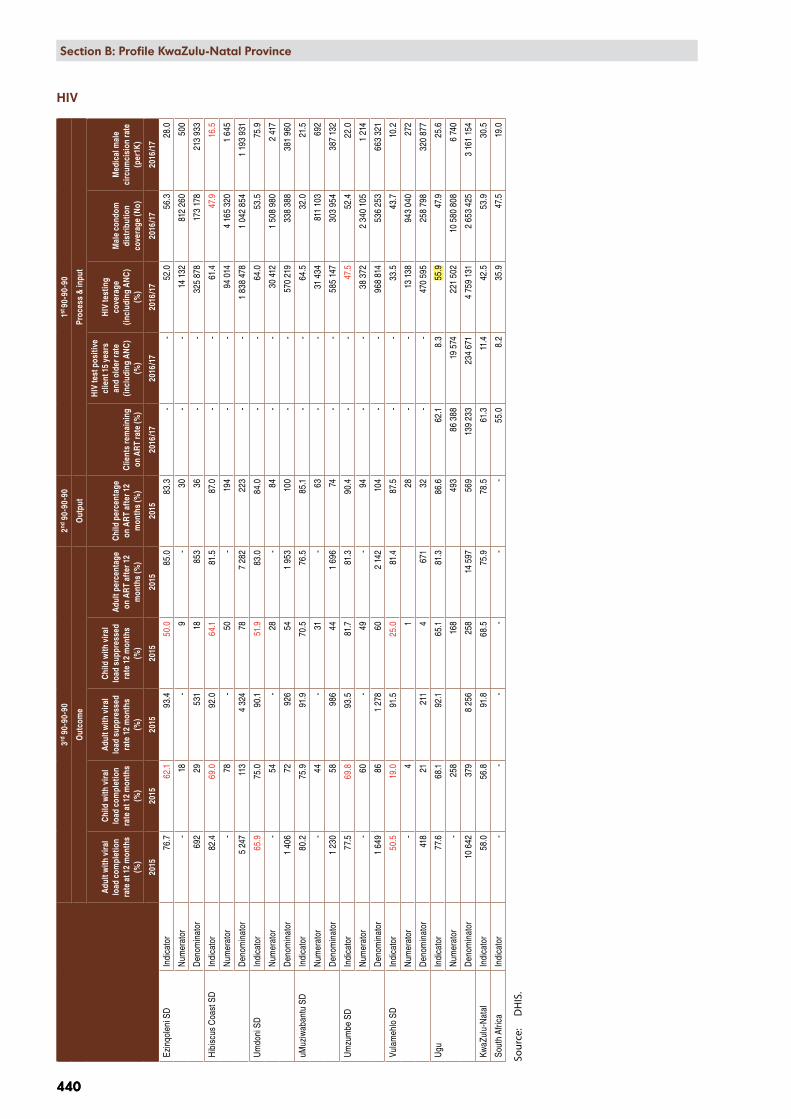
2015
2015
2015
2015
2015
2015
2016
/17
2016
/17
2016
/17
2016
/17
2016
/17
Ezin
qole
ni S
DIn
dica
tor
76.7
62.1
93.4
50.0
85.0
83.3
- -
52.0
56.3
28.0
Num
erat
or -
18 -
9 -
30 -
-14
132
812
260
500
Den
omin
ator
692
2953
118
853
36 -
-32
5 87
817
3 17
821
3 93
3
Hib
iscu
s C
oast
SD
Indi
cato
r82
.469
.092
.064
.181
.587
.0 -
-61
.447
.916
.5
Num
erat
or -
78 -
50 -
194
- -
94 0
144
165
320
1 64
5
Den
omin
ator
5 24
711
34
324
787
282
223
- -
1 83
8 47
81
042
854
1 19
3 93
1
Um
doni
SD
Indi
cato
r65
.975
.090
.151
.983
.084
.0 -
-64
.053
.575
.9
Num
erat
or -
54 -
28 -
84 -
-30
412
1 50
8 98
02
417
Den
omin
ator
1 40
672
926
541
953
100
- -
570
219
338
388
381
960
uMuz
iwab
antu
SD
Indi
cato
r80
.275
.991
.970
.576
.585
.1 -
-64
.532
.021
.5
Num
erat
or -
44 -
31 -
63 -
-31
434
811
103
692
Den
omin
ator
1 23
058
986
441
696
74 -
-58
5 14
730
3 95
438
7 13
2
Um
zum
be S
DIn
dica
tor
77.5
69.8
93.5
81.7
81.3
90.4
- -
47.5
52.4
22.0
Num
erat
or -
60 -
49 -
94 -
-38
372
2 34
0 10
51
214
Den
omin
ator
1 64
986
1 27
860
2 14
210
4 -
-96
8 81
453
6 25
366
3 32
1
Vula
meh
lo S
DIn
dica
tor
50.5
19.0
91.5
25.0
81.4
87.5
- -
33.5
43.7
10.2
Num
erat
or -
4
1
28 -
-13
138
943
040
272
Den
omin
ator
418
2121
14
671
32 -
-47
0 59
525
8 79
832
0 87
7
Ugu
In
dica
tor
77.6
68.1
92.1
65.1
81.3
86.6
62.1
8.3
55.9
47.9
25.6
Num
erat
or -
258
16
8
493
86 3
8819
574
221
502
10 5
80 8
086
740
Den
omin
ator
10 6
4237
98
256
258
14 5
9756
913
9 23
323
4 67
14
759
131
2 65
3 42
53
161
154
KwaZ
ulu-
Nat
alIn
dica
tor
58.0
56.8
91.8
68.5
75.9
78.5
61.3
11.4
42.5
53.9
30.5
Sout
h Af
rica
Indi
cato
r -
- -
- -
- 55
.08.
235
.947
.519
.0
Sour
ce:
DH
IS.
Section B: National and District Profiles
441
Section B: Profile KwaZulu-Natal Province
441
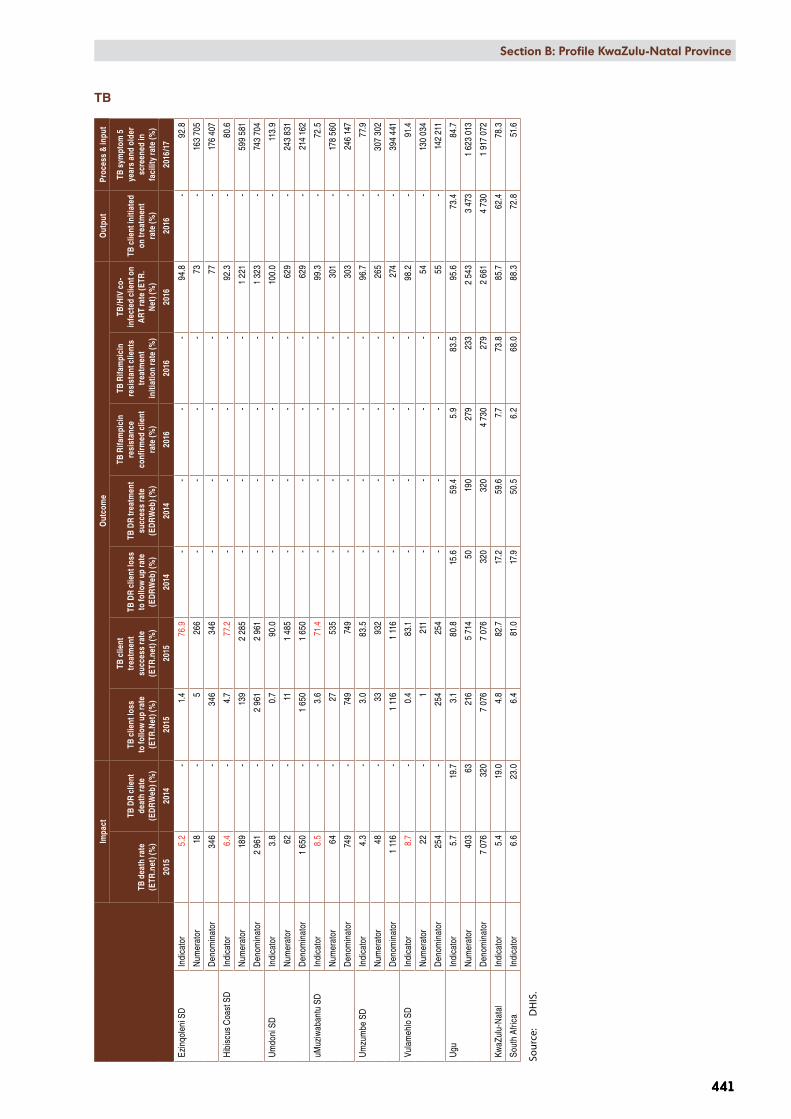
TB
I mpa
ctO
utco
me
Out
put
Proc
ess
& in
put
TB d
eath
rate
(E
TR.n
et) (
%)
TB D
R cl
ient
de
ath
rate
(E
DR
Web
) (%
)
TB c
lient
loss
to
follo
w u
p ra
te
(ETR
.Net
) (%
)
TB c
lient
tr
eatm
ent
succ
ess
rate
(E
TR.n
et) (
%)
TB D
R cl
ient
loss
to
follo
w u
p ra
te
(ED
RW
eb) (
%)
TB D
R tr
eatm
ent
succ
ess
rate
(E
DR
Web
) (%
)
TB R
ifam
pici
n re
sist
ance
co
nfirm
ed c
lient
ra
te (%
)
TB R
ifam
pici
n re
sist
ant c
lient
s tr
eatm
ent
initi
atio
n ra
te (%
)
TB/H
IV c
o-in
fect
ed c
lient
on
AR
T ra
te (E
TR.
Net
) (%
)
TB c
lient
initi
ated
on
trea
tmen
t ra
te (%
)
TB s
ympt
om 5
ye
ars
and
olde
r sc
reen
ed in
fa
cilit
y ra
te (%
)
2015
2014
2015
2015
2014
2014
2016
2016
2016
2016
2016
/17
Ezin
qole
ni S
DIn
dica
tor
5.2
-1.
476
.9 -
- -
-94
.8 -
92.8
Num
erat
or18
-5
266
- -
- -
73 -
163
705
Den
omin
ator
346
-34
634
6 -
- -
-77
-17
6 40
7
Hib
iscu
s C
oast
SD
Indi
cato
r6.
4 -
4.7
77.2
- -
- -
92.3
-80
.6
Num
erat
or18
9 -
139
2 28
5 -
- -
-1
221
-59
9 58
1
Den
omin
ator
2 96
1 -
2 96
12
961
- -
- -
1 32
3 -
743
704
Um
doni
SD
Indi
cato
r3.
8 -
0.7
90.0
- -
- -
100.
0 -
113.
9
Num
erat
or62
-11
1 48
5 -
- -
-62
9 -
243
831
Den
omin
ator
1 65
0 -
1 65
01
650
- -
- -
629
-21
4 16
2
uMuz
iwab
antu
SD
Indi
cato
r8.
5 -
3.6
71.4
- -
- -
99.3
-72
.5
Num
erat
or64
-27
535
- -
- -
301
-17
8 56
0
Den
omin
ator
749
-74
974
9 -
- -
-30
3 -
246
147
Um
zum
be S
DIn
dica
tor
4.3
-3.
083
.5 -
- -
-96
.7 -
77.9
Num
erat
or48
-33
932
- -
- -
265
-30
7 30
2
Den
omin
ator
1 11
6 -
1 11
61
116
- -
- -
274
-39
4 44
1
Vula
meh
lo S
DIn
dica
tor
8.7
-0.
483
.1 -
- -
-98
.2 -
91.4
Num
erat
or22
-1
211
- -
- -
54 -
130
034
Den
omin
ator
254
-25
425
4 -
- -
-55
-14
2 21
1
Ugu
In
dica
tor
5.7
19.7
3.1
80.8
15.6
59.4
5.9
83.5
95.6
73.4
84.7
Num
erat
or40
363
216
5 71
450
190
279
233
2 54
33
473
1 62
3 01
3
Den
omin
ator
7 07
632
07
076
7 07
632
032
04
730
279
2 66
14
730
1 91
7 07
2
KwaZ
ulu-
Nat
alIn
dica
tor
5.4
19.0
4.8
82.7
17.2
59.6
7.7
73.8
85.7
62.4
78.3
Sout
h Af
rica
Indi
cato
r6.
623
.06.
481
.017
.950
.56.
268
.088
.372
.851
.6
Sour
ce:
DH
IS.
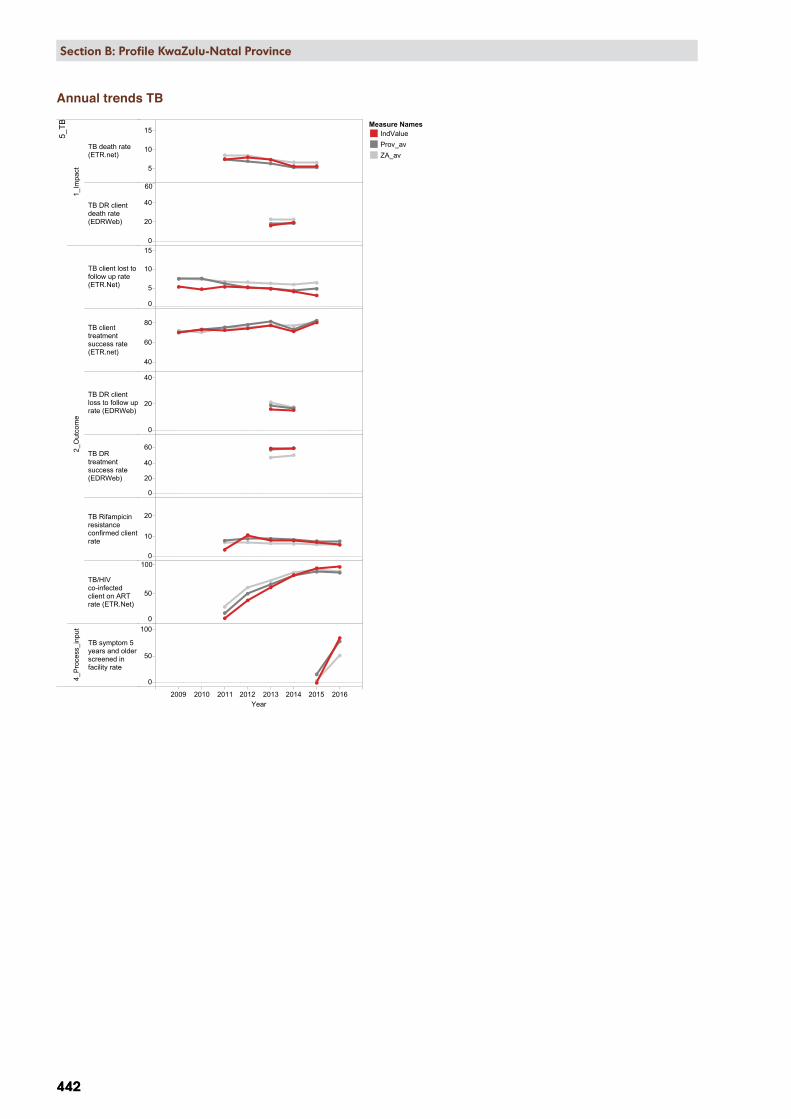
2009 2010 2011 2012 2013 2014 2015 2016Year
5_TB
1_Im
pact
TB death rate(ETR.net)
TB DR clientdeath rate(EDRWeb)
2_O
utco
me
TB client lost tofollow up rate(ETR.Net)
TB clienttreatmentsuccess rate(ETR.net)
TB DR clientloss to follow uprate (EDRWeb)
TB DRtreatmentsuccess rate(EDRWeb)
TB Rifampicinresistanceconfirmed clientrate
TB/HIVco-infectedclient on ARTrate (ETR.Net)
4_P
roce
ss_i
nput
TB symptom 5years and olderscreened infacility rate
5
10
15
0
20
40
60
0
5
10
15
40
60
80
0
20
40
0
20
40
60
0
10
20
0
50
100
0
50
100
KZN, DC21, Ugu District Municipality, SEQ 2 (deprived)
Measure NamesIndValueProv_avZA_av
442
Section B: National and District Profiles
442
Section B: Profile KwaZulu-Natal Province
Annual trends TB

2010 2011 2012 2013 2014 2015 2016 2017Year
6_NCDs
2_Outcome
Diabetesincidence
Hypertensionincidence
0
5
20
40
KZN, DC21, Ugu District Municipality, SEQ 2 (deprived)
Measure NamesIndValueProv_avZA_av
Section B: National and District Profiles
443
Section B: Profile KwaZulu-Natal Province
443
Non-communicable diseases
Outcome
Diabetes incidence
(per1K)
Hypertension incidence
(per1K)
2016/17 2016/17
Ezinqoleni SD Indicator 0.8 13.1
Numerator 47 134
Denominator 666 747 122 316
Hibiscus Coast SD Indicator 3.8 16.3
Numerator 1 025 970
Denominator 3 243 690 715 629
Umdoni SD Indicator 5.3 25.7
Numerator 443 501
Denominator 995 412 233 505
uMuziwabantu SD Indicator 1.8 37.0
Numerator 183 635
Denominator 1 228 329 206 022
Umzumbe SD Indicator 1.6 21.9
Numerator 270 740
Denominator 2 025 225 404 895
Vulamehlo SD Indicator 5.4 8.1
Numerator 436 131
Denominator 974 316 193 287
Ugu Indicator 3.2 19.9
Numerator 2 404 3 111
Denominator 9 133 719 1 875 654
KwaZulu-Natal Indicator 2.8 21.7
South Africa Indicator 2.5 18.9
Source: DHIS.
Annual trends
Sub-district value in red – improvement strategies are urgently needed
Value highlighted in yellow – performance is ranked among the 10 best in the country
Value highlighted in red – performance is ranked among the 10 worst in the country
444
Section B: National and District Profiles
444
Section B: Profile KwaZulu-Natal Province
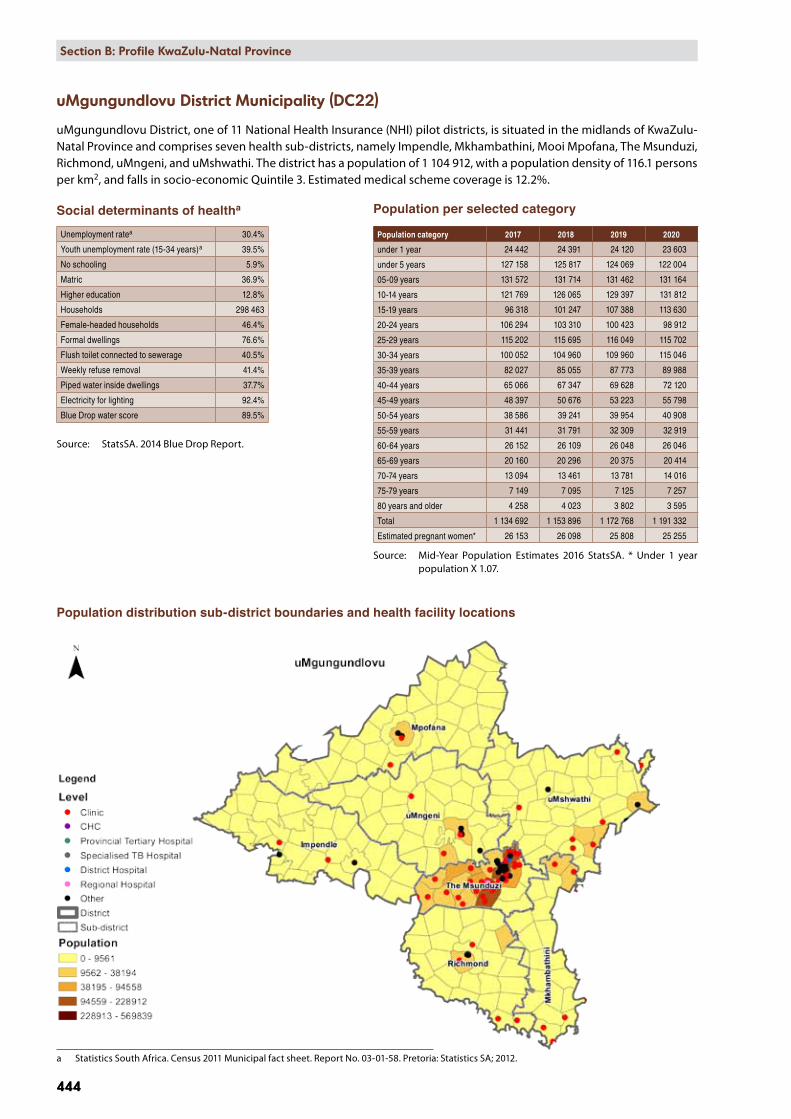
uMgungundlovu District Municipality (DC22)
uMgungundlovu District, one of 11 National Health Insurance (NHI) pilot districts, is situated in the midlands of KwaZulu-Natal Province and comprises seven health sub-districts, namely Impendle, Mkhambathini, Mooi Mpofana, The Msunduzi, Richmond, uMngeni, and uMshwathi. The district has a population of 1 104 912, with a population density of 116.1 persons per km2, and falls in socio-economic Quintile 3. Estimated medical scheme coverage is 12.2%.
Social determinants of healtha
Unemployment ratea 30.4%
Youth unemployment rate (15-34 years)a 39.5%
No schooling 5.9%
Matric 36.9%
Higher education 12.8%
Households 298 463
Female-headed households 46.4%
Formal dwellings 76.6%
Flush toilet connected to sewerage 40.5%
Weekly refuse removal 41.4%
Piped water inside dwellings 37.7%
Electricity for lighting 92.4%
Blue Drop water score 89.5%
Source: StatsSA. 2014 Blue Drop Report.
Population distribution sub-district boundaries and health facility locations
a Statistics South Africa. Census 2011 Municipal fact sheet. Report No. 03-01-58. Pretoria: Statistics SA; 2012.
Population per selected category
Population category 2017 2018 2019 2020
under 1 year 24 442 24 391 24 120 23 603
under 5 years 127 158 125 817 124 069 122 004
05-09 years 131 572 131 714 131 462 131 164
10-14 years 121 769 126 065 129 397 131 812
15-19 years 96 318 101 247 107 388 113 630
20-24 years 106 294 103 310 100 423 98 912
25-29 years 115 202 115 695 116 049 115 702
30-34 years 100 052 104 960 109 960 115 046
35-39 years 82 027 85 055 87 773 89 988
40-44 years 65 066 67 347 69 628 72 120
45-49 years 48 397 50 676 53 223 55 798
50-54 years 38 586 39 241 39 954 40 908
55-59 years 31 441 31 791 32 309 32 919
60-64 years 26 152 26 109 26 048 26 046
65-69 years 20 160 20 296 20 375 20 414
70-74 years 13 094 13 461 13 781 14 016
75-79 years 7 149 7 095 7 125 7 257
80 years and older 4 258 4 023 3 802 3 595
Total 1 134 692 1 153 896 1 172 768 1 191 332
Estimated pregnant women* 26 153 26 098 25 808 25 255
Source: Mid-Year Population Estimates 2016 StatsSA. * Under 1 year population X 1.07.
Section B: National and District Profiles
445
Section B: Profile KwaZulu-Natal Province
445
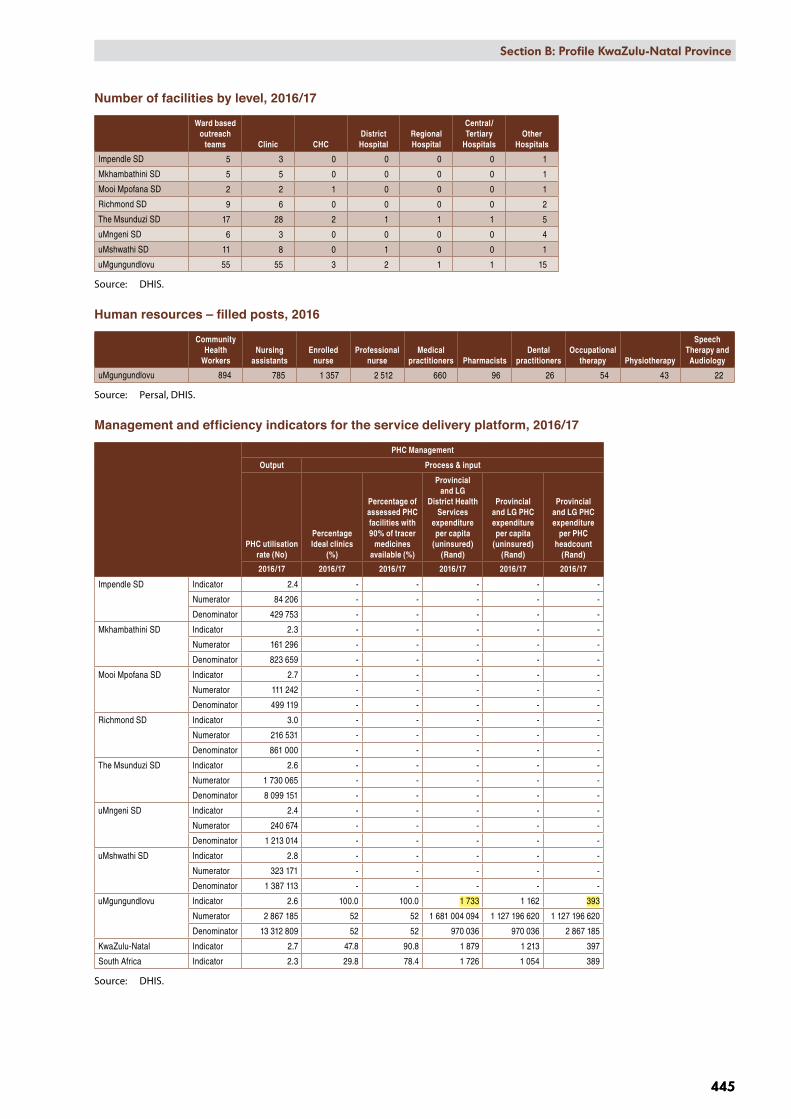
Number of facilities by level, 2016/17
Ward based outreach
teams Clinic CHCDistrict Hospital
Regional Hospital
Central/Tertiary
HospitalsOther
Hospitals
Impendle SD 5 3 0 0 0 0 1
Mkhambathini SD 5 5 0 0 0 0 1
Mooi Mpofana SD 2 2 1 0 0 0 1
Richmond SD 9 6 0 0 0 0 2
The Msunduzi SD 17 28 2 1 1 1 5
uMngeni SD 6 3 0 0 0 0 4
uMshwathi SD 11 8 0 1 0 0 1
uMgungundlovu 55 55 3 2 1 1 15
Source: DHIS.
Human resources – filled posts, 2016
Community Health
WorkersNursing
assistantsEnrolled
nurseProfessional
nurseMedical
practitioners PharmacistsDental
practitionersOccupational
therapy Physiotherapy
Speech Therapy and Audiology
uMgungundlovu 894 785 1 357 2 512 660 96 26 54 43 22
Source: Persal, DHIS.
Management and efficiency indicators for the service delivery platform, 2016/17
PHC Management
Output Process & input
PHC utilisation rate (No)
Percentage Ideal clinics
(%)
Percentage of assessed PHC facilities with 90% of tracer
medicines available (%)
Provincial and LG
District Health Services
expenditure per capita
(uninsured) (Rand)
Provincial and LG PHC expenditure per capita
(uninsured) (Rand)
Provincial and LG PHC expenditure
per PHC headcount
(Rand)
2016/17 2016/17 2016/17 2016/17 2016/17 2016/17
Impendle SD Indicator 2.4 - - - - -
Numerator 84 206 - - - - -
Denominator 429 753 - - - - -
Mkhambathini SD Indicator 2.3 - - - - -
Numerator 161 296 - - - - -
Denominator 823 659 - - - - -
Mooi Mpofana SD Indicator 2.7 - - - - -
Numerator 111 242 - - - - -
Denominator 499 119 - - - - -
Richmond SD Indicator 3.0 - - - - -
Numerator 216 531 - - - - -
Denominator 861 000 - - - - -
The Msunduzi SD Indicator 2.6 - - - - -
Numerator 1 730 065 - - - - -
Denominator 8 099 151 - - - - -
uMngeni SD Indicator 2.4 - - - - -
Numerator 240 674 - - - - -
Denominator 1 213 014 - - - - -
uMshwathi SD Indicator 2.8 - - - - -
Numerator 323 171 - - - - -
Denominator 1 387 113 - - - - -
uMgungundlovu Indicator 2.6 100.0 100.0 1 733 1 162 393
Numerator 2 867 185 52 52 1 681 004 094 1 127 196 620 1 127 196 620
Denominator 13 312 809 52 52 970 036 970 036 2 867 185
KwaZulu-Natal Indicator 2.7 47.8 90.8 1 879 1 213 397
South Africa Indicator 2.3 29.8 78.4 1 726 1 054 389
Source: DHIS.
2008 2010 2012 2014 2016 2018Year
1_M
anag
emen
t
1_Im
pact
Inpatient crudedeath rate
2_O
utco
me
Average lengthof stay (districthospitals)
Expenditure perpatient dayequivalent(districthospitals)
3_O
utpu
t
Inpatient bedutilisation rate(districthospitals)
OPD new clientnot referred rate(districthospitals)
4_P
roce
ss_i
nput
PercentageIdeal clinics
Provincial andLG DistrictHealth Servicesexpenditure percapita(uninsured)
Provincial andLG PHCexpenditure percapita(uninsured)
Provincial andLG PHCexpenditure perPHC headcount
2
4
6
8
2
4
6
8
1K
2K
3K
4K
50
100
0
50
100
0
50
100
1K
2K
3K
500
1000
1500
200
400
KZN, DC22, uMgungundlovu District Municipality, SEQ 3
Measure NamesIndValueProv_avZA_av
Meas ure NamesIndV alue
P rov_av
ZA_av
446
Section B: National and District Profiles
446
Section B: Profile KwaZulu-Natal Province
Hos
pita
l
Dis
tric
t Hos
pita
lR
egio
nal H
ospi
tal
Tert
iary
/Cen
tral
Hos
pita
l
Aver
age
leng
th o
f st
ay -
tota
l (D
ays)
Expe
nditu
re
per p
atie
nt
day
equi
vale
nt
(Ran
d)
Inpa
tient
bed
ut
ilisa
tion
rate
- to
tal
(%)
Inpa
tient
cr
ude
deat
h ra
te (%
)
OPD
new
cl
ient
not
re
ferr
ed ra
te
(%)
Aver
age
leng
th o
f st
ay -
tota
l (D
ays)
Expe
nditu
re
per p
atie
nt
day
equi
vale
nt
(Ran
d)
Inpa
tient
bed
ut
ilisa
tion
rate
- to
tal
(%)
Inpa
tient
cr
ude
deat
h ra
te (%
)
OPD
new
cl
ient
not
re
ferr
ed ra
te
(%)
Aver
age
leng
th o
f st
ay -
tota
l (D
ays)
Expe
nditu
re
per p
atie
nt
day
equi
vale
nt
(Ran
d)
Inpa
tient
bed
ut
ilisa
tion
rate
- to
tal
(%)
Inpa
tient
cr
ude
deat
h ra
te (%
)
OPD
new
cl
ient
not
re
ferr
ed ra
te
(%)
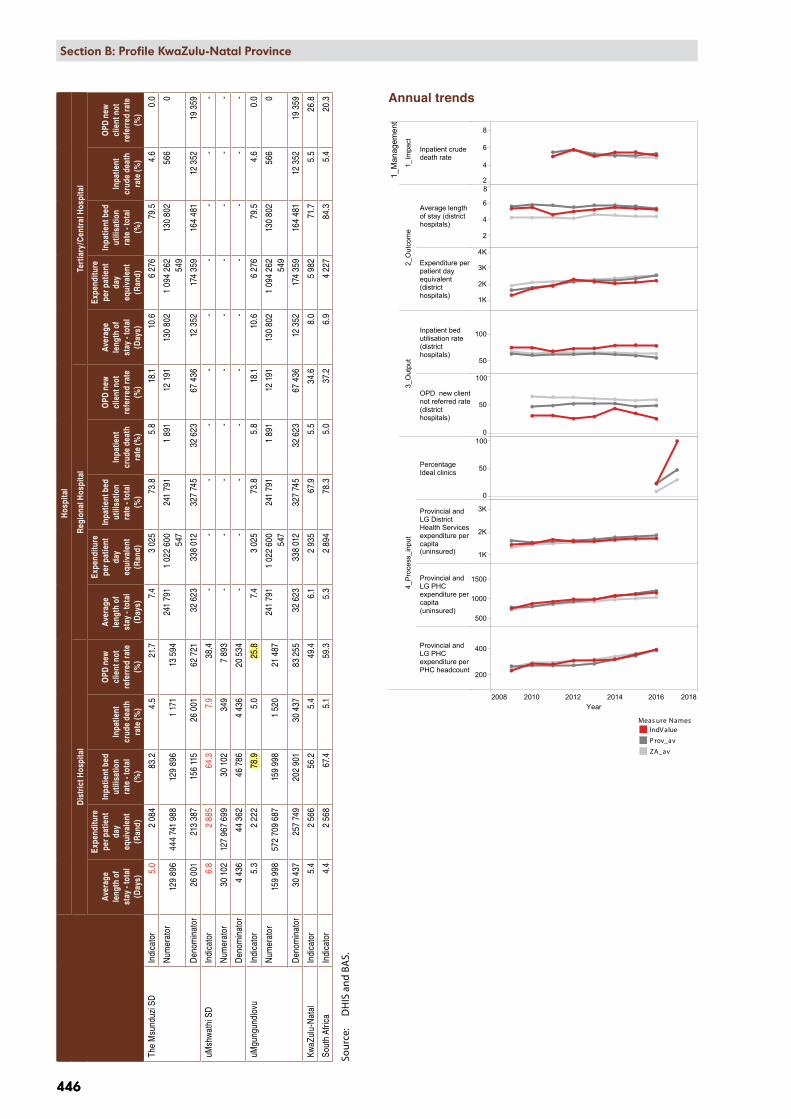
The
Msu
nduz
i SD
Indi
cato
r5.
02
084
83.2
4.5
21.7
7.4
3 02
573
.85.
818
.110
.66
276
79.5
4.6
0.0
Num
erat
or12
9 89
644
4 74
1 98
812
9 89
61
171
13 5
9424
1 79
11
022
600
547
241
791
1 89
112
191
130
802
1 09
4 26
2 54
913
0 80
256
60
Den
omin
ator
26 0
0121
3 38
715
6 11
526
001
62 7
2132
623
338
012
327
745
32 6
2367
436
12 3
5217
4 35
916
4 48
112
352
19 3
59
uMsh
wat
hi S
DIn
dica
tor
6.8
2 88
564
.37.
938
.4 -
- -
- -
- -
- -
-
Num
erat
or30
102
127
967
699
30 1
0234
97
893
- -
- -
- -
- -
- -
Den
omin
ator
4 43
644
362
46 7
864
436
20 5
34 -
- -
- -
- -
- -
-
uMgu
ngun
dlov
u In
dica
tor
5.3
2 22
278
.95.
025
.87.
43
025
73.8
5.8
18.1
10.6
6 27
679
.54.
60.
0
Num
erat
or15
9 99
857
2 70
9 68
715
9 99
81
520
21 4
8724
1 79
11
022
600
547
241
791
1 89
112
191
130
802
1 09
4 26
2 54
913
0 80
256
60
Den
omin
ator
30 4
3725
7 74
920
2 90
130
437
83 2
5532
623
338
012
327
745
32 6
2367
436
12 3
5217
4 35
916
4 48
112
352
19 3
59
KwaZ
ulu-
Nat
alIn
dica
tor
5.4
2 56
656
.25.
449
.46.
12
935
67.9
5.5
34.6
8.0
5 98
271
.75.
526
.8
Sout
h Af
rica
Indi
cato
r4.
42
568
67.4
5.1
59.3
5.3
2 89
478
.35.
037
.26.
94
227
84.3
5.4
20.3
Sour
ce:
DH
IS a
nd B
AS.
Annual trends
Section B: National and District Profiles
447
Section B: Profile KwaZulu-Natal Province
447
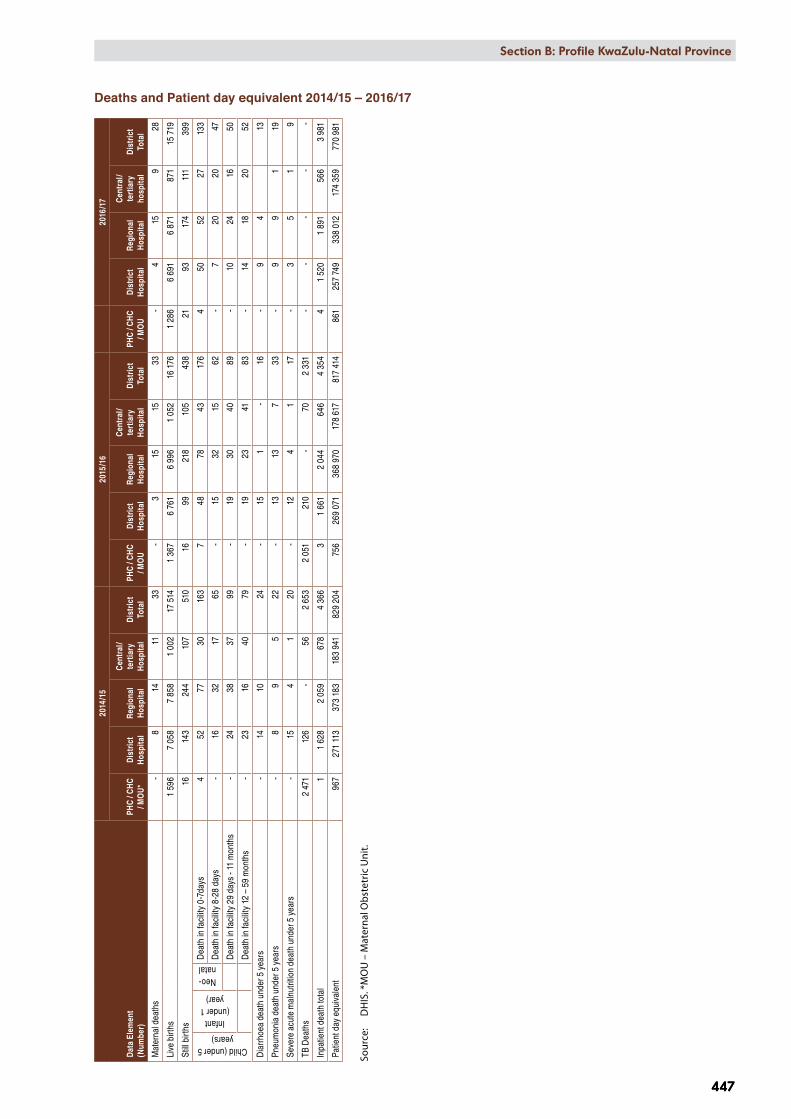
Deaths and Patient day equivalent 2014/15 – 2016/17
Dat
a El
emen
t(N
umbe
r)
2014
/15
2015
/16
2016
/17
PHC
/ CH
C / M
OU
*D
istr
ict
Hos
pita
lR
egio
nal
Hos
pita
l
Cen
tral
/te
rtia
ry
Hos
pita
lD
istr
ict
Tota
lPH
C / C
HC
/ MO
UD
istr
ict
Hos
pita
lR
egio
nal
Hos
pita
l
Cen
tral
/te
rtia
ry
Hos
pita
lD
istr
ict
Tota
lPH
C / C
HC
/ MO
UD
istr
ict
Hos
pita
lR
egio
nal
Hos
pita
l
Cen
tral
/te
rtia
ry
hosp
ital
Dis
tric
t To
tal
Mat
erna
l dea
ths
-8
1411
33-
315
1533
-4
159
28
Live
birt
hs1
596
7 05
87
858
1 00
217
514
1 36
76
761
6 99
61
052
16 1
761
286
6 69
16
871
871
15 7
19
Still
birth
s16
143
244
107
510
1699
218
105
438
2193
174
111
399
Child (under 5 years)
Infant (under 1
year)
Neo-natal
Dea
th in
faci
lity
0-7d
ays
452
7730
163
748
7843
176
450
5227
133
Dea
th in
faci
lity
8-28
day
s -
1632
1765
-15
3215
62-
720
2047
Dea
th in
faci
lity
29 d
ays
- 11
mon
ths
-24
3837
99-
1930
4089
-10
2416
50
Dea
th in
faci
lity
12 –
59
mon
ths
-23
1640
79-
1923
4183
-14
1820
52
Dia
rrho
ea d
eath
und
er 5
yea
rs
-14
1024
-15
1-
16-
94
13
Pneu
mon
ia d
eath
und
er 5
yea
rs-
89
522
-13
137
33-
99
119
Seve
re a
cute
mal
nutri
tion
deat
h un
der 5
yea
rs
-15
41
20-
124
117
-3
51
9
TB D
eath
s 2
471
126
-56
2 65
32
051
210
-70
2 33
1-
--
--
Inpa
tient
dea
th to
tal
11
628
2 05
967
84
366
31
661
2 04
464
64
354
41
520
1 89
156
63
981
Patie
nt d
ay e
quiv
alen
t96
727
1 11
337
3 18
318
3 94
182
9 20
475
626
9 07
136
8 97
017
8 61
781
7 41
486
125
7 74
933
8 01
217
4 35
977
0 98
1
Sour
ce:
DH
IS. *
MO
U –
Mat
erna
l Obs
tetr
ic U
nit.

AgeGroup.. Female Male<5 years
5-1415-2425-64
65+Total 16%
10%15%
21%32%
65%
22%3%
36%46%26%
12%
57%84%
44%18%
23%16%
5%3%5%
16%20%
7%
15%10%13%9%
23%66%
27%6%
37%19%
26%10%
44%81%
35%14%
19%16%
15%4%
15%58%
31%8%
KZN, uMgungundlovu: DC22, 2010 - 2015
Rank.. Female Male
<5 y
ears
12345678910
5-14
12345678910
15-2
4
12345678910
25-6
4
12345678910
65+
12345678910
Other perinatal conditions (4.3%)
Sepsis/other newborn infectious (5.2%)Birth asphyxia (4.8%)
Protein-energy malnutrition (3.6%)
Preterm birth complications (12.4%)
Septicaemia (3.5%)
Diarrhoeal diseases (16.1%)Lower respiratory infections (14.0%)
Tuberculosis (4.3%)
HIV/AIDS (7.8%)
Drowning (3.5%)Epilepsy (3.2%)
Fires, hot substances (6.2%)Meningitis/encephalitis (4.2%)
Interpersonal violence (3.6%)Road injuries (3.8%)
Diarrhoeal diseases (10.6%)Lower respiratory infections (12.4%)
Tuberculosis (9.6%)
HIV/AIDS (19.6%)
Fires, hot substances (1.9%)Endocrine nutritional,blood, immune (2.3%)
Meningitis/encephalitis (3.4%)
Accidental threats to breathing (5.2%)
Interpersonal violence (3.1%)
Nephritis/nephrosis (1.8%)
Diarrhoeal diseases (6.1%)
Lower respiratory infections (4.5%)
Tuberculosis (19.8%)HIV/AIDS (27.4%)
Cervix (2.8%)Nephritis/nephrosis (3.5%)
Hypertensive heart disease (2.2%)
Diabetes mellitus (5.3%)Diarrhoeal diseases (4.9%)
Ischaemic heart disease (3.6%)
Cerebrovascular disease (6.8%)Lower respiratory infections (5.7%)
Tuberculosis (14.5%)HIV/AIDS (21.5%)
Endocrine nutritional,blood, immune (1.6%)COPD (1.7%)
Nephritis/nephrosis (5.8%)Hypertensive heart disease (6.6%)
Diabetes mellitus (10.5%)
Diarrhoeal diseases (3.2%)
Ischaemic heart disease (12.2%)Cerebrovascular disease (21.7%)
Lower respiratory infections (4.5%)
Tuberculosis (2.1%)
Congenital heart anomalies (2.8%)
Other perinatal conditions (4.2%)
Sepsis/other newborn infectious (5.9%)Birth asphyxia (5.3%)
Preterm birth complications (12.9%)
Septicaemia (3.0%)
Diarrhoeal diseases (19.0%)
Lower respiratory infections (11.8%)
Tuberculosis (2.9%)
HIV/AIDS (7.4%)
Other unintentional injuries (2.6%)
Drowning (10.5%)
Fires, hot substances (4.7%)
Meningitis/encephalitis (2.2%)
Accidental threats to breathing (8.2%)
Road injuries (3.1%)
Diarrhoeal diseases (11.4%)
Lower respiratory infections (6.4%)
Tuberculosis (11.9%)HIV/AIDS (16.6%)
Self-inflicted injuries (3.1%)Drowning (2.7%)Fires, hot substances (2.4%)
Mechanical forces (10.4%)Accidental threats to breathing (12.3%)
Interpersonal violence (22.0%)
Road injuries (3.5%)Lower respiratory infections (3.3%)
Tuberculosis (9.6%)HIV/AIDS (9.5%)
Mechanical forces (3.5%)
Accidental threats to breathing (2.5%)
Interpersonal violence (4.4%)
Diabetes mellitus (2.6%)
Diarrhoeal diseases (4.3%)
Ischaemic heart disease (4.5%)Cerebrovascular disease (4.8%)Lower respiratory infections (5.9%)
Tuberculosis (18.4%)HIV/AIDS (18.3%)
Prostate (3.7%)Trachea/bronchi/lung (3.3%)
COPD (3.9%)
Nephritis/nephrosis (4.5%)
Hypertensive heart disease (4.0%)
Diabetes mellitus (6.7%)
Ischaemic heart disease (14.2%)Cerebrovascular disease (13.7%)
Lower respiratory infections (5.5%)
Tuberculosis (4.3%)
Rank.. Maternal conditions All other causes
Fem
ale
15-4
9
12345678910
Maternal sepsis (10.0%) n=20
Abortion (14.0%) n=28
Maternal haemorrhage (8.2%) n=16
Hypertension in pregnancy (13.4%) n=27
Other maternal (20.5%) n=41Indirect maternal (33.9%) n=67
Diabetes mellitus (1.8%) n=213Endocrine nutritional,blood, immune (1.7%) n=197
Cervix (2.1%) n=247Nephritis/nephrosis (2.2%) n=253
Cerebrovascular disease (3.1%) n=357Meningitis/encephalitis (2.3%) n=263
Diarrhoeal diseases (6.0%) n=704Lower respiratory infections (6.4%) n=748
Tuberculosis (19.2%) n=2 234HIV/AIDS (29.3%) n=3 412
Percentage ofdeaths by broad
causes andsingle leading
causes
BroadcauseInjury
NCD
HIV and TB
Comm_mat_peri_nut
Prov, DistrictKZN, uMgungundlovu: DC22
Show history
Percentages are shownaccording to all the deaths
within the age/gendercategory of each box,
although only the leading10 causes are displayed.
448
Section B: National and District Profiles
448
Section B: Profile KwaZulu-Natal Province
Burden of disease profile
For the percentage of deaths by broad cause, deaths are classified into four groups namely: (i) injuries; (ii) non-communicable diseases; (iii) HIV and TB; and (iv) communicable diseases together with maternal perinatal and nutritional conditions. Data are given by gender and age group for the period 2010–2015. The second part of the graph shows the 10 leading single causes of death within each age group (both genders) for 2010–2015 combined.
Percentage of deaths by broad cause and leading causes 2010–2015
2009 2010 2011 2012 2013 2014 2015 2016Year
2_M
ater
nal a
nd w
omen
's h
ealth
1_Im
pact Maternal
mortality infacility ratio
2_O
utco
me
Antenatal 1stvisit before 20weeks rate
Couple yearprotection rate(WHO)
Delivery infacility under 18years rate
Motherpostnatal visitwithin 6 daysrate
3_O
utpu
t
Antenatal clientinitiated on ARTrate
Cervical cancerscreeningcoverage
0
200
400
600
800
20
40
60
80
100
200
5
10
15
0
100
200
50
100
150
200
50
100
150
KZN, DC22, uMgungundlovu District Municipality, SEQ 3
Measure NamesIndValueProv_avZA_av
Section B: National and District Profiles
449
Section B: Profile KwaZulu-Natal Province
449
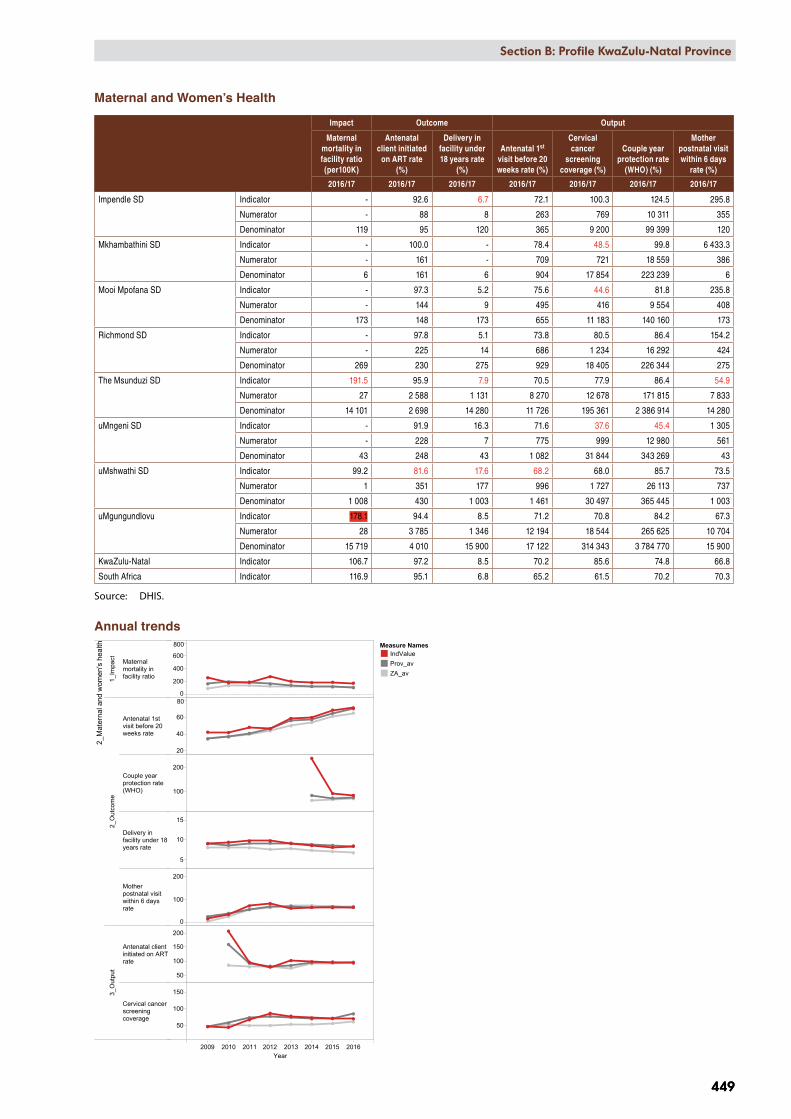
Maternal and Women’s Health
Impact Outcome Output
Maternal mortality in facility ratio (per100K)
Antenatal client initiated
on ART rate (%)
Delivery in facility under 18 years rate
(%)
Antenatal 1st visit before 20 weeks rate (%)
Cervical cancer
screening coverage (%)
Couple year protection rate
(WHO) (%)
Mother postnatal visit within 6 days
rate (%)
2016/17 2016/17 2016/17 2016/17 2016/17 2016/17 2016/17
Impendle SD Indicator - 92.6 6.7 72.1 100.3 124.5 295.8
Numerator - 88 8 263 769 10 311 355
Denominator 119 95 120 365 9 200 99 399 120
Mkhambathini SD Indicator - 100.0 - 78.4 48.5 99.8 6 433.3
Numerator - 161 - 709 721 18 559 386
Denominator 6 161 6 904 17 854 223 239 6
Mooi Mpofana SD Indicator - 97.3 5.2 75.6 44.6 81.8 235.8
Numerator - 144 9 495 416 9 554 408
Denominator 173 148 173 655 11 183 140 160 173
Richmond SD Indicator - 97.8 5.1 73.8 80.5 86.4 154.2
Numerator - 225 14 686 1 234 16 292 424
Denominator 269 230 275 929 18 405 226 344 275
The Msunduzi SD Indicator 191.5 95.9 7.9 70.5 77.9 86.4 54.9
Numerator 27 2 588 1 131 8 270 12 678 171 815 7 833
Denominator 14 101 2 698 14 280 11 726 195 361 2 386 914 14 280
uMngeni SD Indicator - 91.9 16.3 71.6 37.6 45.4 1 305
Numerator - 228 7 775 999 12 980 561
Denominator 43 248 43 1 082 31 844 343 269 43
uMshwathi SD Indicator 99.2 81.6 17.6 68.2 68.0 85.7 73.5
Numerator 1 351 177 996 1 727 26 113 737
Denominator 1 008 430 1 003 1 461 30 497 365 445 1 003
uMgungundlovu Indicator 178.1 94.4 8.5 71.2 70.8 84.2 67.3
Numerator 28 3 785 1 346 12 194 18 544 265 625 10 704
Denominator 15 719 4 010 15 900 17 122 314 343 3 784 770 15 900
KwaZulu-Natal Indicator 106.7 97.2 8.5 70.2 85.6 74.8 66.8
South Africa Indicator 116.9 95.1 6.8 65.2 61.5 70.2 70.3
Source: DHIS.
Annual trends
450
Section B: National and District Profiles
450
Section B: Profile KwaZulu-Natal Province
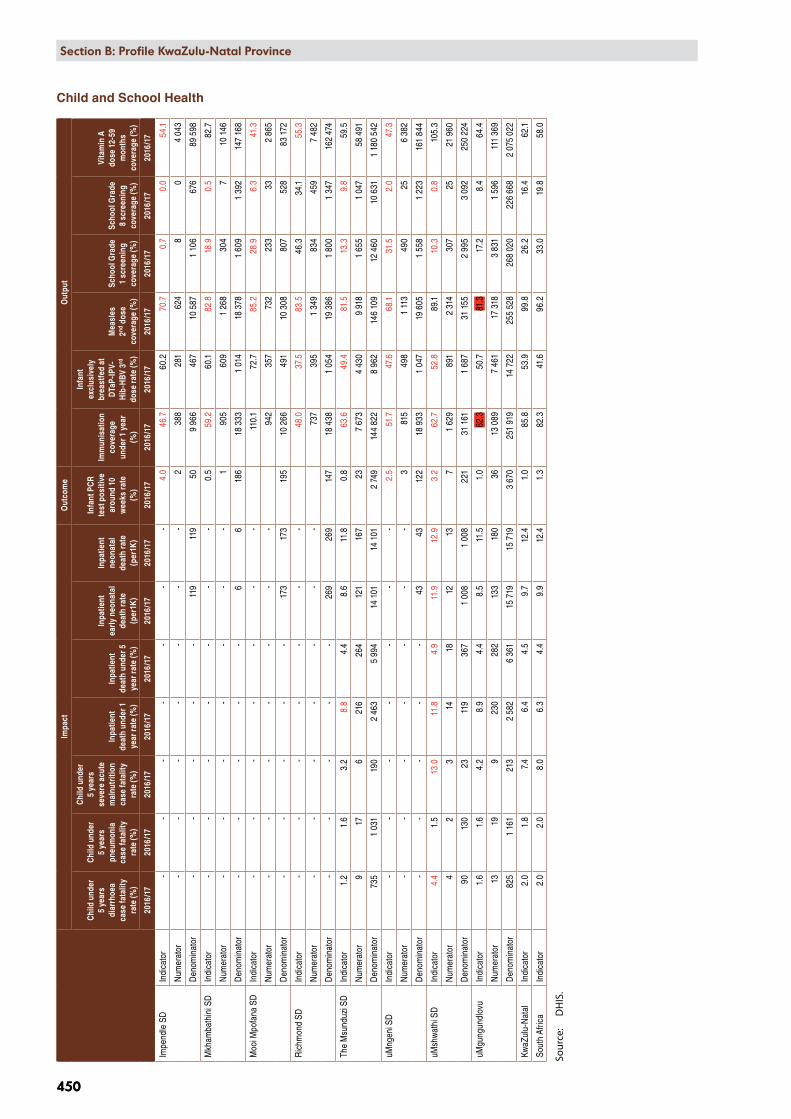
Child and School Health
Im
pact
Out
com
eO
utpu
t
Chi
ld u
nder
5
year
s di
arrh
oea
case
fata
lity
rate
(%)
Chi
ld u
nder
5
year
s pn
eum
onia
ca
se fa
talit
y ra
te (%
)
Chi
ld u
nder
5
year
s se
vere
acu
te
mal
nutr
ition
ca
se fa
talit
y ra
te (%
)
Inpa
tient
de
ath
unde
r 1
year
rate
(%)
Inpa
tient
de
ath
unde
r 5
year
rate
(%)
Inpa
tient
ea
rly n
eona
tal
deat
h ra
te
(per
1K)
Inpa
tient
ne
onat
al
deat
h ra
te
(per
1K)
Infa
nt P
CR
test
pos
itive
ar
ound
10
wee
ks ra
te
(%)
Imm
unis
atio
n co
vera
ge
unde
r 1 y
ear
(%)
Infa
nt
excl
usiv
ely
brea
stfe
d at
D
TaP-
IPV-
Hib
-HB
V 3rd
do
se ra
te (%
)
Mea
sles
2nd
dos
e co
vera
ge (%
)
Scho
ol G
rade
1
scre
enin
g co
vera
ge (%
)
Scho
ol G
rade
8
scre
enin
g co
vera
ge (%
)
Vita
min
A
dose
12-
59
mon
ths
cove
rage
(%)
2016
/17
2016
/17
2016
/17
2016
/17
2016
/17
2016
/17
2016
/17
2016
/17
2016
/17
2016
/17
2016
/17
2016
/17
2016
/17
2016
/17
Impe
ndle
SD
Indi
cato
r -
- -
- -
- -
4.0
46.7
60.2
70.7
0.7
0.0
54.1
Num
erat
or -
- -
- -
- -
238
828
162
48
04
043
Den
omin
ator
- -
- -
-11
911
950
9 96
646
710
587
1 10
667
689
598
Mkh
amba
thin
i SD
Indi
cato
r -
- -
- -
- -
0.5
59.2
60.1
82.8
18.9
0.5
82.7
Num
erat
or -
- -
- -
- -
190
560
91
268
304
710
146
Den
omin
ator
- -
- -
-6
618
618
333
1 01
418
378
1 60
91
392
147
168
Moo
i Mpo
fana
SD
Indi
cato
r -
- -
- -
- -
11
0.1
72.7
85.2
28.9
6.3
41.3
Num
erat
or -
- -
- -
- -
94
235
773
223
333
2 86
5
Den
omin
ator
- -
- -
-17
317
319
510
266
491
10 3
0880
752
883
172
Ric
hmon
d SD
Indi
cato
r -
- -
- -
- -
48
.037
.583
.546
.334
.155
.3
Num
erat
or -
- -
- -
- -
73
739
51
349
834
459
7 48
2
Den
omin
ator
- -
- -
-26
926
914
718
438
1 05
419
386
1 80
01
347
162
474
The
Msu
nduz
i SD
Indi
cato
r1.
21.
63.
28.
84.
48.
611
.80.
863
.649
.481
.513
.39.
859
.5
Num
erat
or9
176
216
264
121
167
237
673
4 43
09
918
1 65
51
047
58 4
91
Den
omin
ator
735
1 03
119
02
463
5 99
414
101
14 1
012
749
144
822
8 96
214
6 10
912
460
10 6
311
180
542
uMng
eni S
DIn
dica
tor
- -
- -
- -
- 2.
551
.747
.668
.131
.52.
047
.3
Num
erat
or -
- -
- -
- -
381
549
81
113
490
256
382
Den
omin
ator
- -
- -
-43
4312
218
933
1 04
719
605
1 55
81
223
161
844
uMsh
wat
hi S
DIn
dica
tor
4.4
1.5
13.0
11.8
4.9
11.9
12.9
3.2
62.7
52.8
89.1
10.3
0.8
105.
3
Num
erat
or4
23
1418
1213
71
629
891
2 31
430
725
21 9
60
Den
omin
ator
9013
023
119
367
1 00
81
008
221
31 1
611
687
31 1
552
995
3 09
225
0 22
4
uMgu
ngun
dlov
u In
dica
tor
1.6
1.6
4.2
8.9
4.4
8.5
11.5
1.0
62.3
50.7
81.3
17.2
8.4
64.4
Num
erat
or13
199
230
282
133
180
3613
089
7 46
117
318
3 83
11
596
111
369
Den
omin
ator
825
1 16
121
32
582
6 36
115
719
15 7
193
670
251
919
14 7
2225
5 52
826
8 02
022
6 66
82
075
022
KwaZ
ulu-
Nat
alIn
dica
tor
2.0
1.8
7.4
6.4
4.5
9.7
12.4
1.0
85.8
53.9
99.8
26.2
16.4
62.1
Sout
h Af
rica
Indi
cato
r2.
02.
08.
06.
34.
49.
912
.41.
382
.341
.696
.233
.019
.858
.0
Sour
ce:
DH
IS.
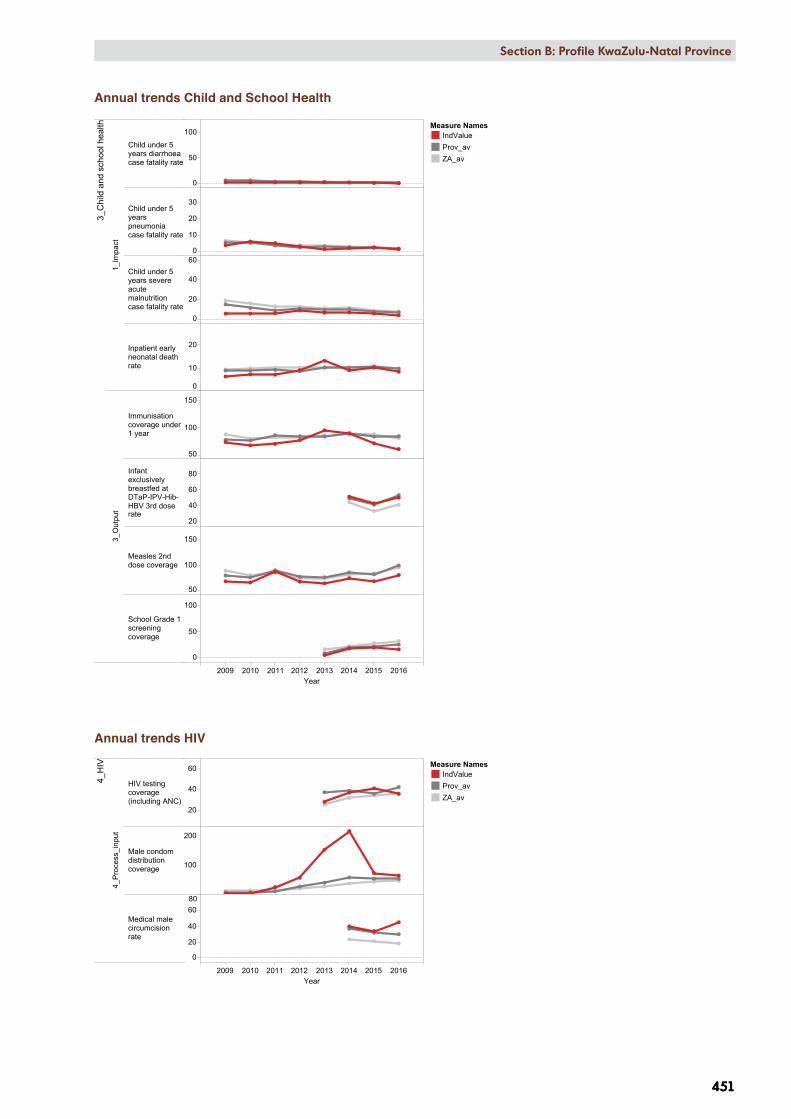
2009 2010 2011 2012 2013 2014 2015 2016Year
3_C
hild
and
sch
ool h
ealth
1_Im
pact
Child under 5years diarrhoeacase fatality rate
Child under 5yearspneumoniacase fatality rate
Child under 5years severeacutemalnutritioncase fatality rate
Inpatient earlyneonatal deathrate
3_O
utpu
t
Immunisationcoverage under1 year
Infantexclusivelybreastfed atDTaP-IPV-Hib-HBV 3rd doserate
Measles 2nddose coverage
School Grade 1screeningcoverage
0
50
100
0
10
20
30
0
20
40
60
0
10
20
50
100
150
20
40
60
80
50
100
150
0
50
100
KZN, DC22, uMgungundlovu District Municipality, SEQ 3
Measure NamesIndValueProv_avZA_av
2009 2010 2011 2012 2013 2014 2015 2016Year
4_H
IV
4_P
roce
ss_i
nput
HIV testingcoverage(including ANC)
Male condomdistributioncoverage
Medical malecircumcisionrate
20
40
60
100
200
0
20
40
6080
KZN, DC22, uMgungundlovu District Municipality, SEQ 3
Measure NamesIndValueProv_avZA_av
Section B: National and District Profiles
451
Section B: Profile KwaZulu-Natal Province
451
Annual trends Child and School Health
Annual trends HIV
452
Section B: National and District Profiles
452
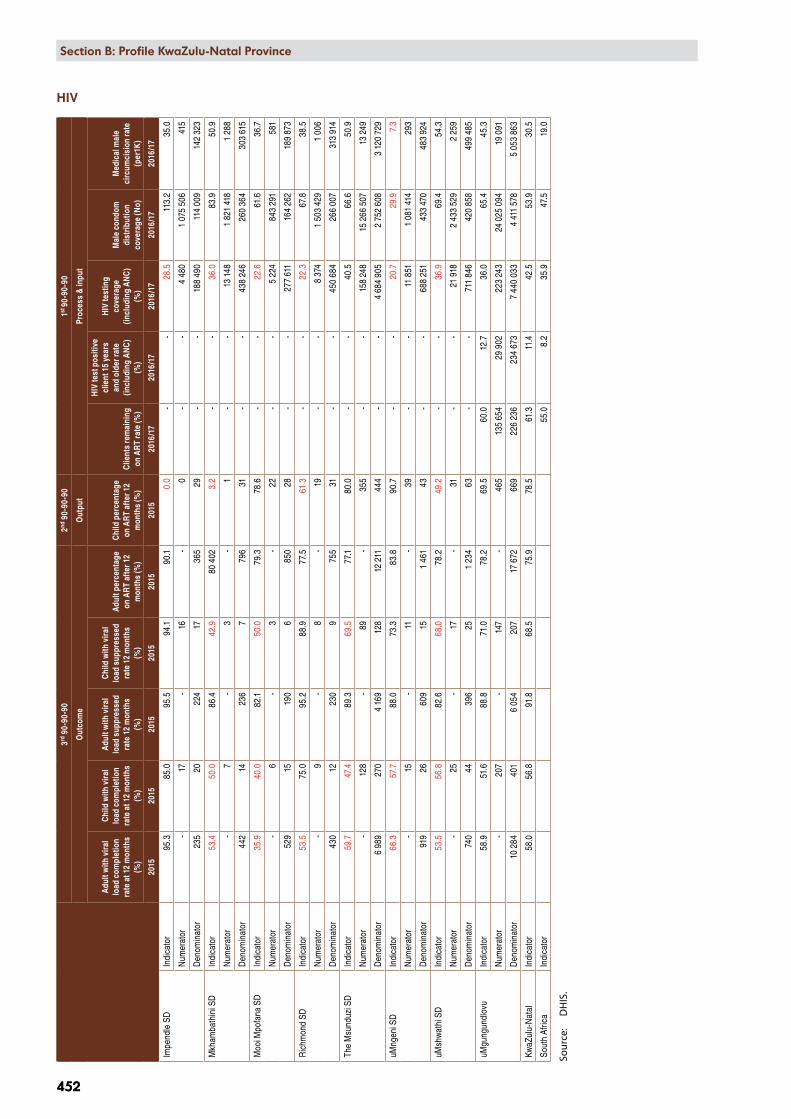
Section B: Profile KwaZulu-Natal Province
3rd 9
0-90
-90
2nd 9
0-90
-90
1st 90
-90-
90
Out
com
eO
utpu
tPr
oces
s &
inpu
t
Adu
lt w
ith v
iral
load
com
plet
ion
rate
at 1
2 m
onth
s (%
)
Chi
ld w
ith v
iral
load
com
plet
ion
rate
at 1
2 m
onth
s (%
)
Adu
lt w
ith v
iral
load
sup
pres
sed
rate
12
mon
ths
(%)
Chi
ld w
ith v
iral
load
sup
pres
sed
rate
12
mon
ths
(%)
Adu
lt pe
rcen
tage
on
AR
T af
ter 1
2 m
onth
s (%
)
Chi
ld p
erce
ntag
e on
AR
T af
ter 1
2 m
onth
s (%
)C
lient
s re
mai
ning
on
AR
T ra
te (%
)
HIV
test
pos
itive
cl
ient
15
year
s an
d ol
der r
ate
(incl
udin
g A
NC
) (%
)
HIV
test
ing
cove
rage
(in
clud
ing
AN
C)
(%)
Mal
e co
ndom
di
strib
utio
n co
vera
ge (N
o)
Med
ical
mal
e ci
rcum
cisi
on ra
te
(per
1K)
2015
2015
2015
2015
2015
2015
2016
/17
2016
/17
2016
/17
2016
/17
2016
/17
Impe
ndle
SD
Indi
cato
r95
.385
.095
.594
.190
.10.
0 -
-28
.511
3.2
35.0
Num
erat
or -
17 -
16 -
0 -
-4
480
1 07
5 50
641
5
Den
omin
ator
235
2022
417
365
29 -
-18
8 49
011
4 00
914
2 32
3
Mkh
amba
thin
i SD
Indi
cato
r53
.450
.086
.442
.980
402
3.2
- -
36.0
83.9
50.9
Num
erat
or -
7 -
3 -
1 -
-13
148
1 82
1 41
81
288
Den
omin
ator
442
1423
67
796
31 -
-43
8 24
626
0 36
430
3 61
5
Moo
i Mpo
fana
SD
Indi
cato
r35
.940
.082
.150
.079
.378
.6 -
-22
.661
.636
.7
Num
erat
or -
6 -
3 -
22 -
-5
224
843
291
581
Den
omin
ator
529
1519
06
850
28 -
-27
7 61
116
4 26
218
9 87
3
Ric
hmon
d SD
Indi
cato
r53
.575
.095
.288
.977
.561
.3 -
-22
.367
.838
.5
Num
erat
or -
9 -
8 -
19 -
-8
374
1 50
3 42
91
006
Den
omin
ator
430
1223
09
755
31 -
-45
0 68
426
6 00
731
3 91
4
The
Msu
nduz
i SD
Indi
cato
r59
.747
.489
.369
.577
.180
.0 -
-40
.566
.650
.9
Num
erat
or -
128
-89
-35
5 -
-15
8 24
815
266
507
13 2
49
Den
omin
ator
6 98
927
04
169
128
12 2
1144
4 -
-4
684
905
2 75
2 60
83
120
729
uMng
eni S
DIn
dica
tor
66.3
57.7
88.0
73.3
83.8
90.7
- -
20.7
29.9
7.3
Num
erat
or -
15 -
11 -
39 -
-11
851
1 08
1 41
429
3
Den
omin
ator
919
2660
915
1 46
143
- -
688
251
433
470
483
924
uMsh
wat
hi S
DIn
dica
tor
53.5
56.8
82.6
68.0
78.2
49.2
- -
36.9
69.4
54.3
Num
erat
or -
25 -
17 -
31 -
-21
918
2 43
3 52
92
259
Den
omin
ator
740
4439
625
1 23
463
- -
711
846
420
858
499
485
uMgu
ngun
dlov
u In
dica
tor
58.9
51.6
88.8
71.0
78.2
69.5
60.0
12.7
36.0
65.4
45.3
Num
erat
or -
207
-14
7 -
465
135
654
29 9
0222
3 24
324
025
094
19 0
91
Den
omin
ator
10 2
8440
16
054
207
17 6
7266
922
6 23
623
4 67
37
440
033
4 41
1 57
85
053
863
KwaZ
ulu-
Nat
alIn
dica
tor
58.0
56.8
91.8
68.5
75.9
78.5
61.3
11.4
42.5
53.9
30.5
Sout
h Af
rica
Indi
cato
r
55
.08.
235
.947
.519
.0
Sour
ce:
DH
IS.
HIV

Section B: National and District Profiles
453
Section B: Profile KwaZulu-Natal Province
453
TB
I mpa
ctO
utco
me
Out
put
Proc
ess
& in
put
TB d
eath
rate
(E
TR.n
et) (
%)
TB D
R cl
ient
de
ath
rate
(E
DR
Web
) (%
)
TB c
lient
loss
to
follo
w u
p ra
te
(ETR
.Net
) (%
)
TB c
lient
tr
eatm
ent
succ
ess
rate
(E
TR.n
et) (
%)
TB D
R cl
ient
loss
to
follo
w u
p ra
te
(ED
RW
eb) (
%)
TB D
R tr
eatm
ent
succ
ess
rate
(E
DR
Web
) (%
)
TB R
ifam
pici
n re
sist
ance
co
nfirm
ed c
lient
ra
te (%
)
TB R
ifam
pici
n re
sist
ant c
lient
s tr
eatm
ent
initi
atio
n ra
te (%
)
TB/H
IV c
o-in
fect
ed c
lient
on
AR
T ra
te (E
TR.
Net
) (%
)
TB c
lient
initi
ated
on
trea
tmen
t ra
te (%
)
TB s
ympt
om 5
ye
ars
and
olde
r sc
reen
ed in
fa
cilit
y ra
te (%
)
2015
2014
2015
2015
2014
2014
2016
2016
2016
2016
2016
/17
Impe
ndle
SD
Indi
cato
r2.
8 -
0.0
97.2
- -
- -
100.
0 -
93.6
Num
erat
or3
-0
105
- -
- -
43 -
64 9
64
Den
omin
ator
108
-10
810
8 -
- -
-43
-69
422
Mkh
amba
thin
i SD
Indi
cato
r6.
5 -
1.6
91.9
- -
- -
100.
0 -
57.5
Num
erat
or16
-4
227
- -
- -
52 -
75 3
38
Den
omin
ator
247
-24
724
7 -
- -
-52
-13
0 96
5
Moo
i Mpo
fana
SD
Indi
cato
r7.
3 -
5.6
87.0
- -
- -
100.
0 -
64.1
Num
erat
or13
-10
154
- -
- -
52 -
60 7
26
Den
omin
ator
177
-17
717
7 -
- -
-52
-94
789
Ric
hmon
d SD
Indi
cato
r18
.5 -
0.5
79.0
- -
- -
100.
0 -
55.1
Num
erat
or81
-2
346
- -
- -
123
-10
2 02
0
Den
omin
ator
438
-43
843
8 -
- -
-12
3 -
185
223
The
Msu
nduz
i SD
Indi
cato
r4.
6 -
6.6
85.8
- -
- -
99.8
-93
.4
Num
erat
or24
4 -
347
4 51
2 -
- -
-2
327
-1
397
423
Den
omin
ator
5 26
0 -
5 26
05
260
- -
- -
2 33
1 -
1 49
6 84
6
uMng
eni S
DIn
dica
tor
4.1
-0.
594
.7 -
- -
-10
0.0
-67
.1
Num
erat
or27
-3
622
- -
- -
184
-14
0 97
9
Den
omin
ator
657
-65
765
7 -
- -
-18
4 -
210
101
uMsh
wat
hi S
DIn
dica
tor
5.2
-0.
692
.9 -
- -
-10
0.0
-80
.9
Num
erat
or28
-3
501
- -
- -
182
-20
2 46
6
Den
omin
ator
539
-53
953
9 -
- -
-18
2 -
250
158
uMgu
ngun
dlov
u In
dica
tor
5.5
23.5
5.0
87.1
13.5
58.2
6.5
69.5
99.9
70.3
83.9
Num
erat
or41
273
369
6 46
742
181
357
248
2 96
33
854
2 04
3 91
6
Den
omin
ator
7 42
631
17
426
7 42
631
131
15
479
357
2 96
75
479
2 43
7 50
4
KwaZ
ulu-
Nat
alIn
dica
tor
5.4
19.0
4.8
82.7
17.2
59.6
7.7
73.8
85.7
62.4
78.3
Sout
h Af
rica
Indi
cato
r6.
623
.06.
481
.017
.950
.56.
268
.088
.372
.851
.6
Sour
ce:
DH
IS.
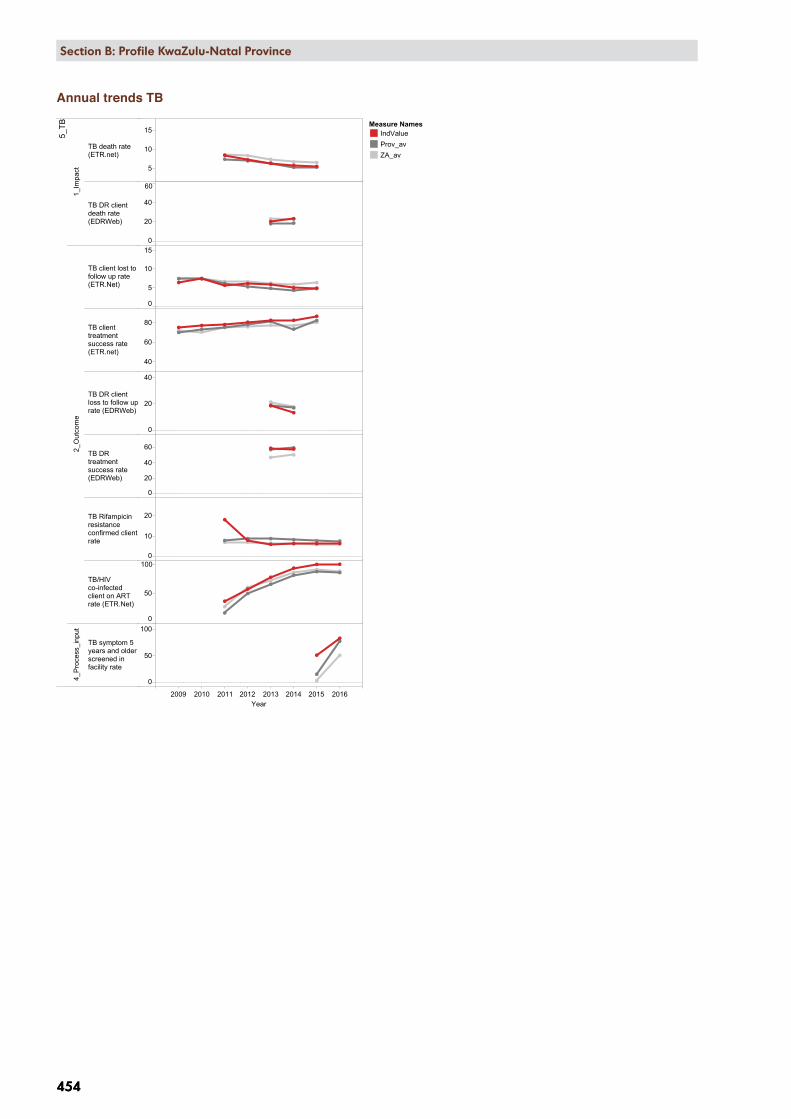
2009 2010 2011 2012 2013 2014 2015 2016Year
5_TB
1_Im
pact
TB death rate(ETR.net)
TB DR clientdeath rate(EDRWeb)
2_O
utco
me
TB client lost tofollow up rate(ETR.Net)
TB clienttreatmentsuccess rate(ETR.net)
TB DR clientloss to follow uprate (EDRWeb)
TB DRtreatmentsuccess rate(EDRWeb)
TB Rifampicinresistanceconfirmed clientrate
TB/HIVco-infectedclient on ARTrate (ETR.Net)
4_P
roce
ss_i
nput
TB symptom 5years and olderscreened infacility rate
5
10
15
0
20
40
60
0
5
10
15
40
60
80
0
20
40
0
20
40
60
0
10
20
0
50
100
0
50
100
KZN, DC22, uMgungundlovu District Municipality, SEQ 3
Measure NamesIndValueProv_avZA_av
454
Section B: National and District Profiles
454
Section B: Profile KwaZulu-Natal Province
Annual trends TB

2010 2011 2012 2013 2014 2015 2016 2017Year
6_NCDs
2_Outcome
Diabetesincidence
Hypertensionincidence
0
5
20
40
KZN, DC22, uMgungundlovu District Municipality, SEQ 3
Measure NamesIndValueProv_avZA_av
Section B: National and District Profiles
455
Section B: Profile KwaZulu-Natal Province
455
Non-communicable diseases
Outcome
Diabetes incidence
(per1K)
Hypertension incidence
(per1K)
2016/17 2016/17
Impendle SD Indicator 3.2 44.5
Numerator 115 405
Denominator 429 753 109 242
Mkhambathini SD Indicator 9.1 16.4
Numerator 624 276
Denominator 823 659 201 681
Mooi Mpofana SD Indicator 1.5 14.2
Numerator 64 145
Denominator 499 119 122 961
Richmond SD Indicator 29.2 42.3
Numerator 2 097 716
Denominator 861 000 203 304
The Msunduzi SD Indicator 8.2 26.4
Numerator 5 562 4 749
Denominator 8 099 151 2 161 194
uMngeni SD Indicator 0.6 11.7
Numerator 56 362
Denominator 1 213 014 372 021
uMshwathi SD Indicator 6.2 16.9
Numerator 716 486
Denominator 1 387 113 344 835
uMgungundlovu Indicator 8.3 24.4
Numerator 9 234 7 139
Denominator 13 312 809 3 515 238
KwaZulu-Natal Indicator 2.8 21.7
South Africa Indicator 2.5 18.9
Source: DHIS.
Annual trends
Sub-district value in red – improvement strategies are urgently needed
Value highlighted in yellow – performance is ranked among the 10 best in the country
Value highlighted in red – performance is ranked among the 10 worst in the country
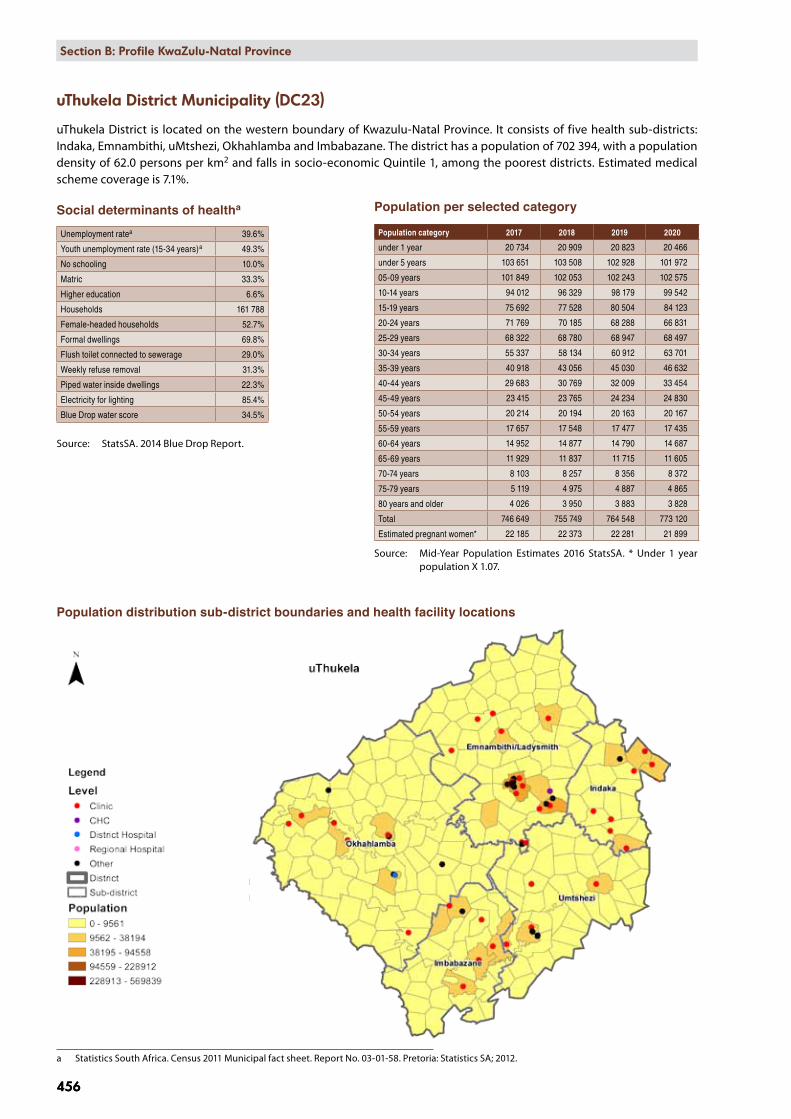
456
Section B: National and District Profiles
456
Section B: Profile KwaZulu-Natal Province
uThukela District Municipality (DC23)
uThukela District is located on the western boundary of Kwazulu-Natal Province. It consists of five health sub-districts: Indaka, Emnambithi, uMtshezi, Okhahlamba and Imbabazane. The district has a population of 702 394, with a population density of 62.0 persons per km2 and falls in socio-economic Quintile 1, among the poorest districts. Estimated medical scheme coverage is 7.1%.
Social determinants of healtha
Unemployment ratea 39.6%
Youth unemployment rate (15-34 years)a 49.3%
No schooling 10.0%
Matric 33.3%
Higher education 6.6%
Households 161 788
Female-headed households 52.7%
Formal dwellings 69.8%
Flush toilet connected to sewerage 29.0%
Weekly refuse removal 31.3%
Piped water inside dwellings 22.3%
Electricity for lighting 85.4%
Blue Drop water score 34.5%
Source: StatsSA. 2014 Blue Drop Report.
Population distribution sub-district boundaries and health facility locations
a Statistics South Africa. Census 2011 Municipal fact sheet. Report No. 03-01-58. Pretoria: Statistics SA; 2012.
Population per selected category
Population category 2017 2018 2019 2020
under 1 year 20 734 20 909 20 823 20 466
under 5 years 103 651 103 508 102 928 101 972
05-09 years 101 849 102 053 102 243 102 575
10-14 years 94 012 96 329 98 179 99 542
15-19 years 75 692 77 528 80 504 84 123
20-24 years 71 769 70 185 68 288 66 831
25-29 years 68 322 68 780 68 947 68 497
30-34 years 55 337 58 134 60 912 63 701
35-39 years 40 918 43 056 45 030 46 632
40-44 years 29 683 30 769 32 009 33 454
45-49 years 23 415 23 765 24 234 24 830
50-54 years 20 214 20 194 20 163 20 167
55-59 years 17 657 17 548 17 477 17 435
60-64 years 14 952 14 877 14 790 14 687
65-69 years 11 929 11 837 11 715 11 605
70-74 years 8 103 8 257 8 356 8 372
75-79 years 5 119 4 975 4 887 4 865
80 years and older 4 026 3 950 3 883 3 828
Total 746 649 755 749 764 548 773 120
Estimated pregnant women* 22 185 22 373 22 281 21 899
Source: Mid-Year Population Estimates 2016 StatsSA. * Under 1 year population X 1.07.
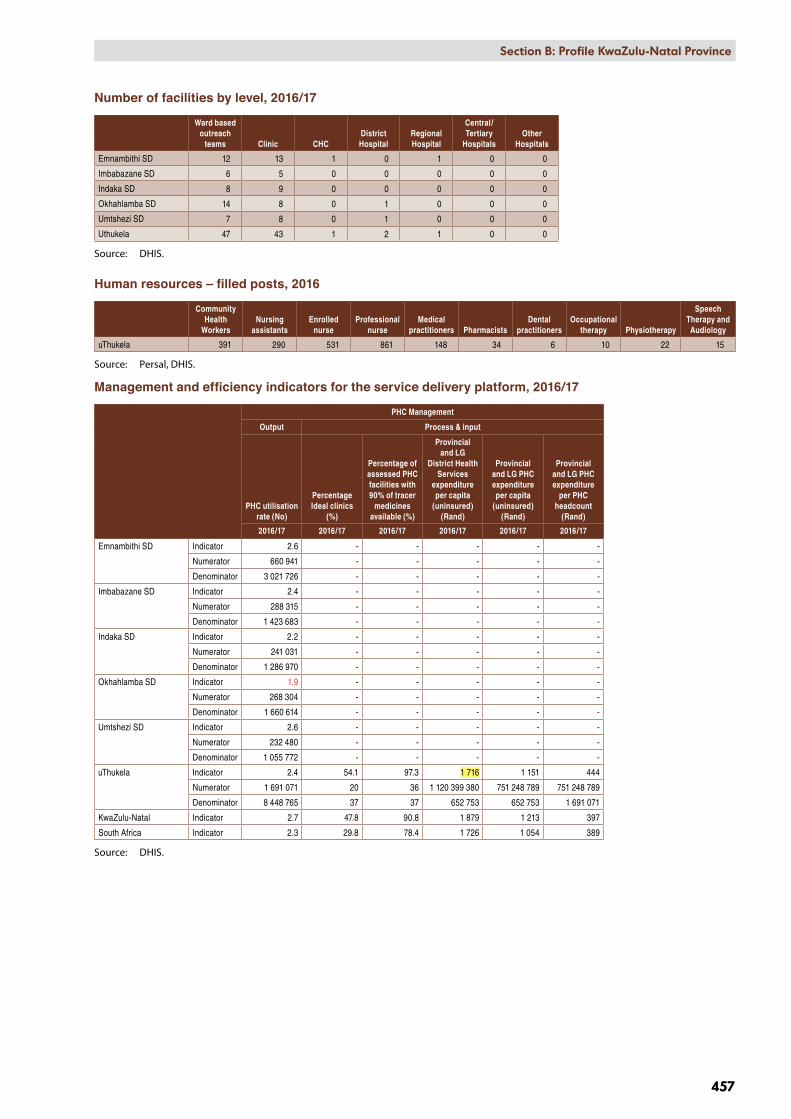
Section B: National and District Profiles
457
Section B: Profile KwaZulu-Natal Province
457
Number of facilities by level, 2016/17
Ward based outreach
teams Clinic CHCDistrict Hospital
Regional Hospital
Central/Tertiary
HospitalsOther
Hospitals
Emnambithi SD 12 13 1 0 1 0 0
Imbabazane SD 6 5 0 0 0 0 0
Indaka SD 8 9 0 0 0 0 0
Okhahlamba SD 14 8 0 1 0 0 0
Umtshezi SD 7 8 0 1 0 0 0
Uthukela 47 43 1 2 1 0 0
Source: DHIS.
Human resources – filled posts, 2016
Community Health
WorkersNursing
assistantsEnrolled
nurseProfessional
nurseMedical
practitioners PharmacistsDental
practitionersOccupational
therapy Physiotherapy
Speech Therapy and Audiology
uThukela 391 290 531 861 148 34 6 10 22 15
Source: Persal, DHIS.
Management and efficiency indicators for the service delivery platform, 2016/17
PHC Management
Output Process & input
PHC utilisation rate (No)
Percentage Ideal clinics
(%)
Percentage of assessed PHC facilities with 90% of tracer
medicines available (%)
Provincial and LG
District Health Services
expenditure per capita
(uninsured) (Rand)
Provincial and LG PHC expenditure per capita
(uninsured) (Rand)
Provincial and LG PHC expenditure
per PHC headcount
(Rand)
2016/17 2016/17 2016/17 2016/17 2016/17 2016/17
Emnambithi SD Indicator 2.6 - - - - -
Numerator 660 941 - - - - -
Denominator 3 021 726 - - - - -
Imbabazane SD Indicator 2.4 - - - - -
Numerator 288 315 - - - - -
Denominator 1 423 683 - - - - -
Indaka SD Indicator 2.2 - - - - -
Numerator 241 031 - - - - -
Denominator 1 286 970 - - - - -
Okhahlamba SD Indicator 1.9 - - - - -
Numerator 268 304 - - - - -
Denominator 1 660 614 - - - - -
Umtshezi SD Indicator 2.6 - - - - -
Numerator 232 480 - - - - -
Denominator 1 055 772 - - - - -
uThukela Indicator 2.4 54.1 97.3 1 716 1 151 444
Numerator 1 691 071 20 36 1 120 399 380 751 248 789 751 248 789
Denominator 8 448 765 37 37 652 753 652 753 1 691 071
KwaZulu-Natal Indicator 2.7 47.8 90.8 1 879 1 213 397
South Africa Indicator 2.3 29.8 78.4 1 726 1 054 389
Source: DHIS.
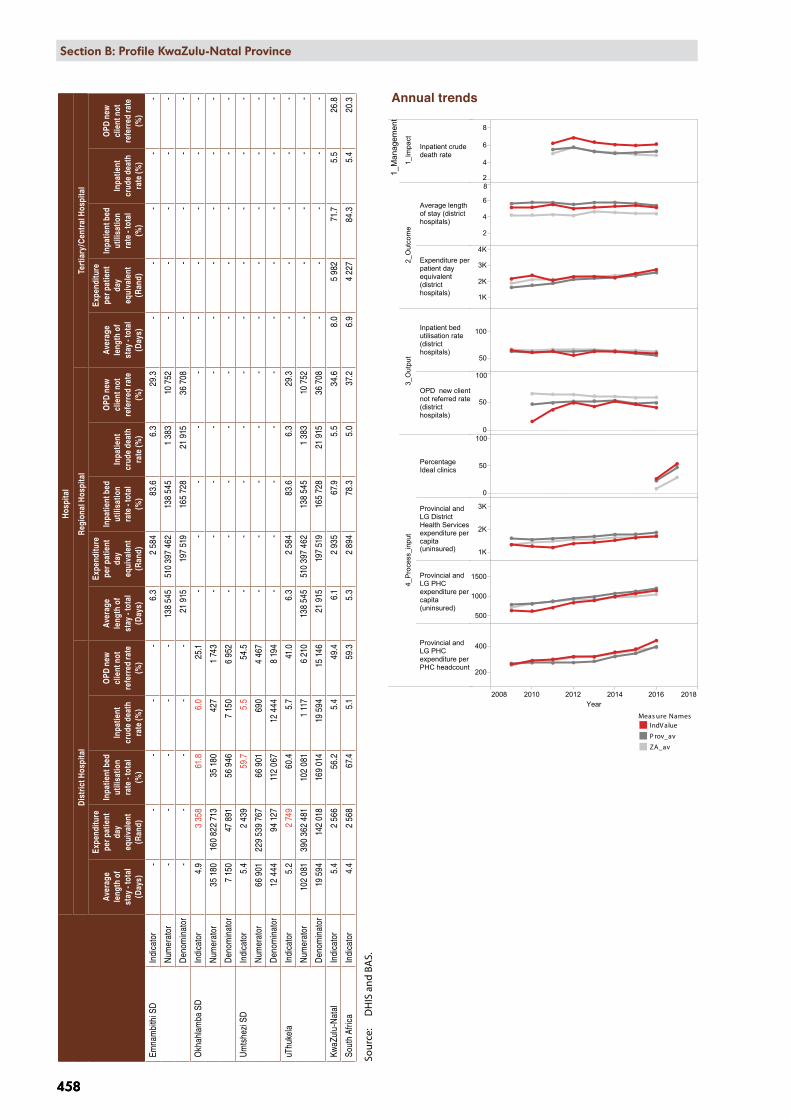
2008 2010 2012 2014 2016 2018Year
1_M
anag
emen
t
1_Im
pact
Inpatient crudedeath rate
2_O
utco
me
Average lengthof stay (districthospitals)
Expenditure perpatient dayequivalent(districthospitals)
3_O
utpu
t
Inpatient bedutilisation rate(districthospitals)
OPD new clientnot referred rate(districthospitals)
4_P
roce
ss_i
nput
PercentageIdeal clinics
Provincial andLG DistrictHealth Servicesexpenditure percapita(uninsured)
Provincial andLG PHCexpenditure percapita(uninsured)
Provincial andLG PHCexpenditure perPHC headcount
2
4
6
8
2
4
6
8
1K
2K
3K
4K
50
100
0
50
100
0
50
100
1K
2K
3K
500
1000
1500
200
400
KZN, DC23, uThukela District Municipality, SEQ 2 (deprived)
Measure NamesIndValueProv_avZA_av
Meas ure NamesIndV alue
P rov_av
ZA_av
458
Section B: National and District Profiles
458
Section B: Profile KwaZulu-Natal ProvinceH
ospi
tal
Dis
tric
t Hos
pita
lR
egio
nal H
ospi
tal
Tert
iary
/Cen
tral
Hos
pita
l
Aver
age
leng
th o
f st
ay -
tota
l (D
ays)
Expe
nditu
re
per p
atie
nt
day
equi
vale
nt
(Ran
d)
Inpa
tient
bed
ut
ilisa
tion
rate
- to
tal
(%)
Inpa
tient
cr
ude
deat
h ra
te (%
)
OPD
new
cl
ient
not
re
ferr
ed ra
te
(%)
Aver
age
leng
th o
f st
ay -
tota
l (D
ays)
Expe
nditu
re
per p
atie
nt
day
equi
vale
nt
(Ran
d)
Inpa
tient
bed
ut
ilisa
tion
rate
- to
tal
(%)
Inpa
tient
cr
ude
deat
h ra
te (%
)
OPD
new
cl
ient
not
re
ferr
ed ra
te
(%)
Aver
age
leng
th o
f st
ay -
tota
l (D
ays)
Expe
nditu
re
per p
atie
nt
day
equi
vale
nt
(Ran
d)
Inpa
tient
bed
ut
ilisa
tion
rate
- to
tal
(%)
Inpa
tient
cr
ude
deat
h ra
te (%
)
OPD
new
cl
ient
not
re
ferr
ed ra
te
(%)
Emna
mbi
thi S
DIn
dica
tor
- -
- -
-6.
32
584
83.6
6.3
29.3
- -
- -
-
Num
erat
or -
- -
- -
138
545
510
397
462
138
545
1 38
310
752
- -
- -
-
Den
omin
ator
- -
- -
-21
915
197
519
165
728
21 9
1536
708
- -
- -
-
Okh
ahla
mba
SD
Indi
cato
r4.
93
358
61.8
6.0
25.1
- -
- -
- -
- -
- -
Num
erat
or35
180
160
822
713
35 1
8042
71
743
- -
- -
- -
- -
- -
Den
omin
ator
7 15
047
891
56 9
467
150
6 95
2 -
- -
- -
- -
- -
-
Um
tshe
zi S
DIn
dica
tor
5.4
2 43
959
.75.
554
.5 -
- -
- -
- -
- -
-
Num
erat
or66
901
229
539
767
66 9
0169
04
467
- -
- -
- -
- -
- -
Den
omin
ator
12 4
4494
127
112
067
12 4
448
194
- -
- -
- -
- -
- -
uThu
kela
In
dica
tor
5.2
2 74
960
.45.
741
.06.
32
584
83.6
6.3
29.3
- -
- -
-
Num
erat
or10
2 08
139
0 36
2 48
110
2 08
11
117
6 21
013
8 54
551
0 39
7 46
213
8 54
51
383
10 7
52 -
- -
- -
Den
omin
ator
19 5
9414
2 01
816
9 01
419
594
15 1
4621
915
197
519
165
728
21 9
1536
708
- -
- -
-
KwaZ
ulu-
Nat
alIn
dica
tor
5.4
2 56
656
.25.
449
.46.
12
935
67.9
5.5
34.6
8.0
5 98
271
.75.
526
.8
Sout
h Af
rica
Indi
cato
r4.
42
568
67.4
5.1
59.3
5.3
2 89
478
.35.
037
.26.
94
227
84.3
5.4
20.3
Sour
ce:
DH
IS a
nd B
AS.
Annual trends

Section B: National and District Profiles
459
Section B: Profile KwaZulu-Natal Province
459
Deaths and Patient day equivalent 2014/15 – 2016/17
Dat
a El
emen
t(N
umbe
r)
2014
/15
2015
/16
2016
/17
PHC
/ CH
C / M
OU
*D
istr
ict
Hos
pita
lR
egio
nal
Hos
pita
l
Cen
tral
/te
rtia
ry
Hos
pita
lD
istr
ict
Tota
lPH
C / C
HC
/ MO
UD
istr
ict
Hos
pita
lR
egio
nal
Hos
pita
l
Cen
tral
/te
rtia
ry
Hos
pita
lD
istr
ict
Tota
lPH
C / C
HC
/ MO
UD
istr
ict
Hos
pita
lR
egio
nal
Hos
pita
l
Cen
tral
/te
rtia
ry
hosp
ital
Dis
tric
t To
tal
Mat
erna
l dea
ths
-4
18-
22-
415
-19
-2
11-
13
Live
birt
hs2
032
4 84
45
643
-12
519
1 89
84
601
5 37
3-
11 8
721
762
4 43
45
396
-11
592
Still
birth
s14
127
204
-34
518
139
187
-34
49
6821
6-
293
Child (under 5 years)
Infant (under 1
year)
Neo-natal
Dea
th in
faci
lity
0-7d
ays
-63
41-
104
154
44-
99-
4549
-94
Dea
th in
faci
lity
8-28
day
s -
1037
-47
-15
21-
36-
1539
-54
Dea
th in
faci
lity
29 d
ays
- 11
mon
ths
-39
33-
72-
2226
-48
-22
35-
57
Dea
th in
faci
lity
12 –
59
mon
ths
-49
33-
82-
2310
-33
-18
20-
38
Dia
rrho
ea d
eath
und
er 5
yea
rs
-8
19-
27-
410
-14
-1
14-
15
Pneu
mon
ia d
eath
und
er 5
yea
rs-
1411
-25
-14
5-
19-
81
-9
Seve
re a
cute
mal
nutri
tion
deat
h un
der 5
yea
rs
-20
17-
37-
1111
-22
-12
18-
30
TB D
eath
s 98
039
0-
-1
370
885
280
--
1 16
5-
--
--
Inpa
tient
dea
th to
tal
-1
264
1 31
9-
2 58
3-
1 14
61
336
-2
482
-1
117
1 38
3-
2 50
0
Patie
nt d
ay e
quiv
alen
t-
159
298
183
927
-34
3 22
5-
152
289
180
993
-33
3 28
2-
142
018
197
519
-33
9 53
7
Sour
ce:
DH
IS. *
MO
U –
Mat
erna
l Obs
tetr
ic U
nit.

AgeGroup.. Female Male<5 years
5-1415-2425-64
65+Total 24%
14%21%25%
41%75%
26%4%
41%45%
21%9%
46%79%
33%16%
18%10%
5%2%4%
13%20%
6%
21%14%16%
11%33%
78%
30%8%
41%21%
17%8%
35%73%
28%14%
17%8%
14%4%
14%55%
32%6%
KZN, uThukela: DC23, 2010 - 2015
Rank.. Female Male
<5 y
ears
12345678910
5-14
12345678910
15-2
4
12345678910
25-6
4
12345678910
65+
12345678910
Other perinatal conditions (2.1%)Sepsis/other newborn infectious (2.4%)
Poisonings (including herbal) (1.9%)
Birth asphyxia (6.0%)Protein-energy malnutrition (6.5%)
Preterm birth complications (11.8%)
Diarrhoeal diseases (26.9%)Lower respiratory infections (17.7%)
Tuberculosis (3.4%)HIV/AIDS (5.7%)
Vaccine preventable childhood (2.2%)Drowning (2.3%)
Meningitis/encephalitis (6.0%)
Accidental threats to breathing (5.0%)Road injuries (5.2%)
Diarrhoeal diseases (18.1%)
Cerebrovascular disease (2.5%)
Lower respiratory infections (13.9%)Tuberculosis (11.8%)HIV/AIDS (11.2%)
Epilepsy (2.0%)
Meningitis/encephalitis (5.3%)
Mechanical forces (1.9%)
Accidental threats to breathing (4.2%)
Road injuries (1.6%)
Diarrhoeal diseases (8.2%)
Cerebrovascular disease (1.8%)
Lower respiratory infections (7.2%)
Tuberculosis (22.2%)HIV/AIDS (24.4%)
Cervix (2.5%)
Meningitis/encephalitis (3.1%)Hypertensive heart disease (2.6%)
Diabetes mellitus (3.8%)
Diarrhoeal diseases (7.4%)
Ischaemic heart disease (3.5%)
Cerebrovascular disease (6.3%)
Lower respiratory infections (8.6%)Tuberculosis (18.4%)
HIV/AIDS (22.5%)
Cervix (1.5%)Cardiomyopathy (1.7%)
Nephritis/nephrosis (3.6%)
Hypertensive heart disease (11.3%)Diabetes mellitus (9.1%)
Diarrhoeal diseases (5.7%)
Ischaemic heart disease (13.4%)Cerebrovascular disease (23.1%)
Lower respiratory infections (6.6%)
Tuberculosis (2.9%)
Other perinatal conditions (2.0%)Sepsis/other newborn infectious (2.3%)
Birth asphyxia (6.5%)Protein-energy malnutrition (5.5%)
Preterm birth complications (13.4%)
Meningitis/encephalitis (1.6%)
Diarrhoeal diseases (28.6%)Lower respiratory infections (17.3%)
Tuberculosis (2.8%)HIV/AIDS (5.0%)
Exposure to natural forces (3.4%)
Drowning (6.8%)
Fires, hot substances (3.4%)
Meningitis/encephalitis (6.3%)
Accidental threats to breathing (7.8%)
Road injuries (5.5%)
Diarrhoeal diseases (10.6%)Lower respiratory infections (12.3%)
Tuberculosis (10.0%)HIV/AIDS (8.3%)
Self-inflicted injuries (2.9%)Meningitis/encephalitis (2.8%)
Mechanical forces (12.6%)
Accidental threats to breathing (15.0%)Interpersonal violence (14.5%)
Road injuries (5.3%)
Diarrhoeal diseases (3.1%)Lower respiratory infections (3.4%)
Tuberculosis (10.9%)HIV/AIDS (10.5%)
Mechanical forces (3.4%)Accidental threats to breathing (2.9%)
Interpersonal violence (2.2%)Road injuries (2.7%)
Diarrhoeal diseases (5.2%)
Ischaemic heart disease (4.5%)Cerebrovascular disease (4.9%)
Lower respiratory infections (7.8%)
Tuberculosis (21.7%)HIV/AIDS (19.4%)
Prostate (3.7%)COPD (2.9%)
Nephritis/nephrosis (4.4%)Hypertensive heart disease (6.3%)Diabetes mellitus (6.4%)
Diarrhoeal diseases (4.0%)
Ischaemic heart disease (14.1%)Cerebrovascular disease (15.8%)
Lower respiratory infections (8.6%)Tuberculosis (6.5%)
Rank.. Maternal conditions All other causes
Fem
ale
15-4
9
12345678910
Maternal sepsis (5.5%) n=7Abortion (12.1%) n=15Maternal haemorrhage (13.5%) n=17
Hypertension in pregnancy (16.8%) n=21Other maternal (20.2%) n=26
Indirect maternal (31.9%) n=41
Ischaemic heart disease (1.3%) n=111Road injuries (1.4%) n=121
Cervix (1.7%) n=144Nephritis/nephrosis (1.5%) n=124
Cerebrovascular disease (2.7%) n=229Meningitis/encephalitis (4.3%) n=362
Diarrhoeal diseases (8.2%) n=686Lower respiratory infections (9.3%) n=785
Tuberculosis (23.0%) n=1 930HIV/AIDS (28.5%) n=2 398
Percentage ofdeaths by broad
causes andsingle leading
causes
BroadcauseInjury
NCD
HIV and TB
Comm_mat_peri_nut
Prov, DistrictKZN, uThukela: DC23
Show history
Percentages are shownaccording to all the deaths
within the age/gendercategory of each box,
although only the leading10 causes are displayed.
460
Section B: National and District Profiles
460
Section B: Profile KwaZulu-Natal Province
Burden of disease profile
For the percentage of deaths by broad cause, deaths are classified into four groups namely: (i) injuries; (ii) non-communicable diseases; (iii) HIV and TB; and (iv) communicable diseases together with maternal perinatal and nutritional conditions. Data are given by gender and age group for the period 2010–2015. The second part of the graph shows the 10 leading single causes of death within each age group (both genders) for 2010–2015 combined.
Percentage of deaths by broad cause and leading causes 2010–2015

2009 2010 2011 2012 2013 2014 2015 2016Year
2_M
ater
nal a
nd w
omen
's h
ealth
1_Im
pact Maternal
mortality infacility ratio
2_O
utco
me
Antenatal 1stvisit before 20weeks rate
Couple yearprotection rate(WHO)
Delivery infacility under 18years rate
Motherpostnatal visitwithin 6 daysrate
3_O
utpu
t
Antenatal clientinitiated on ARTrate
Cervical cancerscreeningcoverage
0
200
400
600
800
20
40
60
80
100
200
5
10
15
0
100
200
50
100
150
200
50
100
150
KZN, DC23, uThukela District Municipality, SEQ 2 (deprived)
Measure NamesIndValueProv_avZA_av
Section B: National and District Profiles
461
Section B: Profile KwaZulu-Natal Province
461
Maternal and Women’s Health
Impact Outcome Output
Maternal mortality in facility ratio (per100K)
Antenatal client initiated
on ART rate (%)
Delivery in facility under 18 years rate
(%)
Antenatal 1st visit before 20 weeks rate (%)
Cervical cancer
screening coverage (%)
Couple year protection rate
(WHO) (%)
Mother postnatal visit within 6 days
rate (%)
2016/17 2016/17 2016/17 2016/17 2016/17 2016/17 2016/17
Emnambithi SD Indicator 182.6 102.0 8.1 69.9 53.8 78.2 41.1
Numerator 11 757 491 3 074 3 047 57 096 2 497
Denominator 6 025 742 6 080 4 395 67 942 876 591 6 080
Imbabazane SD Indicator - 103.3 4.6 72.1 153.6 62.0 214.0
Numerator - 376 31 1 455 3 745 20 139 1 436
Denominator 668 364 671 2 018 29 254 389 823 671
Indaka SD Indicator - 102.1 9.9 79.5 105.7 63.8 1 061
Numerator - 245 8 1 296 2 237 17 875 859
Denominator 80 240 81 1 630 25 401 336 267 81
Okhahlamba SD Indicator - 99.8 10.4 67.4 65.0 73.7 79.0
Numerator - 412 212 1 755 1 841 27 509 1 616
Denominator 2 026 413 2 046 2 605 33 980 447 912 2 046
Umtshezi SD Indicator 71.6 100.8 10.1 69.5 153.1 105.7 44.3
Numerator 2 368 279 1 171 3 031 27 462 1 219
Denominator 2 793 365 2 752 1 686 23 750 311 799 2 752
uThukela Indicator 112.1 101.6 8.8 71.0 92.5 76.2 65.6
Numerator 13 2 158 1 021 8 751 13 901 150 081 7 627
Denominator 11 592 2 124 11 630 12 334 180 327 2 362 392 11 630
KwaZulu-Natal Indicator 106.7 97.2 8.5 70.2 85.6 74.8 66.8
South Africa Indicator 116.9 95.1 6.8 65.2 61.5 70.2 70.3
Source: DHIS.
Annual trends

462
Section B: National and District Profiles
462
Section B: Profile KwaZulu-Natal Province
Child and School Health
Im
pact
Out
com
eO
utpu
t
Chi
ld u
nder
5
year
s di
arrh
oea
case
fata
lity
rate
(%)
Chi
ld u
nder
5
year
s pn
eum
onia
ca
se fa
talit
y ra
te (%
)
Chi
ld u
nder
5
year
s se
vere
acu
te
mal
nutr
ition
ca
se fa
talit
y ra
te (%
)
Inpa
tient
de
ath
unde
r 1
year
rate
(%)
Inpa
tient
de
ath
unde
r 5
year
rate
(%)
Inpa
tient
ea
rly n
eona
tal
deat
h ra
te
(per
1K)
Inpa
tient
ne
onat
al
deat
h ra
te
(per
1K)
Infa
nt P
CR
test
pos
itive
ar
ound
10
wee
ks ra
te
(%)
Imm
unis
atio
n co
vera
ge
unde
r 1 y
ear
(%)
Infa
nt
excl
usiv
ely
brea
stfe
d at
D
TaP-
IPV-
Hib
-HB
V 3rd
do
se ra
te (%
)
Mea
sles
2nd
dos
e co
vera
ge (%
)
Scho
ol G
rade
1
scre
enin
g co
vera
ge (%
)
Scho
ol G
rade
8
scre
enin
g co
vera
ge (%
)
Vita
min
A
dose
12-
59
mon
ths
cove
rage
(%)
2016
/17
2016
/17
2016
/17
2016
/17
2016
/17
2016
/17
2016
/17
2016
/17
2016
/17
2016
/17
2016
/17
2016
/17
2016
/17
2016
/17
Emna
mbi
thi S
DIn
dica
tor
4.3
0.3
18.8
7.6
5.1
8.1
14.6
2.1
70.8
54.4
91.3
32.1
14.7
79.5
Num
erat
or14
118
123
143
4988
153
669
2 27
24
778
2 02
566
933
442
Den
omin
ator
326
326
961
624
2 79
86
025
6 02
570
062
166
4 17
762
826
6 30
34
552
504
498
Imba
baza
ne S
DIn
dica
tor
- -
- -
- -
- 1.
893
.978
.410
6.2
22.5
13.6
187.
6
Num
erat
or -
- -
- -
- -
82
588
2 24
82
974
713
346
42 3
78
Den
omin
ator
- -
- -
-66
866
845
733
060
2 86
633
594
3 17
12
551
271
026
Inda
ka S
DIn
dica
tor
- -
- -
- -
- -
77.8
72.6
86.5
16.6
4.6
111.
2
Num
erat
or -
- -
- -
- -
-2
204
1 76
02
527
621
151
26 5
53
Den
omin
ator
- -
- -
-80
8025
434
005
2 42
335
073
3 74
83
294
286
620
Okh
ahla
mba
SD
Indi
cato
r -
-5.
88.
05.
611
.414
.8
72.9
74.8
93.4
23.2
55.9
99.5
Num
erat
or -
-4
3746
2330
2
424
2 02
43
155
989
2 02
127
217
Den
omin
ator
128
179
6946
181
72
026
2 02
639
239
888
2 70
640
551
4 26
83
617
328
338
Um
tshe
zi S
DIn
dica
tor
0.6
4.3
17.4
9.5
5.1
7.9
10.7
0.4
83.4
63.9
103.
527
.611
.710
9.4
Num
erat
or1
88
4554
2230
21
490
1 05
51
880
723
246
16 1
57
Den
omin
ator
171
185
4647
21
054
2 79
32
793
446
21 4
441
650
21 7
922
618
2 10
917
7 24
0
uThu
kela
In
dica
tor
2.4
1.3
14.2
8.0
5.2
8.1
12.8
1.1
77.9
67.7
94.8
25.2
21.3
111.
6
Num
erat
or15
930
205
243
9414
825
12 3
759
359
15 3
145
071
3 43
314
5 74
7
Den
omin
ator
625
690
211
2 55
74
669
11 5
9211
592
2 24
919
0 56
313
822
193
836
241
296
193
476
1 56
7 72
2
KwaZ
ulu-
Nat
alIn
dica
tor
2.0
1.8
7.4
6.4
4.5
9.7
12.4
1.0
85.8
53.9
99.8
26.2
16.4
62.1
Sout
h Af
rica
Indi
cato
r2.
02.
08.
06.
34.
49.
912
.41.
382
.341
.696
.233
.019
.858
.0
Sour
ce:
DH
IS.
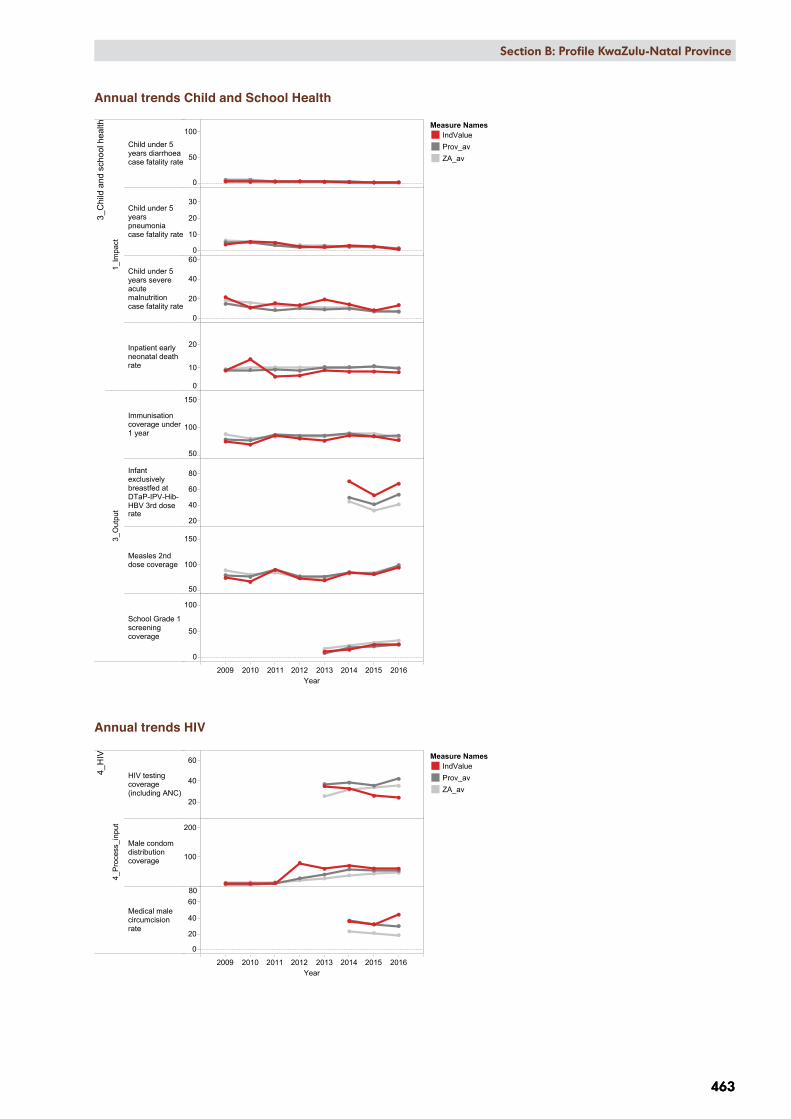
2009 2010 2011 2012 2013 2014 2015 2016Year
3_C
hild
and
sch
ool h
ealth
1_Im
pact
Child under 5years diarrhoeacase fatality rate
Child under 5yearspneumoniacase fatality rate
Child under 5years severeacutemalnutritioncase fatality rate
Inpatient earlyneonatal deathrate
3_O
utpu
t
Immunisationcoverage under1 year
Infantexclusivelybreastfed atDTaP-IPV-Hib-HBV 3rd doserate
Measles 2nddose coverage
School Grade 1screeningcoverage
0
50
100
0
10
20
30
0
20
40
60
0
10
20
50
100
150
20
40
60
80
50
100
150
0
50
100
KZN, DC23, uThukela District Municipality, SEQ 2 (deprived)
Measure NamesIndValueProv_avZA_av
2009 2010 2011 2012 2013 2014 2015 2016Year
4_H
IV
4_P
roce
ss_i
nput
HIV testingcoverage(including ANC)
Male condomdistributioncoverage
Medical malecircumcisionrate
20
40
60
100
200
0
20
40
6080
KZN, DC23, uThukela District Municipality, SEQ 2 (deprived)
Measure NamesIndValueProv_avZA_av
Section B: National and District Profiles
463
Section B: Profile KwaZulu-Natal Province
463
Annual trends Child and School Health
Annual trends HIV
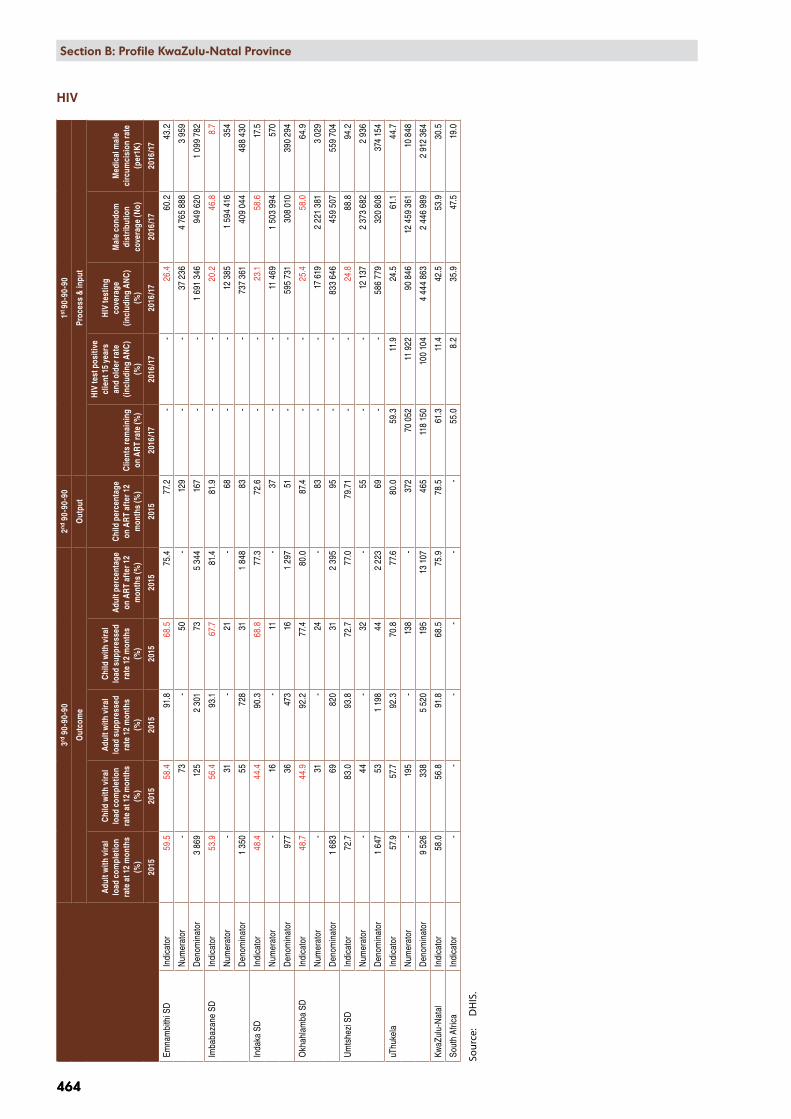
464
Section B: National and District Profiles
464
Section B: Profile KwaZulu-Natal Province
HIV
3rd
90-
90-9
02nd
90-
90-9
01st
90-9
0-90
Out
com
eO
utpu
tPr
oces
s &
inpu
t
Adu
lt w
ith v
iral
load
com
plet
ion
rate
at 1
2 m
onth
s (%
)
Chi
ld w
ith v
iral
load
com
plet
ion
rate
at 1
2 m
onth
s (%
)
Adu
lt w
ith v
iral
load
sup
pres
sed
rate
12
mon
ths
(%)
Chi
ld w
ith v
iral
load
sup
pres
sed
rate
12
mon
ths
(%)
Adu
lt pe
rcen
tage
on
AR
T af
ter 1
2 m
onth
s (%
)
Chi
ld p
erce
ntag
e on
AR
T af
ter 1
2 m
onth
s (%
)C
lient
s re
mai
ning
on
AR
T ra
te (%
)
HIV
test
pos
itive
cl
ient
15
year
s an
d ol
der r
ate
(incl
udin
g A
NC
) (%
)
HIV
test
ing
cove
rage
(in
clud
ing
AN
C)
(%)
Mal
e co
ndom
di
strib
utio
n co
vera
ge (N
o)
Med
ical
mal
e ci
rcum
cisi
on ra
te
(per
1K)
2015
2015
2015
2015
2015
2015
2016
/17
2016
/17
2016
/17
2016
/17
2016
/17
Emna
mbi
thi S
DIn
dica
tor
59.5
58.4
91.8
68.5
75.4
77.2
- -
26.4
60.2
43.2
Num
erat
or -
73 -
50 -
129
- -
37 2
364
765
888
3 95
9
Den
omin
ator
3 86
912
52
301
735
344
167
- -
1 69
1 34
694
9 62
01
099
782
Imba
baza
ne S
DIn
dica
tor
53.9
56.4
93.1
67.7
81.4
81.9
- -
20.2
46
.88.
7
Num
erat
or -
31 -
21 -
68 -
-12
385
1 59
4 41
635
4
Den
omin
ator
1 35
055
728
311
848
83 -
-73
7 36
140
9 04
448
8 43
0
Inda
ka S
DIn
dica
tor
48.4
44.4
90.3
68.8
77.3
72.6
- -
23.1
58.6
17.5
Num
erat
or -
16 -
11 -
37 -
-11
469
1 50
3 99
457
0
Den
omin
ator
977
3647
316
1 29
751
- -
595
731
308
010
390
294
Okh
ahla
mba
SD
Indi
cato
r48
.744
.992
.277
.480
.087
.4 -
-25
.458
.064
.9
Num
erat
or-
31 -
24 -
83 -
-17
619
2 22
1 38
13
029
Den
omin
ator
1 68
369
820
312
395
95 -
-83
3 64
645
9 50
755
9 70
4
Um
tshe
zi S
DIn
dica
tor
72.7
83.0
93.8
72.7
77.0
79.7
1 -
-24
.888
.894
.2
Num
erat
or -
44 -
32 -
55 -
-12
137
2 37
3 68
22
936
Den
omin
ator
1 64
753
1 19
844
2 22
369
- -
586
779
320
808
374
154
uThu
kela
In
dica
tor
57.9
57.7
92.3
70.8
77.6
80.0
59.3
11.9
24.5
61.1
44.7
Num
erat
or -
195
-13
8 -
372
70 0
5211
922
90 8
4612
459
361
10 8
48
Den
omin
ator
9 52
633
85
520
195
13 1
0746
511
8 15
010
0 10
44
444
863
2 44
6 98
92
912
364
KwaZ
ulu-
Nat
alIn
dica
tor
58.0
56.8
91.8
68.5
75.9
78.5
61.3
11.4
42.5
53.9
30.5
Sout
h Af
rica
Indi
cato
r-
- -
- -
- 55
.08.
235
.947
.519
.0
Sour
ce:
DH
IS.
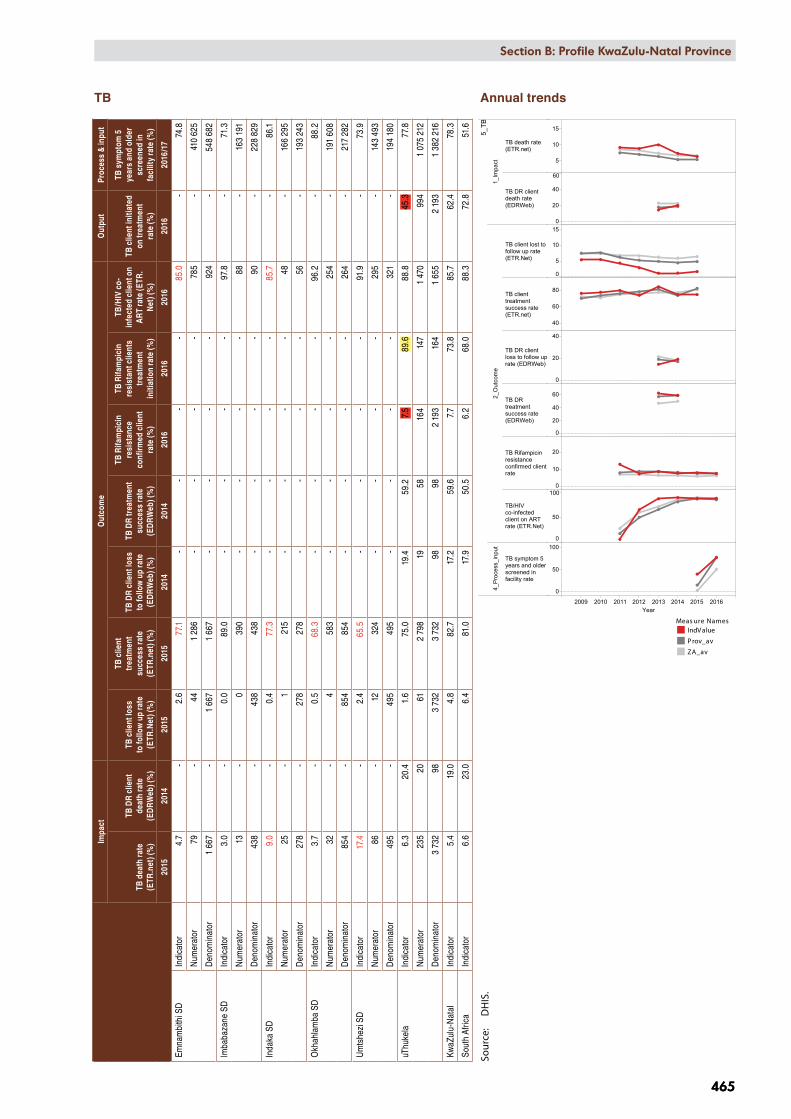
2009 2010 2011 2012 2013 2014 2015 2016Year
5_TB
1_Im
pact
TB death rate(ETR.net)
TB DR clientdeath rate(EDRWeb)
2_O
utco
me
TB client lost tofollow up rate(ETR.Net)
TB clienttreatmentsuccess rate(ETR.net)
TB DR clientloss to follow uprate (EDRWeb)
TB DRtreatmentsuccess rate(EDRWeb)
TB Rifampicinresistanceconfirmed clientrate
TB/HIVco-infectedclient on ARTrate (ETR.Net)
4_P
roce
ss_i
nput
TB symptom 5years and olderscreened infacility rate
5
10
15
0
20
40
60
0
5
10
15
40
60
80
0
20
40
0
20
40
60
0
10
20
0
50
100
0
50
100
KZN, DC23, uThukela District Municipality, SEQ 2 (deprived)
Measure NamesIndValueProv_avZA_av
Meas ure NamesIndV alue
P rov_av
ZA_av
Section B: National and District Profiles
465
Section B: Profile KwaZulu-Natal Province
465
TB Annual trends
Impa
ctO
utco
me
Out
put
Proc
ess
& in
put
TB d
eath
rate
(E
TR.n
et) (
%)
TB D
R cl
ient
de
ath
rate
(E
DR
Web
) (%
)
TB c
lient
loss
to
follo
w u
p ra
te
(ETR
.Net
) (%
)
TB c
lient
tr
eatm
ent
succ
ess
rate
(E
TR.n
et) (
%)
TB D
R cl
ient
loss
to
follo
w u
p ra
te
(ED
RW
eb) (
%)
TB D
R tr
eatm
ent
succ
ess
rate
(E
DR
Web
) (%
)
TB R
ifam
pici
n re
sist
ance
co
nfirm
ed c
lient
ra
te (%
)
TB R
ifam
pici
n re
sist
ant c
lient
s tr
eatm
ent
initi
atio
n ra
te (%
)
TB/H
IV c
o-in
fect
ed c
lient
on
AR
T ra
te (E
TR.
Net
) (%
)
TB c
lient
initi
ated
on
trea
tmen
t ra
te (%
)
TB s
ympt
om 5
ye
ars
and
olde
r sc
reen
ed in
fa
cilit
y ra
te (%
)
2015
2014
2015
2015
2014
2014
2016
2016
2016
2016
2016
/17
Emna
mbi
thi S
DIn
dica
tor
4.7
-2.
677
.1 -
- -
-85
.0 -
74.8
Num
erat
or79
-44
1 28
6 -
- -
-78
5 -
410
625
Den
omin
ator
1 66
7 -
1 66
71
667
- -
- -
924
-54
8 68
2
Imba
baza
ne S
DIn
dica
tor
3.0
-0.
089
.0 -
- -
-97
.8 -
71.3
Num
erat
or13
-0
390
- -
- -
88 -
163
191
Den
omin
ator
438
-43
843
8 -
- -
-90
-22
8 82
9
Inda
ka S
DIn
dica
tor
9.0
-0.
477
.3 -
- -
-85
.7 -
86.1
Num
erat
or25
-1
215
- -
- -
48 -
166
295
Den
omin
ator
278
-27
827
8 -
- -
-56
-19
3 24
3
Okh
ahla
mba
SD
Indi
cato
r3.
7 -
0.5
68.3
- -
- -
96.2
-88
.2
Num
erat
or32
-4
583
- -
- -
254
-19
1 60
8
Den
omin
ator
854
-85
485
4 -
- -
-26
4 -
217
282
Um
tshe
zi S
DIn
dica
tor
17.4
-2.
465
.5 -
- -
-91
.9 -
73.9
Num
erat
or86
-12
324
- -
- -
295
-14
3 49
3
Den
omin
ator
495
-49
549
5 -
- -
-32
1 -
194
180
uThu
kela
In
dica
tor
6.3
20.4
1.6
75.0
19.4
59.2
7.5
89.6
88.8
45.3
77.8
Num
erat
or23
520
612
798
1958
164
147
1 47
099
41
075
212
Den
omin
ator
3 73
298
3 73
23
732
9898
2 19
316
41
655
2 19
31
382
216
KwaZ
ulu-
Nat
alIn
dica
tor
5.4
19.0
4.8
82.7
17.2
59.6
7.7
73.8
85.7
62.4
78.3
Sout
h Af
rica
Indi
cato
r6.
623
.06.
481
.017
.950
.56.
268
.088
.372
.851
.6
Sour
ce:
DH
IS.
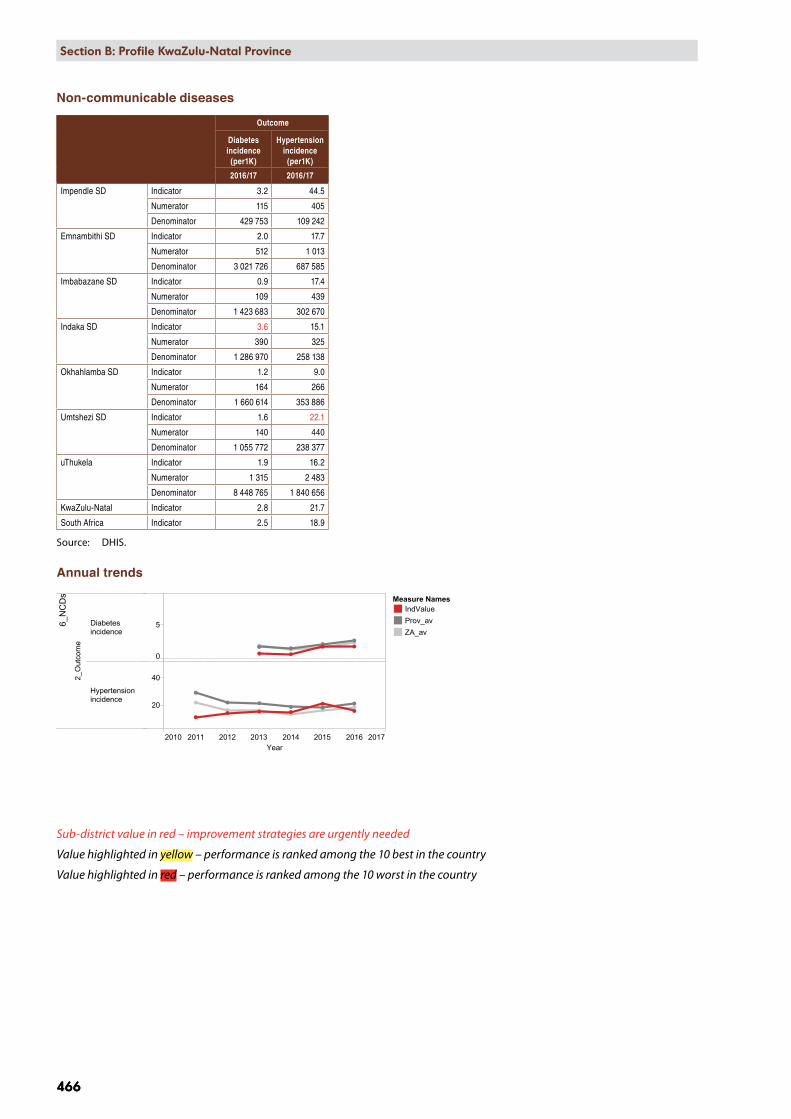
2010 2011 2012 2013 2014 2015 2016 2017Year
6_NCDs
2_Outcome
Diabetesincidence
Hypertensionincidence
0
5
20
40
KZN, DC23, uThukela District Municipality, SEQ 2 (deprived)
Measure NamesIndValueProv_avZA_av
466
Section B: National and District Profiles
466
Section B: Profile KwaZulu-Natal Province
Non-communicable diseases
Outcome
Diabetes incidence
(per1K)
Hypertension incidence
(per1K)
2016/17 2016/17
Impendle SD Indicator 3.2 44.5
Numerator 115 405
Denominator 429 753 109 242
Emnambithi SD Indicator 2.0 17.7
Numerator 512 1 013
Denominator 3 021 726 687 585
Imbabazane SD Indicator 0.9 17.4
Numerator 109 439
Denominator 1 423 683 302 670
Indaka SD Indicator 3.6 15.1
Numerator 390 325
Denominator 1 286 970 258 138
Okhahlamba SD Indicator 1.2 9.0
Numerator 164 266
Denominator 1 660 614 353 886
Umtshezi SD Indicator 1.6 22.1
Numerator 140 440
Denominator 1 055 772 238 377
uThukela Indicator 1.9 16.2
Numerator 1 315 2 483
Denominator 8 448 765 1 840 656
KwaZulu-Natal Indicator 2.8 21.7
South Africa Indicator 2.5 18.9
Source: DHIS.
Annual trends
Sub-district value in red – improvement strategies are urgently needed
Value highlighted in yellow – performance is ranked among the 10 best in the country
Value highlighted in red – performance is ranked among the 10 worst in the country

Section B: National and District Profiles
467
Section B: Profile KwaZulu-Natal Province
467
uMzinyathi District Municipality (DC24)
uMzinyathi District is situated in the north-central region of KwaZulu-Natal Province and includes four health sub-districts, namely Endumeni, Nquthu, Msinga and uMvoti. The district has a total population of 527 386, with a population density of 61.4 persons per km2 and falls into socio-economic Quintile 1, among the poorest districts, and has an estimated medical scheme coverage of 5.6%. uMzinyathi is one of the 11 National Health Insurance (NHI) pilot districts.
Social determinants of healtha
Unemployment ratea 36.6%
Youth unemployment rate (15-34 years)a 45.6%
No schooling 21.1%
Matric 26.9%
Higher education 6.4%
Households 126 791
Female-headed households 58.9%
Formal dwellings 47.0%
Flush toilet connected to sewerage 20.3%
Weekly refuse removal 18.7%
Piped water inside dwellings 13.3%
Electricity for lighting 69.7%
Blue Drop water score 78.0%
Source: StatsSA. 2014 Blue Drop Report.
Population distribution sub-district boundaries and health facility locations
a Statistics South Africa. Census 2011 Municipal fact sheet. Report No. 03-01-58. Pretoria: Statistics SA; 2012.
Population per selected category
Population category 2017 2018 2019 2020
under 1 year 13 936 14 299 15 045 15 871
under 5 years 74 877 75 056 75 810 76 953
05-09 years 74 806 75 075 74 793 74 414
10-14 years 64 716 66 902 69 401 71 546
15-19 years 61 302 59 906 59 220 59 608
20-24 years 62 620 61 382 59 622 57 649
25-29 years 58 721 59 570 60 085 60 012
30-34 years 44 102 47 280 50 436 53 568
35-39 years 28 462 30 866 33 260 35 416
40-44 years 18 671 19 548 20 621 21 977
45-49 years 14 778 14 869 15 077 15 421
50-54 years 13 584 13 423 13 211 13 021
55-59 years 11 557 11 591 11 691 11 758
60-64 years 10 723 10 408 10 074 9 797
65-69 years 9 222 9 127 9 001 8 839
70-74 years 7 028 7 025 6 995 6 933
75-79 years 4 899 4 839 4 789 4 752
80 years and older 4 822 4 784 4 756 4 741
Total 564 889 571 650 578 835 586 402
Estimated pregnant women* 14 912 15 300 16 098 16 982
Source: Mid-Year Population Estimates 2016 StatsSA. * Under 1 year population X 1.07.
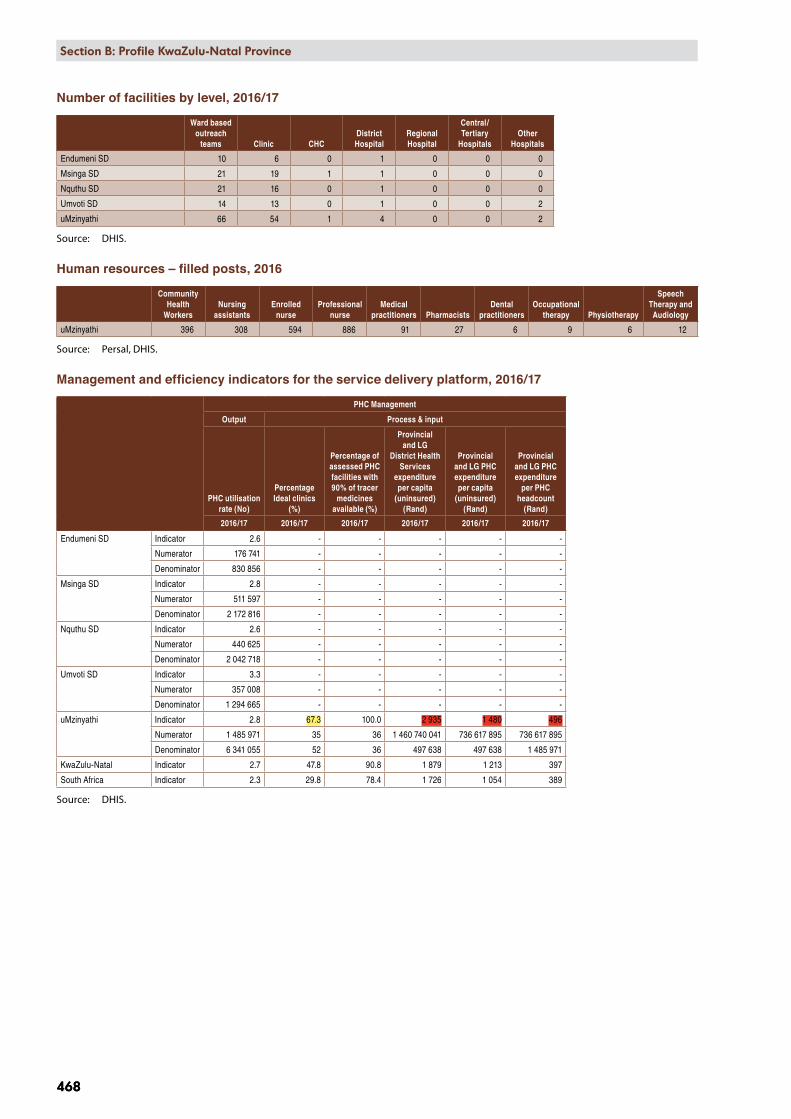
468
Section B: National and District Profiles
468
Section B: Profile KwaZulu-Natal Province
Number of facilities by level, 2016/17
Ward based outreach
teams Clinic CHCDistrict Hospital
Regional Hospital
Central/Tertiary
HospitalsOther
Hospitals
Endumeni SD 10 6 0 1 0 0 0
Msinga SD 21 19 1 1 0 0 0
Nquthu SD 21 16 0 1 0 0 0
Umvoti SD 14 13 0 1 0 0 2
uMzinyathi 66 54 1 4 0 0 2
Source: DHIS.
Human resources – filled posts, 2016
Community Health
WorkersNursing
assistantsEnrolled
nurseProfessional
nurseMedical
practitioners PharmacistsDental
practitionersOccupational
therapy Physiotherapy
Speech Therapy and Audiology
uMzinyathi 396 308 594 886 91 27 6 9 6 12
Source: Persal, DHIS.
Management and efficiency indicators for the service delivery platform, 2016/17
PHC Management
Output Process & input
PHC utilisation rate (No)
Percentage Ideal clinics
(%)
Percentage of assessed PHC facilities with 90% of tracer
medicines available (%)
Provincial and LG
District Health Services
expenditure per capita
(uninsured) (Rand)
Provincial and LG PHC expenditure per capita
(uninsured) (Rand)
Provincial and LG PHC expenditure
per PHC headcount
(Rand)
2016/17 2016/17 2016/17 2016/17 2016/17 2016/17
Endumeni SD Indicator 2.6 - - - - -
Numerator 176 741 - - - - -
Denominator 830 856 - - - - -
Msinga SD Indicator 2.8 - - - - -
Numerator 511 597 - - - - -
Denominator 2 172 816 - - - - -
Nquthu SD Indicator 2.6 - - - - -
Numerator 440 625 - - - - -
Denominator 2 042 718 - - - - -
Umvoti SD Indicator 3.3 - - - - -
Numerator 357 008 - - - - -
Denominator 1 294 665 - - - - -
uMzinyathi Indicator 2.8 67.3 100.0 2 935 1 480 496
Numerator 1 485 971 35 36 1 460 740 041 736 617 895 736 617 895
Denominator 6 341 055 52 36 497 638 497 638 1 485 971
KwaZulu-Natal Indicator 2.7 47.8 90.8 1 879 1 213 397
South Africa Indicator 2.3 29.8 78.4 1 726 1 054 389
Source: DHIS.

2008 2010 2012 2014 2016 2018Year
1_M
anag
emen
t
1_Im
pact
Inpatient crudedeath rate
2_O
utco
me
Average lengthof stay (districthospitals)
Expenditure perpatient dayequivalent(districthospitals)
3_O
utpu
t
Inpatient bedutilisation rate(districthospitals)
OPD new clientnot referred rate(districthospitals)
4_P
roce
ss_i
nput
PercentageIdeal clinics
Provincial andLG DistrictHealth Servicesexpenditure percapita(uninsured)
Provincial andLG PHCexpenditure percapita(uninsured)
Provincial andLG PHCexpenditure perPHC headcount
2
4
6
8
2
4
6
8
1K
2K
3K
4K
50
100
0
50
100
0
50
100
1K
2K
3K
500
1000
1500
200
400
KZN, DC24, uMzinyathi District Municipality, SEQ 1 (most deprived)
Measure NamesIndValueProv_avZA_av
Meas ure NamesIndV alue
P rov_av
ZA_av
Section B: National and District Profiles
469
Section B: Profile KwaZulu-Natal Province
469
Hos
pita
l
Dis
tric
t Hos
pita
lR
egio
nal H
ospi
tal
Tert
iary
/Cen
tral
Hos
pita
l
Aver
age
leng
th o
f st
ay -
tota
l (D
ays)
Expe
nditu
re
per p
atie
nt
day
equi
vale
nt
(Ran
d)
Inpa
tient
bed
ut
ilisa
tion
rate
- to
tal
(%)
Inpa
tient
cr
ude
deat
h ra
te (%
)
OPD
new
cl
ient
not
re
ferr
ed ra
te
(%)
Aver
age
leng
th o
f st
ay -
tota
l (D
ays)
Expe
nditu
re
per p
atie
nt
day
equi
vale
nt
(Ran
d)
Inpa
tient
bed
ut
ilisa
tion
rate
- to
tal
(%)
Inpa
tient
cr
ude
deat
h ra
te (%
)
OPD
new
cl
ient
not
re
ferr
ed ra
te
(%)
Aver
age
leng
th o
f st
ay -
tota
l (D
ays)
Expe
nditu
re
per p
atie
nt
day
equi
vale
nt
(Ran
d)
Inpa
tient
bed
ut
ilisa
tion
rate
- to
tal
(%)
Inpa
tient
cr
ude
deat
h ra
te (%
)
OPD
new
cl
ient
not
re
ferr
ed ra
te
(%)
Endu
men
i SD
Indi
cato
r4.
63
162
43.0
5.6
60.8
- -
- -
- -
- -
- -
Num
erat
or35
169
178
314
939
35 1
6943
114
513
- -
- -
- -
- -
- -
Den
omin
ator
7 65
156
394
81 7
697
651
23 8
73 -
- -
- -
- -
- -
-
Msi
nga
SDIn
dica
tor
7.7
2 18
463
.65.
739
.4 -
- -
- -
- -
- -
-
Num
erat
or80
519
223
231
480
80 5
1959
55
194
- -
- -
- -
- -
- -
Den
omin
ator
10 4
5210
2 23
012
6 66
910
452
13 1
67 -
- -
- -
- -
- -
-
Nqu
thu
SDIn
dica
tor
5.5
2 35
848
.76.
169
.2 -
- -
- -
- -
- -
-
Num
erat
or62
016
206
932
209
62 0
1669
424
049
- -
- -
- -
- -
- -
Den
omin
ator
11 3
0687
769
127
308
11 3
0634
739
- -
- -
- -
- -
- -
Um
voti
SDIn
dica
tor
5.5
3 18
947
.85.
076
.5 -
- -
- -
- -
- -
-
Num
erat
or40
821
170
762
194
40 8
2136
813
111
- -
- -
- -
- -
- -
Den
omin
ator
7 37
353
544
85 4
197
373
17 1
46 -
- -
- -
- -
- -
-
uMzi
nyat
hi
Indi
cato
r5.
92
598
51.9
5.7
63.9
- -
- -
- -
- -
- -
Num
erat
or21
8 52
477
9 24
0 82
221
8 52
42
088
56 8
67 -
- -
- -
- -
- -
-
Den
omin
ator
36 7
8229
9 93
742
1 16
536
782
88 9
25 -
- -
- -
- -
- -
-
KwaZ
ulu-
Nat
alIn
dica
tor
5.4
2 56
656
.25.
449
.46.
12
935
67.9
5.5
34.6
8.0
5 98
271
.75.
526
.8
Sout
h Af
rica
Indi
cato
r4.
42
568
67.4
5.1
59.3
5.3
2 89
478
.35.
037
.26.
94
227
84.3
5.4
20.3
Sour
ce:
DH
IS a
nd B
AS.
Annual trends

470
Section B: National and District Profiles
470
Section B: Profile KwaZulu-Natal Province
Deaths and Patient day equivalent 2014/15 – 2016/17
Dat
a El
emen
t(N
umbe
r)
2014
/15
2015
/16
2016
/17
PHC
/ CH
C / M
OU
*D
istr
ict
Hos
pita
lR
egio
nal
Hos
pita
l
Cen
tral
/te
rtia
ry
Hos
pita
lD
istr
ict
Tota
lPH
C / C
HC
/ MO
UD
istr
ict
Hos
pita
lR
egio
nal
Hos
pita
l
Cen
tral
/te
rtia
ry
Hos
pita
lD
istr
ict
Tota
lPH
C / C
HC
/ MO
UD
istr
ict
Hos
pita
lR
egio
nal
Hos
pita
l
Cen
tral
/te
rtia
ry
hosp
ital
Dis
tric
t To
tal
Mat
erna
l dea
ths
-9
--
911
--
11-
3-
-3
Live
birt
hs47
510
826
--
11 3
0163
410
221
--
10 8
5558
810
016
--
10 6
04
Still
birth
s9
193
--
202
2015
8-
-17
89
158
--
167
Child (under 5 years)
Infant (under 1
year)
Neo-natal
Dea
th in
faci
lity
0-7d
ays
-10
6-
-10
61
129
--
130
310
2-
-10
5
Dea
th in
faci
lity
8-28
day
s -
26-
-26
-20
--
20-
13-
-13
Dea
th in
faci
lity
29 d
ays
- 11
mon
ths
-55
--
551
51-
-52
-31
--
31
Dea
th in
faci
lity
12 –
59
mon
ths
-51
--
51-
42-
-42
-31
--
31
Dia
rrho
ea d
eath
und
er 5
yea
rs
-30
--
30-
14-
-14
-11
--
11
Pneu
mon
ia d
eath
und
er 5
yea
rs-
15-
-15
-21
--
21-
12-
-12
Seve
re a
cute
mal
nutri
tion
deat
h un
der 5
yea
rs
-35
--
35-
24-
-24
-11
--
11
TB D
eath
s 68
841
2-
-1
100
556
472
--
1 02
8-
--
--
Inpa
tient
dea
th to
tal
32
272
--
2 27
58
2 18
7-
-2
195
82
088
--
2 09
6
Patie
nt d
ay e
quiv
alen
t20
531
447
--
311
652
1 93
531
5 17
0-
-31
7 10
52
940
299
937
--
302
877
Sour
ce:
DH
IS. *
MO
U –
Mat
erna
l Obs
tetr
ic U
nit.
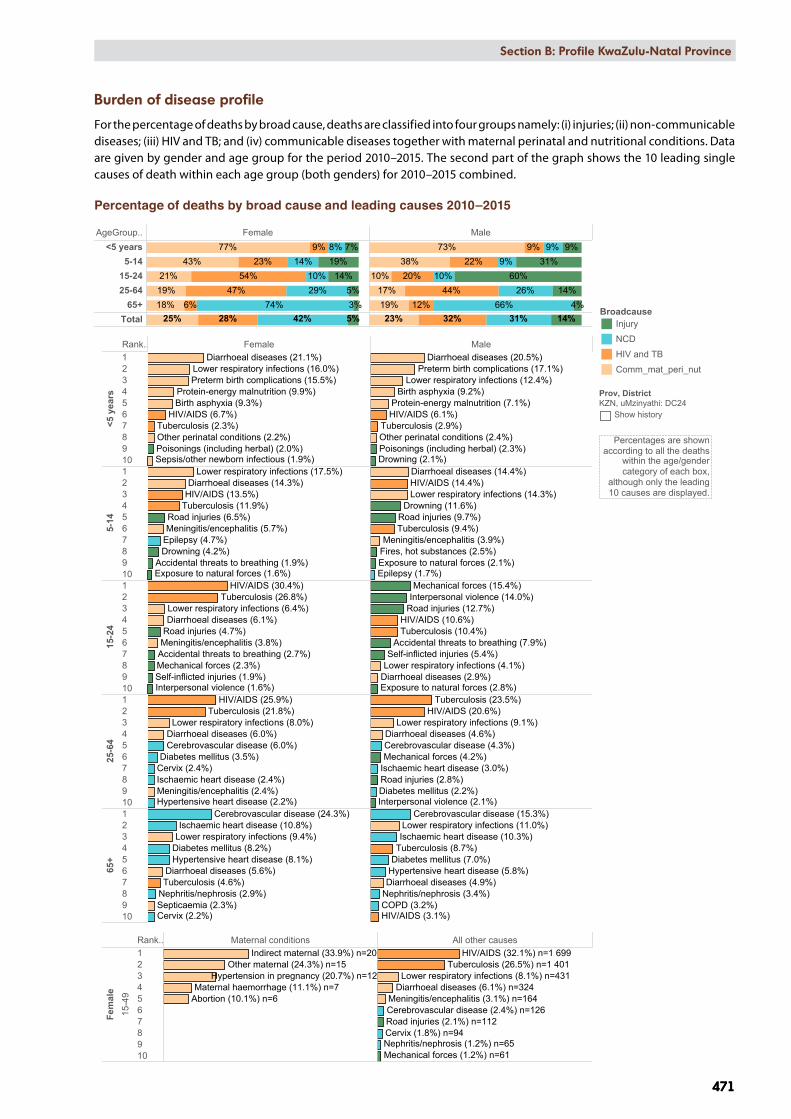
AgeGroup.. Female Male<5 years
5-1415-2425-64
65+Total 25%
18%19%21%
43%77%
28%6%
47%54%
23%9%
42%74%
29%10%
14%8%
5%3%5%
14%19%
7%
23%19%17%
10%38%
73%
32%12%
44%20%
22%9%
31%66%
26%10%
9%9%
14%4%
14%60%
31%9%
KZN, uMzinyathi: DC24, 2010 - 2015
Rank.. Female Male
<5 y
ears
12345678910
5-14
12345678910
15-2
4
12345678910
25-6
4
12345678910
65+
12345678910
Other perinatal conditions (2.2%)
Sepsis/other newborn infectious (1.9%)Poisonings (including herbal) (2.0%)
Birth asphyxia (9.3%)Protein-energy malnutrition (9.9%)
Preterm birth complications (15.5%)
Diarrhoeal diseases (21.1%)Lower respiratory infections (16.0%)
Tuberculosis (2.3%)HIV/AIDS (6.7%)
Exposure to natural forces (1.6%)
Drowning (4.2%)Epilepsy (4.7%)Meningitis/encephalitis (5.7%)
Accidental threats to breathing (1.9%)
Road injuries (6.5%)
Diarrhoeal diseases (14.3%)Lower respiratory infections (17.5%)
Tuberculosis (11.9%)HIV/AIDS (13.5%)
Self-inflicted injuries (1.9%)
Meningitis/encephalitis (3.8%)
Mechanical forces (2.3%)Accidental threats to breathing (2.7%)
Interpersonal violence (1.6%)
Road injuries (4.7%)Diarrhoeal diseases (6.1%)Lower respiratory infections (6.4%)
Tuberculosis (26.8%)HIV/AIDS (30.4%)
Cervix (2.4%)
Meningitis/encephalitis (2.4%)Hypertensive heart disease (2.2%)
Diabetes mellitus (3.5%)
Diarrhoeal diseases (6.0%)
Ischaemic heart disease (2.4%)
Cerebrovascular disease (6.0%)
Lower respiratory infections (8.0%)Tuberculosis (21.8%)
HIV/AIDS (25.9%)
Cervix (2.2%)Septicaemia (2.3%)Nephritis/nephrosis (2.9%)
Hypertensive heart disease (8.1%)Diabetes mellitus (8.2%)
Diarrhoeal diseases (5.6%)
Ischaemic heart disease (10.8%)Cerebrovascular disease (24.3%)
Lower respiratory infections (9.4%)
Tuberculosis (4.6%)
Other perinatal conditions (2.4%)Poisonings (including herbal) (2.3%)Drowning (2.1%)
Birth asphyxia (9.2%)Protein-energy malnutrition (7.1%)
Preterm birth complications (17.1%)Diarrhoeal diseases (20.5%)
Lower respiratory infections (12.4%)
Tuberculosis (2.9%)HIV/AIDS (6.1%)
Exposure to natural forces (2.1%)
Drowning (11.6%)
Epilepsy (1.7%)
Fires, hot substances (2.5%)Meningitis/encephalitis (3.9%)
Road injuries (9.7%)
Diarrhoeal diseases (14.4%)
Lower respiratory infections (14.3%)
Tuberculosis (9.4%)
HIV/AIDS (14.4%)
Exposure to natural forces (2.8%)
Self-inflicted injuries (5.4%)
Mechanical forces (15.4%)
Accidental threats to breathing (7.9%)
Interpersonal violence (14.0%)Road injuries (12.7%)
Diarrhoeal diseases (2.9%)Lower respiratory infections (4.1%)
Tuberculosis (10.4%)HIV/AIDS (10.6%)
Mechanical forces (4.2%)
Interpersonal violence (2.1%)
Road injuries (2.8%)Diabetes mellitus (2.2%)
Diarrhoeal diseases (4.6%)
Ischaemic heart disease (3.0%)
Cerebrovascular disease (4.3%)
Lower respiratory infections (9.1%)
Tuberculosis (23.5%)HIV/AIDS (20.6%)
COPD (3.2%)Nephritis/nephrosis (3.4%)
Hypertensive heart disease (5.8%)Diabetes mellitus (7.0%)
Diarrhoeal diseases (4.9%)
Ischaemic heart disease (10.3%)
Cerebrovascular disease (15.3%)Lower respiratory infections (11.0%)
Tuberculosis (8.7%)
HIV/AIDS (3.1%)
Rank.. Maternal conditions All other causes
Fem
ale
15-4
9
12345678910
Abortion (10.1%) n=6Maternal haemorrhage (11.1%) n=7
Hypertension in pregnancy (20.7%) n=12Other maternal (24.3%) n=15
Indirect maternal (33.9%) n=20
Mechanical forces (1.2%) n=61
Road injuries (2.1%) n=112Cervix (1.8%) n=94Nephritis/nephrosis (1.2%) n=65
Cerebrovascular disease (2.4%) n=126Meningitis/encephalitis (3.1%) n=164
Diarrhoeal diseases (6.1%) n=324Lower respiratory infections (8.1%) n=431
Tuberculosis (26.5%) n=1 401HIV/AIDS (32.1%) n=1 699
Percentage ofdeaths by broad
causes andsingle leading
causes
BroadcauseInjury
NCD
HIV and TB
Comm_mat_peri_nut
Prov, DistrictKZN, uMzinyathi: DC24
Show history
Percentages are shownaccording to all the deaths
within the age/gendercategory of each box,
although only the leading10 causes are displayed.
Section B: National and District Profiles
471
Section B: Profile KwaZulu-Natal Province
471
Burden of disease profile
For the percentage of deaths by broad cause, deaths are classified into four groups namely: (i) injuries; (ii) non-communicable diseases; (iii) HIV and TB; and (iv) communicable diseases together with maternal perinatal and nutritional conditions. Data are given by gender and age group for the period 2010–2015. The second part of the graph shows the 10 leading single causes of death within each age group (both genders) for 2010–2015 combined.
Percentage of deaths by broad cause and leading causes 2010–2015

2009 2010 2011 2012 2013 2014 2015 2016Year
2_M
ater
nal a
nd w
omen
's h
ealth
1_Im
pact Maternal
mortality infacility ratio
2_O
utco
me
Antenatal 1stvisit before 20weeks rate
Couple yearprotection rate(WHO)
Delivery infacility under 18years rate
Motherpostnatal visitwithin 6 daysrate
3_O
utpu
t
Antenatal clientinitiated on ARTrate
Cervical cancerscreeningcoverage
0
200
400
600
800
20
40
60
80
100
200
5
10
15
0
100
200
50
100
150
200
50
100
150
KZN, DC24, uMzinyathi District Municipality, SEQ 1 (most deprived)
Measure NamesIndValueProv_avZA_av
472
Section B: National and District Profiles
472
Section B: Profile KwaZulu-Natal Province
Maternal and Women’s Health
Impact Outcome Output
Maternal mortality in facility ratio (per100K)
Antenatal client initiated
on ART rate (%)
Delivery in facility under 18 years rate
(%)
Antenatal 1st visit before 20 weeks rate (%)
Cervical cancer
screening coverage (%)
Couple year protection rate
(WHO) (%)
Mother postnatal visit within 6 days
rate (%)
2016/17 2016/17 2016/17 2016/17 2016/17 2016/17 2016/17
Endumeni SD Indicator 61.8 104.1 7.2 74.8 170.7 197.5 49.5
Numerator 1 202 118 1 101 2 497 39 582 806
Denominator 1 617 194 1 628 1 472 17 553 240 477 1 628
Msinga SD Indicator 28.1 98.2 9.8 77.8 274.5 119.7 78.7
Numerator 1 494 345 3 659 10 399 61 162 2 771
Denominator 3 557 503 3 519 4 701 45 468 613 272 3 519
Nquthu SD Indicator 29.1 100.2 11.1 70.1 109.0 174.2 54.6
Numerator 1 550 381 2 310 3 588 81 606 1 875
Denominator 3 438 549 3 432 3 293 39 498 562 239 3 432
Umvoti SD Indicator - 98.7 9.9 73.3 84.2 152.3 66.1
Numerator - 393 201 1 727 2 084 50 173 1 337
Denominator 1 992 398 2 023 2 356 29 685 395 217 2 023
uMzinyathi Indicator 28.3 99.7 9.9 74.4 168.5 154.1 64.0
Numerator 3 1 639 1 045 8 797 18 568 232 524 6 789
Denominator 10 604 1 644 10 602 11 822 132 205 1 811 205 10 602
KwaZulu-Natal Indicator 106.7 97.2 8.5 70.2 85.6 74.8 66.8
South Africa Indicator 116.9 95.1 6.8 65.2 61.5 70.2 70.3
Source: DHIS.
Annual trends

2009 2010 2011 2012 2013 2014 2015 2016Year
3_C
hild
and
sch
ool h
ealth
1_Im
pact
Child under 5years diarrhoeacase fatality rate
Child under 5yearspneumoniacase fatality rate
Child under 5years severeacutemalnutritioncase fatality rate
Inpatient earlyneonatal deathrate
3_O
utpu
t
Immunisationcoverage under1 year
Infantexclusivelybreastfed atDTaP-IPV-Hib-HBV 3rd doserate
Measles 2nddose coverage
School Grade 1screeningcoverage
0
50
100
0
10
20
30
0
20
40
60
0
10
20
50
100
150
20
40
60
80
50
100
150
0
50
100
KZN, DC24, uMzinyathi District Municipality, SEQ 1 (most deprived)
Measure NamesIndValueProv_avZA_av
Meas ure NamesIndV alue
P rov_av
ZA_av
Section B: National and District Profiles
473
Section B: Profile KwaZulu-Natal Province
473
Child and School HealthIm
pact
Out
com
eO
utpu
t
Chi
ld u
nder
5
year
s di
arrh
oea
case
fata
lity
rate
(%)
Chi
ld u
nder
5
year
s pn
eum
onia
ca
se fa
talit
y ra
te (%
)
Chi
ld u
nder
5
year
s se
vere
acu
te
mal
nutr
ition
ca
se fa
talit
y ra
te (%
)
Inpa
tient
de
ath
unde
r 1
year
rate
(%)
Inpa
tient
de
ath
unde
r 5
year
rate
(%)
Inpa
tient
ea
rly n
eona
tal
deat
h ra
te
(per
1K)
Inpa
tient
ne
onat
al
deat
h ra
te
(per
1K)
Infa
nt P
CR
test
pos
itive
ar
ound
10
wee
ks ra
te
(%)
Imm
unis
atio
n co
vera
ge
unde
r 1 y
ear
(%)
Infa
nt
excl
usiv
ely
brea
stfe
d at
D
TaP-
IPV-
Hib
-H
BV
3rd d
ose
rate
(%)
Mea
sles
2nd
dos
e co
vera
ge (%
)
Scho
ol G
rade
1
scre
enin
g co
vera
ge (%
)
Scho
ol G
rade
8
scre
enin
g co
vera
ge (%
)
Vita
min
A
dose
12-
59
mon
ths
cove
rage
(%)
2016
/17
2016
/17
2016
/17
2016
/17
2016
/17
2016
/17
2016
/17
2016
/17
2016
/17
2016
/17
2016
/17
2016
/17
2016
/17
2016
/17
Endu
men
i SD
Indi
cato
r0.
92.
11.
94.
93.
28.
08.
70.
810
8.6
81.1
142.
936
.729
.638
.3
Num
erat
or1
41
1720
1314
31
126
1 16
81
644
1 00
256
43
814
Den
omin
ator
109
188
5334
762
51
617
1 61
735
812
444
1 44
013
806
2 73
31
904
119
460
Msi
nga
SDIn
dica
tor
0.4
1.1
7.7
4.5
3.1
7.9
8.7
0.8
88.0
75.7
116.
433
.915
.761
.1
Num
erat
or1
37
4147
2831
64
036
4 17
15
605
2 48
481
924
287
Den
omin
ator
232
279
9191
41
524
3 55
73
557
740
55 0
205
507
57 7
867
326
5 20
447
6 84
4
Nqu
thu
SDIn
dica
tor
3.1
1.4
-6.
14.
911
.313
.40.
475
.171
.185
.915
.10.
040
.7
Num
erat
or8
3 -
6078
3946
33
005
2 57
63
648
865
014
412
Den
omin
ator
255
219
5299
11
599
3 43
83
438
683
48 0
093
623
50 9
705
726
4 92
242
4 96
2
Um
voti
SDIn
dica
tor
1.1
4.5
6.4
13.2
6.1
12.6
13.6
1.2
104.
275
.211
5.9
17.0
20.4
50.3
Num
erat
or1
23
3135
2527
62
392
1 90
22
689
581
580
9 34
1
Den
omin
ator
9444
4723
457
21
992
1 99
249
527
546
2 52
827
846
3 41
12
843
222
912
uMzi
nyat
hi
Indi
cato
r1.
61.
64.
56.
04.
29.
911
.10.
888
.675
.010
8.4
25.7
13.2
50.0
Num
erat
or11
1211
149
180
105
118
1810
559
9 81
713
586
4 93
21
963
51 8
54
Den
omin
ator
690
730
243
2 48
64
320
10 6
0410
604
2 27
614
3 01
913
098
150
408
230
352
178
476
1 24
4 17
8
KwaZ
ulu-
Nat
alIn
dica
tor
2.0
1.8
7.4
6.4
4.5
9.7
12.4
1.0
85.8
53.9
99.8
26.2
16.4
62.1
Sout
h Af
rica
Indi
cato
r2.
02.
08.
06.
34.
49.
912
.41.
382
.341
.696
.233
.019
.858
.0
Sour
ce:
DH
IS.
Annual trends
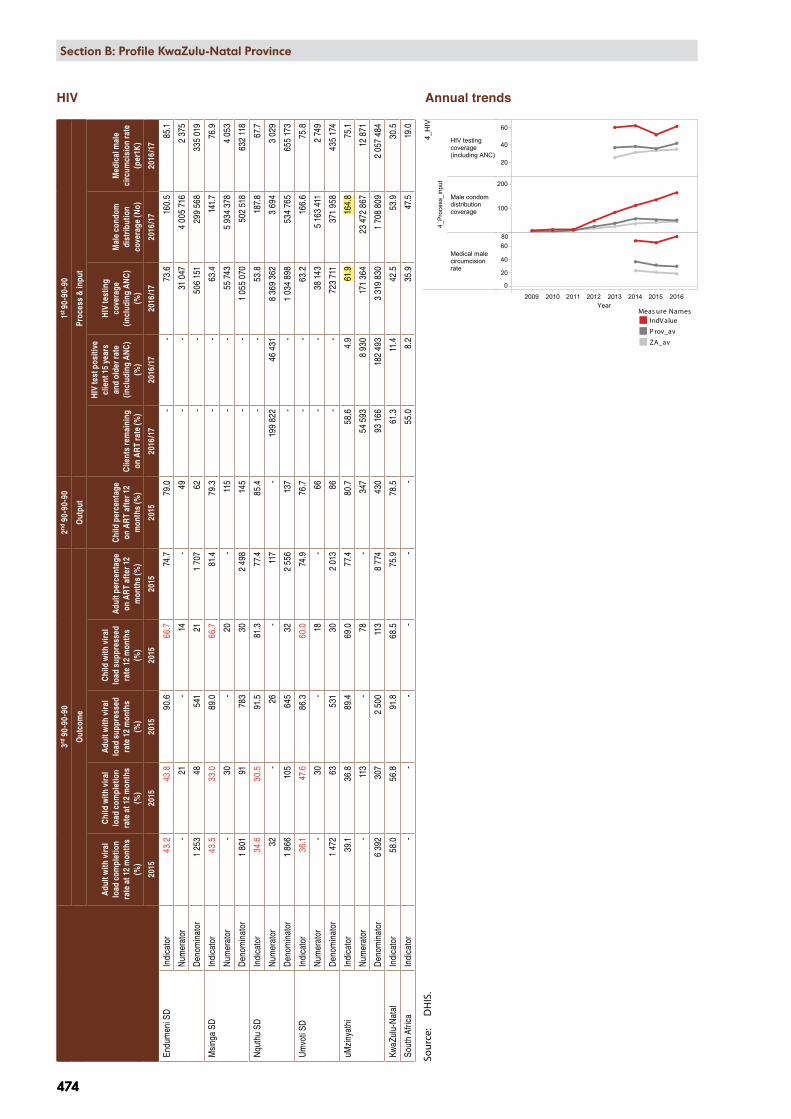
2009 2010 2011 2012 2013 2014 2015 2016Year
4_H
IV
4_P
roce
ss_i
nput
HIV testingcoverage(including ANC)
Male condomdistributioncoverage
Medical malecircumcisionrate
20
40
60
100
200
0
20
40
6080
KZN, DC24, uMzinyathi District Municipality, SEQ 1 (most deprived)
Measure NamesIndValueProv_avZA_av
Meas ure NamesIndV alue
P rov_av
ZA_av
474
Section B: National and District Profiles
474
Section B: Profile KwaZulu-Natal Province
HIV
3rd
90-
90-9
02nd
90-
90-9
01st
90-9
0-90
Out
com
eO
utpu
tPr
oces
s &
inpu
t
Adu
lt w
ith v
iral
load
com
plet
ion
rate
at 1
2 m
onth
s (%
)
Chi
ld w
ith v
iral
load
com
plet
ion
rate
at 1
2 m
onth
s (%
)
Adu
lt w
ith v
iral
load
sup
pres
sed
rate
12
mon
ths
(%)
Chi
ld w
ith v
iral
load
sup
pres
sed
rate
12
mon
ths
(%)
Adu
lt pe
rcen
tage
on
AR
T af
ter 1
2 m
onth
s (%
)
Chi
ld p
erce
ntag
e on
AR
T af
ter 1
2 m
onth
s (%
)C
lient
s re
mai
ning
on
AR
T ra
te (%
)
HIV
test
pos
itive
cl
ient
15
year
s an
d ol
der r
ate
(incl
udin
g A
NC
) (%
)
HIV
test
ing
cove
rage
(in
clud
ing
AN
C)
(%)
Mal
e co
ndom
di
strib
utio
n co
vera
ge (N
o)
Med
ical
mal
e ci
rcum
cisi
on ra
te
(per
1K)
2015
2015
2015
2015
2015
2015
2016
/17
2016
/17
2016
/17
2016
/17
2016
/17
Endu
men
i SD
Indi
cato
r43
.243
.890
.666
.774
.779
.0 -
-73
.616
0.5
85.1
Num
erat
or -
21 -
14 -
49 -
-31
047
4 00
5 71
62
375
Den
omin
ator
1 25
348
541
211
707
62 -
-50
6 15
129
9 56
833
5 01
9
Msi
nga
SDIn
dica
tor
43.5
33.0
89.0
66.7
81.4
79.3
- -
63.4
141.
776
.9
Num
erat
or -
30 -
20 -
115
- -
55 7
435
934
378
4 05
3
Den
omin
ator
1 80
191
783
302
498
145
- -
1 05
5 07
050
2 51
863
2 11
8
Nqu
thu
SDIn
dica
tor
34.6
30.5
91.5
81.3
77.4
85.4
- -
53.8
187.
867
.7
Num
erat
or32
-26
-11
7 -
199
822
46 4
318
369
362
3 69
43
029
Den
omin
ator
1 86
610
564
532
2 55
613
7 -
-1
034
898
534
765
655
173
Um
voti
SDIn
dica
tor
36.1
47.6
86.3
60.0
74.9
76.7
- -
63.2
166.
675
.8
Num
erat
or -
30 -
18 -
66 -
-38
143
5 16
3 41
12
749
Den
omin
ator
1 47
263
531
302
013
86 -
-72
3 71
137
1 95
843
5 17
4
uMzi
nyat
hi
Indi
cato
r39
.136
.889
.469
.077
.480
.758
.64.
961
.916
4.8
75.1
Num
erat
or -
113
- 78
- 34
754
593
8 93
017
1 36
423
472
867
12 8
71
Den
omin
ator
6 39
230
72
500
113
8 77
443
093
166
182
493
3 31
9 83
01
708
809
2 05
7 48
4
KwaZ
ulu-
Nat
alIn
dica
tor
58.0
56.8
91.8
68.5
75.9
78.5
61.3
11.4
42.5
53.9
30.5
Sout
h Af
rica
Indi
cato
r -
- -
- -
-55
.08.
235
.947
.519
.0
Sour
ce:
DH
IS.
Annual trends

2009 2010 2011 2012 2013 2014 2015 2016Year
5_TB
1_Im
pact
TB death rate(ETR.net)
TB DR clientdeath rate(EDRWeb)
2_O
utco
me
TB client lost tofollow up rate(ETR.Net)
TB clienttreatmentsuccess rate(ETR.net)
TB DR clientloss to follow uprate (EDRWeb)
TB DRtreatmentsuccess rate(EDRWeb)
TB Rifampicinresistanceconfirmed clientrate
TB/HIVco-infectedclient on ARTrate (ETR.Net)
4_P
roce
ss_i
nput
TB symptom 5years and olderscreened infacility rate
5
10
15
0
20
40
60
0
5
10
15
40
60
80
0
20
40
0
20
40
60
0
10
20
0
50
100
0
50
100
KZN, DC24, uMzinyathi District Municipality, SEQ 1 (most deprived)
Measure NamesIndValueProv_avZA_av
Meas ure NamesIndV alue
P rov_av
ZA_av
Section B: National and District Profiles
475
Section B: Profile KwaZulu-Natal Province
475
TB
I mpa
ctO
utco
me
Out
put
Proc
ess
& in
put
TB d
eath
rate
(E
TR.n
et) (
%)
TB D
R cl
ient
de
ath
rate
(E
DR
Web
) (%
)
TB c
lient
loss
to
follo
w u
p ra
te
(ETR
.Net
) (%
)
TB c
lient
tr
eatm
ent
succ
ess
rate
(E
TR.n
et) (
%)
TB D
R cl
ient
loss
to
follo
w u
p ra
te
(ED
RW
eb) (
%)
TB D
R tr
eatm
ent
succ
ess
rate
(E
DR
Web
) (%
)
TB R
ifam
pici
n re
sist
ance
co
nfirm
ed c
lient
ra
te (%
)
TB R
ifam
pici
n re
sist
ant c
lient
s tr
eatm
ent
initi
atio
n ra
te (%
)
TB/H
IV c
o-in
fect
ed c
lient
on
AR
T ra
te (E
TR.
Net
) (%
)
TB c
lient
initi
ated
on
trea
tmen
t ra
te (%
)
TB s
ympt
om 5
ye
ars
and
olde
r sc
reen
ed in
fa
cilit
y ra
te (%
)
2015
2014
2015
2015
2014
2014
2016
2016
2016
2016
2016
/17
Endu
men
i SD
In
dica
tor
7.6
-0.
589
.7 -
- -
-97
.2 -
71.1
Num
erat
or33
-2
390
- -
- -
139
-10
6 23
7
Den
omin
ator
435
-43
543
5 -
- -
-14
3 -
149
323
Msi
nga
SD
Indi
cato
r10
.0 -
0.7
86.5
- -
- -
99.2
-82
.3
Num
erat
or91
-6
785
- -
- -
508
-32
4 40
4
Den
omin
ator
907
-90
790
7 -
- -
-51
2 -
394
283
Nqu
thu
SD
Indi
cato
r9.
8 -
2.5
86.5
- -
- -
100.
0 -
40.3
Num
erat
or72
-18
633
- -
- -
282
-13
7 10
2
Den
omin
ator
732
-73
273
2 -
- -
-28
2 -
340
165
Um
voti
SD
Indi
cato
r13
.1 -
0.8
86.1
- -
- -
93.5
-77
.5
Num
erat
or63
-4
414
- -
- -
202
-23
2 43
3
Den
omin
ator
481
-48
148
1 -
- -
-21
6 -
299
760
uMzi
nyat
hi
Indi
cato
r10
.123
.31.
287
.06.
862
.57.
388
.798
.169
.867
.6
Num
erat
or25
941
302
222
1211
014
112
51
131
1 34
180
0 17
6
Den
omin
ator
2 55
517
62
555
2 55
517
617
61
922
141
1 15
31
922
1 18
3 53
1
KwaZ
ulu-
Nat
alIn
dica
tor
5.4
19.0
4.8
82.7
17.2
59.6
7.7
73.8
85.7
62.4
78.3
Sout
h Af
rica
Indi
cato
r6.
623
.06.
481
.017
.950
.56.
268
.088
.372
.851
.6
Sour
ce:
DH
IS.
Annual trends
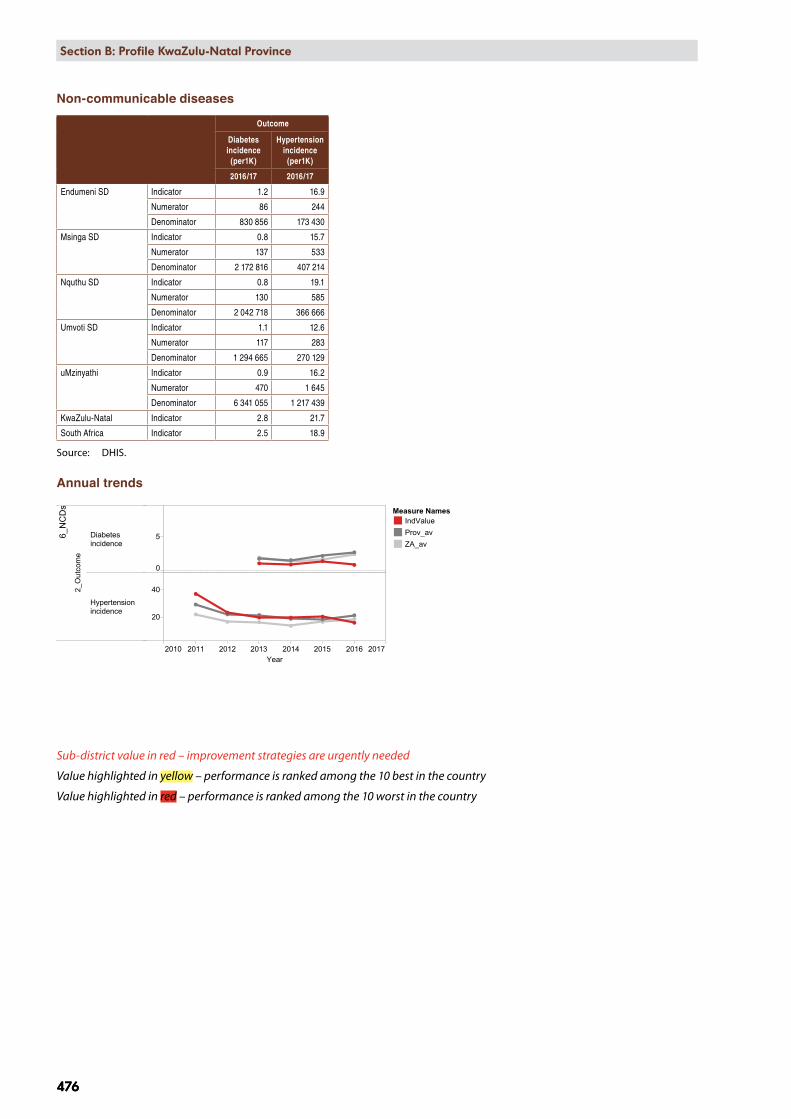
2010 2011 2012 2013 2014 2015 2016 2017Year
6_NCDs
2_Outcome
Diabetesincidence
Hypertensionincidence
0
5
20
40
KZN, DC24, uMzinyathi District Municipality, SEQ 1 (most deprived)
Measure NamesIndValueProv_avZA_av
476
Section B: National and District Profiles
476
Section B: Profile KwaZulu-Natal Province
Non-communicable diseases
Outcome
Diabetes incidence
(per1K)
Hypertension incidence
(per1K)
2016/17 2016/17
Endumeni SD Indicator 1.2 16.9
Numerator 86 244
Denominator 830 856 173 430
Msinga SD Indicator 0.8 15.7
Numerator 137 533
Denominator 2 172 816 407 214
Nquthu SD Indicator 0.8 19.1
Numerator 130 585
Denominator 2 042 718 366 666
Umvoti SD Indicator 1.1 12.6
Numerator 117 283
Denominator 1 294 665 270 129
uMzinyathi Indicator 0.9 16.2
Numerator 470 1 645
Denominator 6 341 055 1 217 439
KwaZulu-Natal Indicator 2.8 21.7
South Africa Indicator 2.5 18.9
Source: DHIS.
Annual trends
Sub-district value in red – improvement strategies are urgently needed
Value highlighted in yellow – performance is ranked among the 10 best in the country
Value highlighted in red – performance is ranked among the 10 worst in the country
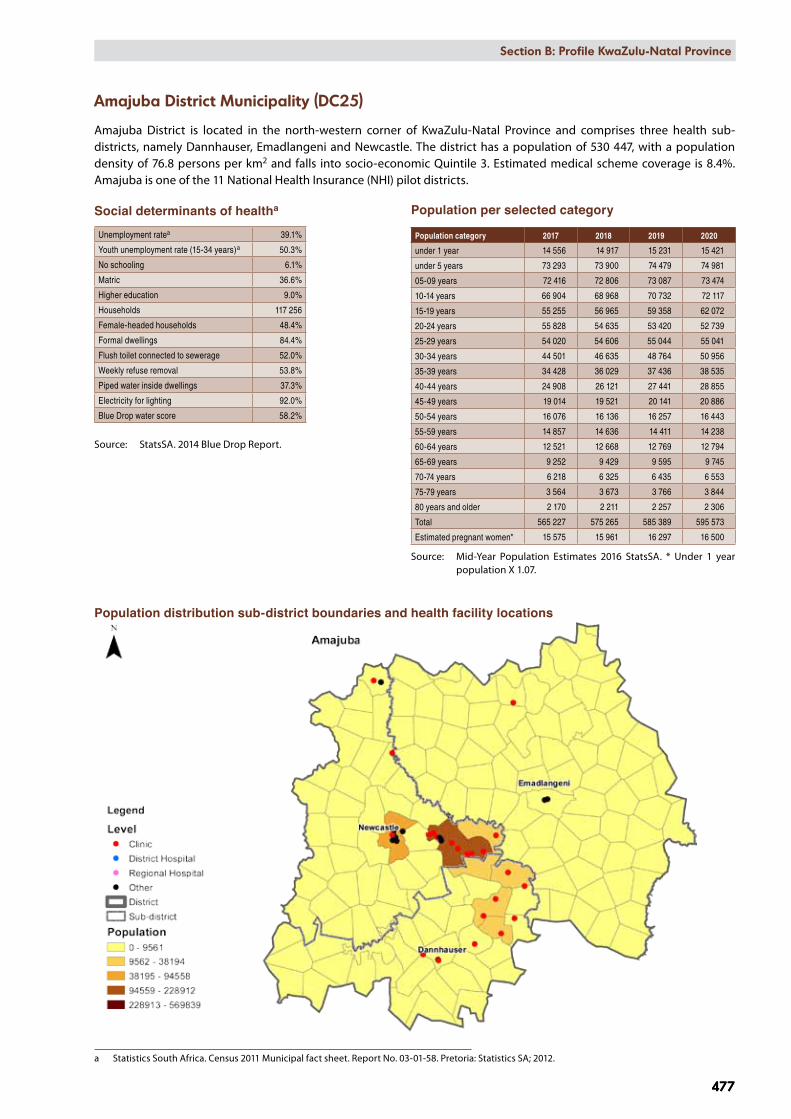
Section B: National and District Profiles
477
Section B: Profile KwaZulu-Natal Province
477
Amajuba District Municipality (DC25)
Amajuba District is located in the north-western corner of KwaZulu-Natal Province and comprises three health sub-districts, namely Dannhauser, Emadlangeni and Newcastle. The district has a population of 530 447, with a population density of 76.8 persons per km2 and falls into socio-economic Quintile 3. Estimated medical scheme coverage is 8.4%. Amajuba is one of the 11 National Health Insurance (NHI) pilot districts.
Social determinants of healtha
Unemployment ratea 39.1%
Youth unemployment rate (15-34 years)a 50.3%
No schooling 6.1%
Matric 36.6%
Higher education 9.0%
Households 117 256
Female-headed households 48.4%
Formal dwellings 84.4%
Flush toilet connected to sewerage 52.0%
Weekly refuse removal 53.8%
Piped water inside dwellings 37.3%
Electricity for lighting 92.0%
Blue Drop water score 58.2%
Source: StatsSA. 2014 Blue Drop Report.
Population distribution sub-district boundaries and health facility locations
a Statistics South Africa. Census 2011 Municipal fact sheet. Report No. 03-01-58. Pretoria: Statistics SA; 2012.
Population per selected category
Population category 2017 2018 2019 2020
under 1 year 14 556 14 917 15 231 15 421
under 5 years 73 293 73 900 74 479 74 981
05-09 years 72 416 72 806 73 087 73 474
10-14 years 66 904 68 968 70 732 72 117
15-19 years 55 255 56 965 59 358 62 072
20-24 years 55 828 54 635 53 420 52 739
25-29 years 54 020 54 606 55 044 55 041
30-34 years 44 501 46 635 48 764 50 956
35-39 years 34 428 36 029 37 436 38 535
40-44 years 24 908 26 121 27 441 28 855
45-49 years 19 014 19 521 20 141 20 886
50-54 years 16 076 16 136 16 257 16 443
55-59 years 14 857 14 636 14 411 14 238
60-64 years 12 521 12 668 12 769 12 794
65-69 years 9 252 9 429 9 595 9 745
70-74 years 6 218 6 325 6 435 6 553
75-79 years 3 564 3 673 3 766 3 844
80 years and older 2 170 2 211 2 257 2 306
Total 565 227 575 265 585 389 595 573
Estimated pregnant women* 15 575 15 961 16 297 16 500
Source: Mid-Year Population Estimates 2016 StatsSA. * Under 1 year population X 1.07.
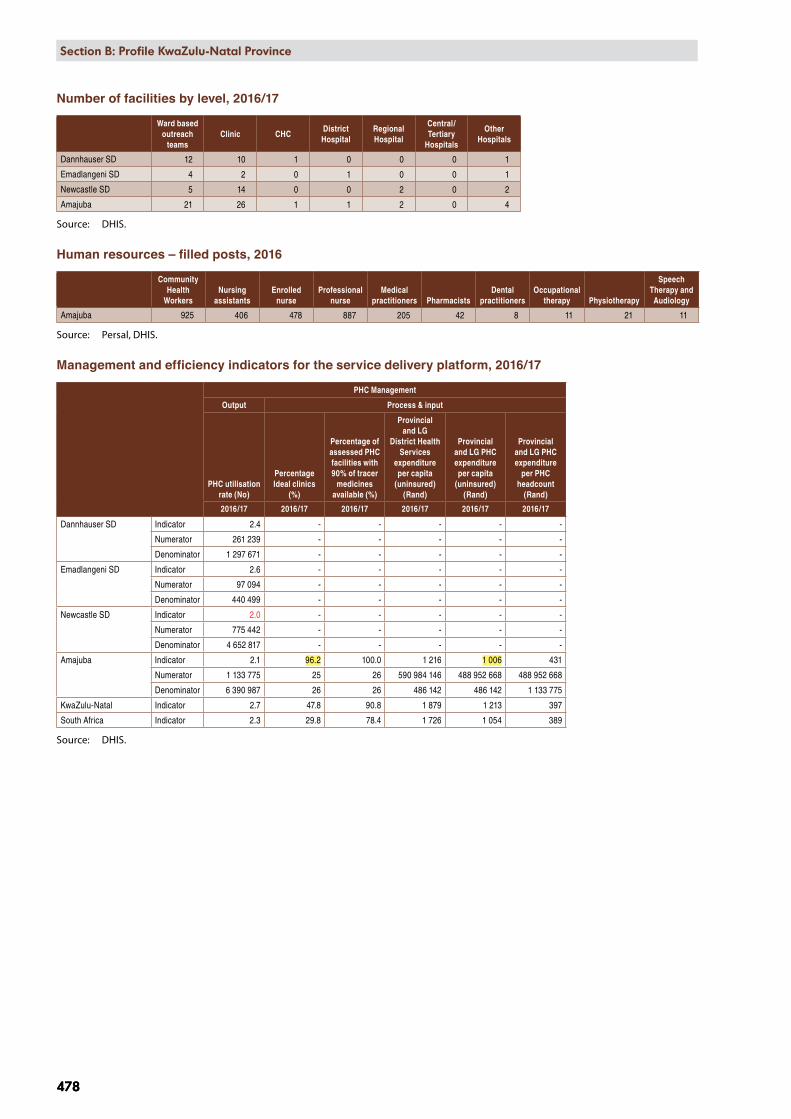
478
Section B: National and District Profiles
478
Section B: Profile KwaZulu-Natal Province
Number of facilities by level, 2016/17
Ward based outreach
teamsClinic CHC
District Hospital
Regional Hospital
Central/Tertiary
Hospitals
Other Hospitals
Dannhauser SD 12 10 1 0 0 0 1
Emadlangeni SD 4 2 0 1 0 0 1
Newcastle SD 5 14 0 0 2 0 2
Amajuba 21 26 1 1 2 0 4
Source: DHIS.
Human resources – filled posts, 2016
Community Health
WorkersNursing
assistantsEnrolled
nurseProfessional
nurseMedical
practitioners PharmacistsDental
practitionersOccupational
therapy Physiotherapy
Speech Therapy and Audiology
Amajuba 925 406 478 887 205 42 8 11 21 11
Source: Persal, DHIS.
Management and efficiency indicators for the service delivery platform, 2016/17
PHC Management
Output Process & input
PHC utilisation rate (No)
Percentage Ideal clinics
(%)
Percentage of assessed PHC facilities with 90% of tracer
medicines available (%)
Provincial and LG
District Health Services
expenditure per capita
(uninsured) (Rand)
Provincial and LG PHC expenditure per capita
(uninsured) (Rand)
Provincial and LG PHC expenditure
per PHC headcount
(Rand)
2016/17 2016/17 2016/17 2016/17 2016/17 2016/17
Dannhauser SD Indicator 2.4 - - - - -
Numerator 261 239 - - - - -
Denominator 1 297 671 - - - - -
Emadlangeni SD Indicator 2.6 - - - - -
Numerator 97 094 - - - - -
Denominator 440 499 - - - - -
Newcastle SD Indicator 2.0 - - - - -
Numerator 775 442 - - - - -
Denominator 4 652 817 - - - - -
Amajuba Indicator 2.1 96.2 100.0 1 216 1 006 431
Numerator 1 133 775 25 26 590 984 146 488 952 668 488 952 668
Denominator 6 390 987 26 26 486 142 486 142 1 133 775
KwaZulu-Natal Indicator 2.7 47.8 90.8 1 879 1 213 397
South Africa Indicator 2.3 29.8 78.4 1 726 1 054 389
Source: DHIS.
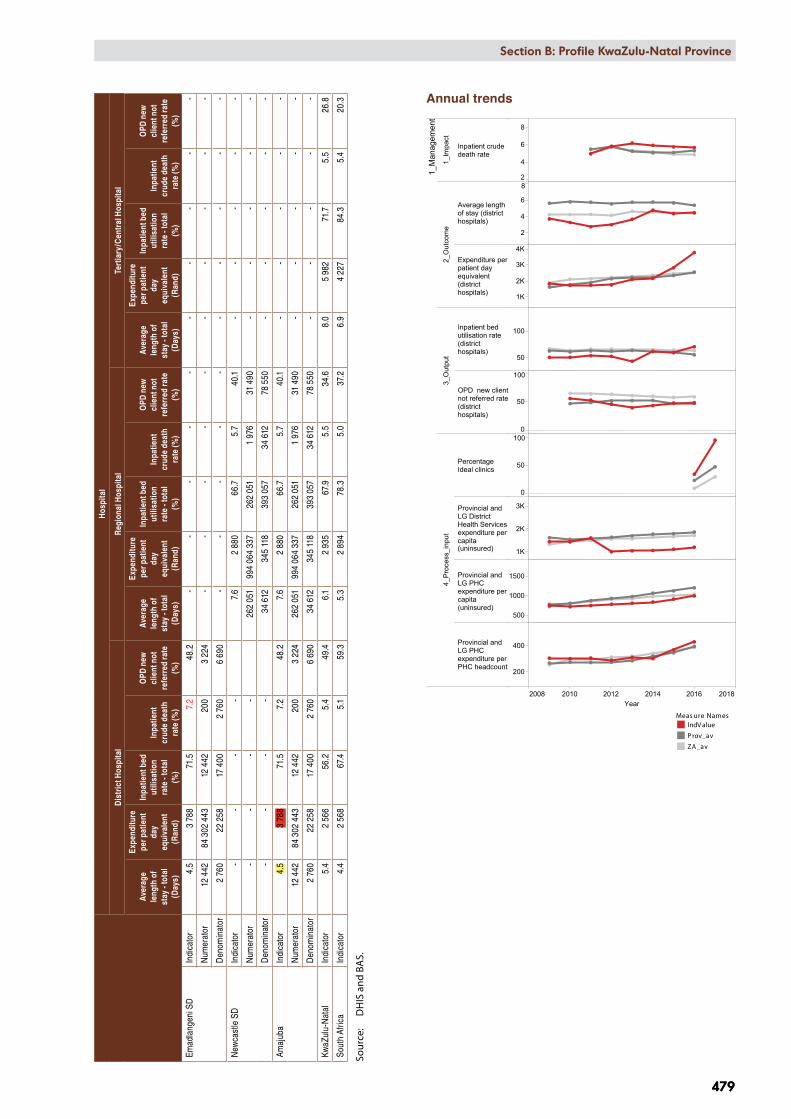
2008 2010 2012 2014 2016 2018Year
1_M
anag
emen
t
1_Im
pact
Inpatient crudedeath rate
2_O
utco
me
Average lengthof stay (districthospitals)
Expenditure perpatient dayequivalent(districthospitals)
3_O
utpu
t
Inpatient bedutilisation rate(districthospitals)
OPD new clientnot referred rate(districthospitals)
4_P
roce
ss_i
nput
PercentageIdeal clinics
Provincial andLG DistrictHealth Servicesexpenditure percapita(uninsured)
Provincial andLG PHCexpenditure percapita(uninsured)
Provincial andLG PHCexpenditure perPHC headcount
2
4
6
8
2
4
6
8
1K
2K
3K
4K
50
100
0
50
100
0
50
100
1K
2K
3K
500
1000
1500
200
400
KZN, DC25, Amajuba District Municipality, SEQ 3
Measure NamesIndValueProv_avZA_av
Meas ure NamesIndV alue
P rov_av
ZA_av
Section B: National and District Profiles
479
Section B: Profile KwaZulu-Natal Province
479
Hos
pita
l
Dis
tric
t Hos
pita
lR
egio
nal H
ospi
tal
Tert
iary
/Cen
tral
Hos
pita
l
Aver
age
leng
th o
f st
ay -
tota
l (D
ays)
Expe
nditu
re
per p
atie
nt
day
equi
vale
nt
(Ran
d)
Inpa
tient
bed
ut
ilisa
tion
rate
- to
tal
(%)
Inpa
tient
cr
ude
deat
h ra
te (%
)
OPD
new
cl
ient
not
re
ferr
ed ra
te
(%)
Aver
age
leng
th o
f st
ay -
tota
l (D
ays)
Expe
nditu
re
per p
atie
nt
day
equi
vale
nt
(Ran
d)
Inpa
tient
bed
ut
ilisa
tion
rate
- to
tal
(%)
Inpa
tient
cr
ude
deat
h ra
te (%
)
OPD
new
cl
ient
not
re
ferr
ed ra
te
(%)
Aver
age
leng
th o
f st
ay -
tota
l (D
ays)
Expe
nditu
re
per p
atie
nt
day
equi
vale
nt
(Ran
d)
Inpa
tient
bed
ut
ilisa
tion
rate
- to
tal
(%)
Inpa
tient
cr
ude
deat
h ra
te (%
)
OPD
new
cl
ient
not
re
ferr
ed ra
te
(%)
Emad
lang
eni S
DIn
dica
tor
4.5
3 78
871
.57.
248
.2 -
- -
- -
- -
- -
-
Num
erat
or12
442
84 3
02 4
4312
442
200
3 22
4 -
- -
- -
- -
- -
-
Den
omin
ator
2 76
022
258
17 4
002
760
6 69
0 -
- -
- -
- -
- -
-
New
cast
le S
DIn
dica
tor
- -
- -
7.
62
880
66.7
5.7
40.1
- -
- -
-
Num
erat
or -
- -
-
262
051
994
064
337
262
051
1 97
631
490
- -
- -
-
Den
omin
ator
- -
- -
34
612
345
118
393
057
34 6
1278
550
- -
- -
-
Amaj
uba
Indi
cato
r4.
53
788
71.5
7.2
48.2
7.6
2 88
066
.75.
740
.1 -
- -
- -
Num
erat
or12
442
84 3
02 4
4312
442
200
3 22
426
2 05
199
4 06
4 33
726
2 05
11
976
31 4
90 -
- -
- -
Den
omin
ator
2 76
022
258
17 4
002
760
6 69
034
612
345
118
393
057
34 6
1278
550
- -
- -
-
KwaZ
ulu-
Nat
alIn
dica
tor
5.4
2 56
656
.25.
449
.46.
12
935
67.9
5.5
34.6
8.0
5 98
271
.75.
526
.8
Sout
h Af
rica
Indi
cato
r4.
42
568
67.4
5.1
59.3
5.3
2 89
478
.35.
037
.26.
94
227
84.3
5.4
20.3
Sour
ce:
DH
IS a
nd B
AS.
Annual trends

480
Section B: National and District Profiles
480
Section B: Profile KwaZulu-Natal Province
Deaths and Patient day equivalent 2014/15 – 2016/17
Dat
a El
emen
t(N
umbe
r)
2014
/15
2015
/16
2016
/17
PHC
/ CH
C / M
OU
*D
istr
ict
Hos
pita
lR
egio
nal
Hos
pita
l
Cen
tral
/te
rtia
ry
Hos
pita
lD
istr
ict
Tota
lPH
C / C
HC
/ MO
UD
istr
ict
Hos
pita
lR
egio
nal
Hos
pita
l
Cen
tral
/te
rtia
ry
Hos
pita
lD
istr
ict
Tota
lPH
C / C
HC
/ MO
UD
istr
ict
Hos
pita
lR
egio
nal
Hos
pita
l
Cen
tral
/te
rtia
ry
hosp
ital
Dis
tric
t To
tal
Mat
erna
l dea
ths
--
20-
20-
-14
-14
-2
9-
11
Live
birt
hs68
563
012
650
-13
965
601
582
7 47
7-
8 66
071
853
77
185
-8
440
Still
birth
s21
1028
4-
315
85
216
-22
96
619
8-
210
Child (under 5 years)
Infant (under 1
year)
Neo-natal
Dea
th in
faci
lity
0-7d
ays
-2
107
-10
91
287
-90
15
96-
102
Dea
th in
faci
lity
8-28
day
s -
428
-32
-2
26-
28-
114
-15
Dea
th in
faci
lity
29 d
ays
- 11
mon
ths
-7
32-
39-
125
-26
-1
22-
23
Dea
th in
faci
lity
12 –
59
mon
ths
-2
14-
16-
26
-8
-1
19-
20
Dia
rrho
ea d
eath
und
er 5
yea
rs
-3
13-
16-
-6
-6
--
3-
3
Pneu
mon
ia d
eath
und
er 5
yea
rs-
14
-5
--
8-
8-
-8
-8
Seve
re a
cute
mal
nutri
tion
deat
h un
der 5
yea
rs
--
20-
20-
39
-12
--
7-
7
TB D
eath
s 32
415
951
9-
1 00
226
114
745
9-
867
--
--
-
Inpa
tient
dea
th to
tal
-18
31
962
-2
145
-18
61
989
-2
175
-20
01
976
-2
176
Patie
nt d
ay e
quiv
alen
t-
33 6
9335
5 48
4-
389
177
727
748
329
622
-35
7 37
73
592
22 2
5834
5 11
8-
370
968
Sour
ce:
DH
IS. *
MO
U –
Mat
erna
l Obs
tetr
ic U
nit.

AgeGroup.. Female Male<5 years
5-1415-2425-64
65+Total 27%
15%25%
33%35%
75%
23%4%
35%38%
23%6%
46%79%
36%17%
23%14%
4%2%4%
12%19%
5%
25%17%
22%14%
34%75%
25%7%
35%14%
17%5%
36%72%
29%15%
19%11%
14%3%
14%57%
30%8%
KZN, Amajuba: DC25, 2010 - 2015
Rank.. Female Male
<5 y
ears
12345678910
5-14
12345678910
15-2
4
12345678910
25-6
4
12345678910
65+
12345678910
Congenital heart anomalies (2.3%)Sepsis/other newborn infectious (2.3%)
Birth asphyxia (6.4%)Protein-energy malnutrition (4.6%)
Other respiratory (2.9%)
Preterm birth complications (17.5%)Diarrhoeal diseases (20.1%)Lower respiratory infections (20.3%)
Tuberculosis (3.1%)HIV/AIDS (2.9%)
Other respiratory (2.8%)
Epilepsy (3.4%)Fires, hot substances (3.2%)
Asthma (3.8%)Meningitis/encephalitis (4.5%)
Road injuries (12.9%)Diarrhoeal diseases (13.2%)
Lower respiratory infections (20.1%)Tuberculosis (15.3%)
HIV/AIDS (11.3%)
Other respiratory (1.8%)
Epilepsy (2.2%)
Meningitis/encephalitis (3.8%)Accidental threats to breathing (3.8%)Road injuries (3.6%)
Nephritis/nephrosis (1.9%)
Diarrhoeal diseases (5.8%)
Lower respiratory infections (18.2%)Tuberculosis (23.9%)
HIV/AIDS (16.9%)
Cervix (2.9%)Meningitis/encephalitis (2.7%)
Nephritis/nephrosis (3.0%)Hypertensive heart disease (3.4%)Diabetes mellitus (3.7%)
Diarrhoeal diseases (6.1%)Cerebrovascular disease (5.6%)
Lower respiratory infections (14.0%)
Tuberculosis (18.4%)HIV/AIDS (16.8%)
Cervix (2.3%)Cardiomyopathy (2.5%)
Nephritis/nephrosis (4.6%)
Hypertensive heart disease (12.2%)Diabetes mellitus (9.6%)
Diarrhoeal diseases (4.0%)
Ischaemic heart disease (6.7%)
Cerebrovascular disease (21.5%)
Lower respiratory infections (9.1%)
Tuberculosis (3.1%)
Other perinatal conditions (2.9%)Sepsis/other newborn infectious (3.2%)
Birth asphyxia (6.3%)Protein-energy malnutrition (3.5%)
Preterm birth complications (16.9%)
Septicaemia (2.2%)
Diarrhoeal diseases (19.9%)Lower respiratory infections (20.1%)
Tuberculosis (3.3%)
HIV/AIDS (2.3%)
Drowning (9.1%)
Other respiratory (4.6%)Fires, hot substances (5.4%)
Meningitis/encephalitis (4.2%)
Accidental threats to breathing (6.0%)
Road injuries (11.6%)Diarrhoeal diseases (11.4%)
Lower respiratory infections (16.2%)
Tuberculosis (10.8%)
HIV/AIDS (9.0%)
Drowning (4.1%)Meningitis/encephalitis (3.4%)
Mechanical forces (5.2%)
Accidental threats to breathing (12.8%)
Interpersonal violence (18.6%)Road injuries (14.9%)
Cerebrovascular disease (3.1%)
Lower respiratory infections (7.2%)Tuberculosis (8.9%)
HIV/AIDS (5.8%)
Accidental threats to breathing (2.5%)
Road injuries (4.7%)
Nephritis/nephrosis (2.4%)Diabetes mellitus (2.4%)
Diarrhoeal diseases (4.2%)Ischaemic heart disease (3.6%)
Cerebrovascular disease (4.3%)
Lower respiratory infections (14.8%)Tuberculosis (20.0%)
HIV/AIDS (14.7%)
Prostate (3.6%)COPD (3.8%)Nephritis/nephrosis (4.9%)
Hypertensive heart disease (8.8%)
Diabetes mellitus (6.4%)
Diarrhoeal diseases (3.0%)
Ischaemic heart disease (7.8%)
Cerebrovascular disease (14.5%)Lower respiratory infections (12.4%)
Tuberculosis (5.7%)
Rank.. Maternal conditions All other causes
Fem
ale
15-4
9
12345678910
Maternal sepsis (5.2%) n=5
Abortion (8.8%) n=8Maternal haemorrhage (9.2%) n=8
Hypertension in pregnancy (8.2%) n=8
Other maternal (25.7%) n=24Indirect maternal (43.0%) n=40
Endocrine nutritional,blood, immune (2.0%) n=115
Road injuries (2.2%) n=124Cervix (2.3%) n=128
Nephritis/nephrosis (2.2%) n=122
Cerebrovascular disease (2.0%) n=111
Meningitis/encephalitis (3.5%) n=195Diarrhoeal diseases (6.9%) n=388
Lower respiratory infections (16.7%) n=945
Tuberculosis (23.5%) n=1 328HIV/AIDS (21.2%) n=1 198
Percentage ofdeaths by broad
causes andsingle leading
causes
BroadcauseInjury
NCD
HIV and TB
Comm_mat_peri_nut
Prov, DistrictKZN, Amajuba: DC25
Show history
Percentages are shownaccording to all the deaths
within the age/gendercategory of each box,
although only the leading10 causes are displayed.
Section B: National and District Profiles
481
Section B: Profile KwaZulu-Natal Province
481
Burden of disease profile
For the percentage of deaths by broad cause, deaths are classified into four groups namely: (i) injuries; (ii) non-communicable diseases; (iii) HIV and TB; and (iv) communicable diseases together with maternal perinatal and nutritional conditions. Data are given by gender and age group for the period 2010–2015. The second part of the graph shows the 10 leading single causes of death within each age group (both genders) for 2010–2015 combined.
Percentage of deaths by broad cause and leading causes 2010–2015
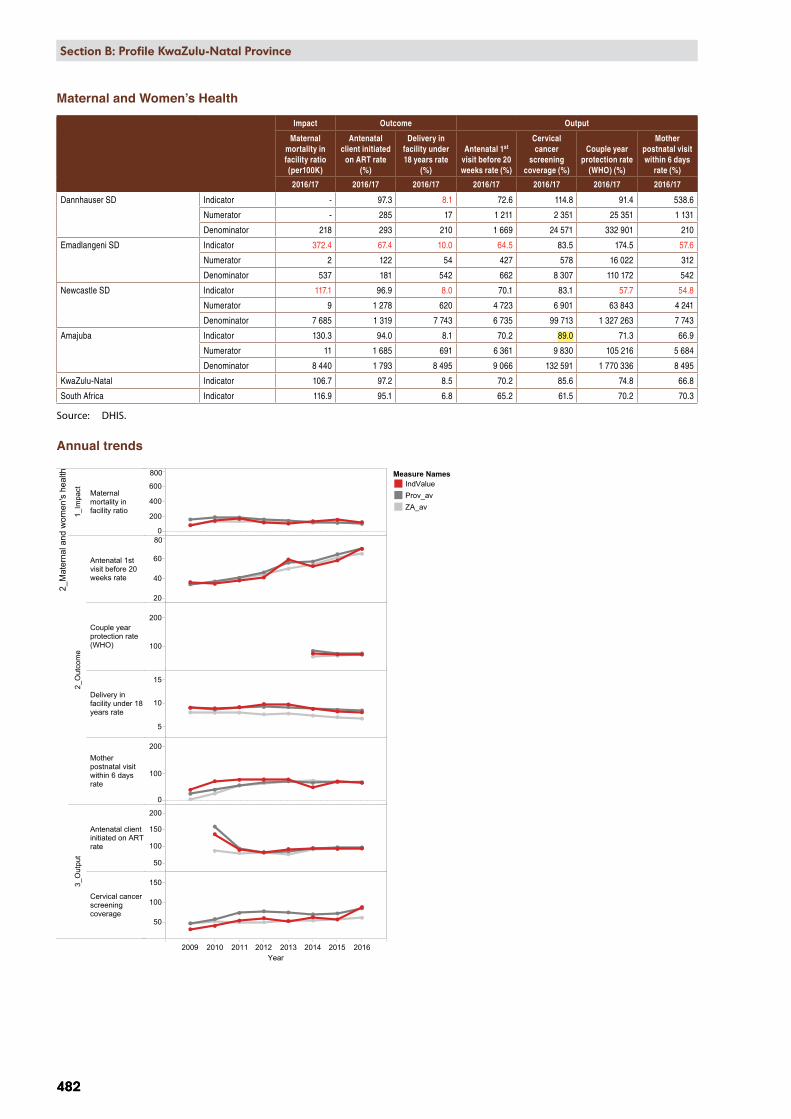
2009 2010 2011 2012 2013 2014 2015 2016Year
2_M
ater
nal a
nd w
omen
's h
ealth
1_Im
pact Maternal
mortality infacility ratio
2_O
utco
me
Antenatal 1stvisit before 20weeks rate
Couple yearprotection rate(WHO)
Delivery infacility under 18years rate
Motherpostnatal visitwithin 6 daysrate
3_O
utpu
t
Antenatal clientinitiated on ARTrate
Cervical cancerscreeningcoverage
0
200
400
600
800
20
40
60
80
100
200
5
10
15
0
100
200
50
100
150
200
50
100
150
KZN, DC25, Amajuba District Municipality, SEQ 3
Measure NamesIndValueProv_avZA_av
482
Section B: National and District Profiles
482
Section B: Profile KwaZulu-Natal Province
Maternal and Women’s Health
Impact Outcome Output
Maternal mortality in facility ratio (per100K)
Antenatal client initiated
on ART rate (%)
Delivery in facility under 18 years rate
(%)
Antenatal 1st visit before 20 weeks rate (%)
Cervical cancer
screening coverage (%)
Couple year protection rate
(WHO) (%)
Mother postnatal visit within 6 days
rate (%)
2016/17 2016/17 2016/17 2016/17 2016/17 2016/17 2016/17
Dannhauser SD Indicator - 97.3 8.1 72.6 114.8 91.4 538.6
Numerator - 285 17 1 211 2 351 25 351 1 131
Denominator 218 293 210 1 669 24 571 332 901 210
Emadlangeni SD Indicator 372.4 67.4 10.0 64.5 83.5 174.5 57.6
Numerator 2 122 54 427 578 16 022 312
Denominator 537 181 542 662 8 307 110 172 542
Newcastle SD Indicator 117.1 96.9 8.0 70.1 83.1 57.7 54.8
Numerator 9 1 278 620 4 723 6 901 63 843 4 241
Denominator 7 685 1 319 7 743 6 735 99 713 1 327 263 7 743
Amajuba Indicator 130.3 94.0 8.1 70.2 89.0 71.3 66.9
Numerator 11 1 685 691 6 361 9 830 105 216 5 684
Denominator 8 440 1 793 8 495 9 066 132 591 1 770 336 8 495
KwaZulu-Natal Indicator 106.7 97.2 8.5 70.2 85.6 74.8 66.8
South Africa Indicator 116.9 95.1 6.8 65.2 61.5 70.2 70.3
Source: DHIS.
Annual trends

2009 2010 2011 2012 2013 2014 2015 2016Year
3_C
hild
and
sch
ool h
ealth
1_Im
pact
Child under 5years diarrhoeacase fatality rate
Child under 5yearspneumoniacase fatality rate
Child under 5years severeacutemalnutritioncase fatality rate
Inpatient earlyneonatal deathrate
3_O
utpu
t
Immunisationcoverage under1 year
Infantexclusivelybreastfed atDTaP-IPV-Hib-HBV 3rd doserate
Measles 2nddose coverage
School Grade 1screeningcoverage
0
50
100
0
10
20
30
0
20
40
60
0
10
20
50
100
150
20
40
60
80
50
100
150
0
50
100
KZN, DC25, Amajuba District Municipality, SEQ 3
Measure NamesIndValueProv_avZA_av
Meas ure NamesIndV alue
P rov_av
ZA_av
Section B: National and District Profiles
483
Section B: Profile KwaZulu-Natal Province
483
Child and School HealthIm
pact
Out
com
eO
utpu
t
Chi
ld u
nder
5
year
s di
arrh
oea
case
fata
lity
rate
(%)
Chi
ld u
nder
5
year
s pn
eum
onia
ca
se fa
talit
y ra
te (%
)
Chi
ld u
nder
5
year
s se
vere
acu
te
mal
nutr
ition
ca
se fa
talit
y ra
te (%
)
Inpa
tient
de
ath
unde
r 1
year
rate
(%)
Inpa
tient
de
ath
unde
r 5
year
rate
(%)
Inpa
tient
ea
rly n
eona
tal
deat
h ra
te
(per
1K)
Inpa
tient
ne
onat
al
deat
h ra
te
(per
1K)
Infa
nt P
CR
test
pos
itive
ar
ound
10
wee
ks ra
te
(%)
Imm
unis
atio
n co
vera
ge
unde
r 1 y
ear
(%)
Infa
nt
excl
usiv
ely
brea
stfe
d at
D
TaP-
IPV-
Hib
-H
BV
3rd d
ose
rate
(%)
Mea
sles
2nd
dos
e co
vera
ge (%
)
Scho
ol G
rade
1
scre
enin
g co
vera
ge (%
)
Scho
ol G
rade
8
scre
enin
g co
vera
ge (%
)
Vita
min
A
dose
12-
59
mon
ths
cove
rage
(%)
2016
/17
2016
/17
2016
/17
2016
/17
2016
/17
2016
/17
2016
/17
2016
/17
2016
/17
2016
/17
2016
/17
2016
/17
2016
/17
2016
/17
Dan
nhau
ser S
D
Indi
cato
r -
- -
- -
- -
1.1
66.2
64.9
85.4
46.3
15.5
84.1
Num
erat
or -
- -
- -
- -
42
025
1 05
82
478
1 32
348
418
571
Den
omin
ator
- -
- -
-21
821
837
136
696
1 62
934
824
2 85
63
128
265
116
Emad
lang
eni S
D
Indi
cato
r -
- -
4.0
2.3
9.3
11.2
-60
.659
.510
4.6
51.8
28.4
52.6
Num
erat
or -
- -
78
56
-53
233
689
642
734
13
556
Den
omin
ator
8610
412
173
343
537
537
138
10 5
3656
510
281
825
1 19
981
120
New
cast
le S
D
Indi
cato
r0.
71.
16.
86.
14.
012
.614
.41.
181
.955
.793
.262
.712
.458
.6
Num
erat
or3
87
133
152
9711
117
7 16
63
800
7 93
05
273
838
38 7
71
Den
omin
ator
455
707
103
2 17
23
766
7 68
57
685
1 59
510
5 05
76
818
102
117
8 41
16
744
793
602
Amaj
uba
Indi
cato
r0.
61.
06.
16.
03.
912
.113
.91.
076
.657
.692
.158
.115
.064
.1
Num
erat
or3
87
140
160
102
117
219
723
5 19
411
304
7 02
31
663
60 8
98
Den
omin
ator
541
811
115
2 34
54
109
8 44
08
440
2 10
415
2 28
99
012
147
222
145
104
132
852
1 13
9 83
8
KwaZ
ulu-
Nat
alIn
dica
tor
2.0
1.8
7.4
6.4
4.5
9.7
12.4
1.0
85.8
53.9
99.8
26.2
16.4
62.1
Sout
h Af
rica
Indi
cato
r2.
02.
08.
06.
34.
49.
912
.41.
382
.341
.696
.233
.019
.858
.0
Sour
ce:
DH
IS.
Annual trends
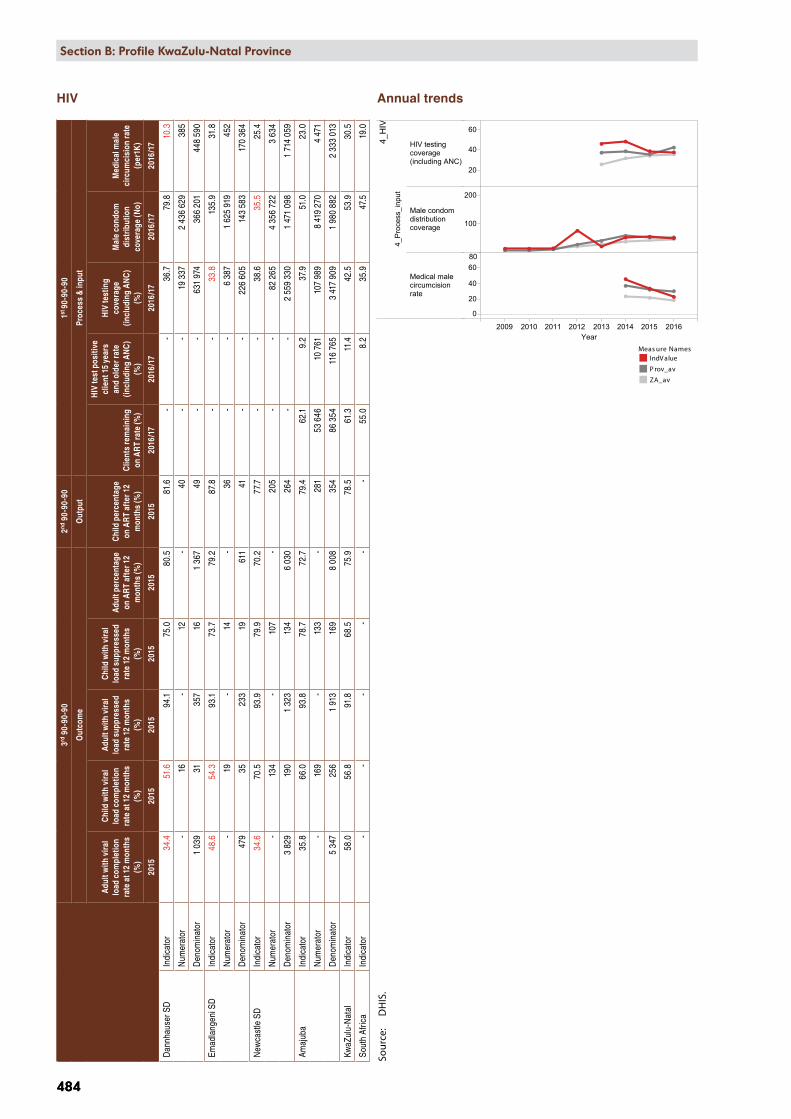
2009 2010 2011 2012 2013 2014 2015 2016Year
4_H
IV
4_P
roce
ss_i
nput
HIV testingcoverage(including ANC)
Male condomdistributioncoverage
Medical malecircumcisionrate
20
40
60
100
200
0
20
40
6080
KZN, DC25, Amajuba District Municipality, SEQ 3
Measure NamesIndValueProv_avZA_av
Meas ure NamesIndV alue
P rov_av
ZA_av
484
Section B: National and District Profiles
484
Section B: Profile KwaZulu-Natal Province
HIV
3rd
90-
90-9
02nd
90-
90-9
01st
90-9
0-90
Out
com
eO
utpu
tPr
oces
s &
inpu
t
Adu
lt w
ith v
iral
load
com
plet
ion
rate
at 1
2 m
onth
s (%
)
Chi
ld w
ith v
iral
load
com
plet
ion
rate
at 1
2 m
onth
s (%
)
Adu
lt w
ith v
iral
load
sup
pres
sed
rate
12
mon
ths
(%)
Chi
ld w
ith v
iral
load
sup
pres
sed
rate
12
mon
ths
(%)
Adu
lt pe
rcen
tage
on
AR
T af
ter 1
2 m
onth
s (%
)
Chi
ld p
erce
ntag
e on
AR
T af
ter 1
2 m
onth
s (%
)C
lient
s re
mai
ning
on
AR
T ra
te (%
)
HIV
test
pos
itive
cl
ient
15
year
s an
d ol
der r
ate
(incl
udin
g A
NC
) (%
)
HIV
test
ing
cove
rage
(in
clud
ing
AN
C)
(%)
Mal
e co
ndom
di
strib
utio
n co
vera
ge (N
o)
Med
ical
mal
e ci
rcum
cisi
on ra
te
(per
1K)
2015
2015
2015
2015
2015
2015
2016
/17
2016
/17
2016
/17
2016
/17
2016
/17
Dan
nhau
ser S
D
Indi
cato
r34
.451
.694
.175
.080
.581
.6 -
-36
.779
.810
.3
Num
erat
or -
16 -
12 -
40 -
-19
337
2 43
6 62
938
5
Den
omin
ator
1 03
931
357
161
367
49 -
-63
1 97
436
6 20
144
8 59
0
Emad
lang
eni S
D
Indi
cato
r48
.654
.393
.173
.779
.287
.8 -
-33
.813
5.9
31.8
Num
erat
or -
19 -
14 -
36 -
-6
387
1 62
5 91
945
2
Den
omin
ator
479
3523
319
611
41 -
-22
6 60
514
3 58
317
0 36
4
New
cast
le S
D
Indi
cato
r34
.670
.593
.979
.970
.277
.7 -
-38
.635
.525
.4
Num
erat
or -
134
-10
7 -
205
- -
82 2
654
356
722
3 63
4
Den
omin
ator
3 82
919
01
323
134
6 03
026
4 -
-2
559
330
1 47
1 09
81
714
059
Amaj
uba
Indi
cato
r35
.866
.093
.878
.772
.779
.462
.19.
237
.951
.023
.0
Num
erat
or -
169
-13
3 -
281
53 6
4610
761
107
989
8 41
9 27
04
471
Den
omin
ator
5 34
725
61
913
169
8 00
835
486
354
116
765
3 41
7 90
91
980
882
2 33
3 01
3
KwaZ
ulu-
Nat
alIn
dica
tor
58.0
56.8
91.8
68.5
75.9
78.5
61.3
11.4
42.5
53.9
30.5
Sout
h Af
rica
Indi
cato
r -
- -
- -
-55
.08.
235
.947
.519
.0
Sour
ce:
DH
IS.
Annual trends
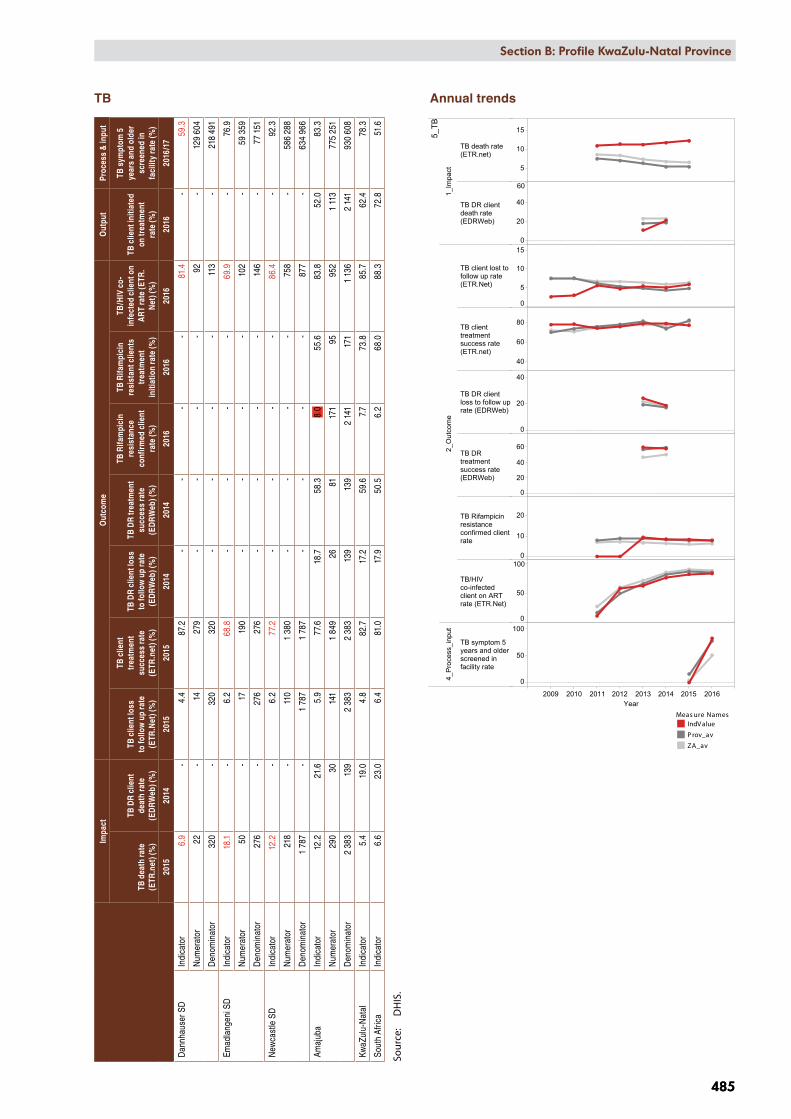
2009 2010 2011 2012 2013 2014 2015 2016Year
5_TB
1_Im
pact
TB death rate(ETR.net)
TB DR clientdeath rate(EDRWeb)
2_O
utco
me
TB client lost tofollow up rate(ETR.Net)
TB clienttreatmentsuccess rate(ETR.net)
TB DR clientloss to follow uprate (EDRWeb)
TB DRtreatmentsuccess rate(EDRWeb)
TB Rifampicinresistanceconfirmed clientrate
TB/HIVco-infectedclient on ARTrate (ETR.Net)
4_P
roce
ss_i
nput
TB symptom 5years and olderscreened infacility rate
5
10
15
0
20
40
60
0
5
10
15
40
60
80
0
20
40
0
20
40
60
0
10
20
0
50
100
0
50
100
KZN, DC25, Amajuba District Municipality, SEQ 3
Measure NamesIndValueProv_avZA_av
Meas ure NamesIndV alue
P rov_av
ZA_av
Section B: National and District Profiles
485
Section B: Profile KwaZulu-Natal Province
485
TB
I mpa
ctO
utco
me
Out
put
Proc
ess
& in
put
TB d
eath
rate
(E
TR.n
et) (
%)
TB D
R cl
ient
de
ath
rate
(E
DR
Web
) (%
)
TB c
lient
loss
to
follo
w u
p ra
te
(ETR
.Net
) (%
)
TB c
lient
tr
eatm
ent
succ
ess
rate
(E
TR.n
et) (
%)
TB D
R cl
ient
loss
to
follo
w u
p ra
te
(ED
RW
eb) (
%)
TB D
R tr
eatm
ent
succ
ess
rate
(E
DR
Web
) (%
)
TB R
ifam
pici
n re
sist
ance
co
nfirm
ed c
lient
ra
te (%
)
TB R
ifam
pici
n re
sist
ant c
lient
s tr
eatm
ent
initi
atio
n ra
te (%
)
TB/H
IV c
o-in
fect
ed c
lient
on
AR
T ra
te (E
TR.
Net
) (%
)
TB c
lient
initi
ated
on
trea
tmen
t ra
te (%
)
TB s
ympt
om 5
ye
ars
and
olde
r sc
reen
ed in
fa
cilit
y ra
te (%
)
2015
2014
2015
2015
2014
2014
2016
2016
2016
2016
2016
/17
Dan
nhau
ser S
D
Indi
cato
r6.
9 -
4.4
87.2
- -
- -
81.4
-59
.3
Num
erat
or22
-14
279
- -
- -
92 -
129
604
Den
omin
ator
320
-32
032
0 -
- -
-11
3 -
218
491
Emad
lang
eni S
D
Indi
cato
r18
.1 -
6.2
68.8
- -
- -
69.9
-76
.9
Num
erat
or50
-17
190
- -
- -
102
-59
359
Den
omin
ator
276
-27
627
6 -
- -
-14
6 -
77 1
51
New
cast
le S
D
Indi
cato
r12
.2 -
6.2
77.2
- -
- -
86.4
-92
.3
Num
erat
or21
8 -
110
1 38
0 -
- -
-75
8 -
586
288
Den
omin
ator
1 78
7 -
1 78
71
787
- -
- -
877
-63
4 96
6
Amaj
uba
Indi
cato
r12
.221
.65.
977
.618
.758
.38.
055
.683
.852
.083
.3
Num
erat
or29
030
141
1 84
926
8117
195
952
1 11
377
5 25
1
Den
omin
ator
2 38
313
92
383
2 38
313
913
92
141
171
1 13
62
141
930
608
KwaZ
ulu-
Nat
alIn
dica
tor
5.4
19.0
4.8
82.7
17.2
59.6
7.7
73.8
85.7
62.4
78.3
Sout
h Af
rica
Indi
cato
r6.
623
.06.
481
.017
.950
.56.
268
.088
.372
.851
.6
Sour
ce:
DH
IS.
Annual trends

2010 2011 2012 2013 2014 2015 2016 2017Year
6_NCDs
2_Outcome
Diabetesincidence
Hypertensionincidence
0
5
20
40
KZN, DC25, Amajuba District Municipality, SEQ 3
Measure NamesIndValueProv_avZA_av
486
Section B: National and District Profiles
486
Section B: Profile KwaZulu-Natal Province
Non-communicable diseases
Outcome
Diabetes incidence
(per1K)
Hypertension incidence
(per1K)
2016/17 2016/17
Dannhauser SD Indicator 0.7 7.0
Numerator 74 160
Denominator 1 297 671 274 254
Emadlangeni SD Indicator 3.5 31.0
Numerator 127 253
Denominator 440 499 97 950
Newcastle SD Indicator 1.3 27.7
Numerator 522 2 462
Denominator 4 652 817 1 066 221
Amajuba Indicator 1.4 24.0
Numerator 723 2 875
Denominator 6 390 987 1 438 425
KwaZulu-Natal Indicator 2.8 21.7
South Africa Indicator 2.5 18.9
Source: DHIS.
Annual trends
Sub-district value in red – improvement strategies are urgently needed
Value highlighted in yellow – performance is ranked among the 10 best in the country
Value highlighted in red – performance is ranked among the 10 worst in the country
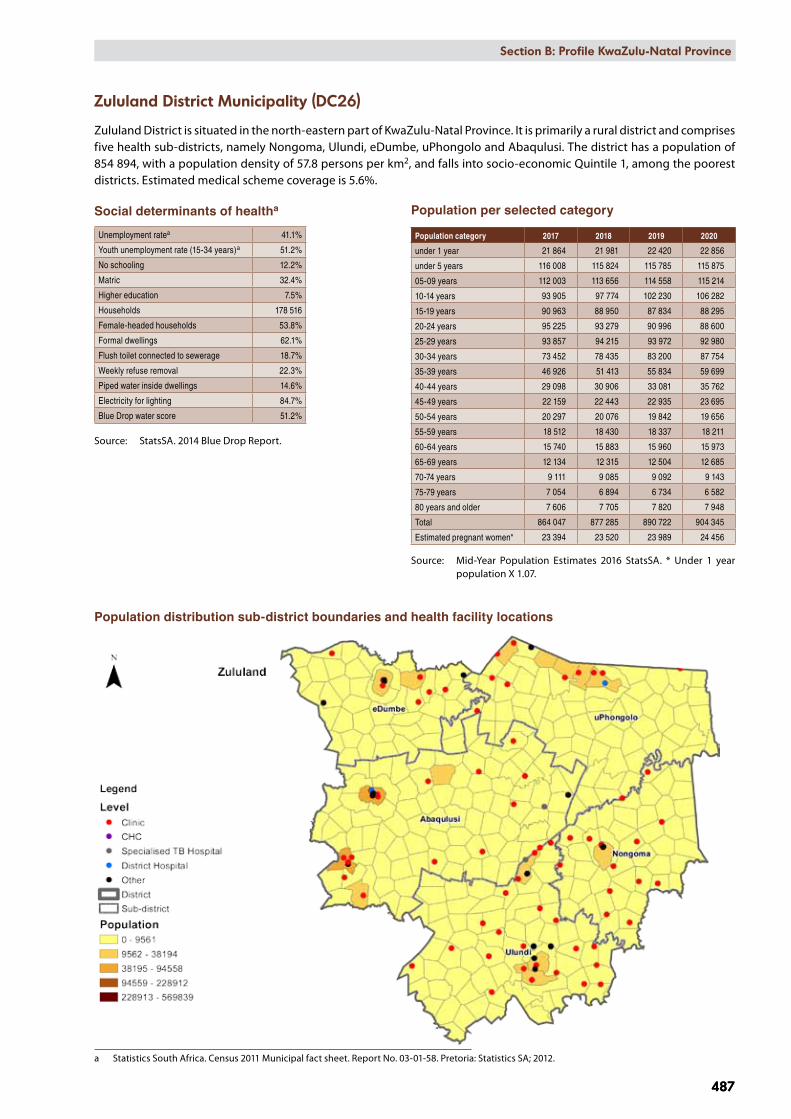
Section B: National and District Profiles
487
Section B: Profile KwaZulu-Natal Province
487
Zululand District Municipality (DC26)
Zululand District is situated in the north-eastern part of KwaZulu-Natal Province. It is primarily a rural district and comprises five health sub-districts, namely Nongoma, Ulundi, eDumbe, uPhongolo and Abaqulusi. The district has a population of 854 894, with a population density of 57.8 persons per km2, and falls into socio-economic Quintile 1, among the poorest districts. Estimated medical scheme coverage is 5.6%.
Social determinants of healtha
Unemployment ratea 41.1%
Youth unemployment rate (15-34 years)a 51.2%
No schooling 12.2%
Matric 32.4%
Higher education 7.5%
Households 178 516
Female-headed households 53.8%
Formal dwellings 62.1%
Flush toilet connected to sewerage 18.7%
Weekly refuse removal 22.3%
Piped water inside dwellings 14.6%
Electricity for lighting 84.7%
Blue Drop water score 51.2%
Source: StatsSA. 2014 Blue Drop Report.
Population distribution sub-district boundaries and health facility locations
a Statistics South Africa. Census 2011 Municipal fact sheet. Report No. 03-01-58. Pretoria: Statistics SA; 2012.
Population per selected category
Population category 2017 2018 2019 2020
under 1 year 21 864 21 981 22 420 22 856
under 5 years 116 008 115 824 115 785 115 875
05-09 years 112 003 113 656 114 558 115 214
10-14 years 93 905 97 774 102 230 106 282
15-19 years 90 963 88 950 87 834 88 295
20-24 years 95 225 93 279 90 996 88 600
25-29 years 93 857 94 215 93 972 92 980
30-34 years 73 452 78 435 83 200 87 754
35-39 years 46 926 51 413 55 834 59 699
40-44 years 29 098 30 906 33 081 35 762
45-49 years 22 159 22 443 22 935 23 695
50-54 years 20 297 20 076 19 842 19 656
55-59 years 18 512 18 430 18 337 18 211
60-64 years 15 740 15 883 15 960 15 973
65-69 years 12 134 12 315 12 504 12 685
70-74 years 9 111 9 085 9 092 9 143
75-79 years 7 054 6 894 6 734 6 582
80 years and older 7 606 7 705 7 820 7 948
Total 864 047 877 285 890 722 904 345
Estimated pregnant women* 23 394 23 520 23 989 24 456
Source: Mid-Year Population Estimates 2016 StatsSA. * Under 1 year population X 1.07.

488
Section B: National and District Profiles
488
Section B: Profile KwaZulu-Natal Province
Number of facilities by level, 2016/17
Ward based outreach
teams Clinic CHCDistrict Hospital
Regional Hospital
Central/Tertiary
HospitalsOther
Hospitals
Abaqulusi SD 20 16 0 1 0 0 3
eDumbe SD 9 7 1 0 0 0 2
Nongoma SD 18 14 0 1 0 0 2
Ulundi SD 30 27 0 2 0 0 3
uPhongolo SD 11 10 0 1 0 0 1
Zululand 88 74 1 5 0 0 11
Source: DHIS.
Human resources – filled posts, 2016
Community Health
WorkersNursing
assistantsEnrolled
nurseProfessional
nurseMedical
practitioners PharmacistsDental
practitionersOccupational
therapy Physiotherapy
Speech Therapy and Audiology
Zululand 1 161 374 782 1 108 98 36 6 5 17 9
Source: Persal, DHIS.
Management and efficiency indicators for the service delivery platform, 2016/17
PHC Management
Output Process & input
PHC utilisation rate (No)
Percentage Ideal clinics
(%)
Percentage of assessed PHC facilities with 90% of tracer
medicines available (%)
Provincial and LG
District Health Services
expenditure per capita
(uninsured) (Rand)
Provincial and LG PHC expenditure per capita
(uninsured) (Rand)
Provincial and LG PHC expenditure
per PHC headcount
(Rand)
2016/17 2016/17 2016/17 2016/17 2016/17 2016/17
Abaqulusi SD Indicator 2.5 - - - - -
Numerator 566 070 - - - - -
Denominator 2 735 028 - - - - -
eDumbe SD Indicator 2.7 - - - - -
Numerator 235 690 - - - - -
Denominator 1 050 825 - - - - -
Nongoma SD Indicator 2.3 - - - - -
Numerator 467 813 - - - - -
Denominator 2 463 909 - - - - -
Ulundi SD Indicator 2.8 - - - - -
Numerator 568 165 - - - - -
Denominator 2 399 952 - - - - -
uPhongolo SD Indicator 2.6 - - - - -
Numerator 349 554 - - - - -
Denominator 1 642 605 - - - - -
Zululand Indicator 2.6 62.0 90.0 2 221 1 143 422
Numerator 2 187 292 44 63 1 792 019 213 922 198 931 922 198 931
Denominator 10 292 319 71 70 807 010 807 010 2 187 292
KwaZulu-Natal Indicator 2.7 47.8 90.8 1 879 1 213 397
South Africa Indicator 2.3 29.8 78.4 1 726 1 054 389
Source: DHIS.
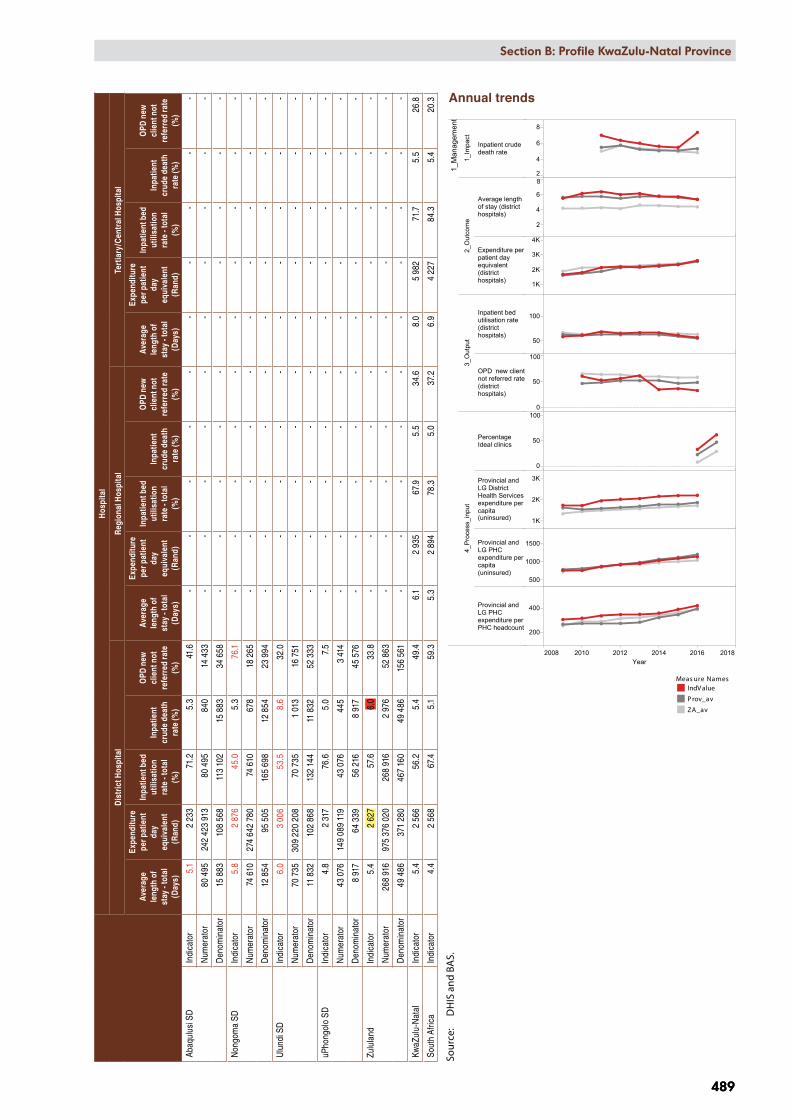
2008 2010 2012 2014 2016 2018Year
1_M
anag
emen
t
1_Im
pact
Inpatient crudedeath rate
2_O
utco
me
Average lengthof stay (districthospitals)
Expenditure perpatient dayequivalent(districthospitals)
3_O
utpu
t
Inpatient bedutilisation rate(districthospitals)
OPD new clientnot referred rate(districthospitals)
4_P
roce
ss_i
nput
PercentageIdeal clinics
Provincial andLG DistrictHealth Servicesexpenditure percapita(uninsured)
Provincial andLG PHCexpenditure percapita(uninsured)
Provincial andLG PHCexpenditure perPHC headcount
2
4
6
8
2
4
6
8
1K
2K
3K
4K
50
100
0
50
100
0
50
100
1K
2K
3K
500
1000
1500
200
400
KZN, DC26, Zululand District Municipality, SEQ 1 (most deprived)
Measure NamesIndValueProv_avZA_av
Meas ure NamesIndV alue
P rov_av
ZA_av
Section B: National and District Profiles
489
Section B: Profile KwaZulu-Natal Province
489
Hos
pita
l
Dis
tric
t Hos
pita
lR
egio
nal H
ospi
tal
Tert
iary
/Cen
tral
Hos
pita
l
Aver
age
leng
th o
f st
ay -
tota
l (D
ays)
Expe
nditu
re
per p
atie
nt
day
equi
vale
nt
(Ran
d)
Inpa
tient
bed
ut
ilisa
tion
rate
- to
tal
(%)
Inpa
tient
cr
ude
deat
h ra
te (%
)
OPD
new
cl
ient
not
re
ferr
ed ra
te
(%)
Aver
age
leng
th o
f st
ay -
tota
l (D
ays)
Expe
nditu
re
per p
atie
nt
day
equi
vale
nt
(Ran
d)
Inpa
tient
bed
ut
ilisa
tion
rate
- to
tal
(%)
Inpa
tient
cr
ude
deat
h ra
te (%
)
OPD
new
cl
ient
not
re
ferr
ed ra
te
(%)
Aver
age
leng
th o
f st
ay -
tota
l (D
ays)
Expe
nditu
re
per p
atie
nt
day
equi
vale
nt
(Ran
d)
Inpa
tient
bed
ut
ilisa
tion
rate
- to
tal
(%)
Inpa
tient
cr
ude
deat
h ra
te (%
)
OPD
new
cl
ient
not
re
ferr
ed ra
te
(%)
Abaq
ulus
i SD
Indi
cato
r5.
12
233
71.2
5.3
41.6
- -
- -
- -
- -
- -
Num
erat
or80
495
242
423
913
80 4
9584
014
433
- -
- -
- -
- -
- -
Den
omin
ator
15 8
8310
8 56
811
3 10
215
883
34 6
58 -
- -
- -
- -
- -
-
Non
gom
a SD
Indi
cato
r5.
82
876
45.0
5.3
76.1
- -
- -
- -
- -
- -
Num
erat
or74
610
274
642
780
74 6
1067
818
265
- -
- -
- -
- -
- -
Den
omin
ator
12 8
5495
505
165
698
12 8
5423
994
- -
- -
- -
- -
- -
Ulu
ndi S
DIn
dica
tor
6.0
3 00
653
.58.
632
.0 -
- -
- -
- -
- -
-
Num
erat
or70
735
309
220
208
70 7
351
013
16 7
51 -
- -
- -
- -
- -
-
Den
omin
ator
11 8
3210
2 86
813
2 14
411
832
52 3
33 -
- -
- -
- -
- -
-
uPho
ngol
o SD
Indi
cato
r4.
82
317
76.6
5.0
7.5
- -
- -
- -
- -
- -
Num
erat
or43
076
149
089
119
43 0
7644
53
414
- -
- -
- -
- -
- -
Den
omin
ator
8 91
764
339
56 2
168
917
45 5
76 -
- -
- -
- -
- -
-
Zulu
land
In
dica
tor
5.4
2 62
757
.66.
033
.8 -
- -
- -
- -
- -
-
Num
erat
or26
8 91
697
5 37
6 02
026
8 91
62
976
52 8
63 -
- -
- -
- -
- -
-
Den
omin
ator
49 4
8637
1 28
046
7 16
049
486
156
561
- -
- -
- -
- -
- -
KwaZ
ulu-
Nat
alIn
dica
tor
5.4
2 56
656
.25.
449
.46.
1 2
935
67.9
5.5
34.6
8.0
5 98
271
.75.
526
.8
Sout
h Af
rica
Indi
cato
r4.
42
568
67.4
5.1
59.3
5.3
2 89
478
.35.
037
.26.
94
227
84.3
5.4
20.3
Sour
ce:
DH
IS a
nd B
AS.
Annual trends

490
Section B: National and District Profiles
490
Section B: Profile KwaZulu-Natal Province
Deaths and Patient day equivalent 2014/15 – 2016/17
Dat
a El
emen
t(N
umbe
r)
2014
/15
2015
/16
2016
/17
PHC
/ CH
C / M
OU
*D
istr
ict
Hos
pita
lR
egio
nal
Hos
pita
l
Cen
tral
/te
rtia
ry
Hos
pita
lD
istr
ict
Tota
lPH
C / C
HC
/ MO
UD
istr
ict
Hos
pita
lR
egio
nal
Hos
pita
l
Cen
tral
/te
rtia
ry
Hos
pita
lD
istr
ict
Tota
lPH
C / C
HC
/ MO
UD
istr
ict
Hos
pita
lR
egio
nal
Hos
pita
l
Cen
tral
/te
rtia
ry
hosp
ital
Dis
tric
t To
tal
Mat
erna
l dea
ths
-10
--
10-
13-
-13
-16
--
16
Live
birt
hs1
852
14 7
36-
-16
588
1 75
113
511
--
15 2
621
627
14 7
00-
-16
327
Still
birth
s23
244
--
267
2726
9-
-29
626
260
--
286
Child (under 5 years)
Infant (under 1
year)
Neo-natal
Dea
th in
faci
lity
0-7d
ays
316
6-
-16
91
110
--
--
157
--
158
Dea
th in
faci
lity
8-28
day
s 2
32-
-34
-24
--
24-
24-
-24
Dea
th in
faci
lity
29 d
ays
- 11
mon
ths
-15
4-
-15
4-
86-
-86
179
--
80
Dea
th in
faci
lity
12 –
59
mon
ths
-10
8-
-10
8-
51-
-51
-49
--
49
Dia
rrho
ea d
eath
und
er 5
yea
rs
-52
--
521
33-
-34
134
--
35
Pneu
mon
ia d
eath
und
er 5
yea
rs-
32-
-32
-31
--
31-
26-
-26
Seve
re a
cute
mal
nutri
tion
deat
h un
der 5
yea
rs
-47
--
47-
22-
-22
146
--
47
TB D
eath
s 1
875
220
--
2 09
51
590
315
--
1 90
5-
--
--
Inpa
tient
dea
th to
tal
262
934
--
2 96
038
2 77
1-
-2
809
886
2 97
6-
-3
862
Patie
nt d
ay e
quiv
alen
t5
068
425
710
--
430
778
3 85
640
8 77
0-
-41
2 62
64
707
371
280
--
375
987
Sour
ce:
DH
IS. *
MO
U –
Mat
erna
l Obs
tetr
ic U
nit.
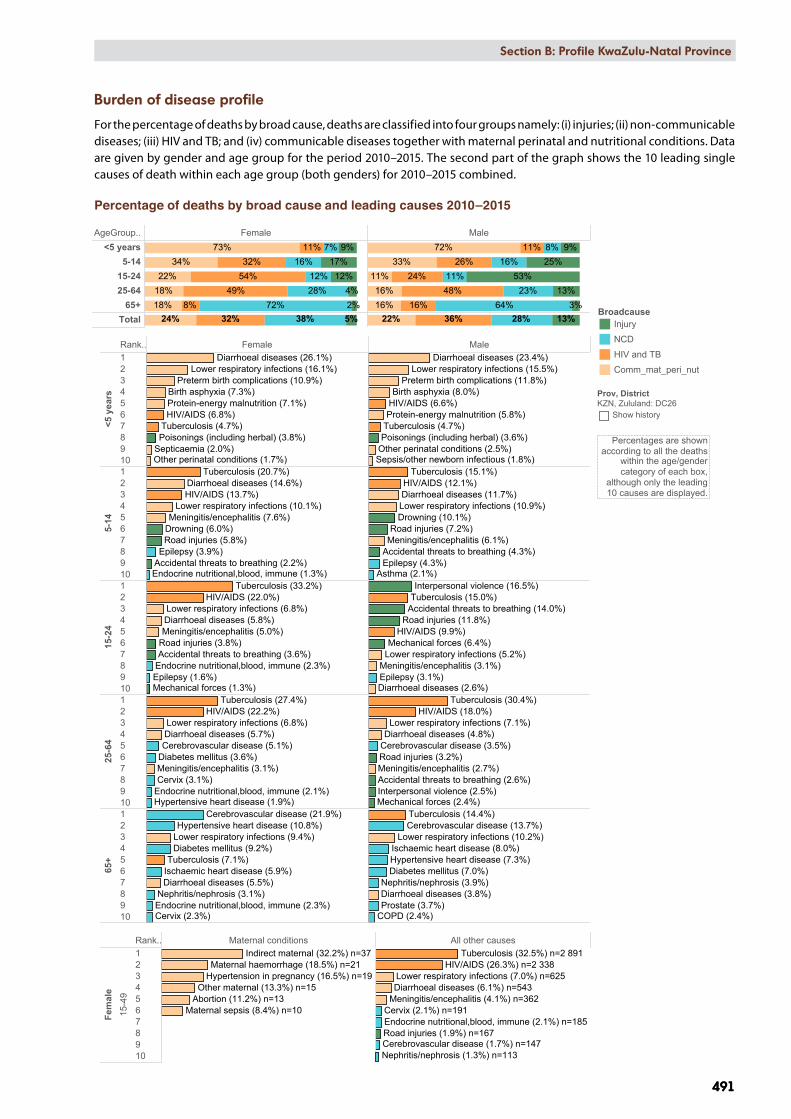
AgeGroup.. Female Male<5 years
5-1415-2425-64
65+Total 24%
18%18%22%
34%73%
32%8%
49%54%32%
11%
38%72%
28%12%
16%7%
5%2%4%
12%17%
9%
22%16%16%
11%33%
72%
36%16%
48%24%
26%11%
28%64%
23%11%
16%8%
13%3%
13%53%
25%9%
KZN, Zululand: DC26, 2010 - 2015
Rank.. Female Male
<5 y
ears
12345678910
5-14
12345678910
15-2
4
12345678910
25-6
4
12345678910
65+
12345678910
Other perinatal conditions (1.7%)
Poisonings (including herbal) (3.8%)
Birth asphyxia (7.3%)Protein-energy malnutrition (7.1%)
Preterm birth complications (10.9%)
Septicaemia (2.0%)
Diarrhoeal diseases (26.1%)Lower respiratory infections (16.1%)
Tuberculosis (4.7%)HIV/AIDS (6.8%)
Drowning (6.0%)
Epilepsy (3.9%)
Endocrine nutritional,blood, immune (1.3%)
Meningitis/encephalitis (7.6%)
Accidental threats to breathing (2.2%)
Road injuries (5.8%)
Diarrhoeal diseases (14.6%)
Lower respiratory infections (10.1%)
Tuberculosis (20.7%)
HIV/AIDS (13.7%)
Epilepsy (1.6%)Endocrine nutritional,blood, immune (2.3%)
Meningitis/encephalitis (5.0%)
Mechanical forces (1.3%)
Accidental threats to breathing (3.6%)Road injuries (3.8%)
Diarrhoeal diseases (5.8%)Lower respiratory infections (6.8%)
Tuberculosis (33.2%)HIV/AIDS (22.0%)
Cervix (3.1%)Endocrine nutritional,blood, immune (2.1%)
Meningitis/encephalitis (3.1%)
Hypertensive heart disease (1.9%)
Diabetes mellitus (3.6%)
Diarrhoeal diseases (5.7%)Cerebrovascular disease (5.1%)
Lower respiratory infections (6.8%)
Tuberculosis (27.4%)HIV/AIDS (22.2%)
Cervix (2.3%)Endocrine nutritional,blood, immune (2.3%)Nephritis/nephrosis (3.1%)
Hypertensive heart disease (10.8%)
Diabetes mellitus (9.2%)
Diarrhoeal diseases (5.5%)Ischaemic heart disease (5.9%)
Cerebrovascular disease (21.9%)
Lower respiratory infections (9.4%)
Tuberculosis (7.1%)
Other perinatal conditions (2.5%)Sepsis/other newborn infectious (1.8%)
Poisonings (including herbal) (3.6%)
Birth asphyxia (8.0%)
Protein-energy malnutrition (5.8%)
Preterm birth complications (11.8%)
Diarrhoeal diseases (23.4%)Lower respiratory infections (15.5%)
Tuberculosis (4.7%)
HIV/AIDS (6.6%)
Drowning (10.1%)
Epilepsy (4.3%)Asthma (2.1%)
Meningitis/encephalitis (6.1%)Accidental threats to breathing (4.3%)
Road injuries (7.2%)
Diarrhoeal diseases (11.7%)Lower respiratory infections (10.9%)
Tuberculosis (15.1%)HIV/AIDS (12.1%)
Epilepsy (3.1%)Meningitis/encephalitis (3.1%)
Mechanical forces (6.4%)
Accidental threats to breathing (14.0%)
Interpersonal violence (16.5%)
Road injuries (11.8%)
Diarrhoeal diseases (2.6%)
Lower respiratory infections (5.2%)
Tuberculosis (15.0%)
HIV/AIDS (9.9%)
Meningitis/encephalitis (2.7%)
Mechanical forces (2.4%)
Accidental threats to breathing (2.6%)Interpersonal violence (2.5%)
Road injuries (3.2%)
Diarrhoeal diseases (4.8%)Cerebrovascular disease (3.5%)
Lower respiratory infections (7.1%)
Tuberculosis (30.4%)HIV/AIDS (18.0%)
Prostate (3.7%)COPD (2.4%)
Nephritis/nephrosis (3.9%)
Hypertensive heart disease (7.3%)Diabetes mellitus (7.0%)
Diarrhoeal diseases (3.8%)
Ischaemic heart disease (8.0%)
Cerebrovascular disease (13.7%)Lower respiratory infections (10.2%)
Tuberculosis (14.4%)
Rank.. Maternal conditions All other causes
Fem
ale
15-4
9
12345678910
Maternal sepsis (8.4%) n=10Abortion (11.2%) n=13
Maternal haemorrhage (18.5%) n=21Hypertension in pregnancy (16.5%) n=19
Other maternal (13.3%) n=15
Indirect maternal (32.2%) n=37
Endocrine nutritional,blood, immune (2.1%) n=185Road injuries (1.9%) n=167
Cervix (2.1%) n=191
Nephritis/nephrosis (1.3%) n=113Cerebrovascular disease (1.7%) n=147
Meningitis/encephalitis (4.1%) n=362Diarrhoeal diseases (6.1%) n=543Lower respiratory infections (7.0%) n=625
Tuberculosis (32.5%) n=2 891HIV/AIDS (26.3%) n=2 338
Percentage ofdeaths by broad
causes andsingle leading
causes
BroadcauseInjury
NCD
HIV and TB
Comm_mat_peri_nut
Prov, DistrictKZN, Zululand: DC26
Show history
Percentages are shownaccording to all the deaths
within the age/gendercategory of each box,
although only the leading10 causes are displayed.
Section B: National and District Profiles
491
Section B: Profile KwaZulu-Natal Province
491
Burden of disease profile
For the percentage of deaths by broad cause, deaths are classified into four groups namely: (i) injuries; (ii) non-communicable diseases; (iii) HIV and TB; and (iv) communicable diseases together with maternal perinatal and nutritional conditions. Data are given by gender and age group for the period 2010–2015. The second part of the graph shows the 10 leading single causes of death within each age group (both genders) for 2010–2015 combined.
Percentage of deaths by broad cause and leading causes 2010–2015

2009 2010 2011 2012 2013 2014 2015 2016Year
2_M
ater
nal a
nd w
omen
's h
ealth
1_Im
pact Maternal
mortality infacility ratio
2_O
utco
me
Antenatal 1stvisit before 20weeks rate
Couple yearprotection rate(WHO)
Delivery infacility under 18years rate
Motherpostnatal visitwithin 6 daysrate
3_O
utpu
t
Antenatal clientinitiated on ARTrate
Cervical cancerscreeningcoverage
0
200
400
600
800
20
40
60
80
100
200
5
10
15
0
100
200
50
100
150
200
50
100
150
KZN, DC26, Zululand District Municipality, SEQ 1 (most deprived)
Measure NamesIndValueProv_avZA_av
492
Section B: National and District Profiles
492
Section B: Profile KwaZulu-Natal Province
Maternal and Women’s Health
Impact Outcome Output
Maternal mortality in facility ratio (per100K)
Antenatal client initiated
on ART rate (%)
Delivery in facility under 18 years rate
(%)
Antenatal 1st visit before 20 weeks rate (%)
Cervical cancer
screening coverage (%)
Couple year protection rate
(WHO) (%)
Mother postnatal visit within 6 days
rate (%)
2016/17 2016/17 2016/17 2016/17 2016/17 2016/17 2016/17
Abaqulusi SD Indicator 146.6 99.7 11.5 82.4 82.9 73.4 60.2
Numerator 6 793 478 3 458 3 713 46 444 2 496
Denominator 4 094 795 4 145 4 196 53 736 759 594 4 145
eDumbe SD Indicator - 96.7 6.5 71.2 58.6 74.8 158.9
Numerator - 322 46 1 108 971 17 750 1 119
Denominator 703 333 704 1 556 19 898 284 673 704
Nongoma SD Indicator 105.3 110.9 9.3 73.0 89.8 59.0 32.7
Numerator 5 845 443 3 168 3 384 33 867 1 558
Denominator 4 747 762 4 763 4 338 45 233 689 373 4 763
Ulundi SD Indicator 55.9 98.9 8.8 66.1 73.4 68.4 59.5
Numerator 2 831 315 2 885 2 837 39 086 2 136
Denominator 3 580 840 3 592 4 363 46 403 685 572 3 592
uPhongolo SD Indicator 93.7 97.0 10.3 63.8 99.5 83.3 41.8
Numerator 3 623 334 2 036 2 449 31 940 1 349
Denominator 3 203 642 3 230 3 192 29 542 460 101 3 230
Zululand Indicator 98.0 101.2 9.8 71.7 82.3 70.5 52.7
Numerator 16 3 414 1 616 12 655 13 354 169 087 8 658
Denominator 16 327 3 372 16 434 17 645 194 813 2 879 313 16 434
KwaZulu-Natal Indicator 106.7 97.2 8.5 70.2 85.6 74.8 66.8
South Africa Indicator 116.9 95.1 6.8 65.2 61.5 70.2 70.3
Source: DHIS.
Annual trends
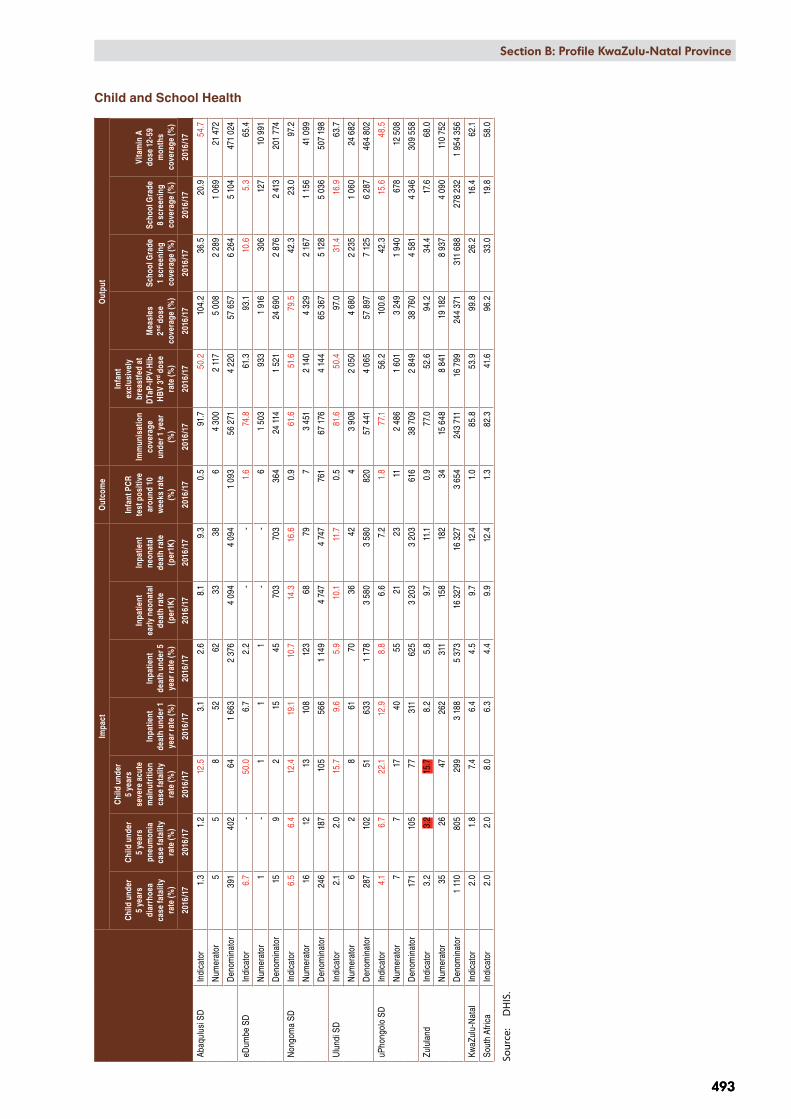
Section B: National and District Profiles
493
Section B: Profile KwaZulu-Natal Province
493
Child and School HealthIm
pact
Out
com
eO
utpu
t
Chi
ld u
nder
5
year
s di
arrh
oea
case
fata
lity
rate
(%)
Chi
ld u
nder
5
year
s pn
eum
onia
ca
se fa
talit
y ra
te (%
)
Chi
ld u
nder
5
year
s se
vere
acu
te
mal
nutr
ition
ca
se fa
talit
y ra
te (%
)
Inpa
tient
de
ath
unde
r 1
year
rate
(%)
Inpa
tient
de
ath
unde
r 5
year
rate
(%)
Inpa
tient
ea
rly n
eona
tal
deat
h ra
te
(per
1K)
Inpa
tient
ne
onat
al
deat
h ra
te
(per
1K)
Infa
nt P
CR
test
pos
itive
ar
ound
10
wee
ks ra
te
(%)
Imm
unis
atio
n co
vera
ge
unde
r 1 y
ear
(%)
Infa
nt
excl
usiv
ely
brea
stfe
d at
D
TaP-
IPV-
Hib
-H
BV
3rd d
ose
rate
(%)
Mea
sles
2nd
dos
e co
vera
ge (%
)
Scho
ol G
rade
1
scre
enin
g co
vera
ge (%
)
Scho
ol G
rade
8
scre
enin
g co
vera
ge (%
)
Vita
min
A
dose
12-
59
mon
ths
cove
rage
(%)
2016
/17
2016
/17
2016
/17
2016
/17
2016
/17
2016
/17
2016
/17
2016
/17
2016
/17
2016
/17
2016
/17
2016
/17
2016
/17
2016
/17
Abaq
ulus
i SD
In
dica
tor
1.3
1.2
12.5
3.1
2.6
8.1
9.3
0.5
91.7
50.2
104.
236
.520
.954
.7
Num
erat
or5
58
5262
3338
64
300
2 11
75
008
2 28
91
069
21 4
72
Den
omin
ator
391
402
641
663
2 37
64
094
4 09
41
093
56 2
714
220
57 6
576
264
5 10
447
1 02
4
eDum
be S
D
Indi
cato
r6.
7 -
50.0
6.7
2.2
- -
1.6
74.8
61.3
93.1
10.6
5.3
65.4
Num
erat
or1
-1
11
- -
61
503
933
1 91
630
612
710
991
Den
omin
ator
159
215
4570
370
336
424
114
1 52
124
690
2 87
62
413
201
774
Non
gom
a SD
In
dica
tor
6.5
6.4
12.4
19.1
10.7
14.3
16.6
0.9
61.6
51.6
79.5
42.3
23.0
97.2
Num
erat
or16
1213
108
123
6879
73
451
2 14
04
329
2 16
71
156
41 0
99
Den
omin
ator
246
187
105
566
1 14
94
747
4 74
776
167
176
4 14
465
367
5 12
85
036
507
198
Ulu
ndi S
D
Indi
cato
r2.
12.
015
.79.
65.
910
.111
.70.
581
.650
.497
.031
.416
.963
.7
Num
erat
or6
28
6170
3642
43
908
2 05
04
680
2 23
51
060
24 6
82
Den
omin
ator
287
102
5163
31
178
3 58
03
580
820
57 4
414
065
57 8
977
125
6 28
746
4 80
2
uPho
ngol
o SD
In
dica
tor
4.1
6.7
22.1
12.9
8.8
6.6
7.2
1.8
77.1
56.2
100.
642
.315
.648
.5
Num
erat
or7
717
4055
2123
112
486
1 60
13
249
1 94
067
812
508
Den
omin
ator
171
105
7731
162
53
203
3 20
361
638
709
2 84
938
760
4 58
14
346
309
558
Zulu
land
In
dica
tor
3.2
3.2
15.7
8.2
5.8
9.7
11.1
0.9
77.0
52.6
94.2
34.4
17.6
68.0
Num
erat
or35
2647
262
311
158
182
3415
648
8 84
119
182
8 93
74
090
110
752
Den
omin
ator
1 11
080
529
93
188
5 37
316
327
16 3
273
654
243
711
16 7
9924
4 37
131
1 68
827
8 23
21
954
356
KwaZ
ulu-
Nat
alIn
dica
tor
2.0
1.8
7.4
6.4
4.5
9.7
12.4
1.0
85.8
53.9
99.8
26.2
16.4
62.1
Sout
h Af
rica
Indi
cato
r2.
02.
08.
06.
34.
49.
912
.41.
382
.341
.696
.233
.019
.858
.0
Sour
ce:
DH
IS.
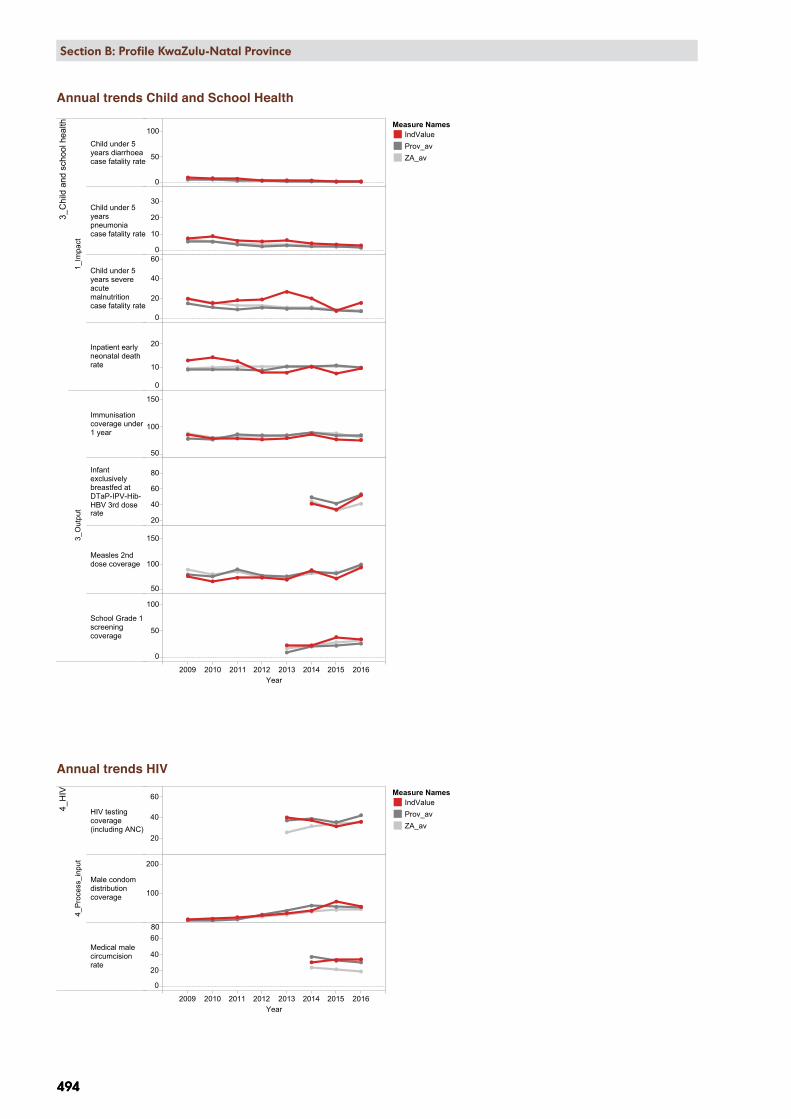
2009 2010 2011 2012 2013 2014 2015 2016Year
3_C
hild
and
sch
ool h
ealth
1_Im
pact
Child under 5years diarrhoeacase fatality rate
Child under 5yearspneumoniacase fatality rate
Child under 5years severeacutemalnutritioncase fatality rate
Inpatient earlyneonatal deathrate
3_O
utpu
t
Immunisationcoverage under1 year
Infantexclusivelybreastfed atDTaP-IPV-Hib-HBV 3rd doserate
Measles 2nddose coverage
School Grade 1screeningcoverage
0
50
100
0
10
20
30
0
20
40
60
0
10
20
50
100
150
20
40
60
80
50
100
150
0
50
100
KZN, DC26, Zululand District Municipality, SEQ 1 (most deprived)
Measure NamesIndValueProv_avZA_av
2009 2010 2011 2012 2013 2014 2015 2016Year
4_H
IV
4_P
roce
ss_i
nput
HIV testingcoverage(including ANC)
Male condomdistributioncoverage
Medical malecircumcisionrate
20
40
60
100
200
0
20
40
6080
KZN, DC26, Zululand District Municipality, SEQ 1 (most deprived)
Measure NamesIndValueProv_avZA_av
494
Section B: National and District Profiles
494
Section B: Profile KwaZulu-Natal Province
Annual trends HIV
Annual trends Child and School Health
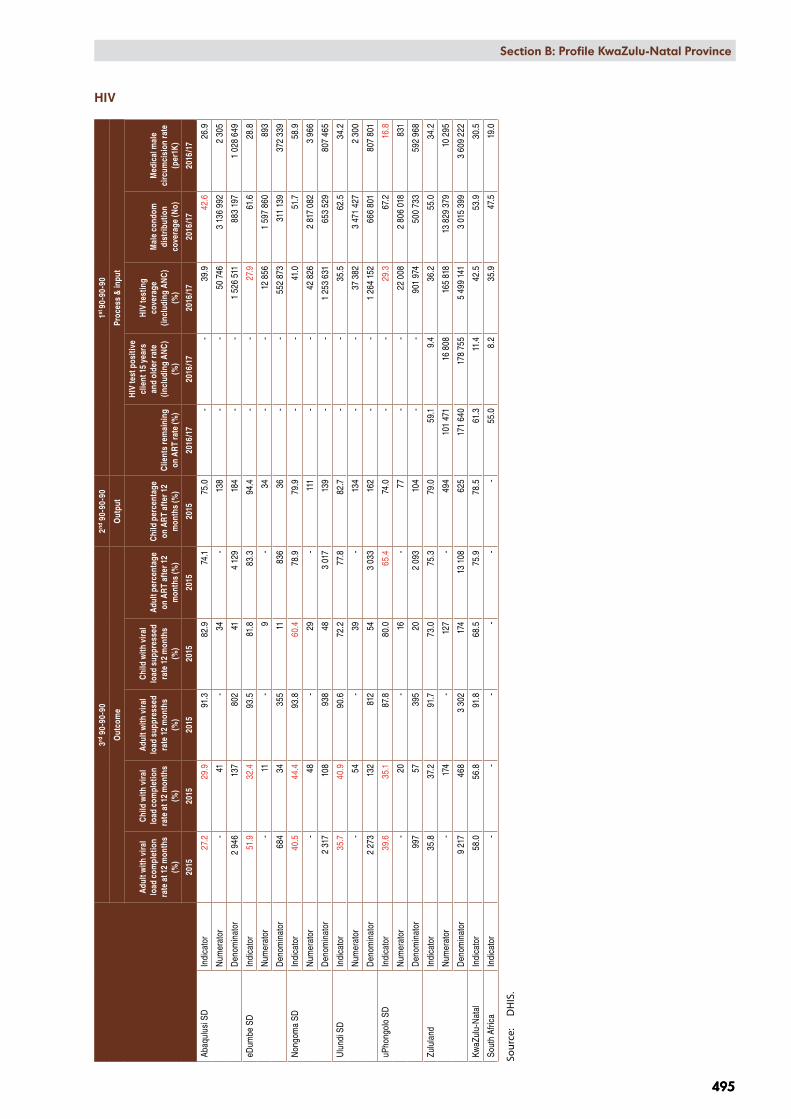
Section B: National and District Profiles
495
Section B: Profile KwaZulu-Natal Province
495
HIV
3rd 9
0-90
-90
2nd 9
0-90
-90
1st 90
-90-
90
Out
com
eO
utpu
tPr
oces
s &
inpu
t
Adu
lt w
ith v
iral
load
com
plet
ion
rate
at 1
2 m
onth
s (%
)
Chi
ld w
ith v
iral
load
com
plet
ion
rate
at 1
2 m
onth
s (%
)
Adu
lt w
ith v
iral
load
sup
pres
sed
rate
12
mon
ths
(%)
Chi
ld w
ith v
iral
load
sup
pres
sed
rate
12
mon
ths
(%)
Adu
lt pe
rcen
tage
on
AR
T af
ter 1
2 m
onth
s (%
)
Chi
ld p
erce
ntag
e on
AR
T af
ter 1
2 m
onth
s (%
)C
lient
s re
mai
ning
on
AR
T ra
te (%
)
HIV
test
pos
itive
cl
ient
15
year
s an
d ol
der r
ate
(incl
udin
g A
NC
) (%
)
HIV
test
ing
cove
rage
(in
clud
ing
AN
C)
(%)
Mal
e co
ndom
di
strib
utio
n co
vera
ge (N
o)
Med
ical
mal
e ci
rcum
cisi
on ra
te
(per
1K)
2015
2015
2015
2015
2015
2015
2016
/17
2016
/17
2016
/17
2016
/17
2016
/17
Abaq
ulus
i SD
In
dica
tor
27.2
29.9
91.3
82.9
74.1
75.0
- -
39.9
42.6
26.9
Num
erat
or -
41 -
34 -
138
- -
50 7
463
136
992
2 30
5
Den
omin
ator
2 94
613
780
241
4 12
918
4 -
-1
526
511
883
197
1 02
8 64
9
eDum
be S
D
Indi
cato
r51
.932
.493
.581
.883
.394
.4 -
-27
.961
.628
.8
Num
erat
or -
11 -
9 -
34 -
-12
856
1 59
7 86
089
3
Den
omin
ator
684
3435
511
836
36 -
-55
2 87
331
1 13
937
2 33
9
Non
gom
a SD
In
dica
tor
40.5
44.4
93.8
60.4
78.9
79.9
- -
41.0
51.7
58.9
Num
erat
or -
48 -
29 -
111
- -
42 8
262
817
082
3 96
6
Den
omin
ator
2 31
710
893
848
3 01
713
9 -
-1
253
631
653
529
807
465
Ulu
ndi S
D
Indi
cato
r35
.740
.990
.672
.277
.882
.7 -
-35
.562
.534
.2
Num
erat
or -
54 -
39 -
134
- -
37 3
823
471
427
2 30
0
Den
omin
ator
2 27
313
281
254
3 03
316
2 -
-1
264
152
666
801
807
801
uPho
ngol
o SD
In
dica
tor
39.6
35.1
87.8
80.0
65.4
74.0
- -
29.3
67.2
16.8
Num
erat
or -
20 -
16 -
77 -
-22
008
2 80
6 01
883
1
Den
omin
ator
997
5739
520
2 09
310
4 -
-90
1 97
450
0 73
359
2 96
8
Zulu
land
In
dica
tor
35.8
37.2
91.7
73.0
75.3
79.0
59.1
9.4
36.2
55.0
34.2
Num
erat
or -
174
- 12
7-
494
101
471
16 8
0816
5 81
813
829
379
10 2
95
Den
omin
ator
9 21
746
83
302
174
13 1
0862
517
1 64
017
8 75
55
499
141
3 01
5 39
93
609
222
KwaZ
ulu-
Nat
alIn
dica
tor
58.0
56.8
91.8
68.5
75.9
78.5
61.3
11.4
42.5
53.9
30.5
Sout
h Af
rica
Indi
cato
r -
- -
- -
-55
.08.
235
.947
.519
.0
Sour
ce:
DH
IS.

2009 2010 2011 2012 2013 2014 2015 2016Year
5_TB
1_Im
pact
TB death rate(ETR.net)
TB DR clientdeath rate(EDRWeb)
2_O
utco
me
TB client lost tofollow up rate(ETR.Net)
TB clienttreatmentsuccess rate(ETR.net)
TB DR clientloss to follow uprate (EDRWeb)
TB DRtreatmentsuccess rate(EDRWeb)
TB Rifampicinresistanceconfirmed clientrate
TB/HIVco-infectedclient on ARTrate (ETR.Net)
4_P
roce
ss_i
nput
TB symptom 5years and olderscreened infacility rate
5
10
15
0
20
40
60
0
5
10
15
40
60
80
0
20
40
0
20
40
60
0
10
20
0
50
100
0
50
100
KZN, DC26, Zululand District Municipality, SEQ 1 (most deprived)
Measure NamesIndValueProv_avZA_av
Meas ure NamesIndV alue
P rov_av
ZA_av
496
Section B: National and District Profiles
496
Section B: Profile KwaZulu-Natal Province
TB
Im
pact
Out
com
eO
utpu
tPr
oces
s &
inpu
t
TB d
eath
rate
(E
TR.n
et) (
%)
TB D
R cl
ient
de
ath
rate
(E
DR
Web
) (%
)
TB c
lient
loss
to
follo
w u
p ra
te
(ETR
.Net
) (%
)
TB c
lient
tr
eatm
ent
succ
ess
rate
(E
TR.n
et) (
%)
TB D
R cl
ient
loss
to
follo
w u
p ra
te
(ED
RW
eb) (
%)
TB D
R tr
eatm
ent
succ
ess
rate
(E
DR
Web
) (%
)
TB R
ifam
pici
n re
sist
ance
co
nfirm
ed c
lient
ra
te (%
)
TB R
ifam
pici
n re
sist
ant c
lient
s tr
eatm
ent
initi
atio
n ra
te (%
)
TB/H
IV c
o-in
fect
ed c
lient
on
AR
T ra
te (E
TR.
Net
) (%
)
TB c
lient
initi
ated
on
trea
tmen
t ra
te (%
)
TB s
ympt
om 5
ye
ars
and
olde
r sc
reen
ed in
fa
cilit
y ra
te (%
)
2015
2014
2015
2015
2014
2014
2016
2016
2016
2016
2016
/17
Abaq
ulus
i SD
In
dica
tor
7.9
-2.
286
.7 -
- -
-81
.9 -
77.3
Num
erat
or17
4 -
481
914
- -
- -
567
-36
3 56
8
Den
omin
ator
2 20
7 -
2 20
72
207
- -
- -
692
-47
0 37
5
eDum
be S
D
Indi
cato
r7.
6 -
0.4
88.0
- -
- -
72.5
-74
.4
Num
erat
or37
-2
427
- -
- -
116
-14
6 22
6
Den
omin
ator
485
-48
548
5 -
- -
-16
0 -
196
587
Non
gom
a SD
In
dica
tor
6.1
-3.
483
.6 -
- -
-80
.1 -
88.3
Num
erat
or81
-46
1 11
5 -
- -
-32
2 -
329
180
Den
omin
ator
1 33
4 -
1 33
41
334
- -
- -
402
-37
2 74
0
Ulu
ndi S
D
Indi
cato
r6.
7 -
2.6
83.8
- -
- -
88.2
-75
.2
Num
erat
or79
-30
984
- -
- -
402
-34
9 03
0
Den
omin
ator
1 17
4 -
1 17
41
174
- -
- -
456
-46
4 33
7
uPho
ngol
o SD
In
dica
tor
7.8
-4.
383
.8 -
- -
-91
.2 -
86.5
Num
erat
or76
-42
820
- -
- -
332
-24
3 27
0
Den
omin
ator
979
-97
997
9 -
- -
-36
4 -
281
254
Zulu
land
In
dica
tor
7.2
24.1
2.7
85.1
10.9
59.0
10.3
66.5
83.8
67.0
80.2
Num
erat
or44
710
816
85
260
4926
531
621
01
739
2 06
11
431
274
Den
omin
ator
6 17
944
96
179
6 17
944
944
93
077
316
2 0
743
077
1 78
5 29
3
KwaZ
ulu-
Nat
alIn
dica
tor
5.4
19.0
4.8
82.7
17.2
59.6
7.7
73.8
85.7
62.4
78.3
Sout
h Af
rica
Indi
cato
r6.
623
.06.
481
.017
.950
.56.
268
.088
.372
.851
.6
Sour
ce:
DH
IS.
Annual trends
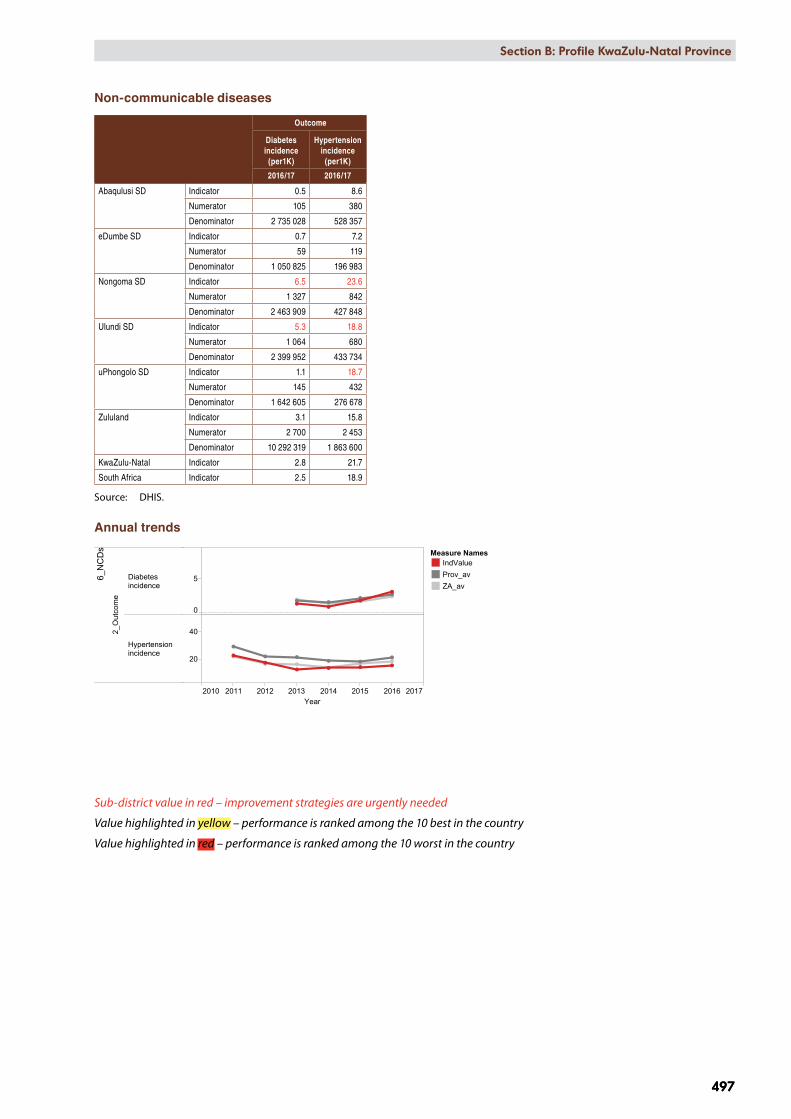
2010 2011 2012 2013 2014 2015 2016 2017Year
6_NCDs
2_Outcome
Diabetesincidence
Hypertensionincidence
0
5
20
40
KZN, DC26, Zululand District Municipality, SEQ 1 (most deprived)
Measure NamesIndValueProv_avZA_av
Section B: National and District Profiles
497
Section B: Profile KwaZulu-Natal Province
497
Non-communicable diseases
Outcome
Diabetes incidence
(per1K)
Hypertension incidence
(per1K)
2016/17 2016/17
Abaqulusi SD Indicator 0.5 8.6
Numerator 105 380
Denominator 2 735 028 528 357
eDumbe SD Indicator 0.7 7.2
Numerator 59 119
Denominator 1 050 825 196 983
Nongoma SD Indicator 6.5 23.6
Numerator 1 327 842
Denominator 2 463 909 427 848
Ulundi SD Indicator 5.3 18.8
Numerator 1 064 680
Denominator 2 399 952 433 734
uPhongolo SD Indicator 1.1 18.7
Numerator 145 432
Denominator 1 642 605 276 678
Zululand Indicator 3.1 15.8
Numerator 2 700 2 453
Denominator 10 292 319 1 863 600
KwaZulu-Natal Indicator 2.8 21.7
South Africa Indicator 2.5 18.9
Source: DHIS.
Annual trends
Sub-district value in red – improvement strategies are urgently needed
Value highlighted in yellow – performance is ranked among the 10 best in the country
Value highlighted in red – performance is ranked among the 10 worst in the country
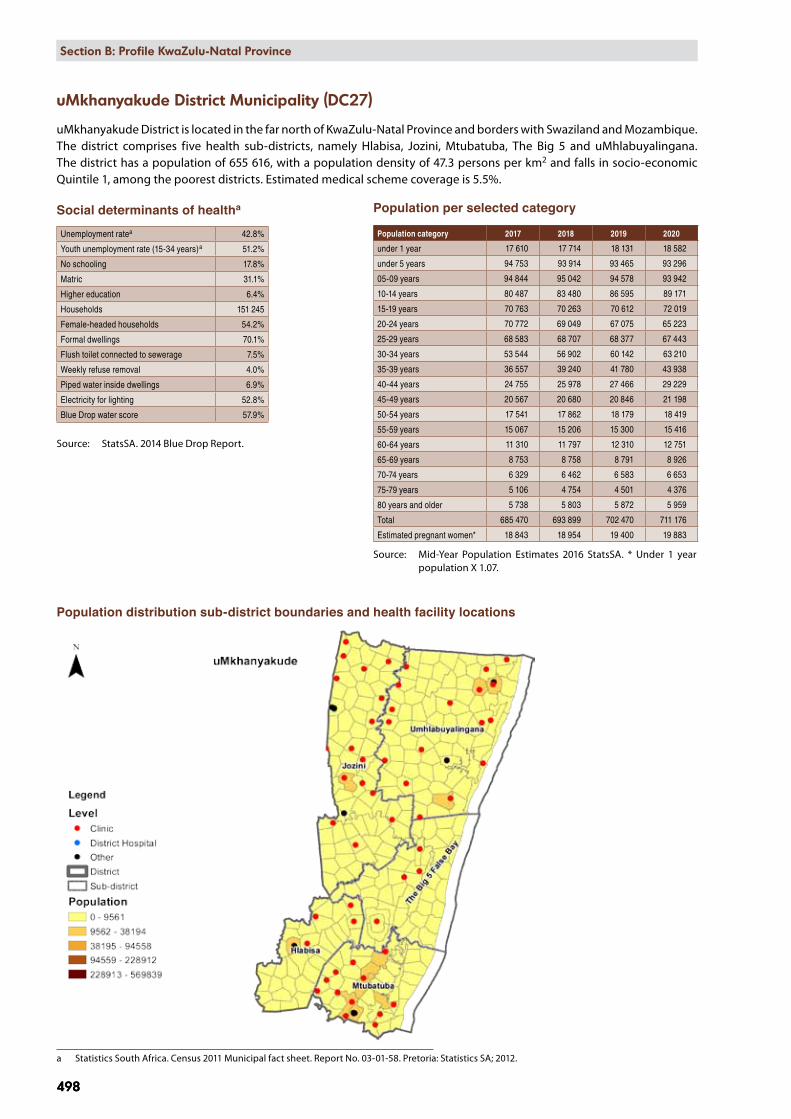
498
Section B: National and District Profiles
498
Section B: Profile KwaZulu-Natal Province
uMkhanyakude District Municipality (DC27)
uMkhanyakude District is located in the far north of KwaZulu-Natal Province and borders with Swaziland and Mozambique. The district comprises five health sub-districts, namely Hlabisa, Jozini, Mtubatuba, The Big 5 and uMhlabuyalingana. The district has a population of 655 616, with a population density of 47.3 persons per km2 and falls in socio-economic Quintile 1, among the poorest districts. Estimated medical scheme coverage is 5.5%.
Social determinants of healtha
Unemployment ratea 42.8%
Youth unemployment rate (15-34 years)a 51.2%
No schooling 17.8%
Matric 31.1%
Higher education 6.4%
Households 151 245
Female-headed households 54.2%
Formal dwellings 70.1%
Flush toilet connected to sewerage 7.5%
Weekly refuse removal 4.0%
Piped water inside dwellings 6.9%
Electricity for lighting 52.8%
Blue Drop water score 57.9%
Source: StatsSA. 2014 Blue Drop Report.
Population distribution sub-district boundaries and health facility locations
a Statistics South Africa. Census 2011 Municipal fact sheet. Report No. 03-01-58. Pretoria: Statistics SA; 2012.
Population per selected category
Population category 2017 2018 2019 2020
under 1 year 17 610 17 714 18 131 18 582
under 5 years 94 753 93 914 93 465 93 296
05-09 years 94 844 95 042 94 578 93 942
10-14 years 80 487 83 480 86 595 89 171
15-19 years 70 763 70 263 70 612 72 019
20-24 years 70 772 69 049 67 075 65 223
25-29 years 68 583 68 707 68 377 67 443
30-34 years 53 544 56 902 60 142 63 210
35-39 years 36 557 39 240 41 780 43 938
40-44 years 24 755 25 978 27 466 29 229
45-49 years 20 567 20 680 20 846 21 198
50-54 years 17 541 17 862 18 179 18 419
55-59 years 15 067 15 206 15 300 15 416
60-64 years 11 310 11 797 12 310 12 751
65-69 years 8 753 8 758 8 791 8 926
70-74 years 6 329 6 462 6 583 6 653
75-79 years 5 106 4 754 4 501 4 376
80 years and older 5 738 5 803 5 872 5 959
Total 685 470 693 899 702 470 711 176
Estimated pregnant women* 18 843 18 954 19 400 19 883
Source: Mid-Year Population Estimates 2016 StatsSA. * Under 1 year population X 1.07.
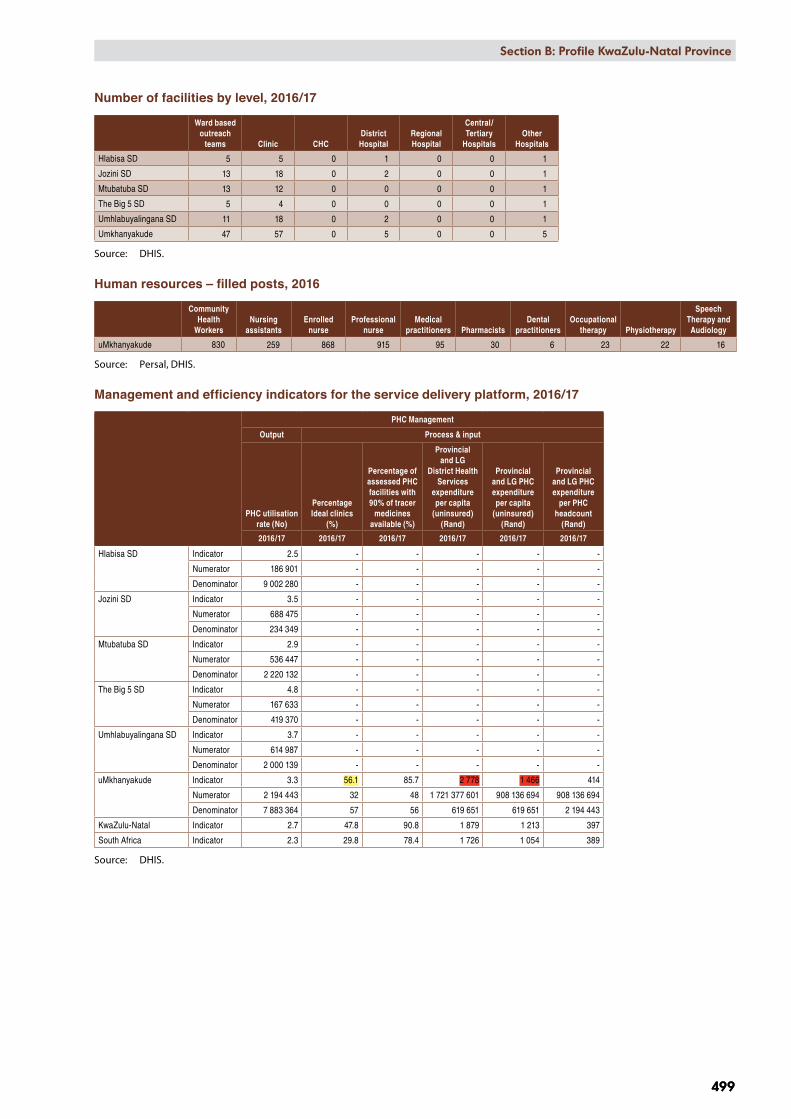
Section B: National and District Profiles
499
Section B: Profile KwaZulu-Natal Province
499
Number of facilities by level, 2016/17
Ward based outreach
teams Clinic CHCDistrict Hospital
Regional Hospital
Central/Tertiary
HospitalsOther
Hospitals
Hlabisa SD 5 5 0 1 0 0 1
Jozini SD 13 18 0 2 0 0 1
Mtubatuba SD 13 12 0 0 0 0 1
The Big 5 SD 5 4 0 0 0 0 1
Umhlabuyalingana SD 11 18 0 2 0 0 1
Umkhanyakude 47 57 0 5 0 0 5
Source: DHIS.
Human resources – filled posts, 2016
Community Health
WorkersNursing
assistantsEnrolled
nurseProfessional
nurseMedical
practitioners PharmacistsDental
practitionersOccupational
therapy Physiotherapy
Speech Therapy and Audiology
uMkhanyakude 830 259 868 915 95 30 6 23 22 16
Source: Persal, DHIS.
Management and efficiency indicators for the service delivery platform, 2016/17
PHC Management
Output Process & input
PHC utilisation rate (No)
Percentage Ideal clinics
(%)
Percentage of assessed PHC facilities with 90% of tracer
medicines available (%)
Provincial and LG
District Health Services
expenditure per capita
(uninsured) (Rand)
Provincial and LG PHC expenditure per capita
(uninsured) (Rand)
Provincial and LG PHC expenditure
per PHC headcount
(Rand)
2016/17 2016/17 2016/17 2016/17 2016/17 2016/17
Hlabisa SD Indicator 2.5 - - - - -
Numerator 186 901 - - - - -
Denominator 9 002 280 - - - - -
Jozini SD Indicator 3.5 - - - - -
Numerator 688 475 - - - - -
Denominator 234 349 - - - - -
Mtubatuba SD Indicator 2.9 - - - - -
Numerator 536 447 - - - - -
Denominator 2 220 132 - - - - -
The Big 5 SD Indicator 4.8 - - - - -
Numerator 167 633 - - - - -
Denominator 419 370 - - - - -
Umhlabuyalingana SD Indicator 3.7 - - - - -
Numerator 614 987 - - - - -
Denominator 2 000 139 - - - - -
uMkhanyakude Indicator 3.3 56.1 85.7 2 778 1 466 414
Numerator 2 194 443 32 48 1 721 377 601 908 136 694 908 136 694
Denominator 7 883 364 57 56 619 651 619 651 2 194 443
KwaZulu-Natal Indicator 2.7 47.8 90.8 1 879 1 213 397
South Africa Indicator 2.3 29.8 78.4 1 726 1 054 389
Source: DHIS.
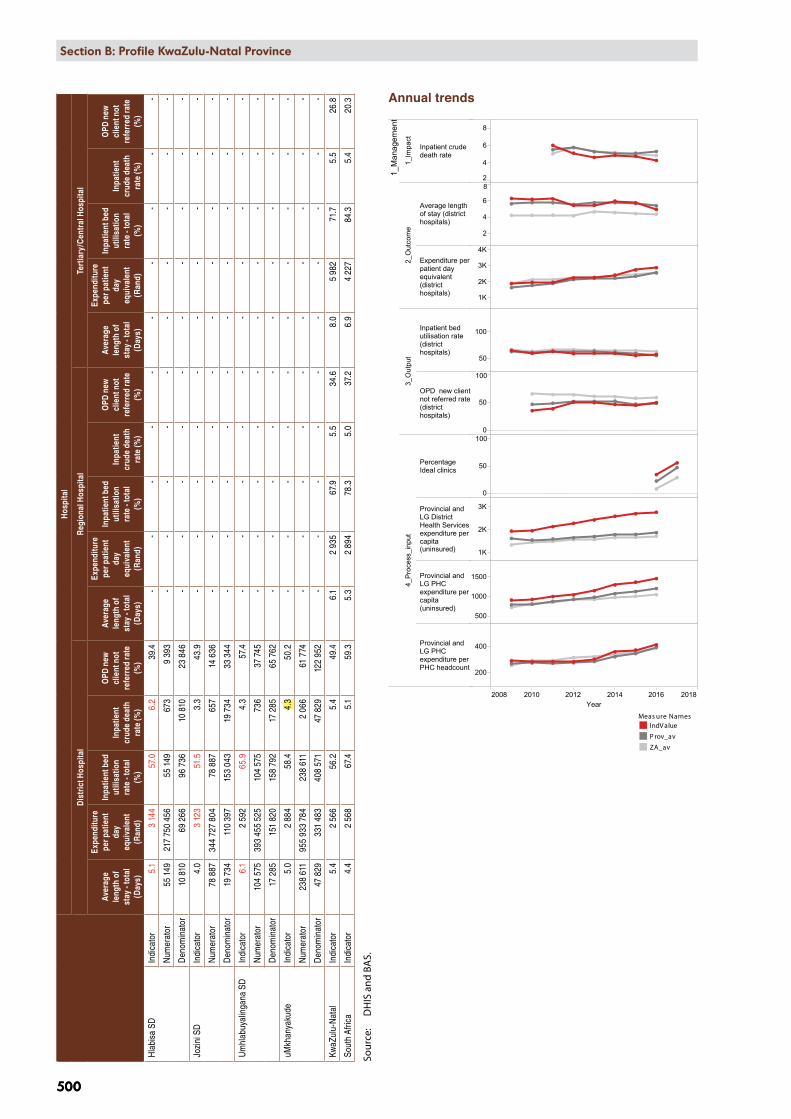
2008 2010 2012 2014 2016 2018Year
1_M
anag
emen
t
1_Im
pact
Inpatient crudedeath rate
2_O
utco
me
Average lengthof stay (districthospitals)
Expenditure perpatient dayequivalent(districthospitals)
3_O
utpu
t
Inpatient bedutilisation rate(districthospitals)
OPD new clientnot referred rate(districthospitals)
4_P
roce
ss_i
nput
PercentageIdeal clinics
Provincial andLG DistrictHealth Servicesexpenditure percapita(uninsured)
Provincial andLG PHCexpenditure percapita(uninsured)
Provincial andLG PHCexpenditure perPHC headcount
2
4
6
8
2
4
6
8
1K
2K
3K
4K
50
100
0
50
100
0
50
100
1K
2K
3K
500
1000
1500
200
400
KZN, DC27, uMkhanyakude District Municipality, SEQ 1 (most deprived)
Measure NamesIndValueProv_avZA_av
Meas ure NamesIndV alue
P rov_av
ZA_av
500
Section B: National and District Profiles
500
Section B: Profile KwaZulu-Natal ProvinceH
ospi
tal
Dis
tric
t Hos
pita
lR
egio
nal H
ospi
tal
Tert
iary
/Cen
tral
Hos
pita
l
Aver
age
leng
th o
f st
ay -
tota
l (D
ays)
Expe
nditu
re
per p
atie
nt
day
equi
vale
nt
(Ran
d)
Inpa
tient
bed
ut
ilisa
tion
rate
- to
tal
(%)
Inpa
tient
cr
ude
deat
h ra
te (%
)
OPD
new
cl
ient
not
re
ferr
ed ra
te
(%)
Aver
age
leng
th o
f st
ay -
tota
l (D
ays)
Expe
nditu
re
per p
atie
nt
day
equi
vale
nt
(Ran
d)
Inpa
tient
bed
ut
ilisa
tion
rate
- to
tal
(%)
Inpa
tient
cr
ude
deat
h ra
te (%
)
OPD
new
cl
ient
not
re
ferr
ed ra
te
(%)
Aver
age
leng
th o
f st
ay -
tota
l (D
ays)
Expe
nditu
re
per p
atie
nt
day
equi
vale
nt
(Ran
d)
Inpa
tient
bed
ut
ilisa
tion
rate
- to
tal
(%)
Inpa
tient
cr
ude
deat
h ra
te (%
)
OPD
new
cl
ient
not
re
ferr
ed ra
te
(%)
Hla
bisa
SD
Indi
cato
r5.
13
144
57.0
6.2
39.4
- -
- -
- -
- -
- -
Num
erat
or55
149
217
750
456
55 1
4967
39
393
- -
- -
- -
- -
- -
Den
omin
ator
10 8
1069
266
96 7
3610
810
23 8
46 -
- -
- -
- -
- -
-
Jozi
ni S
DIn
dica
tor
4.0
3 12
351
.53.
343
.9 -
- -
- -
- -
- -
-
Num
erat
or78
887
344
727
804
78 8
8765
714
636
- -
- -
- -
- -
- -
Den
omin
ator
19 7
3411
0 39
715
3 04
319
734
33 3
44 -
- -
- -
- -
- -
-
Um
hlab
uyal
inga
na S
DIn
dica
tor
6.1
2 59
265
.94.
357
.4 -
- -
- -
- -
- -
-
Num
erat
or10
4 57
539
3 45
5 52
510
4 57
573
637
745
- -
- -
- -
- -
- -
Den
omin
ator
17 2
8515
1 82
015
8 79
217
285
65 7
62 -
- -
- -
- -
- -
-
uMkh
anya
kude
In
dica
tor
5.0
2 88
458
.44.
350
.2 -
- -
- -
- -
- -
-
Num
erat
or23
8 61
195
5 93
3 78
423
8 61
12
066
61 7
74 -
- -
- -
- -
- -
-
Den
omin
ator
47 8
2933
1 48
340
8 57
147
829
122
952
- -
- -
- -
- -
- -
KwaZ
ulu-
Nat
alIn
dica
tor
5.4
2 56
656
.25.
449
.46.
12
935
67.9
5.5
34.6
8.0
5 98
271
.75.
526
.8
Sout
h Af
rica
Indi
cato
r4.
42
568
67.4
5.1
59.3
5.3
2 89
478
.35.
037
.26.
94
227
84.3
5.4
20.3
Sour
ce:
DH
IS a
nd B
AS.
Annual trends
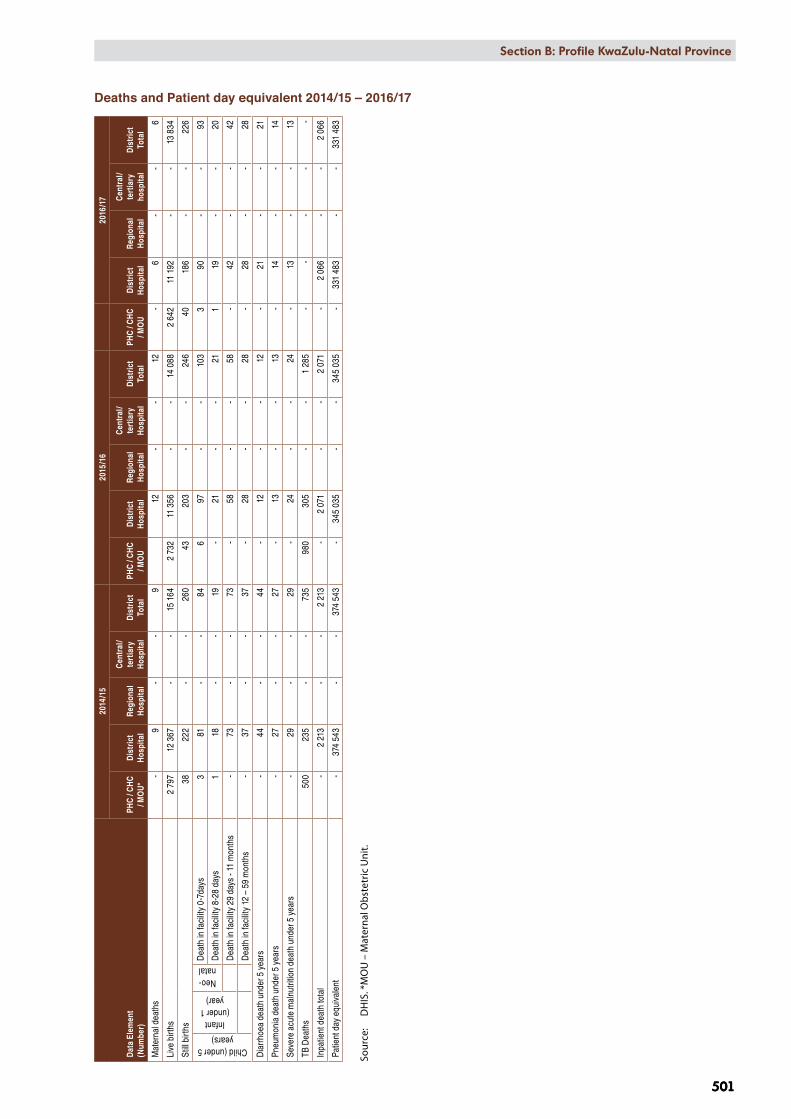
Section B: National and District Profiles
501
Section B: Profile KwaZulu-Natal Province
501
Deaths and Patient day equivalent 2014/15 – 2016/17
Dat
a El
emen
t(N
umbe
r)
2014
/15
2015
/16
2016
/17
PHC
/ CH
C / M
OU
*D
istr
ict
Hos
pita
lR
egio
nal
Hos
pita
l
Cen
tral
/te
rtia
ry
Hos
pita
lD
istr
ict
Tota
lPH
C / C
HC
/ MO
UD
istr
ict
Hos
pita
lR
egio
nal
Hos
pita
l
Cen
tral
/te
rtia
ry
Hos
pita
lD
istr
ict
Tota
lPH
C / C
HC
/ MO
UD
istr
ict
Hos
pita
lR
egio
nal
Hos
pita
l
Cen
tral
/te
rtia
ry
hosp
ital
Dis
tric
t To
tal
Mat
erna
l dea
ths
-9
--
912
--
12-
6-
-6
Live
birt
hs2
797
12 3
67-
-15
164
2 73
211
356
--
14 0
882
642
11 1
92-
-13
834
Still
birth
s38
222
--
260
4320
3-
-24
640
186
--
226
Child (under 5 years)
Infant (under 1
year)
Neo-natal
Dea
th in
faci
lity
0-7d
ays
381
--
846
97-
-10
33
90-
-93
Dea
th in
faci
lity
8-28
day
s 1
18-
-19
-21
--
211
19-
-20
Dea
th in
faci
lity
29 d
ays
- 11
mon
ths
-73
--
73-
58-
-58
-42
--
42
Dea
th in
faci
lity
12 –
59
mon
ths
-37
--
37-
28-
-28
-28
--
28
Dia
rrho
ea d
eath
und
er 5
yea
rs
-44
--
44-
12-
-12
-21
--
21
Pneu
mon
ia d
eath
und
er 5
yea
rs-
27-
-27
-13
--
13-
14-
-14
Seve
re a
cute
mal
nutri
tion
deat
h un
der 5
yea
rs
-29
--
29-
24-
-24
-13
--
13
TB D
eath
s 50
023
5-
-73
598
030
5-
-1
285
--
--
-
Inpa
tient
dea
th to
tal
-2
213
--
2 21
3-
2 07
1-
-2
071
-2
066
--
2 06
6
Patie
nt d
ay e
quiv
alen
t-
374
543
--
374
543
-34
5 03
5-
-34
5 03
5-
331
483
--
331
483
Sour
ce:
DH
IS. *
MO
U –
Mat
erna
l Obs
tetr
ic U
nit.

AgeGroup.. Female Male<5 years
5-1415-2425-64
65+Total 16%
14%10%15%
29%65%
37%8%
59%61%33%
17%
41%75%
27%13%
21%9%
5%3%4%
11%17%
9%
16%11%10%10%
24%65%
40%16%
55%26%
27%15%
31%69%
22%13%
25%10%
13%4%
13%50%
24%10%
KZN, uMkhanyakude: DC27, 2010 - 2015
Rank.. Female Male
<5 y
ears
12345678910
5-14
12345678910
15-2
4
12345678910
25-6
4
12345678910
65+
12345678910
Other perinatal conditions (2.9%)Poisonings (including herbal) (3.8%)
Birth asphyxia (7.0%)Protein-energy malnutrition (8.3%)Preterm birth complications (8.4%)
Septicaemia (2.2%)
Diarrhoeal diseases (23.3%)Lower respiratory infections (11.3%)
Tuberculosis (6.3%)
HIV/AIDS (11.3%)
Rheumatic heart disease (2.2%)
Drowning (6.6%)
Epilepsy (2.9%)
Meningitis/encephalitis (6.1%)Road injuries (4.4%)Nephritis/nephrosis (3.4%)
Diarrhoeal diseases (12.5%)Lower respiratory infections (7.9%)
Tuberculosis (20.9%)HIV/AIDS (18.0%)
Epilepsy (1.5%)
Meningitis/encephalitis (1.9%)
Accidental threats to breathing (2.7%)
Interpersonal violence (1.8%)
Road injuries (4.0%)
Nephritis/nephrosis (1.4%)
Diarrhoeal diseases (4.4%)
Lower respiratory infections (2.7%)
Tuberculosis (26.2%)HIV/AIDS (39.3%)
Cervix (3.4%)
Nephritis/nephrosis (1.4%)Hypertensive heart disease (1.5%)
Diabetes mellitus (2.8%)
Diarrhoeal diseases (3.6%)
Ischaemic heart disease (1.9%)
Cerebrovascular disease (5.0%)
Lower respiratory infections (3.1%)
Tuberculosis (19.9%)HIV/AIDS (39.5%)
Cervix (2.6%)
Nephritis/nephrosis (3.3%)
Hypertensive heart disease (11.9%)Diabetes mellitus (6.6%)
Diarrhoeal diseases (5.1%)
Ischaemic heart disease (5.6%)
Cerebrovascular disease (27.0%)
Lower respiratory infections (5.3%)Tuberculosis (5.3%)
HIV/AIDS (2.9%)
Other perinatal conditions (4.1%)
Sepsis/other newborn infectious (2.1%)Poisonings (including herbal) (3.4%)
Birth asphyxia (8.9%)
Protein-energy malnutrition (8.5%)Preterm birth complications (8.5%)
Diarrhoeal diseases (22.8%)
Lower respiratory infections (8.8%)
Tuberculosis (4.2%)
HIV/AIDS (11.7%)
Other neurological conditions (3.1%)
Drowning (11.3%)
Other respiratory (2.0%)
Meningitis/encephalitis (4.1%)Accidental threats to breathing (3.8%)
Road injuries (5.7%)
Diarrhoeal diseases (10.0%)
Lower respiratory infections (5.1%)
Tuberculosis (8.7%)
HIV/AIDS (20.5%)
Drowning (3.7%)
Meningitis/encephalitis (2.6%)
Mechanical forces (10.5%)
Accidental threats to breathing (13.9%)
Interpersonal violence (10.8%)
Road injuries (10.0%)
Diarrhoeal diseases (2.3%)
Lower respiratory infections (2.8%)
Tuberculosis (13.2%)
HIV/AIDS (15.0%)
Mechanical forces (3.1%)
Accidental threats to breathing (2.6%)Interpersonal violence (2.2%)
Road injuries (2.9%)
Diabetes mellitus (1.9%)
Diarrhoeal diseases (3.5%)
Cerebrovascular disease (3.2%)Lower respiratory infections (3.5%)
Tuberculosis (22.1%)HIV/AIDS (33.5%)
Prostate (6.0%)
Nephritis/nephrosis (4.2%)
Hypertensive heart disease (9.4%)
Diabetes mellitus (4.6%)
Diarrhoeal diseases (3.3%)
Ischaemic heart disease (5.6%)
Cerebrovascular disease (16.4%)
Lower respiratory infections (6.2%)
Tuberculosis (11.2%)
HIV/AIDS (5.4%)
Rank.. Maternal conditions All other causes
Fem
ale
15-4
9
12345678910
Maternal sepsis (4.9%) n=3
Abortion (18.3%) n=12Maternal haemorrhage (12.0%) n=8
Hypertension in pregnancy (8.7%) n=6
Other maternal (25.6%) n=17Indirect maternal (30.5%) n=21
Accidental threats to breathing (1.1%) n=57Endocrine nutritional,blood, immune (1.0%) n=51
Road injuries (1.7%) n=88
Cervix (2.6%) n=136
Cerebrovascular disease (1.7%) n=89Meningitis/encephalitis (1.7%) n=90
Diarrhoeal diseases (3.8%) n=200Lower respiratory infections (3.2%) n=170
Tuberculosis (23.1%) n=1 213HIV/AIDS (46.1%) n=2 421
Percentage ofdeaths by broad
causes andsingle leading
causes
BroadcauseInjury
NCD
HIV and TB
Comm_mat_peri_nut
Prov, DistrictKZN, uMkhanyakude: DC27
Show history
Percentages are shownaccording to all the deaths
within the age/gendercategory of each box,
although only the leading10 causes are displayed.
502
Section B: National and District Profiles
502
Section B: Profile KwaZulu-Natal Province
Burden of disease profile
For the percentage of deaths by broad cause, deaths are classified into four groups namely: (i) injuries; (ii) non-communicable diseases; (iii) HIV and TB; and (iv) communicable diseases together with maternal perinatal and nutritional conditions. Data are given by gender and age group for the period 2010–2015. The second part of the graph shows the 10 leading single causes of death within each age group (both genders) for 2010–2015 combined.
Percentage of deaths by broad cause and leading causes 2010–2015
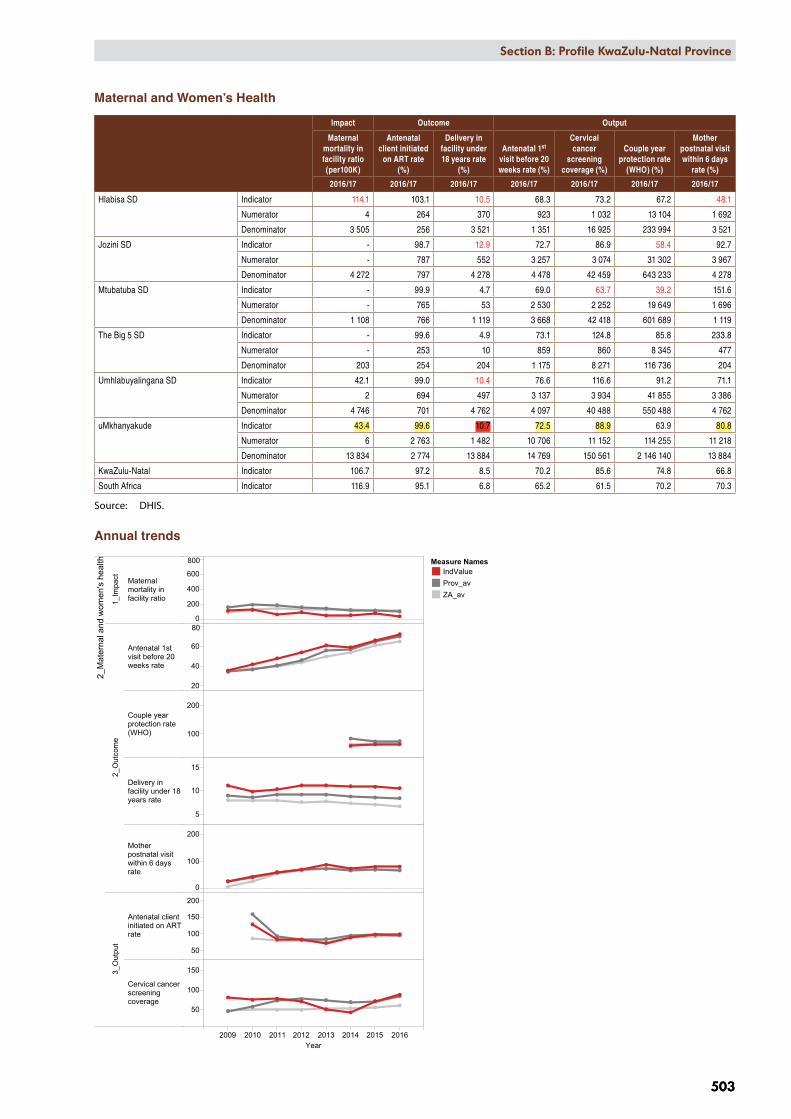
2009 2010 2011 2012 2013 2014 2015 2016Year
2_M
ater
nal a
nd w
omen
's h
ealth
1_Im
pact Maternal
mortality infacility ratio
2_O
utco
me
Antenatal 1stvisit before 20weeks rate
Couple yearprotection rate(WHO)
Delivery infacility under 18years rate
Motherpostnatal visitwithin 6 daysrate
3_O
utpu
t
Antenatal clientinitiated on ARTrate
Cervical cancerscreeningcoverage
0
200
400
600
800
20
40
60
80
100
200
5
10
15
0
100
200
50
100
150
200
50
100
150
KZN, DC27, uMkhanyakude District Municipality, SEQ 1 (most deprived)
Measure NamesIndValueProv_avZA_av
Section B: National and District Profiles
503
Section B: Profile KwaZulu-Natal Province
503
Maternal and Women’s Health
Impact Outcome Output
Maternal mortality in facility ratio (per100K)
Antenatal client initiated
on ART rate (%)
Delivery in facility under 18 years rate
(%)
Antenatal 1st visit before 20 weeks rate (%)
Cervical cancer
screening coverage (%)
Couple year protection rate
(WHO) (%)
Mother postnatal visit within 6 days
rate (%)
2016/17 2016/17 2016/17 2016/17 2016/17 2016/17 2016/17
Hlabisa SD Indicator 114.1 103.1 10.5 68.3 73.2 67.2 48.1
Numerator 4 264 370 923 1 032 13 104 1 692
Denominator 3 505 256 3 521 1 351 16 925 233 994 3 521
Jozini SD Indicator - 98.7 12.9 72.7 86.9 58.4 92.7
Numerator - 787 552 3 257 3 074 31 302 3 967
Denominator 4 272 797 4 278 4 478 42 459 643 233 4 278
Mtubatuba SD Indicator - 99.9 4.7 69.0 63.7 39.2 151.6
Numerator - 765 53 2 530 2 252 19 649 1 696
Denominator 1 108 766 1 119 3 668 42 418 601 689 1 119
The Big 5 SD Indicator - 99.6 4.9 73.1 124.8 85.8 233.8
Numerator - 253 10 859 860 8 345 477
Denominator 203 254 204 1 175 8 271 116 736 204
Umhlabuyalingana SD Indicator 42.1 99.0 10.4 76.6 116.6 91.2 71.1
Numerator 2 694 497 3 137 3 934 41 855 3 386
Denominator 4 746 701 4 762 4 097 40 488 550 488 4 762
uMkhanyakude Indicator 43.4 99.6 10.7 72.5 88.9 63.9 80.8
Numerator 6 2 763 1 482 10 706 11 152 114 255 11 218
Denominator 13 834 2 774 13 884 14 769 150 561 2 146 140 13 884
KwaZulu-Natal Indicator 106.7 97.2 8.5 70.2 85.6 74.8 66.8
South Africa Indicator 116.9 95.1 6.8 65.2 61.5 70.2 70.3
Source: DHIS.
Annual trends

504
Section B: National and District Profiles
504
Section B: Profile KwaZulu-Natal Province
Child and School Health
Impa
ctO
utco
me
Out
put
Chi
ld u
nder
5
year
s di
arrh
oea
case
fata
lity
rate
(%)
Chi
ld u
nder
5
year
s pn
eum
onia
ca
se fa
talit
y ra
te (%
)
Chi
ld u
nder
5
year
s se
vere
acu
te
mal
nutr
ition
ca
se fa
talit
y ra
te (%
)
Inpa
tient
de
ath
unde
r 1
year
rate
(%)
Inpa
tient
de
ath
unde
r 5
year
rate
(%)
Inpa
tient
ea
rly n
eona
tal
deat
h ra
te
(per
1K)
Inpa
tient
ne
onat
al
deat
h ra
te
(per
1K)
Infa
nt P
CR
test
pos
itive
ar
ound
10
wee
ks ra
te
(%)
Imm
unis
atio
n co
vera
ge
unde
r 1 y
ear
(%)
Infa
nt
excl
usiv
ely
brea
stfe
d at
D
TaP-
IPV-
Hib
-HB
V 3rd
do
se ra
te (%
)
Mea
sles
2nd
dos
e co
vera
ge (%
)
Scho
ol G
rade
1
scre
enin
g co
vera
ge (%
)
Scho
ol G
rade
8
scre
enin
g co
vera
ge (%
)
Vita
min
A
dose
12-
59
mon
ths
cove
rage
(%)
2016
/17
2016
/17
2016
/17
2016
/17
2016
/17
2016
/17
2016
/17
2016
/17
2016
/17
2016
/17
2016
/17
2016
/17
2016
/17
2016
/17
Hla
bisa
SD
In
dica
tor
4.9
12.0
12.5
11.5
8.1
10.6
12.0
0.2
109.
681
.812
9.7
17.0
21.0
40.4
Num
erat
or13
68
6583
3742
12
108
1 44
32
559
480
522
6 46
4
Den
omin
ator
263
5064
565
1 02
73
505
3 50
544
723
076
1 76
523
682
2 82
92
491
192
150
Jozi
ni S
D
Indi
cato
r2.
01.
14.
26.
93.
26.
68.
21.
573
.053
.588
.523
.816
.446
.8
Num
erat
or7
34
4651
2835
123
445
2 07
24
369
1 78
195
419
155
Den
omin
ator
342
273
9666
71
583
4 27
24
272
786
56 6
463
875
59 2
387
489
5 80
449
0 75
2
Mtu
batu
ba S
D
Indi
cato
r -
- -
100.
010
0.0
-0.
91.
171
.753
.990
.15.
63.
434
.3
Num
erat
or -
- -
11
1
103
081
1 74
94
081
344
139
12 8
87
Den
omin
ator
- -
-1
11
108
1 10
892
251
549
3 24
254
357
6 12
24
082
451
386
The
Big
5 SD
In
dica
tor
- -
- -
- -
-0.
596
.342
.910
1.3
27.7
23.6
68.1
Num
erat
or -
- -
- -
- -
174
638
480
641
218
84
422
Den
omin
ator
- -
- -
-20
320
321
29
300
895
9 54
61
488
797
77 9
58
Um
hlab
uyal
inga
na
SD
Indi
cato
r0.
31.
31.
45.
42.
95.
97.
41.
097
.762
.512
0.3
37.3
43.2
47.7
Num
erat
or1
51
4348
2835
83
870
2 67
74
923
2 37
11
743
16 0
30
Den
omin
ator
297
400
7279
91
681
4 74
64
746
782
47 5
114
282
49 1
166
356
4 03
640
3 59
0
uMkh
anya
kude
In
dica
tor
2.3
1.9
5.6
7.6
4.3
6.7
8.2
1.0
84.5
59.2
102.
522
.220
.643
.8
Num
erat
or21
1413
155
183
9311
332
13 2
508
325
16 7
385
388
3 54
658
958
Den
omin
ator
902
723
232
2 03
24
292
13 8
3413
834
3 14
918
8 08
214
059
195
939
291
408
206
520
1 61
5 83
6
KwaZ
ulu-
Nat
alIn
dica
tor
2.0
1.8
7.4
6.4
4.5
9.7
12.4
1.0
85.8
53.9
99.8
26.2
16.4
62.1
Sout
h Af
rica
Indi
cato
r2.
02.
08.
06.
34.
49.
912
.41.
382
.341
.696
.233
.019
.858
.0
Sour
ce:
DH
IS.
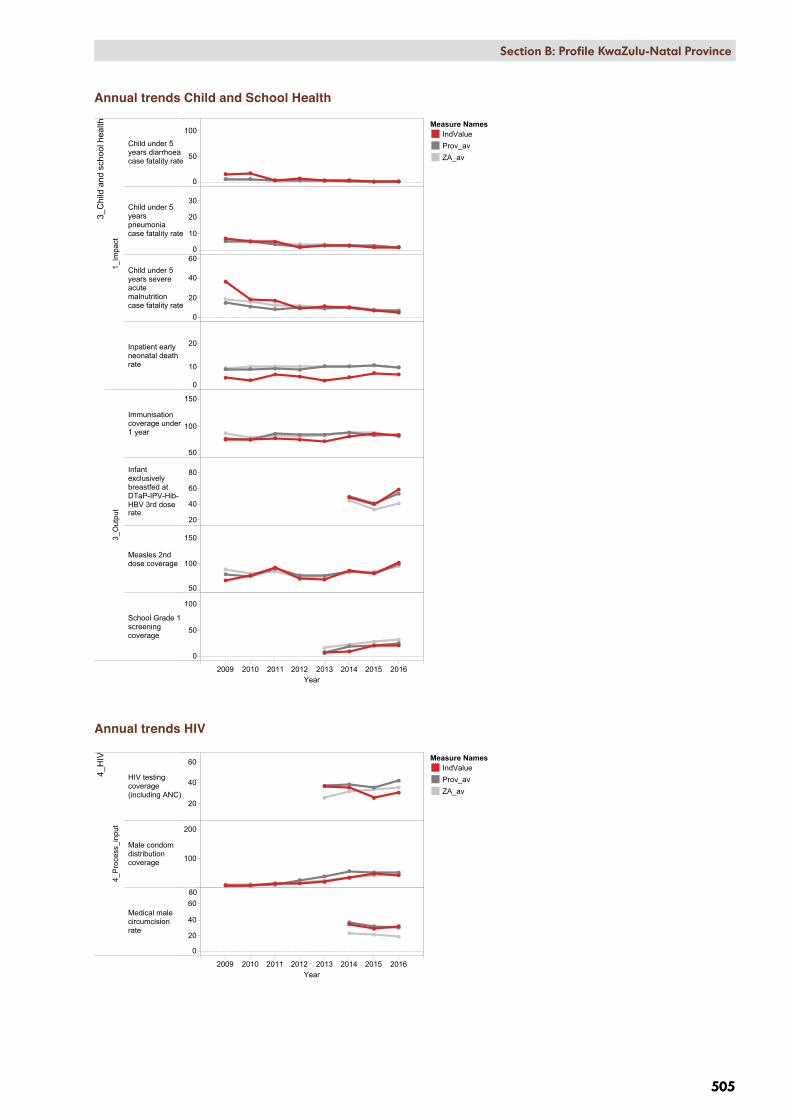
2009 2010 2011 2012 2013 2014 2015 2016Year
3_C
hild
and
sch
ool h
ealth
1_Im
pact
Child under 5years diarrhoeacase fatality rate
Child under 5yearspneumoniacase fatality rate
Child under 5years severeacutemalnutritioncase fatality rate
Inpatient earlyneonatal deathrate
3_O
utpu
t
Immunisationcoverage under1 year
Infantexclusivelybreastfed atDTaP-IPV-Hib-HBV 3rd doserate
Measles 2nddose coverage
School Grade 1screeningcoverage
0
50
100
0
10
20
30
0
20
40
60
0
10
20
50
100
150
20
40
60
80
50
100
150
0
50
100
KZN, DC27, uMkhanyakude District Municipality, SEQ 1 (most deprived)
Measure NamesIndValueProv_avZA_av
2009 2010 2011 2012 2013 2014 2015 2016Year
4_H
IV
4_P
roce
ss_i
nput
HIV testingcoverage(including ANC)
Male condomdistributioncoverage
Medical malecircumcisionrate
20
40
60
100
200
0
20
40
6080
KZN, DC27, uMkhanyakude District Municipality, SEQ 1 (most deprived)
Measure NamesIndValueProv_avZA_av
Section B: National and District Profiles
505
Section B: Profile KwaZulu-Natal Province
505
Annual trends Child and School Health
Annual trends HIV
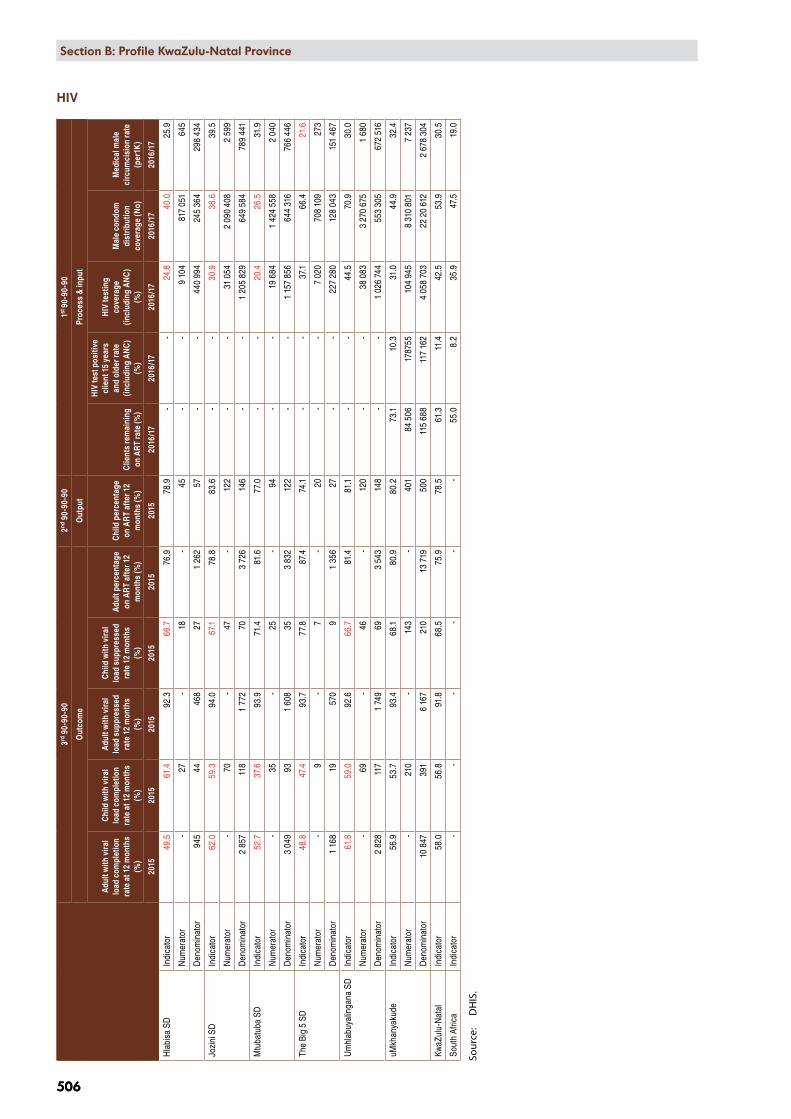
506
Section B: National and District Profiles
506
Section B: Profile KwaZulu-Natal Province
HIV
3rd
90-
90-9
02nd
90-
90-9
01st
90-9
0-90
Out
com
eO
utpu
tPr
oces
s &
inpu
t
Adu
lt w
ith v
iral
load
com
plet
ion
rate
at 1
2 m
onth
s (%
)
Chi
ld w
ith v
iral
load
com
plet
ion
rate
at 1
2 m
onth
s (%
)
Adu
lt w
ith v
iral
load
sup
pres
sed
rate
12
mon
ths
(%)
Chi
ld w
ith v
iral
load
sup
pres
sed
rate
12
mon
ths
(%)
Adu
lt pe
rcen
tage
on
AR
T af
ter 1
2 m
onth
s (%
)
Chi
ld p
erce
ntag
e on
AR
T af
ter 1
2 m
onth
s (%
)C
lient
s re
mai
ning
on
AR
T ra
te (%
)
HIV
test
pos
itive
cl
ient
15
year
s an
d ol
der r
ate
(incl
udin
g A
NC
) (%
)
HIV
test
ing
cove
rage
(in
clud
ing
AN
C)
(%)
Mal
e co
ndom
di
strib
utio
n co
vera
ge (N
o)
Med
ical
mal
e ci
rcum
cisi
on ra
te
(per
1K)
2015
2015
2015
2015
2015
2015
2016
/17
2016
/17
2016
/17
2016
/17
2016
/17
Hla
bisa
SD
Indi
cato
r49
.561
.492
.366
.776
.978
.9 -
-24
.840
.025
.9
Num
erat
or -
27 -
18 -
45 -
-9
104
817
051
645
Den
omin
ator
945
4446
827
1 26
257
- -
440
994
245
364
298
434
Jozi
ni S
DIn
dica
tor
62.0
59.3
94.0
67.1
78.8
83.6
- -
30.9
38.6
39.5
Num
erat
or -
70 -
47 -
122
- -
31 0
542
090
408
2 59
9
Den
omin
ator
2 85
711
81
772
703
726
146
- -
1 20
5 82
964
9 58
478
9 44
1
Mtu
batu
ba S
DIn
dica
tor
52.7
37.6
93.9
71.4
81.6
77.0
- -
20.4
26.5
31.9
Num
erat
or -
35 -
25 -
94 -
-19
684
1 42
4 55
82
040
Den
omin
ator
3 04
993
1 60
835
3 83
212
2 -
-1
157
856
644
316
766
446
The
Big
5 SD
Indi
cato
r48
.847
.493
.777
.887
.474
.1 -
-37
.166
.421
.6
Num
erat
or -
9 -
7 -
20 -
-7
020
708
109
273
Den
omin
ator
1 16
819
570
91
356
27 -
-22
7 28
012
8 04
315
1 46
7
Um
hlab
uyal
inga
na S
DIn
dica
tor
61.8
59.0
92.6
66.7
81.4
81.1
- -
44.5
70.9
30.0
Num
erat
or -
69 -
46 -
120
- -
38 0
833
270
675
1 68
0
Den
omin
ator
2 82
811
71
749
693
543
148
- -
1 02
6 74
455
3 30
567
2 51
6
uMkh
anya
kude
In
dica
tor
56.9
53.7
93.4
68.1
80.9
80.2
73.1
10.3
31.0
44.9
32.4
Num
erat
or -
210
-14
3 -
401
84 5
0617
8755
104
945
8 31
0 80
17
237
Den
omin
ator
10 8
4739
16
167
210
13 7
1950
011
5 68
811
7 16
24
058
703
22 2
0 61
22
678
304
KwaZ
ulu-
Nat
alIn
dica
tor
58.0
56.8
91.8
68.5
75.9
78.5
61.3
11.4
42.5
53.9
30.5
Sout
h Af
rica
Indi
cato
r -
- -
- -
-55
.08.
235
.947
.519
.0
Sour
ce:
DH
IS.

Section B: National and District Profiles
507
Section B: Profile KwaZulu-Natal Province
507
TBIm
pact
Out
com
eO
utpu
tPr
oces
s &
inpu
t
TB d
eath
rate
(E
TR.n
et) (
%)
TB D
R cl
ient
de
ath
rate
(E
DR
Web
) (%
)
TB c
lient
loss
to
follo
w u
p ra
te
(ETR
.Net
) (%
)
TB c
lient
tr
eatm
ent
succ
ess
rate
(E
TR.n
et) (
%)
TB D
R cl
ient
loss
to
follo
w u
p ra
te
(ED
RW
eb) (
%)
TB D
R tr
eatm
ent
succ
ess
rate
(E
DR
Web
) (%
)
TB R
ifam
pici
n re
sist
ance
co
nfirm
ed c
lient
ra
te (%
)
TB R
ifam
pici
n re
sist
ant c
lient
s tr
eatm
ent
initi
atio
n ra
te (%
)
TB/H
IV c
o-in
fect
ed c
lient
on
AR
T ra
te (E
TR.
Net
) (%
)
TB c
lient
initi
ated
on
trea
tmen
t ra
te (%
)
TB s
ympt
om 5
ye
ars
and
olde
r sc
reen
ed in
fa
cilit
y ra
te (%
)
2015
2014
2015
2015
2014
2014
2016
2016
2016
2016
2016
/17
Hla
bisa
SD
Indi
cato
r8.
0 -
1.2
87.9
- -
- -
98.0
-60
.4
Num
erat
or47
-7
517
- -
- -
288
-92
270
Den
omin
ator
588
-58
858
8 -
- -
-29
4 -
152
811
Jozi
ni S
DIn
dica
tor
2.9
-0.
787
.8 -
- -
-96
.5 -
79.7
Num
erat
or39
-9
1 17
4 -
- -
-43
5 -
442
135
Den
omin
ator
1 33
7 -
1 33
71
337
- -
- -
451
-55
4 56
3
Mtu
batu
ba S
DIn
dica
tor
4.6
-0.
492
.4 -
- -
-98
.5 -
51.0
Num
erat
or49
-4
986
- -
- -
399
-22
4 22
6
Den
omin
ator
1 06
7 -
1 06
71
067
- -
- -
405
-43
9 36
6
The
Big
5 SD
Indi
cato
r4.
5 -
0.2
93.3
- -
- -
97.1
-62
.2
Num
erat
or18
-1
375
- -
- -
100
-84
762
Den
omin
ator
402
-40
240
2 -
- -
-10
3 -
136
353
Um
hlab
uyal
inga
na S
DIn
dica
tor
7.6
-3.
083
.9 -
- -
-97
.0 -
78.9
Num
erat
or10
5 -
411
161
- -
- -
639
-38
4 36
0
Den
omin
ator
1 38
3 -
1 38
31
383
- -
- -
659
-48
7 00
6
uMkh
anya
kude
In
dica
tor
5.4
17.2
1.3
88.2
6.7
71.1
10.5
83.8
97.3
72.8
69.4
Num
erat
or25
862
624
213
2425
626
522
21
861
1 84
41
227
753
Den
omin
ator
4 77
736
04
777
4 77
736
036
02
532
265
1 91
22
532
1 77
0 09
9
KwaZ
ulu-
Nat
alIn
dica
tor
5.4
19.0
4.8
82.7
17.2
59.6
7.7
73.8
85.7
62.4
78.3
Sout
h Af
rica
Indi
cato
r6.
623
.06.
481
.017
.950
.56.
268
.088
.372
.851
.6
Sour
ce:
DH
IS.

2009 2010 2011 2012 2013 2014 2015 2016Year
5_TB
1_Im
pact
TB death rate(ETR.net)
TB DR clientdeath rate(EDRWeb)
2_O
utco
me
TB client lost tofollow up rate(ETR.Net)
TB clienttreatmentsuccess rate(ETR.net)
TB DR clientloss to follow uprate (EDRWeb)
TB DRtreatmentsuccess rate(EDRWeb)
TB Rifampicinresistanceconfirmed clientrate
TB/HIVco-infectedclient on ARTrate (ETR.Net)
4_P
roce
ss_i
nput
TB symptom 5years and olderscreened infacility rate
5
10
15
0
20
40
60
0
5
10
15
40
60
80
0
20
40
0
20
40
60
0
10
20
0
50
100
0
50
100
KZN, DC27, uMkhanyakude District Municipality, SEQ 1 (most deprived)
Measure NamesIndValueProv_avZA_av
508
Section B: National and District Profiles
508
Section B: Profile KwaZulu-Natal Province
Annual trends TB

2010 2011 2012 2013 2014 2015 2016 2017Year
6_NCDs
2_Outcome
Diabetesincidence
Hypertensionincidence
0
5
20
40
KZN, DC27, uMkhanyakude District Municipality, SEQ 1 (most deprived)
Measure NamesIndValueProv_avZA_av
Section B: National and District Profiles
509
Section B: Profile KwaZulu-Natal Province
509
Non-communicable diseases
Outcome
Diabetes incidence
(per1K)
Hypertension incidence
(per1K)
2016/17 2016/17
Hlabisa SD Indicator 3.5 29.9
Numerator 265 438
Denominator 900 228 175 806
Jozini SD Indicator 0.4 14.0
Numerator 81 485
Denominator 2 343 495 414 927
Mtubatuba SD Indicator 1.0 14.2
Numerator 179 496
Denominator 2 220 132 418 992
The Big 5 SD Indicator 0.9 37.4
Numerator 32 254
Denominator 419 370 81 516
Umhlabuyalingana SD Indicator 2.2 13.4
Numerator 360 443
Denominator 2 000 139 397 230
uMkhanyakude Indicator 1.4 17.1
Numerator 917 2 116
Denominator 7 883 364 1 488 471
KwaZulu-Natal Indicator 2.8 21.7
South Africa Indicator 2.5 18.9
Source: DHIS.
Annual trends
Sub-district value in red – improvement strategies are urgently needed
Value highlighted in yellow – performance is ranked among the 10 best in the country
Value highlighted in red – performance is ranked among the 10 worst in the country
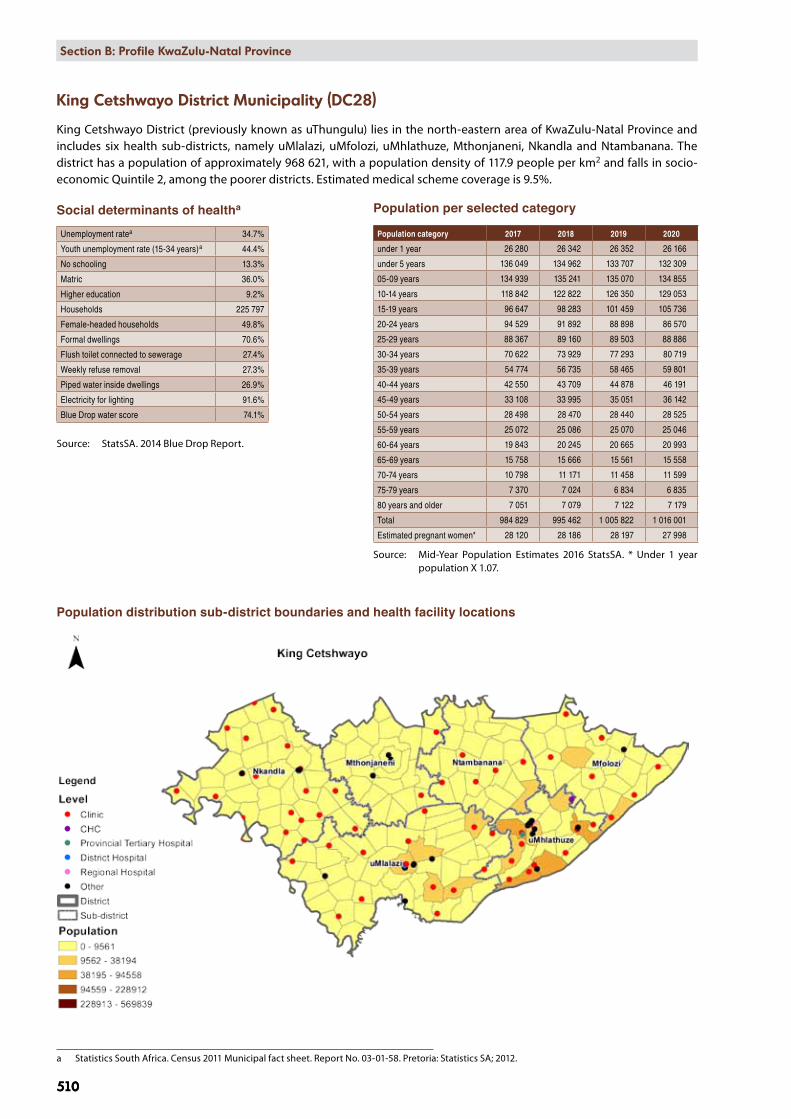
510
Section B: National and District Profiles
510
Section B: Profile KwaZulu-Natal Province
King Cetshwayo District Municipality (DC28)
King Cetshwayo District (previously known as uThungulu) lies in the north-eastern area of KwaZulu-Natal Province and includes six health sub-districts, namely uMlalazi, uMfolozi, uMhlathuze, Mthonjaneni, Nkandla and Ntambanana. The district has a population of approximately 968 621, with a population density of 117.9 people per km2 and falls in socio-economic Quintile 2, among the poorer districts. Estimated medical scheme coverage is 9.5%.
Social determinants of healtha
Unemployment ratea 34.7%
Youth unemployment rate (15-34 years)a 44.4%
No schooling 13.3%
Matric 36.0%
Higher education 9.2%
Households 225 797
Female-headed households 49.8%
Formal dwellings 70.6%
Flush toilet connected to sewerage 27.4%
Weekly refuse removal 27.3%
Piped water inside dwellings 26.9%
Electricity for lighting 91.6%
Blue Drop water score 74.1%
Source: StatsSA. 2014 Blue Drop Report.
Population distribution sub-district boundaries and health facility locations
a Statistics South Africa. Census 2011 Municipal fact sheet. Report No. 03-01-58. Pretoria: Statistics SA; 2012.
Population per selected category
Population category 2017 2018 2019 2020
under 1 year 26 280 26 342 26 352 26 166
under 5 years 136 049 134 962 133 707 132 309
05-09 years 134 939 135 241 135 070 134 855
10-14 years 118 842 122 822 126 350 129 053
15-19 years 96 647 98 283 101 459 105 736
20-24 years 94 529 91 892 88 898 86 570
25-29 years 88 367 89 160 89 503 88 886
30-34 years 70 622 73 929 77 293 80 719
35-39 years 54 774 56 735 58 465 59 801
40-44 years 42 550 43 709 44 878 46 191
45-49 years 33 108 33 995 35 051 36 142
50-54 years 28 498 28 470 28 440 28 525
55-59 years 25 072 25 086 25 070 25 046
60-64 years 19 843 20 245 20 665 20 993
65-69 years 15 758 15 666 15 561 15 558
70-74 years 10 798 11 171 11 458 11 599
75-79 years 7 370 7 024 6 834 6 835
80 years and older 7 051 7 079 7 122 7 179
Total 984 829 995 462 1 005 822 1 016 001
Estimated pregnant women* 28 120 28 186 28 197 27 998
Source: Mid-Year Population Estimates 2016 StatsSA. * Under 1 year population X 1.07.

Section B: National and District Profiles
511
Section B: Profile KwaZulu-Natal Province
511
Number of facilities by level, 2016/17
Ward based outreach
teams Clinic CHCDistrict Hospital
Regional Hospital
Central/Tertiary
HospitalsOther
Hospitals
Mthonjaneni SD 8 5 0 1 0 0 1
Nkandla SD 20 19 0 2 0 0 1
Ntambanana SD 5 5 0 0 0 0 1
uMfolozi SD 7 7 0 0 0 0 1
uMhlathuze SD 12 13 1 0 1 1 3
uMlalazi SD 14 16 0 3 0 0 1
King Cetshwayo 66 65 1 6 1 1 8
Source: DHIS.
Human resources – filled posts, 2016
Community Health
WorkersNursing
assistantsEnrolled
nurseProfessional
nurseMedical
practitioners PharmacistsDental
practitionersOccupational
therapy Physiotherapy
Speech Therapy and Audiology
King Cetshwayo 1 030 460 1 205 1 536 305 56 12 9 15 12
Source: Persal, DHIS.
Management and efficiency indicators for the service delivery platform, 2016/17
PHC Management
Output Process & input
PHC utilisation rate (No)
Percentage Ideal clinics
(%)
Percentage of assessed PHC facilities with 90% of tracer
medicines available (%)
Provincial and LG
District Health Services
expenditure per capita
(uninsured) (Rand)
Provincial and LG PHC expenditure per capita
(uninsured) (Rand)
Provincial and LG PHC expenditure
per PHC headcount
(Rand)
2016/17 2016/17 2016/17 2016/17 2016/17 2016/17
Mthonjaneni SD Indicator 3.2 - - - - -
Numerator 163 275 - - - - -
Denominator 615 441 - - - - -
Nkandla SD Indicator 3.2 - - - - -
Numerator 390 102 - - - - -
Denominator 1 474 515 - - - - -
Ntambanana SD Indicator 1.9 - - - - -
Numerator 149 597 - - - - -
Denominator 954 375 - - - - -
uMfolozi SD Indicator 2.3 - - - - -
Numerator 304 809 - - - - -
Denominator 1 575 993 - - - - -
uMhlathuze SD Indicator 3.2 - - - - -
Numerator 1 125 650 - - - - -
Denominator 4 285 911 - - - - -
uMlalazi SD Indicator 2.4 - - - - -
Numerator 556 591 - - - - -
Denominator 2 746 767 - - - - -
King Cetshwayo Indicator 2.8 40.3 86.7 1 960 1 164 380
Numerator 2 690 024 25 52 1 719 058 277 1 021 226 884 1 021 226 884
Denominator 11 653 002 62 60 877 072 877 072 2 690 024
KwaZulu-Natal Indicator 2.7 47.8 90.8 1 879 1 213 397
South Africa Indicator 2.3 29.8 78.4 17 26 1 054 389
Source: DHIS.
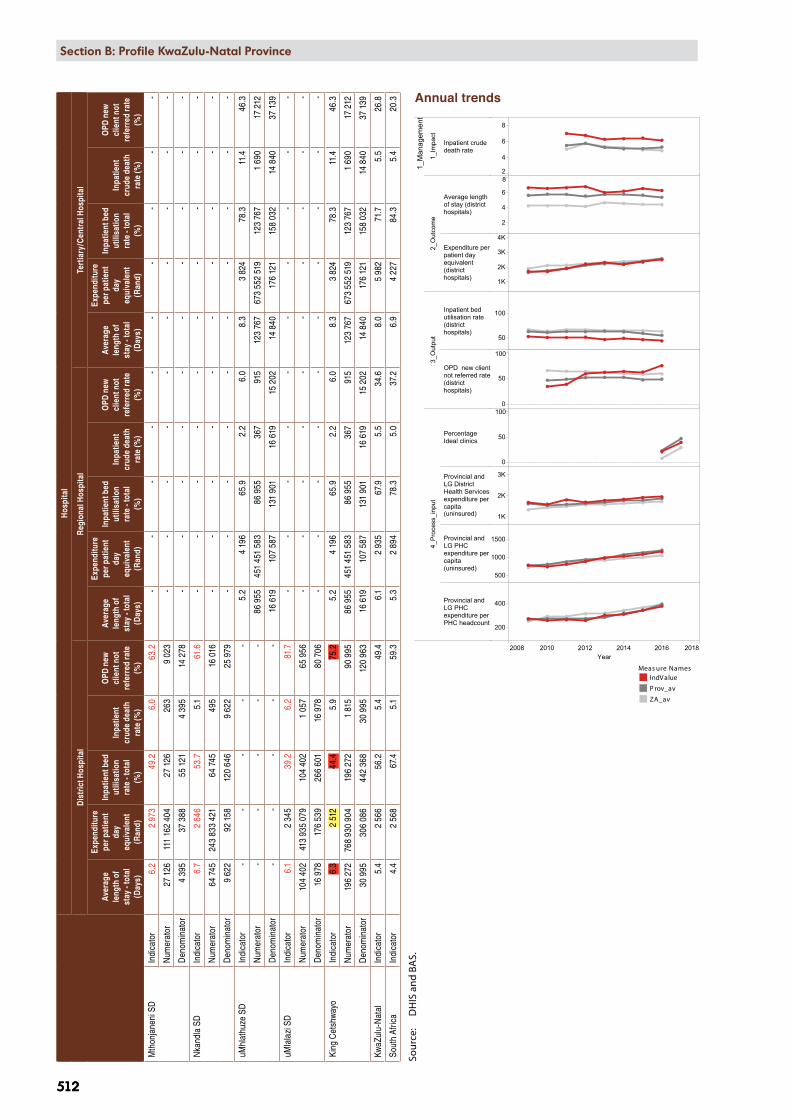
2008 2010 2012 2014 2016 2018Year
1_M
anag
emen
t
1_Im
pact
Inpatient crudedeath rate
2_O
utco
me
Average lengthof stay (districthospitals)
Expenditure perpatient dayequivalent(districthospitals)
3_O
utpu
t
Inpatient bedutilisation rate(districthospitals)
OPD new clientnot referred rate(districthospitals)
4_P
roce
ss_i
nput
PercentageIdeal clinics
Provincial andLG DistrictHealth Servicesexpenditure percapita(uninsured)
Provincial andLG PHCexpenditure percapita(uninsured)
Provincial andLG PHCexpenditure perPHC headcount
2
4
6
8
2
4
6
8
1K
2K
3K
4K
50
100
0
50
100
0
50
100
1K
2K
3K
500
1000
1500
200
400
KZN, DC28, King Cetshwayo District Municipality, SEQ 2 (deprived)
Measure NamesIndValueProv_avZA_av
Meas ure NamesIndV alue
P rov_av
ZA_av
512
Section B: National and District Profiles
512
Section B: Profile KwaZulu-Natal ProvinceH
ospi
tal
Dis
tric
t Hos
pita
lR
egio
nal H
ospi
tal
Tert
iary
/Cen
tral
Hos
pita
l
Aver
age
leng
th o
f st
ay -
tota
l (D
ays)
Expe
nditu
re
per p
atie
nt
day
equi
vale
nt
(Ran
d)
Inpa
tient
bed
ut
ilisa
tion
rate
- to
tal
(%)
Inpa
tient
cr
ude
deat
h ra
te (%
)
OPD
new
cl
ient
not
re
ferr
ed ra
te
(%)
Aver
age
leng
th o
f st
ay -
tota
l (D
ays)
Expe
nditu
re
per p
atie
nt
day
equi
vale
nt
(Ran
d)
Inpa
tient
bed
ut
ilisa
tion
rate
- to
tal
(%)
Inpa
tient
cr
ude
deat
h ra
te (%
)
OPD
new
cl
ient
not
re
ferr
ed ra
te
(%)
Aver
age
leng
th o
f st
ay -
tota
l (D
ays)
Expe
nditu
re
per p
atie
nt
day
equi
vale
nt
(Ran
d)
Inpa
tient
bed
ut
ilisa
tion
rate
- to
tal
(%)
Inpa
tient
cr
ude
deat
h ra
te (%
)
OPD
new
cl
ient
not
re
ferr
ed ra
te
(%)
Mth
onja
neni
SD
Indi
cato
r6.
22
973
49.2
6.0
63.2
- -
- -
- -
- -
- -
Num
erat
or27
126
111
162
404
27 1
2626
39
023
- -
- -
- -
- -
- -
Den
omin
ator
4 39
537
388
55 1
214
395
14 2
78 -
- -
- -
- -
- -
-
Nka
ndla
SD
Indi
cato
r6.
72
646
53.7
5.1
61.6
- -
- -
- -
- -
- -
Num
erat
or64
745
243
833
421
64 7
4549
516
016
- -
- -
- -
- -
- -
Den
omin
ator
9 62
292
158
120
646
9 62
225
979
- -
- -
- -
- -
- -
uMhl
athu
ze S
DIn
dica
tor
- -
- -
-5.
24
196
65.9
2.2
6.0
8.3
3 82
478
.311
.446
.3
Num
erat
or -
- -
- -
86 9
5545
1 45
1 58
386
955
367
915
123
767
673
552
519
123
767
1 69
017
212
Den
omin
ator
- -
- -
-16
619
107
587
131
901
16 6
1915
202
14 8
4017
6 12
115
8 03
214
840
37 1
39
uMla
lazi
SD
Indi
cato
r6.
12
345
39.2
6.2
81.7
- -
- -
- -
- -
- -
Num
erat
or10
4 40
241
3 93
5 07
910
4 40
21
057
65 9
56 -
- -
- -
- -
- -
-
Den
omin
ator
16 9
7817
6 53
926
6 60
116
978
80 7
06 -
- -
- -
- -
- -
-
King
Cet
shw
ayo
Indi
cato
r6.
32
512
44.4
5.9
75.2
5.2
4 19
665
.92.
26.
08.
33
824
78.3
11.4
46.3
Num
erat
or19
6 27
276
8 93
0 90
419
6 27
21
815
90 9
9586
955
451
451
583
86 9
5536
791
512
3 76
767
3 55
2 51
912
3 76
71
690
17 2
12
Den
omin
ator
30 9
9530
6 08
644
2 36
830
995
120
963
16 6
1910
7 58
713
1 90
116
619
15 2
0214
840
176
121
158
032
14 8
4037
139
KwaZ
ulu-
Nat
alIn
dica
tor
5.4
2 56
656
.25.
449
.46.
12
935
67.9
5.5
34.6
8.0
5 98
271
.75.
526
.8
Sout
h Af
rica
Indi
cato
r4.
42
568
67.4
5.1
59.3
5.3
2 89
478
.35.
037
.26.
94
227
84.3
5.4
20.3
Sour
ce:
DH
IS a
nd B
AS.
Annual trends

Section B: National and District Profiles
513
Section B: Profile KwaZulu-Natal Province
513
Deaths and Patient day equivalent 2014/15 – 2016/17
Dat
a El
emen
t(N
umbe
r)
2014
/15
2015
/16
2016
/17
PHC
/ CH
C / M
OU
*D
istr
ict
Hos
pita
lR
egio
nal
Hos
pita
l
Cen
tral
/te
rtia
ry
Hos
pita
lD
istr
ict
Tota
lPH
C / C
HC
/ MO
UD
istr
ict
Hos
pita
lR
egio
nal
Hos
pita
l
Cen
tral
/te
rtia
ry
Hos
pita
lD
istr
ict
Tota
lPH
C / C
HC
/ MO
UD
istr
ict
Hos
pita
lR
egio
nal
Hos
pita
l
Cen
tral
/te
rtia
ry
hosp
ital
Dis
tric
t To
tal
Mat
erna
l dea
ths
-10
331
44-
524
-29
-2
22-
24
Live
birt
hs4
626
7 35
68
341
-20
323
4 11
66
806
7 92
7-
18 8
494
028
6 46
67
569
-18
063
Still
birth
s53
141
312
-50
639
9936
2-
500
3811
335
6-
507
Child (under 5 years)
Infant (under 1
year)
Neo-natal
Dea
th in
faci
lity
0-7d
ays
159
193
-25
38
5420
1-
263
336
132
-17
1
Dea
th in
faci
lity
8-28
day
s -
575
383
-3
86-
891
1357
-71
Dea
th in
faci
lity
29 d
ays
- 11
mon
ths
-68
3261
161
-48
621
111
-12
47-
59
Dea
th in
faci
lity
12 –
59
mon
ths
-42
1833
93-
2937
167
-15
367
58
Dia
rrho
ea d
eath
und
er 5
yea
rs
-17
526
48-
1110
-21
-4
11-
15
Pneu
mon
ia d
eath
und
er 5
yea
rs-
1510
2853
-8
35-
43-
47
-11
Seve
re a
cute
mal
nutri
tion
deat
h un
der 5
yea
rs
-36
1216
64-
1815
-33
-9
16-
25
TB D
eath
s 1
248
1 36
8-
62
622
1 31
41
374
624
2 71
8-
--
--
Inpa
tient
dea
th to
tal
-1
924
391
2 13
74
452
-1
876
477
1 84
14
194
-1
815
367
1 69
03
872
Patie
nt d
ay e
quiv
alen
t-
339
368
95 2
7423
0 86
766
5 50
9-
329
052
115
578
192
496
637
126
-30
6 08
610
7 58
717
6 12
158
9 79
4
Sour
ce:
DH
IS. *
MO
U –
Mat
erna
l Obs
tetr
ic U
nit.
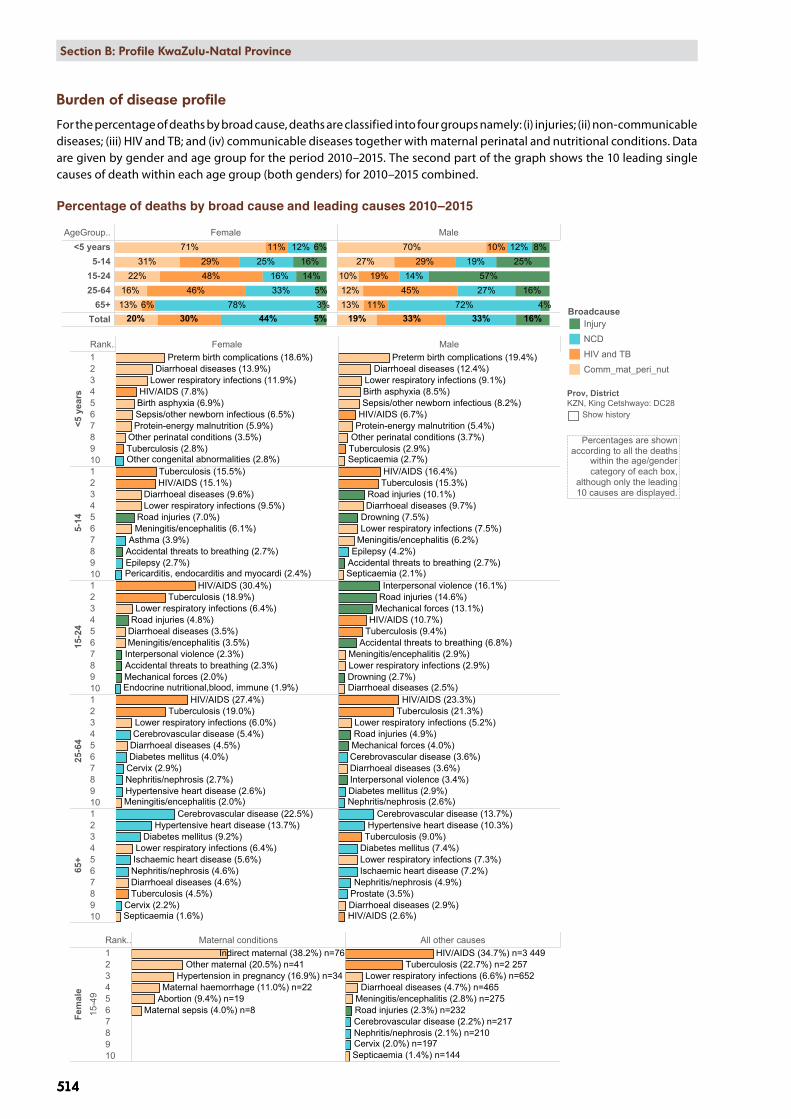
AgeGroup.. Female Male<5 years
5-1415-2425-64
65+Total 20%
13%16%
22%31%
71%
30%6%
46%48%29%
11%
44%78%
33%16%
25%12%
5%3%5%
14%16%
6%
19%13%12%10%
27%70%
33%11%
45%19%
29%10%
33%72%
27%14%
19%12%
16%4%
16%57%
25%8%
KZN, King Cetshwayo: DC28, 2010 - 2015
Rank.. Female Male
<5 y
ears
12345678910
5-14
12345678910
15-2
4
12345678910
25-6
4
12345678910
65+
12345678910
Other congenital abnormalities (2.8%)
Other perinatal conditions (3.5%)
Sepsis/other newborn infectious (6.5%)Birth asphyxia (6.9%)
Protein-energy malnutrition (5.9%)
Preterm birth complications (18.6%)Diarrhoeal diseases (13.9%)
Lower respiratory infections (11.9%)
Tuberculosis (2.8%)
HIV/AIDS (7.8%)
Pericarditis, endocarditis and myocardi (2.4%)Epilepsy (2.7%)
Asthma (3.9%)Meningitis/encephalitis (6.1%)
Accidental threats to breathing (2.7%)
Road injuries (7.0%)
Diarrhoeal diseases (9.6%)Lower respiratory infections (9.5%)
Tuberculosis (15.5%)HIV/AIDS (15.1%)
Endocrine nutritional,blood, immune (1.9%)
Meningitis/encephalitis (3.5%)
Mechanical forces (2.0%)Accidental threats to breathing (2.3%)Interpersonal violence (2.3%)
Road injuries (4.8%)Diarrhoeal diseases (3.5%)
Lower respiratory infections (6.4%)Tuberculosis (18.9%)
HIV/AIDS (30.4%)
Cervix (2.9%)
Meningitis/encephalitis (2.0%)
Nephritis/nephrosis (2.7%)Hypertensive heart disease (2.6%)
Diabetes mellitus (4.0%)Diarrhoeal diseases (4.5%)Cerebrovascular disease (5.4%)Lower respiratory infections (6.0%)
Tuberculosis (19.0%)HIV/AIDS (27.4%)
Cervix (2.2%)Septicaemia (1.6%)
Nephritis/nephrosis (4.6%)
Hypertensive heart disease (13.7%)Diabetes mellitus (9.2%)
Diarrhoeal diseases (4.6%)
Ischaemic heart disease (5.6%)
Cerebrovascular disease (22.5%)
Lower respiratory infections (6.4%)
Tuberculosis (4.5%)
Other perinatal conditions (3.7%)
Sepsis/other newborn infectious (8.2%)Birth asphyxia (8.5%)
Protein-energy malnutrition (5.4%)
Preterm birth complications (19.4%)
Septicaemia (2.7%)
Diarrhoeal diseases (12.4%)Lower respiratory infections (9.1%)
Tuberculosis (2.9%)
HIV/AIDS (6.7%)
Drowning (7.5%)
Epilepsy (4.2%)
Septicaemia (2.1%)
Meningitis/encephalitis (6.2%)
Accidental threats to breathing (2.7%)
Road injuries (10.1%)Diarrhoeal diseases (9.7%)
Lower respiratory infections (7.5%)
Tuberculosis (15.3%)HIV/AIDS (16.4%)
Drowning (2.7%)
Meningitis/encephalitis (2.9%)
Mechanical forces (13.1%)
Accidental threats to breathing (6.8%)
Interpersonal violence (16.1%)Road injuries (14.6%)
Diarrhoeal diseases (2.5%)
Lower respiratory infections (2.9%)
Tuberculosis (9.4%)HIV/AIDS (10.7%)
Mechanical forces (4.0%)
Interpersonal violence (3.4%)
Road injuries (4.9%)
Nephritis/nephrosis (2.6%)Diabetes mellitus (2.9%)
Diarrhoeal diseases (3.6%)Cerebrovascular disease (3.6%)
Lower respiratory infections (5.2%)Tuberculosis (21.3%)
HIV/AIDS (23.3%)
Prostate (3.5%)Nephritis/nephrosis (4.9%)
Hypertensive heart disease (10.3%)
Diabetes mellitus (7.4%)
Diarrhoeal diseases (2.9%)
Ischaemic heart disease (7.2%)
Cerebrovascular disease (13.7%)
Lower respiratory infections (7.3%)
Tuberculosis (9.0%)
HIV/AIDS (2.6%)
Rank.. Maternal conditions All other causes
Fem
ale
15-4
9
12345678910
Maternal sepsis (4.0%) n=8Abortion (9.4%) n=19Maternal haemorrhage (11.0%) n=22
Hypertension in pregnancy (16.9%) n=34Other maternal (20.5%) n=41
Indirect maternal (38.2%) n=76
Septicaemia (1.4%) n=144
Road injuries (2.3%) n=232
Cervix (2.0%) n=197Nephritis/nephrosis (2.1%) n=210Cerebrovascular disease (2.2%) n=217
Meningitis/encephalitis (2.8%) n=275Diarrhoeal diseases (4.7%) n=465Lower respiratory infections (6.6%) n=652
Tuberculosis (22.7%) n=2 257HIV/AIDS (34.7%) n=3 449
Percentage ofdeaths by broad
causes andsingle leading
causes
BroadcauseInjury
NCD
HIV and TB
Comm_mat_peri_nut
Prov, DistrictKZN, King Cetshwayo: DC28
Show history
Percentages are shownaccording to all the deaths
within the age/gendercategory of each box,
although only the leading10 causes are displayed.
514
Section B: National and District Profiles
514
Section B: Profile KwaZulu-Natal Province
Burden of disease profile
For the percentage of deaths by broad cause, deaths are classified into four groups namely: (i) injuries; (ii) non-communicable diseases; (iii) HIV and TB; and (iv) communicable diseases together with maternal perinatal and nutritional conditions. Data are given by gender and age group for the period 2010–2015. The second part of the graph shows the 10 leading single causes of death within each age group (both genders) for 2010–2015 combined.
Percentage of deaths by broad cause and leading causes 2010–2015
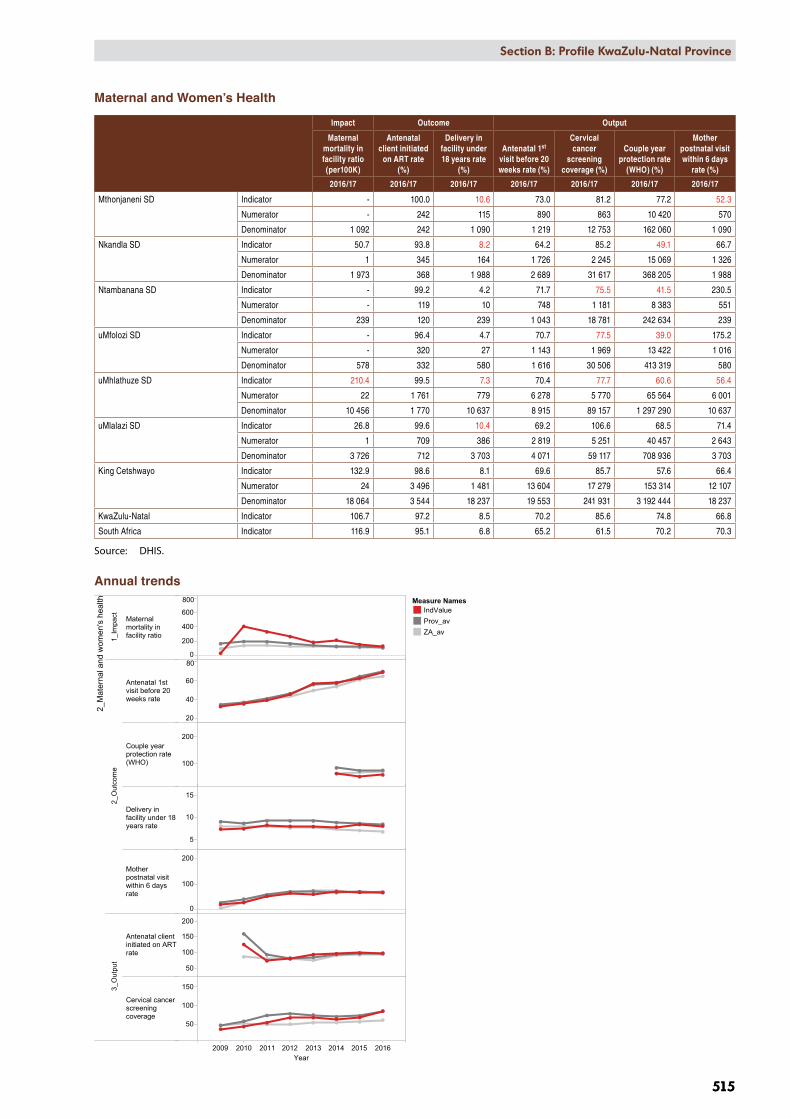
2009 2010 2011 2012 2013 2014 2015 2016Year
2_M
ater
nal a
nd w
omen
's h
ealth
1_Im
pact Maternal
mortality infacility ratio
2_O
utco
me
Antenatal 1stvisit before 20weeks rate
Couple yearprotection rate(WHO)
Delivery infacility under 18years rate
Motherpostnatal visitwithin 6 daysrate
3_O
utpu
t
Antenatal clientinitiated on ARTrate
Cervical cancerscreeningcoverage
0
200
400
600
800
20
40
60
80
100
200
5
10
15
0
100
200
50
100
150
200
50
100
150
KZN, DC28, King Cetshwayo District Municipality, SEQ 2 (deprived)
Measure NamesIndValueProv_avZA_av
Section B: National and District Profiles
515
Section B: Profile KwaZulu-Natal Province
515
Maternal and Women’s Health
Impact Outcome Output
Maternal mortality in facility ratio (per100K)
Antenatal client initiated
on ART rate (%)
Delivery in facility under 18 years rate
(%)
Antenatal 1st visit before 20 weeks rate (%)
Cervical cancer
screening coverage (%)
Couple year protection rate
(WHO) (%)
Mother postnatal visit within 6 days
rate (%)
2016/17 2016/17 2016/17 2016/17 2016/17 2016/17 2016/17
Mthonjaneni SD Indicator - 100.0 10.6 73.0 81.2 77.2 52.3
Numerator - 242 115 890 863 10 420 570
Denominator 1 092 242 1 090 1 219 12 753 162 060 1 090
Nkandla SD Indicator 50.7 93.8 8.2 64.2 85.2 49.1 66.7
Numerator 1 345 164 1 726 2 245 15 069 1 326
Denominator 1 973 368 1 988 2 689 31 617 368 205 1 988
Ntambanana SD Indicator - 99.2 4.2 71.7 75.5 41.5 230.5
Numerator - 119 10 748 1 181 8 383 551
Denominator 239 120 239 1 043 18 781 242 634 239
uMfolozi SD Indicator - 96.4 4.7 70.7 77.5 39.0 175.2
Numerator - 320 27 1 143 1 969 13 422 1 016
Denominator 578 332 580 1 616 30 506 413 319 580
uMhlathuze SD Indicator 210.4 99.5 7.3 70.4 77.7 60.6 56.4
Numerator 22 1 761 779 6 278 5 770 65 564 6 001
Denominator 10 456 1 770 10 637 8 915 89 157 1 297 290 10 637
uMlalazi SD Indicator 26.8 99.6 10.4 69.2 106.6 68.5 71.4
Numerator 1 709 386 2 819 5 251 40 457 2 643
Denominator 3 726 712 3 703 4 071 59 117 708 936 3 703
King Cetshwayo Indicator 132.9 98.6 8.1 69.6 85.7 57.6 66.4
Numerator 24 3 496 1 481 13 604 17 279 153 314 12 107
Denominator 18 064 3 544 18 237 19 553 241 931 3 192 444 18 237
KwaZulu-Natal Indicator 106.7 97.2 8.5 70.2 85.6 74.8 66.8
South Africa Indicator 116.9 95.1 6.8 65.2 61.5 70.2 70.3
Source: DHIS.
Annual trends
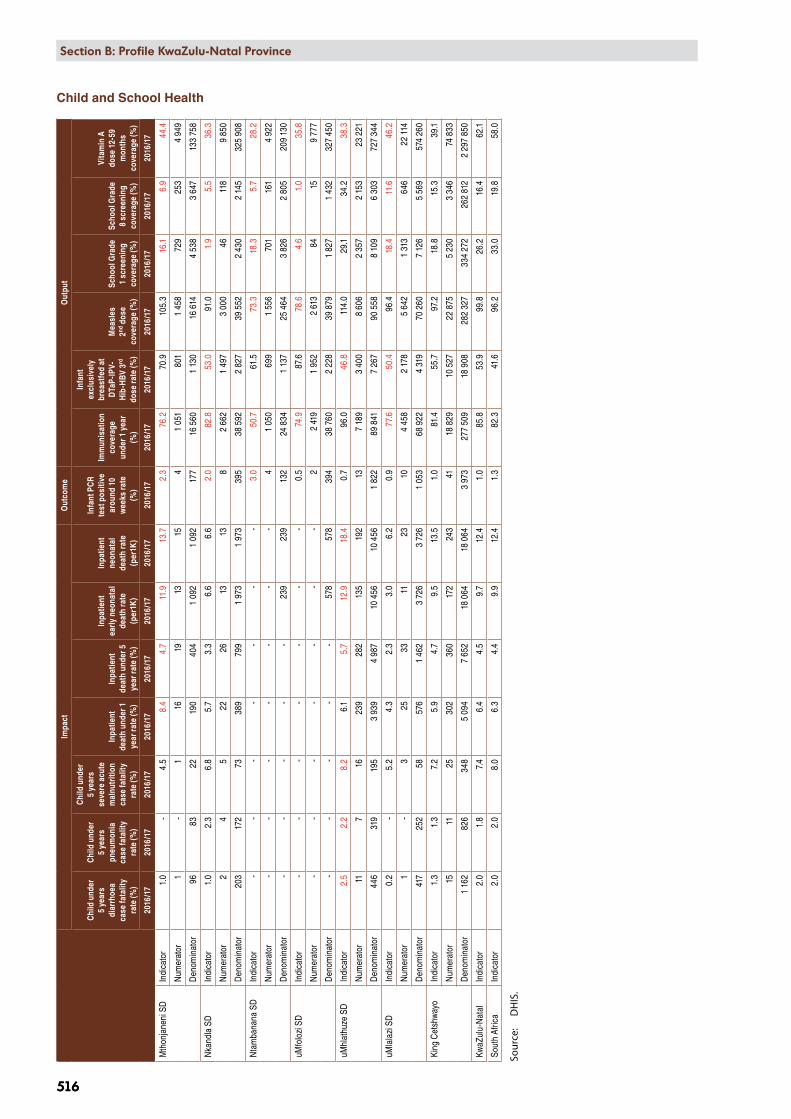
516
Section B: National and District Profiles
516
Section B: Profile KwaZulu-Natal Province
Child and School Health
Impa
ctO
utco
me
Out
put
Chi
ld u
nder
5
year
s di
arrh
oea
case
fata
lity
rate
(%)
Chi
ld u
nder
5
year
s pn
eum
onia
ca
se fa
talit
y ra
te (%
)
Chi
ld u
nder
5
year
s se
vere
acu
te
mal
nutr
ition
ca
se fa
talit
y ra
te (%
)
Inpa
tient
de
ath
unde
r 1
year
rate
(%)
Inpa
tient
de
ath
unde
r 5
year
rate
(%)
Inpa
tient
ea
rly n
eona
tal
deat
h ra
te
(per
1K)
Inpa
tient
ne
onat
al
deat
h ra
te
(per
1K)
Infa
nt P
CR
test
pos
itive
ar
ound
10
wee
ks ra
te
(%)
Imm
unis
atio
n co
vera
ge
unde
r 1 y
ear
(%)
Infa
nt
excl
usiv
ely
brea
stfe
d at
D
TaP-
IPV-
Hib
-HB
V 3rd
do
se ra
te (%
)
Mea
sles
2nd
dos
e co
vera
ge (%
)
Scho
ol G
rade
1
scre
enin
g co
vera
ge (%
)
Scho
ol G
rade
8
scre
enin
g co
vera
ge (%
)
Vita
min
A
dose
12-
59
mon
ths
cove
rage
(%)
2016
/17
2016
/17
2016
/17
2016
/17
2016
/17
2016
/17
2016
/17
2016
/17
2016
/17
2016
/17
2016
/17
2016
/17
2016
/17
2016
/17
Mth
onja
neni
SD
Indi
cato
r1.
0 -
4.5
8.4
4.7
11.9
13.7
2.3
76.2
70.9
105.
316
.16.
944
.4
Num
erat
or1
-1
1619
1315
41
051
801
1 45
872
925
34
949
Den
omin
ator
9683
2219
040
41
092
1 09
217
716
560
1 13
016
614
4 53
83
647
133
758
Nka
ndla
SD
Indi
cato
r1.
02.
36.
85.
73.
36.
66.
62.
082
.853
.091
.01.
95.
536
.3
Num
erat
or2
45
2226
1313
82
662
1 49
73
000
4611
89
850
Den
omin
ator
203
172
7338
979
91
973
1 97
339
538
592
2 82
739
552
2 43
02
145
325
908
Nta
mba
nana
SD
Indi
cato
r -
- -
- -
- -
3.0
50.7
61.5
73.3
18.3
5.7
28.2
Num
erat
or -
- -
- -
- -
41
050
699
1 55
670
116
14
922
Den
omin
ator
- -
- -
-23
923
913
224
834
1 13
725
464
3 82
62
805
209
130
uMfo
lozi
SD
Indi
cato
r -
- -
- -
- -
0.5
74.9
87.6
78.6
4.6
1.0
35.8
Num
erat
or -
- -
- -
- -
22
419
1 95
22
613
8415
9 77
7
Den
omin
ator
- -
- -
-57
857
839
438
760
2 22
839
879
1 82
71
432
327
450
uMhl
athu
ze S
DIn
dica
tor
2.5
2.2
8.2
6.1
5.7
12.9
18.4
0.7
96.0
46.8
114.
029
.134
.238
.3
Num
erat
or11
716
239
282
135
192
137
189
3 40
08
606
2 35
72
153
23 2
21
Den
omin
ator
446
319
195
3 93
94
987
10 4
5610
456
1 82
289
841
7 26
790
558
8 10
96
303
727
344
uMla
lazi
SD
Indi
cato
r0.
2 -
5.2
4.3
2.3
3.0
6.2
0.9
77.6
50.4
96.4
18.4
11.6
46.2
Num
erat
or1
-3
2533
1123
104
458
2 17
85
642
1 31
364
622
114
Den
omin
ator
417
252
5857
61
462
3 72
63
726
1 05
368
922
4 31
970
260
7 12
65
569
574
260
King
Cet
shw
ayo
Indi
cato
r1.
31.
37.
25.
94.
79.
513
.51.
081
.455
.797
.218
.815
.339
.1
Num
erat
or15
1125
302
360
172
243
4118
829
10 5
2722
875
5 23
03
346
74 8
33
Den
omin
ator
1 16
282
634
85
094
7 65
218
064
18 0
643
973
277
509
18 9
0828
2 32
733
4 27
226
2 81
22
297
850
KwaZ
ulu-
Nat
alIn
dica
tor
2.0
1.8
7.4
6.4
4.5
9.7
12.4
1.0
85.8
53.9
99.8
26.2
16.4
62.1
Sout
h Af
rica
Indi
cato
r2.
02.
08.
06.
34.
49.
912
.41.
382
.341
.696
.233
.019
.858
.0
Sour
ce:
DH
IS.

2009 2010 2011 2012 2013 2014 2015 2016Year
3_C
hild
and
sch
ool h
ealth
1_Im
pact
Child under 5years diarrhoeacase fatality rate
Child under 5yearspneumoniacase fatality rate
Child under 5years severeacutemalnutritioncase fatality rate
Inpatient earlyneonatal deathrate
3_O
utpu
t
Immunisationcoverage under1 year
Infantexclusivelybreastfed atDTaP-IPV-Hib-HBV 3rd doserate
Measles 2nddose coverage
School Grade 1screeningcoverage
0
50
100
0
10
20
30
0
20
40
60
0
10
20
50
100
150
20
40
60
80
50
100
150
0
50
100
KZN, DC28, King Cetshwayo District Municipality, SEQ 2 (deprived)
Measure NamesIndValueProv_avZA_av
Meas ure NamesIndV alue
P rov_av
ZA_av
2009 2010 2011 2012 2013 2014 2015 2016Year
4_H
IV
4_P
roce
ss_i
nput
HIV testingcoverage(including ANC)
Male condomdistributioncoverage
Medical malecircumcisionrate
20
40
60
100
200
0
20
40
6080
KZN, DC28, King Cetshwayo District Municipality, SEQ 2 (deprived)
Measure NamesIndValueProv_avZA_av
Meas ure NamesIndV alue
P rov_av
ZA_av
Section B: National and District Profiles
517
Section B: Profile KwaZulu-Natal Province
517
Annual trends Child and School Health
Annual trends HIV

518
Section B: National and District Profiles
518
Section B: Profile KwaZulu-Natal Province
HIV
3rd
90-
90-9
02nd
90-
90-9
01st
90-9
0-90
Out
com
eO
utpu
tPr
oces
s &
inpu
t
Adu
lt w
ith v
iral
load
com
plet
ion
rate
at 1
2 m
onth
s (%
)
Chi
ld w
ith v
iral
load
com
plet
ion
rate
at 1
2 m
onth
s (%
)
Adu
lt w
ith v
iral
load
sup
pres
sed
rate
12
mon
ths
(%)
Chi
ld w
ith v
iral
load
sup
pres
sed
rate
12
mon
ths
(%)
Adu
lt pe
rcen
tage
on
AR
T af
ter 1
2 m
onth
s (%
)
Chi
ld p
erce
ntag
e on
AR
T af
ter 1
2 m
onth
s (%
)C
lient
s re
mai
ning
on
AR
T ra
te (%
)
HIV
test
pos
itive
cl
ient
15
year
s an
d ol
der r
ate
(incl
udin
g A
NC
) (%
)
HIV
test
ing
cove
rage
(in
clud
ing
AN
C)
(%)
Mal
e co
ndom
di
strib
utio
n co
vera
ge (N
o)
Med
ical
mal
e ci
rcum
cisi
on ra
te
(per
1K)
2015
2015
2015
2015
2015
2015
2016
/17
2016
/17
2016
/17
2016
/17
2016
/17
Mth
onja
neni
SD
Indi
cato
r82
.074
.290
.547
.873
.773
.9 -
-55
.769
.336
.1
Num
erat
or -
23 -
11 -
34 -
-13
435
883
213
580
Den
omin
ator
772
3163
323
1 11
046
- -
289
614
152
835
192
636
Nka
ndla
SD
Indi
cato
r70
.267
.691
.684
.878
.681
.1 -
-53
.138
.941
.1
Num
erat
or -
46 -
39 -
73 -
-27
843
1 04
9 59
01
466
Den
omin
ator
1 13
668
798
461
738
90 -
-62
9 31
632
3 78
142
8 15
7
Nta
mba
nana
SD
Indi
cato
r92
.710
0.0
93.1
71.4
83.7
84.2
- -
24.2
38.2
38.3
Num
erat
or -
14 -
10 -
16 -
-8
787
738
140
943
Den
omin
ator
641
1459
414
830
19 -
-43
5 19
523
1 59
729
5 72
8
uMfo
lozi
SD
Indi
cato
r84
.873
.493
.468
.183
.986
.8 -
-25
.329
.926
.8
Num
erat
or -
47 -
32 -
66 -
-16
537
1 09
2 32
01
191
Den
omin
ator
1 43
964
1 22
047
1 77
976
- -
784
422
4 38
3 84
532
761
uMhl
athu
ze S
DIn
dica
tor
82.0
85.6
93.4
82.6
77.2
79.6
- -
45.2
40.4
33.1
Num
erat
or -
178
-14
7 -
222
- -
93 7
044
625
800
4 37
2
Den
omin
ator
6 21
620
85
096
178
8 67
427
9 -
-2
486
025
1 37
5 13
41
584
351
uMla
lazi
SD
Indi
cato
r74
.970
.192
.364
.066
.784
.0 -
-52
.860
.235
.9
Num
erat
or -
75 -
48 -
110
- -
55 9
373
464
909
2 59
0
Den
omin
ator
2 53
710
71
900
754
090
131
- -
1 27
1 82
069
0 90
686
5 65
9
King
Cet
shw
ayo
Indi
cato
r80
.477
.892
.974
.975
.781
.361
.011
.044
.044
.334
.3
Num
erat
or -
383
-28
7 -
521
105
433
26 2
6921
6 24
311
853
972
11 1
42
Den
omin
ator
12 7
4149
210
241
383
18 2
2164
117
2 96
023
8 52
75
896
392
3 21
2 63
73
899
292
KwaZ
ulu-
Nat
alIn
dica
tor
58.0
56.8
91.8
68.5
75.9
78.5
61.3
11.4
42.5
53.9
30.5
Sout
h Af
rica
Indi
cato
r -
- -
- -
-55
.08.
235
.947
.519
.0
Sour
ce:
DH
IS.
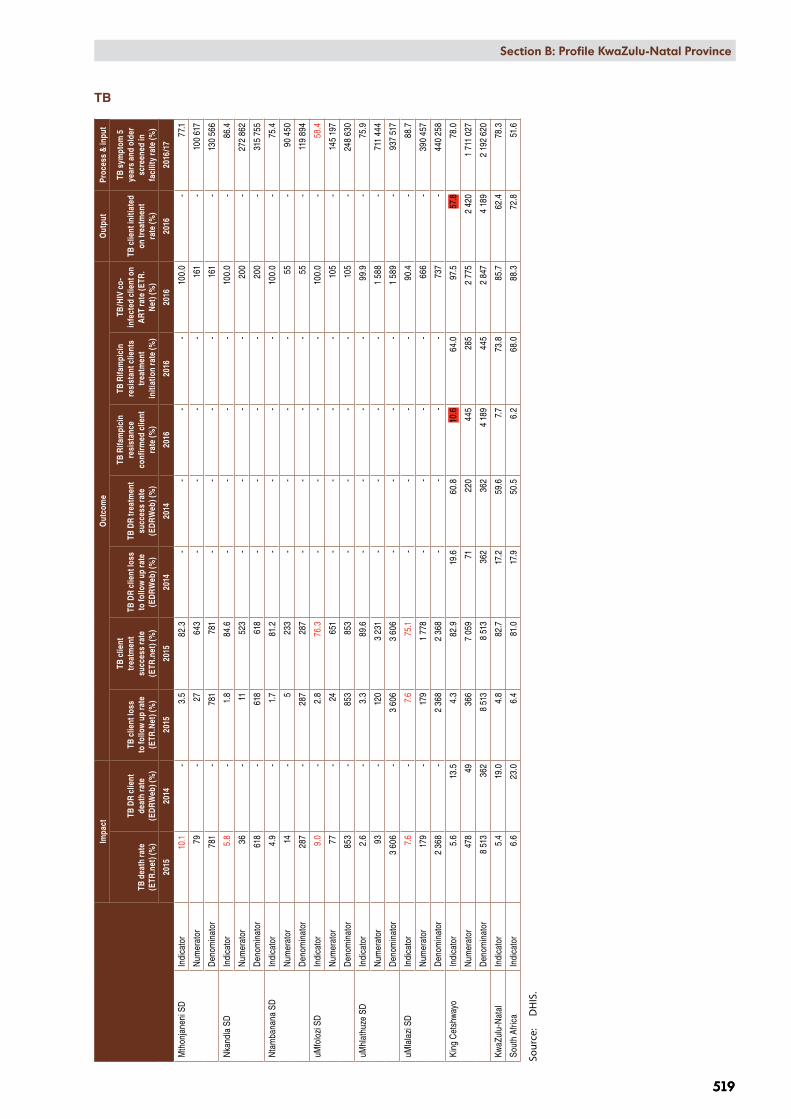
Section B: National and District Profiles
519
Section B: Profile KwaZulu-Natal Province
519
TBIm
pact
Out
com
eO
utpu
tPr
oces
s &
inpu
t
TB d
eath
rate
(E
TR.n
et) (
%)
TB D
R cl
ient
de
ath
rate
(E
DR
Web
) (%
)
TB c
lient
loss
to
follo
w u
p ra
te
(ETR
.Net
) (%
)
TB c
lient
tr
eatm
ent
succ
ess
rate
(E
TR.n
et) (
%)
TB D
R cl
ient
loss
to
follo
w u
p ra
te
(ED
RW
eb) (
%)
TB D
R tr
eatm
ent
succ
ess
rate
(E
DR
Web
) (%
)
TB R
ifam
pici
n re
sist
ance
co
nfirm
ed c
lient
ra
te (%
)
TB R
ifam
pici
n re
sist
ant c
lient
s tr
eatm
ent
initi
atio
n ra
te (%
)
TB/H
IV c
o-in
fect
ed c
lient
on
AR
T ra
te (E
TR.
Net
) (%
)
TB c
lient
initi
ated
on
trea
tmen
t ra
te (%
)
TB s
ympt
om 5
ye
ars
and
olde
r sc
reen
ed in
fa
cilit
y ra
te (%
)
2015
2014
2015
2015
2014
2014
2016
2016
2016
2016
2016
/17
Mth
onja
neni
SD
Indi
cato
r10
.1 -
3.5
82.3
- -
- -
100.
0 -
77.1
Num
erat
or79
-27
643
- -
- -
161
-10
0 61
7
Den
omin
ator
781
-78
178
1 -
- -
-16
1 -
130
566
Nka
ndla
SD
Indi
cato
r5.
8 -
1.8
84.6
- -
- -
100.
0 -
86.4
Num
erat
or36
-11
523
- -
- -
200
-27
2 86
2
Den
omin
ator
618
-61
861
8 -
- -
-20
0 -
315
755
Nta
mba
nana
SD
Indi
cato
r4.
9 -
1.7
81.2
- -
- -
100.
0 -
75.4
Num
erat
or14
-5
233
- -
- -
55 -
90 4
50
Den
omin
ator
287
-28
728
7 -
- -
-55
-11
9 89
4
uMfo
lozi
SD
Indi
cato
r9.
0 -
2.8
76.3
- -
- -
100.
0 -
58.4
Num
erat
or77
-24
651
- -
- -
105
-14
5 19
7
Den
omin
ator
853
-85
385
3 -
- -
-10
5 -
248
630
uMhl
athu
ze S
DIn
dica
tor
2.6
-3.
389
.6 -
- -
-99
.9 -
75.9
Num
erat
or93
-12
03
231
- -
- -
1 58
8 -
711
444
Den
omin
ator
3 60
6 -
3 60
63
606
- -
- -
1 58
9 -
937
517
uMla
lazi
SD
Indi
cato
r7.
6 -
7.6
75.1
- -
- -
90.4
-88
.7
Num
erat
or17
9 -
179
1 77
8 -
- -
-66
6 -
390
457
Den
omin
ator
2 36
8 -
2 36
82
368
- -
- -
737
-44
0 25
8
King
Cet
shw
ayo
Indi
cato
r5.
613
.54.
382
.919
.660
.810
.664
.097
.557
.878
.0
Num
erat
or47
849
366
7 05
971
220
445
285
2 77
52
420
1 71
1 02
7
Den
omin
ator
8 51
336
28
513
8 51
336
236
24
189
445
2 84
74
189
2 19
2 62
0
KwaZ
ulu-
Nat
alIn
dica
tor
5.4
19.0
4.8
82.7
17.2
59.6
7.7
73.8
85.7
62.4
78.3
Sout
h Af
rica
Indi
cato
r6.
623
.06.
481
.017
.950
.56.
268
.088
.372
.851
.6
Sour
ce:
DH
IS.
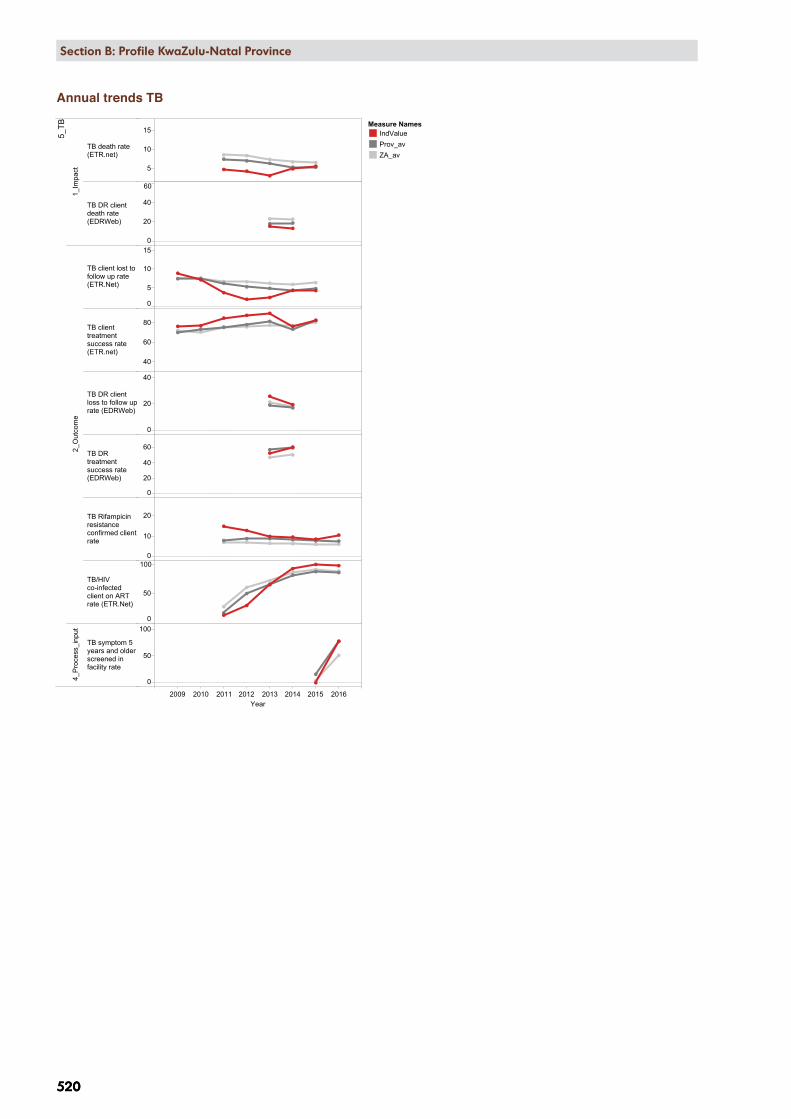
2009 2010 2011 2012 2013 2014 2015 2016Year
5_TB
1_Im
pact
TB death rate(ETR.net)
TB DR clientdeath rate(EDRWeb)
2_O
utco
me
TB client lost tofollow up rate(ETR.Net)
TB clienttreatmentsuccess rate(ETR.net)
TB DR clientloss to follow uprate (EDRWeb)
TB DRtreatmentsuccess rate(EDRWeb)
TB Rifampicinresistanceconfirmed clientrate
TB/HIVco-infectedclient on ARTrate (ETR.Net)
4_P
roce
ss_i
nput
TB symptom 5years and olderscreened infacility rate
5
10
15
0
20
40
60
0
5
10
15
40
60
80
0
20
40
0
20
40
60
0
10
20
0
50
100
0
50
100
KZN, DC28, King Cetshwayo District Municipality, SEQ 2 (deprived)
Measure NamesIndValueProv_avZA_av
520
Section B: National and District Profiles
520
Section B: Profile KwaZulu-Natal Province
Annual trends TB
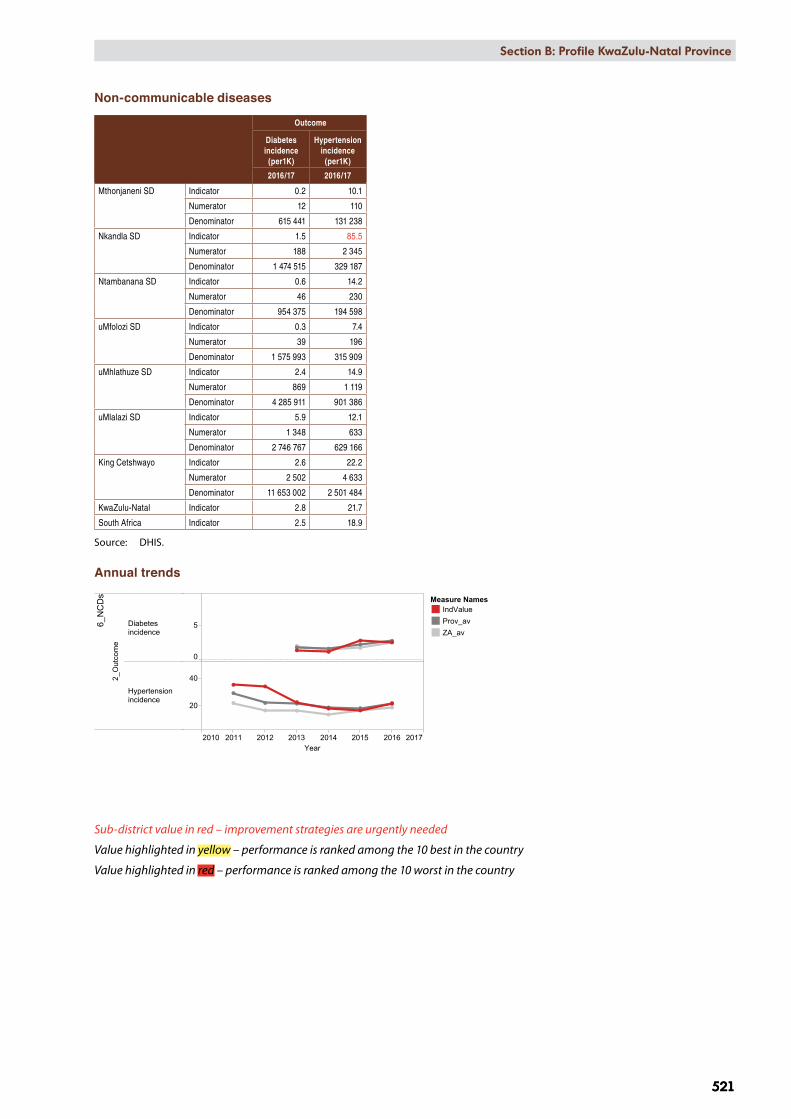
2010 2011 2012 2013 2014 2015 2016 2017Year
6_NCDs
2_Outcome
Diabetesincidence
Hypertensionincidence
0
5
20
40
KZN, DC28, King Cetshwayo District Municipality, SEQ 2 (deprived)
Measure NamesIndValueProv_avZA_av
Section B: National and District Profiles
521
Section B: Profile KwaZulu-Natal Province
521
Non-communicable diseases
Outcome
Diabetes incidence
(per1K)
Hypertension incidence
(per1K)
2016/17 2016/17
Mthonjaneni SD Indicator 0.2 10.1
Numerator 12 110
Denominator 615 441 131 238
Nkandla SD Indicator 1.5 85.5
Numerator 188 2 345
Denominator 1 474 515 329 187
Ntambanana SD Indicator 0.6 14.2
Numerator 46 230
Denominator 954 375 194 598
uMfolozi SD Indicator 0.3 7.4
Numerator 39 196
Denominator 1 575 993 315 909
uMhlathuze SD Indicator 2.4 14.9
Numerator 869 1 119
Denominator 4 285 911 901 386
uMlalazi SD Indicator 5.9 12.1
Numerator 1 348 633
Denominator 2 746 767 629 166
King Cetshwayo Indicator 2.6 22.2
Numerator 2 502 4 633
Denominator 11 653 002 2 501 484
KwaZulu-Natal Indicator 2.8 21.7
South Africa Indicator 2.5 18.9
Source: DHIS.
Annual trends
Sub-district value in red – improvement strategies are urgently needed
Value highlighted in yellow – performance is ranked among the 10 best in the country
Value highlighted in red – performance is ranked among the 10 worst in the country
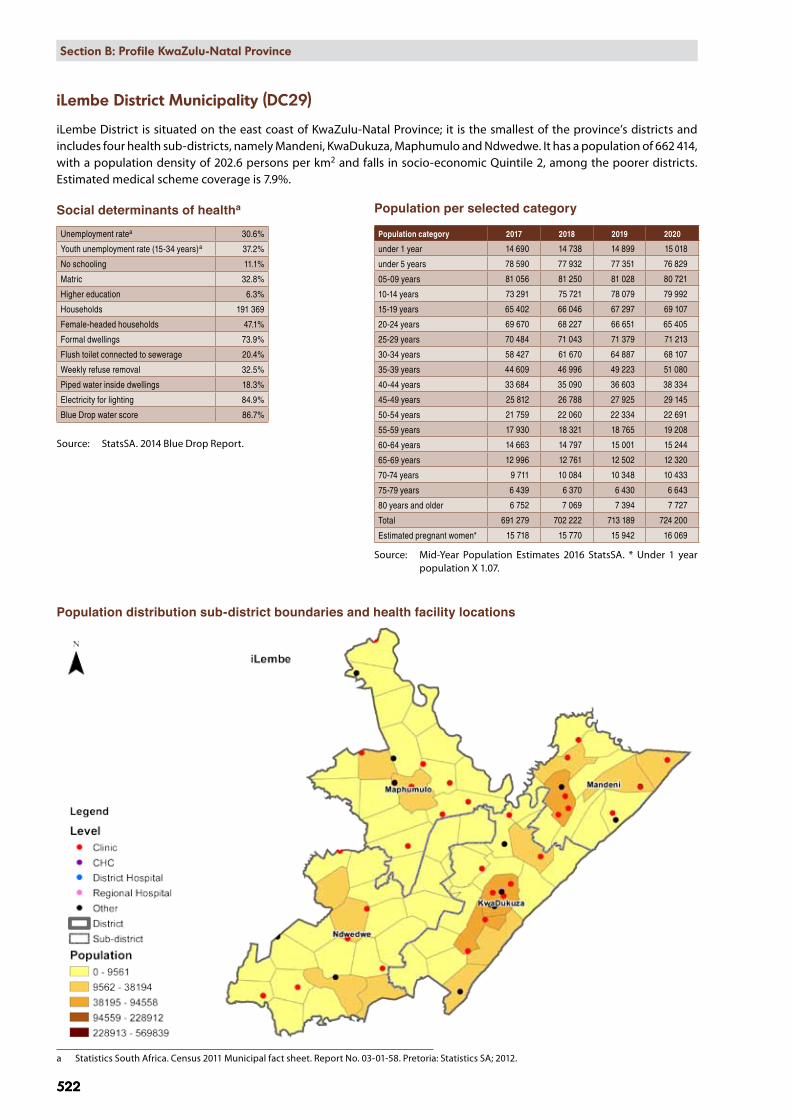
522
Section B: National and District Profiles
522
Section B: Profile KwaZulu-Natal Province
iLembe District Municipality (DC29)
iLembe District is situated on the east coast of KwaZulu-Natal Province; it is the smallest of the province’s districts and includes four health sub-districts, namely Mandeni, KwaDukuza, Maphumulo and Ndwedwe. It has a population of 662 414, with a population density of 202.6 persons per km2 and falls in socio-economic Quintile 2, among the poorer districts. Estimated medical scheme coverage is 7.9%.
Social determinants of healtha
Unemployment ratea 30.6%
Youth unemployment rate (15-34 years)a 37.2%
No schooling 11.1%
Matric 32.8%
Higher education 6.3%
Households 191 369
Female-headed households 47.1%
Formal dwellings 73.9%
Flush toilet connected to sewerage 20.4%
Weekly refuse removal 32.5%
Piped water inside dwellings 18.3%
Electricity for lighting 84.9%
Blue Drop water score 86.7%
Source: StatsSA. 2014 Blue Drop Report.
Population distribution sub-district boundaries and health facility locations
a Statistics South Africa. Census 2011 Municipal fact sheet. Report No. 03-01-58. Pretoria: Statistics SA; 2012.
Population per selected category
Population category 2017 2018 2019 2020
under 1 year 14 690 14 738 14 899 15 018
under 5 years 78 590 77 932 77 351 76 829
05-09 years 81 056 81 250 81 028 80 721
10-14 years 73 291 75 721 78 079 79 992
15-19 years 65 402 66 046 67 297 69 107
20-24 years 69 670 68 227 66 651 65 405
25-29 years 70 484 71 043 71 379 71 213
30-34 years 58 427 61 670 64 887 68 107
35-39 years 44 609 46 996 49 223 51 080
40-44 years 33 684 35 090 36 603 38 334
45-49 years 25 812 26 788 27 925 29 145
50-54 years 21 759 22 060 22 334 22 691
55-59 years 17 930 18 321 18 765 19 208
60-64 years 14 663 14 797 15 001 15 244
65-69 years 12 996 12 761 12 502 12 320
70-74 years 9 711 10 084 10 348 10 433
75-79 years 6 439 6 370 6 430 6 643
80 years and older 6 752 7 069 7 394 7 727
Total 691 279 702 222 713 189 724 200
Estimated pregnant women* 15 718 15 770 15 942 16 069
Source: Mid-Year Population Estimates 2016 StatsSA. * Under 1 year population X 1.07.
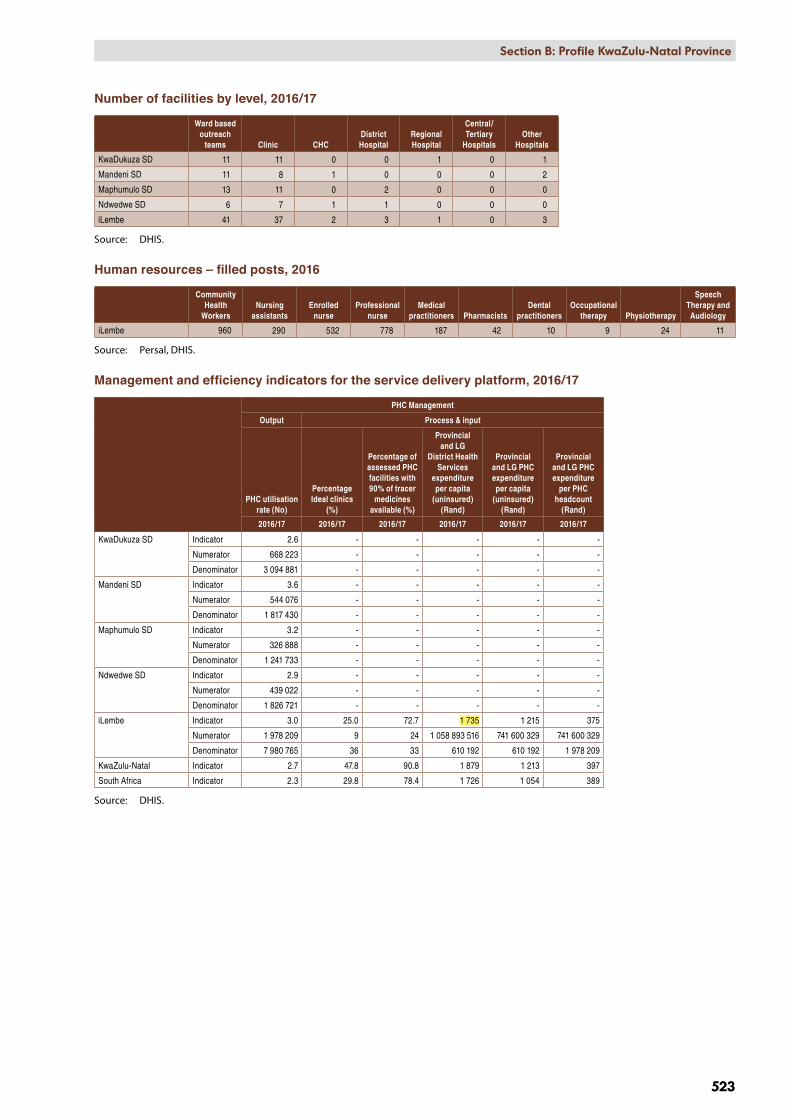
Section B: National and District Profiles
523
Section B: Profile KwaZulu-Natal Province
523
Number of facilities by level, 2016/17
Ward based outreach
teams Clinic CHCDistrict Hospital
Regional Hospital
Central/Tertiary
HospitalsOther
Hospitals
KwaDukuza SD 11 11 0 0 1 0 1
Mandeni SD 11 8 1 0 0 0 2
Maphumulo SD 13 11 0 2 0 0 0
Ndwedwe SD 6 7 1 1 0 0 0
iLembe 41 37 2 3 1 0 3
Source: DHIS.
Human resources – filled posts, 2016
Community Health
WorkersNursing
assistantsEnrolled
nurseProfessional
nurseMedical
practitioners PharmacistsDental
practitionersOccupational
therapy Physiotherapy
Speech Therapy and Audiology
iLembe 960 290 532 778 187 42 10 9 24 11
Source: Persal, DHIS.
Management and efficiency indicators for the service delivery platform, 2016/17
PHC Management
Output Process & input
PHC utilisation rate (No)
Percentage Ideal clinics
(%)
Percentage of assessed PHC facilities with 90% of tracer
medicines available (%)
Provincial and LG
District Health Services
expenditure per capita
(uninsured) (Rand)
Provincial and LG PHC expenditure per capita
(uninsured) (Rand)
Provincial and LG PHC expenditure
per PHC headcount
(Rand)
2016/17 2016/17 2016/17 2016/17 2016/17 2016/17
KwaDukuza SD Indicator 2.6 - - - - -
Numerator 668 223 - - - - -
Denominator 3 094 881 - - - - -
Mandeni SD Indicator 3.6 - - - - -
Numerator 544 076 - - - - -
Denominator 1 817 430 - - - - -
Maphumulo SD Indicator 3.2 - - - - -
Numerator 326 888 - - - - -
Denominator 1 241 733 - - - - -
Ndwedwe SD Indicator 2.9 - - - - -
Numerator 439 022 - - - - -
Denominator 1 826 721 - - - - -
iLembe Indicator 3.0 25.0 72.7 1 735 1 215 375
Numerator 1 978 209 9 24 1 058 893 516 741 600 329 741 600 329
Denominator 7 980 765 36 33 610 192 610 192 1 978 209
KwaZulu-Natal Indicator 2.7 47.8 90.8 1 879 1 213 397
South Africa Indicator 2.3 29.8 78.4 1 726 1 054 389
Source: DHIS.

2008 2010 2012 2014 2016 2018Year
1_M
anag
emen
t
1_Im
pact
Inpatient crudedeath rate
2_O
utco
me
Average lengthof stay (districthospitals)
Expenditure perpatient dayequivalent(districthospitals)
3_O
utpu
t
Inpatient bedutilisation rate(districthospitals)
OPD new clientnot referred rate(districthospitals)
4_P
roce
ss_i
nput
PercentageIdeal clinics
Provincial andLG DistrictHealth Servicesexpenditure percapita(uninsured)
Provincial andLG PHCexpenditure percapita(uninsured)
Provincial andLG PHCexpenditure perPHC headcount
2
4
6
8
2
4
6
8
1K
2K
3K
4K
50
100
0
50
100
0
50
100
1K
2K
3K
500
1000
1500
200
400
KZN, DC29, iLembe District Municipality, SEQ 2 (deprived)
Measure NamesIndValueProv_avZA_av
Meas ure NamesIndV alue
P rov_av
ZA_av
524
Section B: National and District Profiles
524
Section B: Profile KwaZulu-Natal ProvinceH
ospi
tal
Dis
tric
t Hos
pita
lR
egio
nal H
ospi
tal
Tert
iary
/Cen
tral
Hos
pita
l
Aver
age
leng
th o
f st
ay -
tota
l (D
ays)
Expe
nditu
re
per p
atie
nt
day
equi
vale
nt
(Ran
d)
Inpa
tient
bed
ut
ilisa
tion
rate
- to
tal
(%)
Inpa
tient
cr
ude
deat
h ra
te (%
)
OPD
new
cl
ient
not
re
ferr
ed ra
te
(%)
Aver
age
leng
th o
f st
ay -
tota
l (D
ays)
Expe
nditu
re
per p
atie
nt
day
equi
vale
nt
(Ran
d)
Inpa
tient
bed
ut
ilisa
tion
rate
- to
tal
(%)
Inpa
tient
cr
ude
deat
h ra
te (%
)
OPD
new
cl
ient
not
re
ferr
ed ra
te
(%)
Aver
age
leng
th o
f st
ay -
tota
l (D
ays)
Expe
nditu
re
per p
atie
nt
day
equi
vale
nt
(Ran
d)
Inpa
tient
bed
ut
ilisa
tion
rate
- to
tal
(%)
Inpa
tient
cr
ude
deat
h ra
te (%
)
OPD
new
cl
ient
not
re
ferr
ed ra
te
(%)
KwaD
ukuz
a SD
Indi
cato
r -
- -
- -
5.8
2 74
876
.35.
156
.8 -
- -
- -
Num
erat
or -
- -
- -
139
186
568
615
752
139
186
1 24
022
847
- -
- -
-
Den
omin
ator
- -
- -
-24
141
206
908
182
520
24 1
4140
195
- -
- -
-
Map
hum
ulo
SDIn
dica
tor
6.3
3 18
750
.16.
169
.9 -
- -
- -
- -
- -
-
Num
erat
or49
566
222
812
698
49 5
6647
812
116
- -
- -
- -
- -
- -
Den
omin
ator
7 86
269
915
98 9
267
862
17 3
40 -
- -
- -
- -
- -
-
Ndw
edw
e SD
Indi
cato
r5.
74
891
47.0
7.159
.5 -
- -
- -
- -
- -
-
Num
erat
or19
048
115
719
867
19 0
4823
85
827
- -
- -
- -
- -
- -
Den
omin
ator
3 35
623
658
40 5
193
356
9 78
8 -
- -
- -
- -
- -
-
iLem
be
Indi
cato
r6.
13
618
49.2
6.4
66.1
5.8
2 74
876
.35.
156
.8 -
- -
- -
Num
erat
or68
614
338
532
566
68 6
1471
617
943
139
186
568
615
752
139
186
1 24
022
847
- -
- -
-
Den
omin
ator
11 2
1893
572
139
445
11 2
1827
128
24 1
4120
6 90
818
2 52
024
141
40 1
95 -
- -
- -
KwaZ
ulu-
Nat
alIn
dica
tor
5.4
2 56
656
.25.
449
.46.
12
935
67.9
5.5
34.6
8.0
5 98
271
.75.
526
.8
Sout
h Af
rica
Indi
cato
r4.
42
568
67.4
5.1
59.3
5.3
2 89
478
.35.
037
.26.
94
227
84.3
5.4
20.3
Sour
ce:
DH
IS a
nd B
AS.
Annual trends
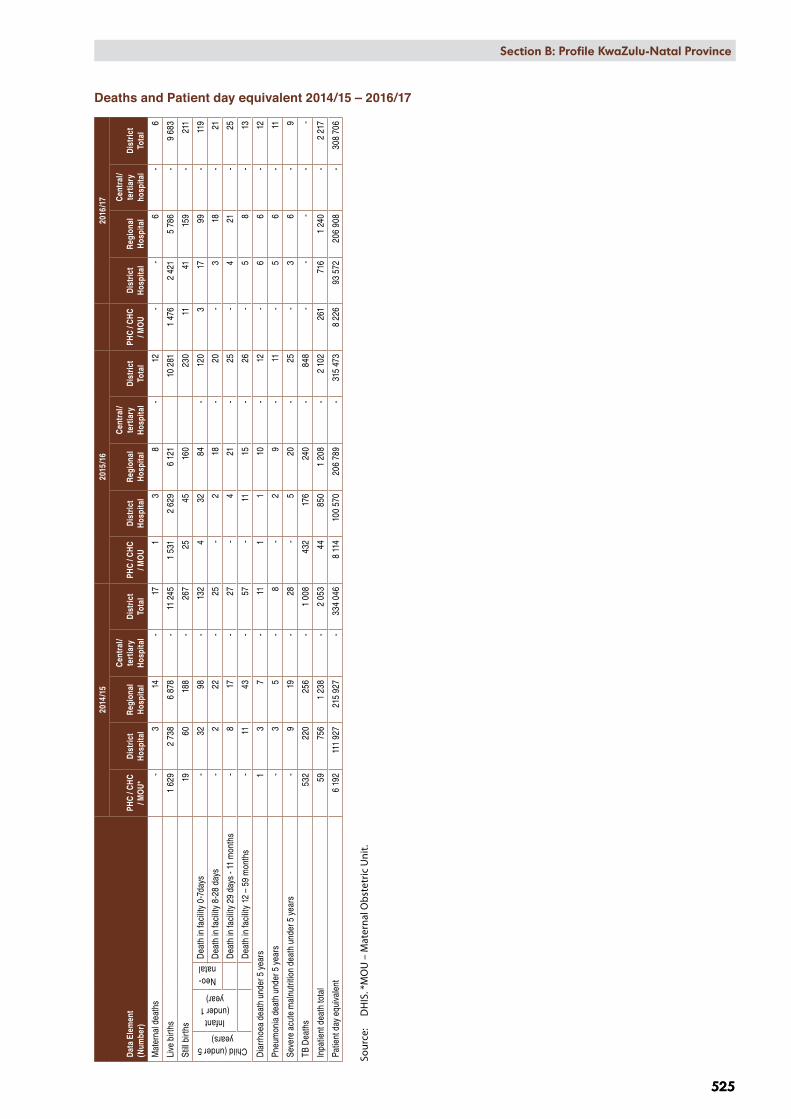
Section B: National and District Profiles
525
Section B: Profile KwaZulu-Natal Province
525
Deaths and Patient day equivalent 2014/15 – 2016/17
Dat
a El
emen
t(N
umbe
r)
2014
/15
2015
/16
2016
/17
PHC
/ CH
C / M
OU
*D
istr
ict
Hos
pita
lR
egio
nal
Hos
pita
l
Cen
tral
/te
rtia
ry
Hos
pita
lD
istr
ict
Tota
lPH
C / C
HC
/ MO
UD
istr
ict
Hos
pita
lR
egio
nal
Hos
pita
l
Cen
tral
/te
rtia
ry
Hos
pita
lD
istr
ict
Tota
lPH
C / C
HC
/ MO
UD
istr
ict
Hos
pita
lR
egio
nal
Hos
pita
l
Cen
tral
/te
rtia
ry
hosp
ital
Dis
tric
t To
tal
Mat
erna
l dea
ths
-3
14-
171
38
-12
--
6-
6
Live
birt
hs1
629
2 73
86
878
-11
245
1 53
12
629
6 12
110
281
1 47
62
421
5 78
6-
9 68
3
Still
birth
s19
6018
8-
267
2545
160
230
1141
159
-21
1
Child (under 5 years)
Infant (under 1
year)
Neo-natal
Dea
th in
faci
lity
0-7d
ays
-32
98-
132
432
84-
120
317
99-
119
Dea
th in
faci
lity
8-28
day
s -
222
-25
-2
18-
20-
318
-21
Dea
th in
faci
lity
29 d
ays
- 11
mon
ths
-8
17-
27-
421
-25
-4
21-
25
Dea
th in
faci
lity
12 –
59
mon
ths
-11
43-
57-
1115
-26
-5
8-
13
Dia
rrho
ea d
eath
und
er 5
yea
rs
13
7-
111
110
-12
-6
6-
12
Pneu
mon
ia d
eath
und
er 5
yea
rs-
35
-8
-2
9-
11-
56
-11
Seve
re a
cute
mal
nutri
tion
deat
h un
der 5
yea
rs
-9
19-
28-
520
-25
-3
6-
9
TB D
eath
s 53
222
025
6-
1 00
843
217
624
0-
848
--
--
-
Inpa
tient
dea
th to
tal
5975
6 1
238
-2
053
4485
01
208
-2
102
261
716
1 24
0-
2 21
7
Patie
nt d
ay e
quiv
alen
t6
192
111
927
215
927
-33
4 04
68
114
100
570
206
789
-31
5 47
38
226
93 5
7220
6 90
8-
308
706
Sour
ce:
DH
IS. *
MO
U –
Mat
erna
l Obs
tetr
ic U
nit.
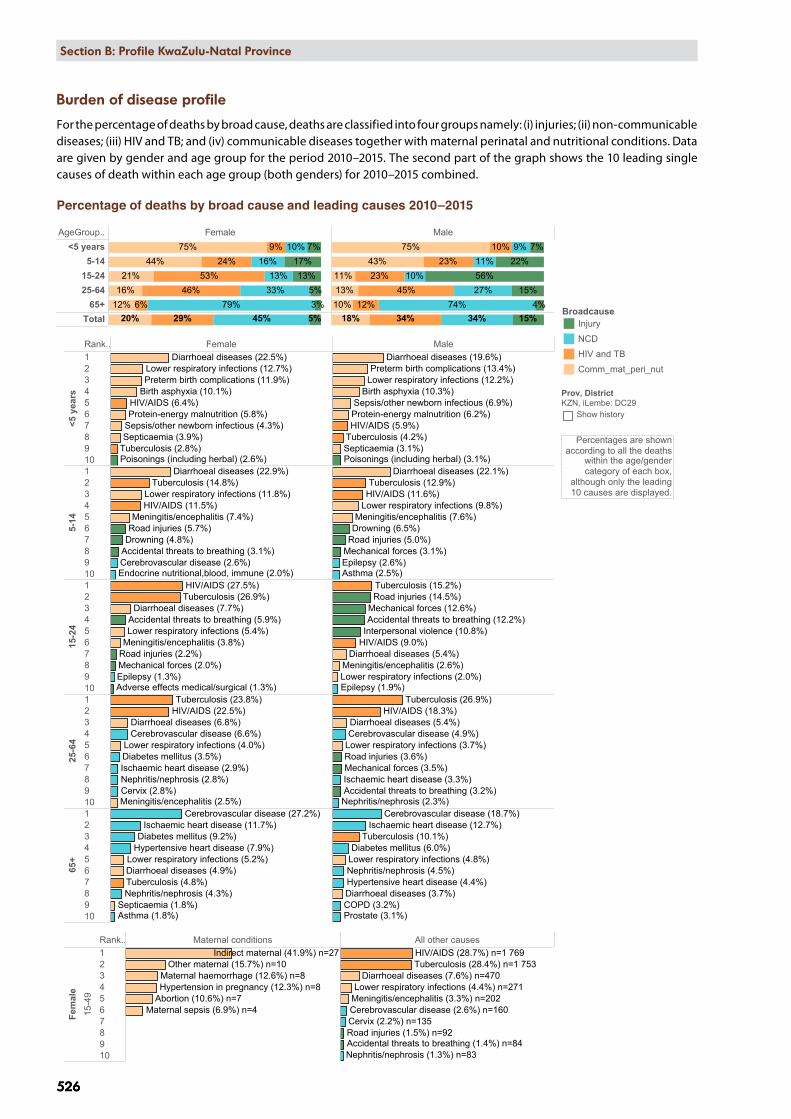
AgeGroup.. Female Male<5 years
5-1415-2425-64
65+Total 20%
12%16%
21%44%
75%
29%6%
46%53%
24%9%
45%79%
33%13%
16%10%
5%3%5%
13%17%
7%
18%10%13%11%
43%75%
34%12%
45%23%
23%10%
34%74%
27%10%
11%9%
15%4%
15%56%
22%7%
KZN, iLembe: DC29, 2010 - 2015
Rank.. Female Male
<5 y
ears
12345678910
5-14
12345678910
15-2
4
12345678910
25-6
4
12345678910
65+
12345678910
Sepsis/other newborn infectious (4.3%)
Poisonings (including herbal) (2.6%)
Birth asphyxia (10.1%)
Protein-energy malnutrition (5.8%)
Preterm birth complications (11.9%)
Septicaemia (3.9%)
Diarrhoeal diseases (22.5%)Lower respiratory infections (12.7%)
Tuberculosis (2.8%)
HIV/AIDS (6.4%)
Drowning (4.8%)
Endocrine nutritional,blood, immune (2.0%)
Meningitis/encephalitis (7.4%)
Accidental threats to breathing (3.1%)
Road injuries (5.7%)
Diarrhoeal diseases (22.9%)
Cerebrovascular disease (2.6%)
Lower respiratory infections (11.8%)Tuberculosis (14.8%)
HIV/AIDS (11.5%)
Adverse effects medical/surgical (1.3%)Epilepsy (1.3%)
Meningitis/encephalitis (3.8%)
Mechanical forces (2.0%)
Accidental threats to breathing (5.9%)
Road injuries (2.2%)
Diarrhoeal diseases (7.7%)
Lower respiratory infections (5.4%)
Tuberculosis (26.9%)HIV/AIDS (27.5%)
Cervix (2.8%)Meningitis/encephalitis (2.5%)
Nephritis/nephrosis (2.8%)
Diabetes mellitus (3.5%)
Diarrhoeal diseases (6.8%)
Ischaemic heart disease (2.9%)
Cerebrovascular disease (6.6%)Lower respiratory infections (4.0%)
Tuberculosis (23.8%)HIV/AIDS (22.5%)
Asthma (1.8%)Septicaemia (1.8%)
Nephritis/nephrosis (4.3%)
Hypertensive heart disease (7.9%)Diabetes mellitus (9.2%)
Diarrhoeal diseases (4.9%)
Ischaemic heart disease (11.7%)Cerebrovascular disease (27.2%)
Lower respiratory infections (5.2%)
Tuberculosis (4.8%)
Sepsis/other newborn infectious (6.9%)
Poisonings (including herbal) (3.1%)
Birth asphyxia (10.3%)
Protein-energy malnutrition (6.2%)
Preterm birth complications (13.4%)
Septicaemia (3.1%)
Diarrhoeal diseases (19.6%)
Lower respiratory infections (12.2%)
Tuberculosis (4.2%)HIV/AIDS (5.9%)
Drowning (6.5%)
Epilepsy (2.6%)Asthma (2.5%)
Meningitis/encephalitis (7.6%)
Mechanical forces (3.1%)Road injuries (5.0%)
Diarrhoeal diseases (22.1%)
Lower respiratory infections (9.8%)
Tuberculosis (12.9%)HIV/AIDS (11.6%)
Epilepsy (1.9%)
Meningitis/encephalitis (2.6%)
Mechanical forces (12.6%)Accidental threats to breathing (12.2%)
Interpersonal violence (10.8%)
Road injuries (14.5%)
Diarrhoeal diseases (5.4%)
Lower respiratory infections (2.0%)
Tuberculosis (15.2%)
HIV/AIDS (9.0%)
Mechanical forces (3.5%)
Accidental threats to breathing (3.2%)
Road injuries (3.6%)
Nephritis/nephrosis (2.3%)
Diarrhoeal diseases (5.4%)
Ischaemic heart disease (3.3%)
Cerebrovascular disease (4.9%)Lower respiratory infections (3.7%)
Tuberculosis (26.9%)HIV/AIDS (18.3%)
Prostate (3.1%)COPD (3.2%)
Nephritis/nephrosis (4.5%)Hypertensive heart disease (4.4%)
Diabetes mellitus (6.0%)
Diarrhoeal diseases (3.7%)
Ischaemic heart disease (12.7%)Cerebrovascular disease (18.7%)
Lower respiratory infections (4.8%)
Tuberculosis (10.1%)
Rank.. Maternal conditions All other causes
Fem
ale
15-4
9
12345678910
Maternal sepsis (6.9%) n=4Abortion (10.6%) n=7
Maternal haemorrhage (12.6%) n=8Hypertension in pregnancy (12.3%) n=8
Other maternal (15.7%) n=10Indirect maternal (41.9%) n=27
Accidental threats to breathing (1.4%) n=84Road injuries (1.5%) n=92Cervix (2.2%) n=135
Nephritis/nephrosis (1.3%) n=83
Cerebrovascular disease (2.6%) n=160Meningitis/encephalitis (3.3%) n=202
Diarrhoeal diseases (7.6%) n=470Lower respiratory infections (4.4%) n=271
Tuberculosis (28.4%) n=1 753HIV/AIDS (28.7%) n=1 769
Percentage ofdeaths by broad
causes andsingle leading
causes
BroadcauseInjury
NCD
HIV and TB
Comm_mat_peri_nut
Prov, DistrictKZN, iLembe: DC29
Show history
Percentages are shownaccording to all the deaths
within the age/gendercategory of each box,
although only the leading10 causes are displayed.
526
Section B: National and District Profiles
526
Section B: Profile KwaZulu-Natal Province
Burden of disease profile
For the percentage of deaths by broad cause, deaths are classified into four groups namely: (i) injuries; (ii) non-communicable diseases; (iii) HIV and TB; and (iv) communicable diseases together with maternal perinatal and nutritional conditions. Data are given by gender and age group for the period 2010–2015. The second part of the graph shows the 10 leading single causes of death within each age group (both genders) for 2010–2015 combined.
Percentage of deaths by broad cause and leading causes 2010–2015
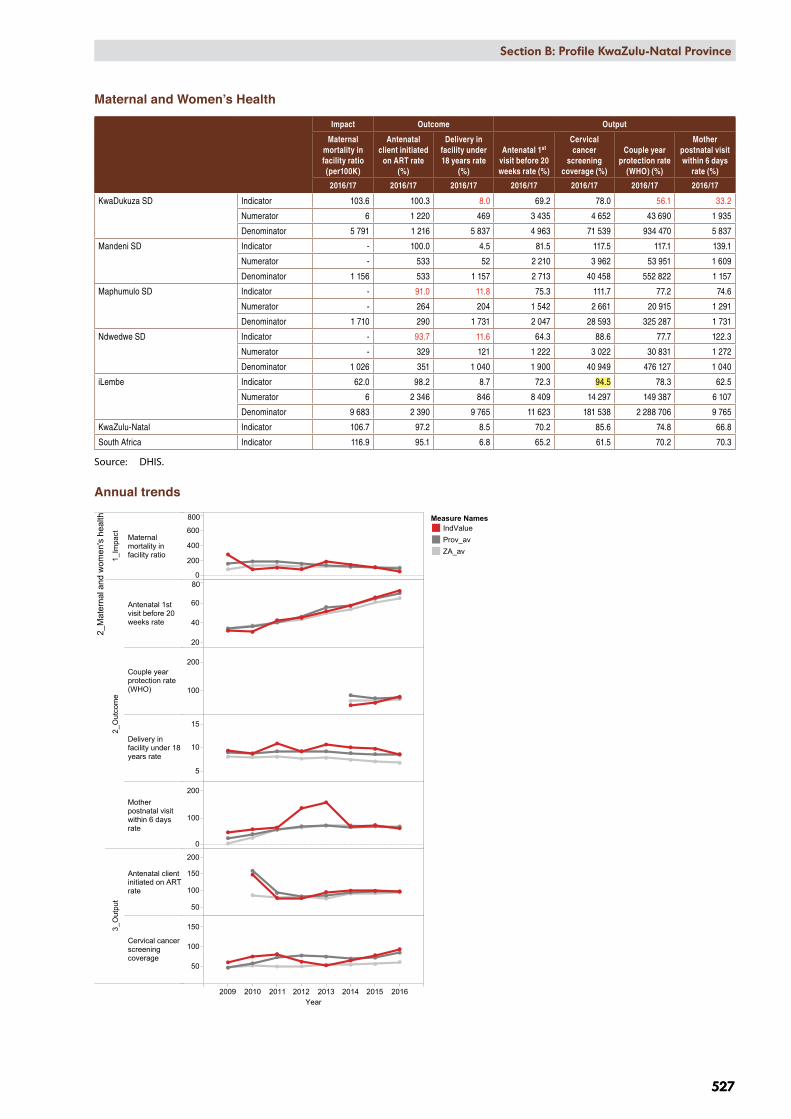
2009 2010 2011 2012 2013 2014 2015 2016Year
2_M
ater
nal a
nd w
omen
's h
ealth
1_Im
pact Maternal
mortality infacility ratio
2_O
utco
me
Antenatal 1stvisit before 20weeks rate
Couple yearprotection rate(WHO)
Delivery infacility under 18years rate
Motherpostnatal visitwithin 6 daysrate
3_O
utpu
t
Antenatal clientinitiated on ARTrate
Cervical cancerscreeningcoverage
0
200
400
600
800
20
40
60
80
100
200
5
10
15
0
100
200
50
100
150
200
50
100
150
KZN, DC29, iLembe District Municipality, SEQ 2 (deprived)
Measure NamesIndValueProv_avZA_av
Section B: National and District Profiles
527
Section B: Profile KwaZulu-Natal Province
527
Maternal and Women’s Health
Impact Outcome Output
Maternal mortality in facility ratio (per100K)
Antenatal client initiated
on ART rate (%)
Delivery in facility under 18 years rate
(%)
Antenatal 1st visit before 20 weeks rate (%)
Cervical cancer
screening coverage (%)
Couple year protection rate
(WHO) (%)
Mother postnatal visit within 6 days
rate (%)
2016/17 2016/17 2016/17 2016/17 2016/17 2016/17 2016/17
KwaDukuza SD Indicator 103.6 100.3 8.0 69.2 78.0 56.1 33.2
Numerator 6 1 220 469 3 435 4 652 43 690 1 935
Denominator 5 791 1 216 5 837 4 963 71 539 934 470 5 837
Mandeni SD Indicator - 100.0 4.5 81.5 117.5 117.1 139.1
Numerator - 533 52 2 210 3 962 53 951 1 609
Denominator 1 156 533 1 157 2 713 40 458 552 822 1 157
Maphumulo SD Indicator - 91.0 11.8 75.3 111.7 77.2 74.6
Numerator - 264 204 1 542 2 661 20 915 1 291
Denominator 1 710 290 1 731 2 047 28 593 325 287 1 731
Ndwedwe SD Indicator - 93.7 11.6 64.3 88.6 77.7 122.3
Numerator - 329 121 1 222 3 022 30 831 1 272
Denominator 1 026 351 1 040 1 900 40 949 476 127 1 040
iLembe Indicator 62.0 98.2 8.7 72.3 94.5 78.3 62.5
Numerator 6 2 346 846 8 409 14 297 149 387 6 107
Denominator 9 683 2 390 9 765 11 623 181 538 2 288 706 9 765
KwaZulu-Natal Indicator 106.7 97.2 8.5 70.2 85.6 74.8 66.8
South Africa Indicator 116.9 95.1 6.8 65.2 61.5 70.2 70.3
Source: DHIS.
Annual trends
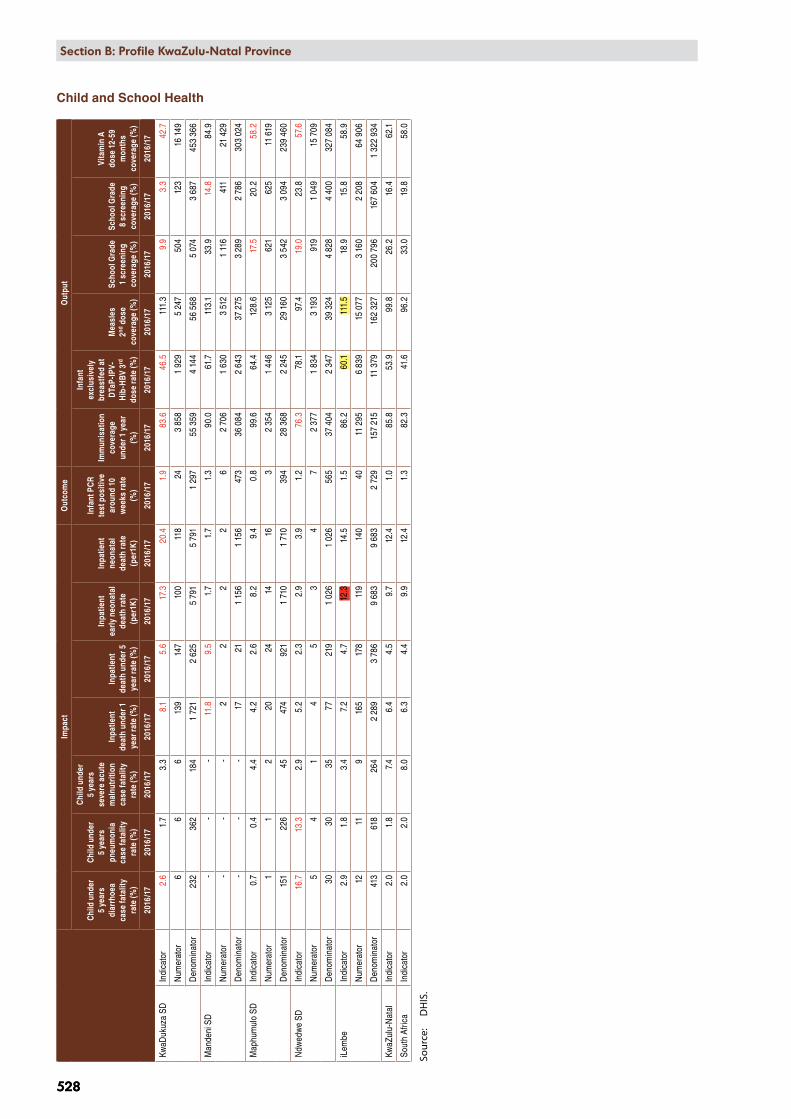
528
Section B: National and District Profiles
528
Section B: Profile KwaZulu-Natal Province
Child and School Health
Impa
ctO
utco
me
Out
put
Chi
ld u
nder
5
year
s di
arrh
oea
case
fata
lity
rate
(%)
Chi
ld u
nder
5
year
s pn
eum
onia
ca
se fa
talit
y ra
te (%
)
Chi
ld u
nder
5
year
s se
vere
acu
te
mal
nutr
ition
ca
se fa
talit
y ra
te (%
)
Inpa
tient
de
ath
unde
r 1
year
rate
(%)
Inpa
tient
de
ath
unde
r 5
year
rate
(%)
Inpa
tient
ea
rly n
eona
tal
deat
h ra
te
(per
1K)
Inpa
tient
ne
onat
al
deat
h ra
te
(per
1K)
Infa
nt P
CR
test
pos
itive
ar
ound
10
wee
ks ra
te
(%)
Imm
unis
atio
n co
vera
ge
unde
r 1 y
ear
(%)
Infa
nt
excl
usiv
ely
brea
stfe
d at
D
TaP-
IPV-
Hib
-HB
V 3rd
do
se ra
te (%
)
Mea
sles
2nd
dos
e co
vera
ge (%
)
Scho
ol G
rade
1
scre
enin
g co
vera
ge (%
)
Scho
ol G
rade
8
scre
enin
g co
vera
ge (%
)
Vita
min
A
dose
12-
59
mon
ths
cove
rage
(%)
2016
/17
2016
/17
2016
/17
2016
/17
2016
/17
2016
/17
2016
/17
2016
/17
2016
/17
2016
/17
2016
/17
2016
/17
2016
/17
2016
/17
KwaD
ukuz
a SD
Indi
cato
r2.
61.
73.
38.
15.
617
.320
.41.
983
.646
.511
1.3
9.9
3.3
42.7
Num
erat
or6
66
139
147
100
118
243
858
1 92
95
247
504
123
16 1
49
Den
omin
ator
232
362
184
1 72
12
625
5 79
15
791
1 29
755
359
4 14
456
568
5 07
43
687
453
366
Man
deni
SD
Indi
cato
r -
- -
11.8
9.5
1.7
1.7
1.3
90.0
61.7
113.
133
.914
.884
.9
Num
erat
or -
- -
22
22
62
706
1 63
03
512
1 11
641
121
429
Den
omin
ator
- -
-17
211
156
1 15
647
336
084
2 64
337
275
3 28
92
786
303
024
Map
hum
ulo
SDIn
dica
tor
0.7
0.4
4.4
4.2
2.6
8.2
9.4
0.8
99.6
64.4
128.
617
.520
.258
.2
Num
erat
or1
12
2024
1416
32
354
1 44
63
125
621
625
11 6
19
Den
omin
ator
151
226
4547
492
11
710
1 71
039
428
368
2 24
529
160
3 54
23
094
239
460
Ndw
edw
e SD
Indi
cato
r16
.713
.32.
95.
22.
32.
93.
91.
276
.378
.197
.419
.023
.857
.6
Num
erat
or5
41
45
34
72
377
1 83
43
193
919
1 04
915
709
Den
omin
ator
3030
3577
219
1 02
61
026
565
37 4
042
347
39 3
244
828
4 40
032
7 08
4
iLem
be
Indi
cato
r2.
91.
83.
47.
24.
712
.314
.51.
586
.260
.111
1.5
18.9
15.8
58.9
Num
erat
or12
119
165
178
119
140
4011
295
6 83
915
077
3 16
02
208
64 9
06
Den
omin
ator
413
618
264
2 28
93
786
9 68
39
683
2 72
915
7 21
511
379
162
327
200
796
167
604
1 32
2 93
4
KwaZ
ulu-
Nat
alIn
dica
tor
2.0
1.8
7.4
6.4
4.5
9.7
12.4
1.0
85.8
53.9
99.8
26.2
16.4
62.1
Sout
h Af
rica
Indi
cato
r2.
02.
08.
06.
34.
49.
912
.41.
382
.341
.696
.233
.019
.858
.0
Sour
ce:
DH
IS.

2009 2010 2011 2012 2013 2014 2015 2016Year
3_C
hild
and
sch
ool h
ealth
1_Im
pact
Child under 5years diarrhoeacase fatality rate
Child under 5yearspneumoniacase fatality rate
Child under 5years severeacutemalnutritioncase fatality rate
Inpatient earlyneonatal deathrate
3_O
utpu
t
Immunisationcoverage under1 year
Infantexclusivelybreastfed atDTaP-IPV-Hib-HBV 3rd doserate
Measles 2nddose coverage
School Grade 1screeningcoverage
0
50
100
0
10
20
30
0
20
40
60
0
10
20
50
100
150
20
40
60
80
50
100
150
0
50
100
KZN, DC29, iLembe District Municipality, SEQ 2 (deprived)
Measure NamesIndValueProv_avZA_av
2009 2010 2011 2012 2013 2014 2015 2016Year
4_H
IV
4_P
roce
ss_i
nput
HIV testingcoverage(including ANC)
Male condomdistributioncoverage
Medical malecircumcisionrate
20
40
60
100
200
0
20
40
6080
KZN, DC29, iLembe District Municipality, SEQ 2 (deprived)
Measure NamesIndValueProv_avZA_av
Section B: National and District Profiles
529
Section B: Profile KwaZulu-Natal Province
529
Annual trends Child and School Health
Annual trends HIV

530
Section B: National and District Profiles
530
Section B: Profile KwaZulu-Natal Province
HIV
3rd
90-
90-9
02nd
90-
90-9
01st
90-9
0-90
Out
com
eO
utpu
tPr
oces
s &
inpu
t
Adu
lt w
ith v
iral
load
com
plet
ion
rate
at 1
2 m
onth
s (%
)
Chi
ld w
ith v
iral
load
com
plet
ion
rate
at 1
2 m
onth
s (%
)
Adu
lt w
ith v
iral
load
sup
pres
sed
rate
12
mon
ths
(%)
Chi
ld w
ith v
iral
load
sup
pres
sed
rate
12
mon
ths
(%)
Adu
lt pe
rcen
tage
on
AR
T af
ter 1
2 m
onth
s (%
)
Chi
ld p
erce
ntag
e on
AR
T af
ter 1
2 m
onth
s (%
)C
lient
s re
mai
ning
on
AR
T ra
te (%
)
HIV
test
pos
itive
cl
ient
15
year
s an
d ol
der r
ate
(incl
udin
g A
NC
) (%
)
HIV
test
ing
cove
rage
(in
clud
ing
AN
C)
(%)
Mal
e co
ndom
di
strib
utio
n co
vera
ge (N
o)
Med
ical
mal
e ci
rcum
cisi
on ra
te
(per
1K)
2015
2015
2015
2015
2015
2015
2016
/17
2016
/17
2016
/17
2016
/17
2016
/17
KwaD
ukuz
a SD
Indi
cato
r56
.356
.189
.546
.773
.677
.0 -
-23
.530
.620
.6
Num
erat
or -
60 -
28 -
184
- -
37 3
992
907
634
2 15
5
Den
omin
ator
3 32
010
71
870
605
721
239
- -
1 91
1 11
41
141
779
1 25
5 62
3
Man
deni
SD
Indi
cato
r51
.954
.091
.955
.679
.079
.8 -
-51
.310
2.4
27.4
Num
erat
or -
27 -
15 -
71 -
-45
285
5 01
8 95
81
528
Den
omin
ator
1 95
850
1 01
727
3 28
289
- -
1 05
8 58
958
8 09
366
9 91
5
Map
hum
ulo
SDIn
dica
tor
46.5
31.9
88.6
60.0
77.6
73.9
- -
51.6
67.6
32.4
Num
erat
or -
15 -
9 -
85 -
-24
624
1 76
4 72
01
055
Den
omin
ator
737
4734
315
1 84
811
5 -
-57
2 99
131
3 36
539
0 47
4
Ndw
edw
e SD
Indi
cato
r64
.760
.386
.365
.776
.583
.3 -
-36
.765
.227
.6
Num
erat
or -
35 -
23 -
70 -
-28
022
2 96
3 54
81
481
Den
omin
ator
981
5863
535
1 80
884
- -
915
096
545
169
644
349
iLem
be
Indi
cato
r55
.252
.389
.554
.776
.077
.863
.210
.836
.458
.725
.2
Num
erat
or -
137
- 75
-41
066
904
15 4
8713
5 33
012
654
860
6 21
9
Den
omin
ator
6 99
626
23
865
137
12 6
5952
710
5 90
614
3 89
944
57
790
2 58
8 40
62
960
361
KwaZ
ulu-
Nat
alIn
dica
tor
58.0
56.8
91.8
68.5
75.9
78.5
61.3
11.4
42.5
53.9
30.5
Sout
h Af
rica
Indi
cato
r -
- -
- -
- 55
.08.
235
.947
.519
.0
Sour
ce:
DH
IS.
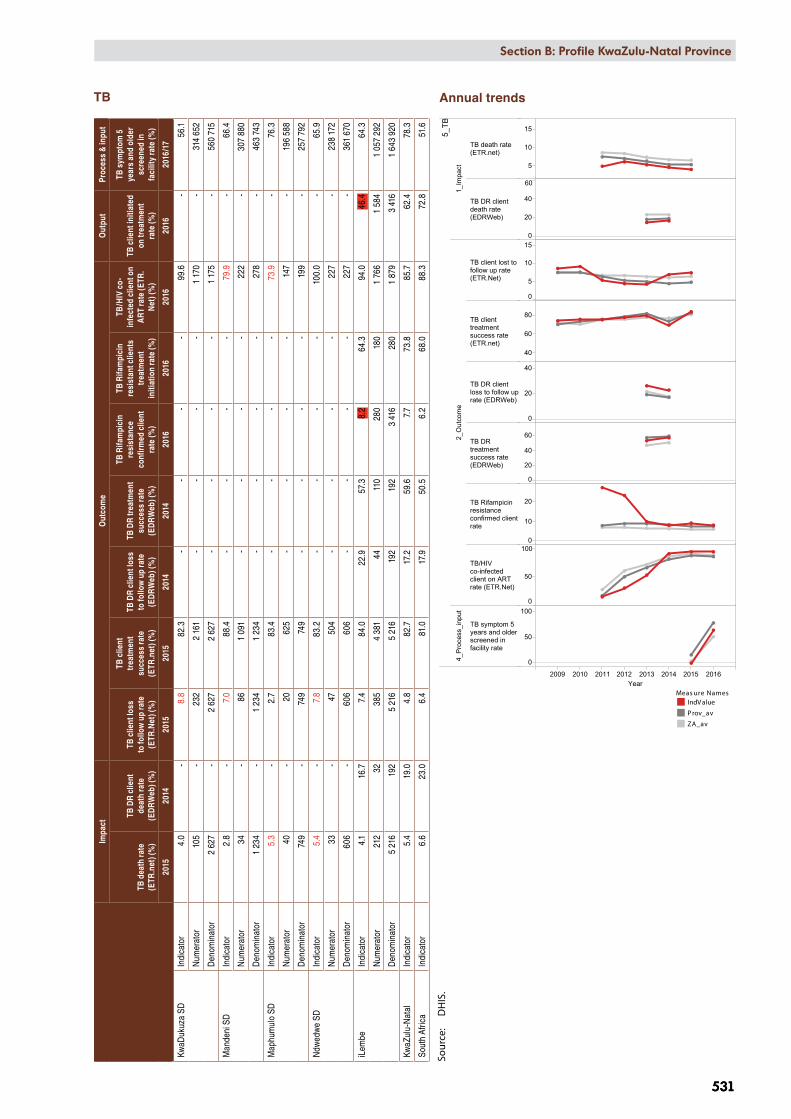
2009 2010 2011 2012 2013 2014 2015 2016Year
5_TB
1_Im
pact
TB death rate(ETR.net)
TB DR clientdeath rate(EDRWeb)
2_O
utco
me
TB client lost tofollow up rate(ETR.Net)
TB clienttreatmentsuccess rate(ETR.net)
TB DR clientloss to follow uprate (EDRWeb)
TB DRtreatmentsuccess rate(EDRWeb)
TB Rifampicinresistanceconfirmed clientrate
TB/HIVco-infectedclient on ARTrate (ETR.Net)
4_P
roce
ss_i
nput
TB symptom 5years and olderscreened infacility rate
5
10
15
0
20
40
60
0
5
10
15
40
60
80
0
20
40
0
20
40
60
0
10
20
0
50
100
0
50
100
KZN, DC29, iLembe District Municipality, SEQ 2 (deprived)
Measure NamesIndValueProv_avZA_av
Meas ure NamesIndV alue
P rov_av
ZA_av
Section B: National and District Profiles
531
Section B: Profile KwaZulu-Natal Province
531
TBIm
pact
Out
com
eO
utpu
tPr
oces
s &
inpu
t
TB d
eath
rate
(E
TR.n
et) (
%)
TB D
R cl
ient
de
ath
rate
(E
DR
Web
) (%
)
TB c
lient
loss
to
follo
w u
p ra
te
(ETR
.Net
) (%
)
TB c
lient
tr
eatm
ent
succ
ess
rate
(E
TR.n
et) (
%)
TB D
R cl
ient
loss
to
follo
w u
p ra
te
(ED
RW
eb) (
%)
TB D
R tr
eatm
ent
succ
ess
rate
(E
DR
Web
) (%
)
TB R
ifam
pici
n re
sist
ance
co
nfirm
ed c
lient
ra
te (%
)
TB R
ifam
pici
n re
sist
ant c
lient
s tr
eatm
ent
initi
atio
n ra
te (%
)
TB/H
IV c
o-in
fect
ed c
lient
on
AR
T ra
te (E
TR.
Net
) (%
)
TB c
lient
initi
ated
on
trea
tmen
t ra
te (%
)
TB s
ympt
om 5
ye
ars
and
olde
r sc
reen
ed in
fa
cilit
y ra
te (%
)
2015
2014
2015
2015
2014
2014
2016
2016
2016
2016
2016
/17
KwaD
ukuz
a SD
Indi
cato
r4.
0 -
8.8
82.3
- -
- -
99.6
-56
.1
Num
erat
or10
5 -
232
2 16
1 -
- -
-1
170
-31
4 65
2
Den
omin
ator
2 62
7 -
2 62
72
627
- -
- -
1 17
5 -
560
715
Man
deni
SD
Indi
cato
r2.
8 -
7.0
88.4
- -
- -
79.9
-66
.4
Num
erat
or34
-86
1 09
1 -
- -
-22
2 -
307
880
Den
omin
ator
1 23
4 -
1 23
41
234
- -
- -
278
-46
3 74
3
Map
hum
ulo
SDIn
dica
tor
5.3
-2.
783
.4 -
- -
-73
.9 -
76.3
Num
erat
or40
-20
625
- -
- -
147
-19
6 58
8
Den
omin
ator
749
-74
974
9 -
- -
-19
9 -
257
792
Ndw
edw
e SD
Indi
cato
r5.
4 -
7.8
83.2
- -
- -
100.
0 -
65.9
Num
erat
or33
-47
504
- -
- -
227
-23
8 17
2
Den
omin
ator
606
-60
660
6 -
- -
-22
7 -
361
670
iLem
be
Indi
cato
r4.
116
.77.
484
.022
.957
.38.
264
.394
.046
.464
.3
Num
erat
or21
232
385
4 38
144
110
280
180
1 76
61
584
1 05
7 29
2
Den
omin
ator
5 21
619
25
216
5 21
619
219
23
416
280
1 87
93
416
1 64
3 92
0
KwaZ
ulu-
Nat
alIn
dica
tor
5.4
19.0
4.8
82.7
17.2
59.6
7.7
73.8
85.7
62.4
78.3
Sout
h Af
rica
Indi
cato
r6.
623
.06.
481
.017
.950
.56.
268
.088
.372
.851
.6
Sour
ce:
DH
IS.
Annual trends

2010 2011 2012 2013 2014 2015 2016 2017Year
6_NCDs
2_Outcome
Diabetesincidence
Hypertensionincidence
0
5
20
40
KZN, DC29, iLembe District Municipality, SEQ 2 (deprived)
Measure NamesIndValueProv_avZA_av
532
Section B: National and District Profiles
532
Section B: Profile KwaZulu-Natal Province
Non-communicable diseases
Outcome
Diabetes incidence
(per1K)
Hypertension incidence
(per1K)
2016/17 2016/17
KwaDukuza SD Indicator 3.6 6.5
Numerator 922 406
Denominator 3 094 881 753 699
Mandeni SD Indicator 1.0 10.9
Numerator 147 369
Denominator 1 817 430 405 672
Maphumulo SD Indicator 0.8 15.5
Numerator 80 404
Denominator 1 241 733 311 991
Ndwedwe SD Indicator 0.7 8.3
Numerator 108 323
Denominator 1 826 721 465 855
iLembe Indicator 1.9 9.3
Numerator 1 257 1 502
Denominator 7 980 765 1 937 217
KwaZulu-Natal Indicator 2.8 21.7
South Africa Indicator 2.5 18.9
Source: DHIS.
Annual trends
Sub-district value in red – improvement strategies are urgently needed
Value highlighted in yellow – performance is ranked among the 10 best in the country
Value highlighted in red – performance is ranked among the 10 worst in the country

Section B: National and District Profiles
533
Section B: Profile KwaZulu-Natal Province
533
Harry Gwala District Municipality (DC43)
Harry Gwala District is situated in the south of KwaZulu-Natal Province and comprises five health sub-districts, namely Ingwe, Kwa Sani, uMzimkhulu, Greater Kokstad and Ubuhlebezwe. The district has a population of 492 203, with a population density of 46.7 persons per km2 and falls in socio-economic Quintile 1, among the poorest districts in South Africa. Estimated medical scheme coverage is 5.9%.
Social determinants of healtha
Unemployment ratea 36.0%
Youth unemployment rate (15-34 years)a 44.4%
No schooling 10.2%
Matric 23.5%
Higher education 6.4%
Households 123 705
Female-headed households 53.9%
Formal dwellings 41.7%
Flush toilet connected to sewerage 18.4%
Weekly refuse removal 23.1%
Piped water inside dwellings 11.4%
Electricity for lighting 81.0%
Blue Drop water score 63.4%
Source: StatsSA. 2014 Blue Drop Report.
Population distribution sub-district boundaries and health facility locations
a Statistics South Africa. Census 2011 Municipal fact sheet. Report No. 03-01-58. Pretoria: Statistics SA; 2012.
Population per selected category
Population category 2017 2018 2019 2020
under 1 year 14 457 14 470 14 409 14 219
under 5 years 73 011 73 061 72 782 72 257
05-09 years 67 833 69 021 70 025 70 987
10-14 years 57 255 59 395 61 642 63 715
15-19 years 50 282 50 113 50 658 51 905
20-24 years 54 036 52 097 49 973 48 111
25-29 years 54 241 54 434 54 211 53 414
30-34 years 40 956 44 006 47 005 49 859
35-39 years 25 787 28 043 30 313 32 373
40-44 years 16 904 17 578 18 434 19 585
45-49 years 13 375 13 442 13 596 13 847
50-54 years 12 090 11 929 11 759 11 603
55-59 years 10 785 10 674 10 574 10 465
60-64 years 9 257 9 168 9 065 8 954
65-69 years 7 339 7 278 7 211 7 137
70-74 years 5 522 5 448 5 358 5 262
75-79 years 3 906 3 863 3 803 3 723
80 years and older 3 850 3 812 3 780 3 761
Total 506 435 513 362 520 188 526 956
Estimated pregnant women* 15 469 15 483 15 418 15 214
Source: Mid-Year Population Estimates 2016 StatsSA. * Under 1 year population X 1.07.
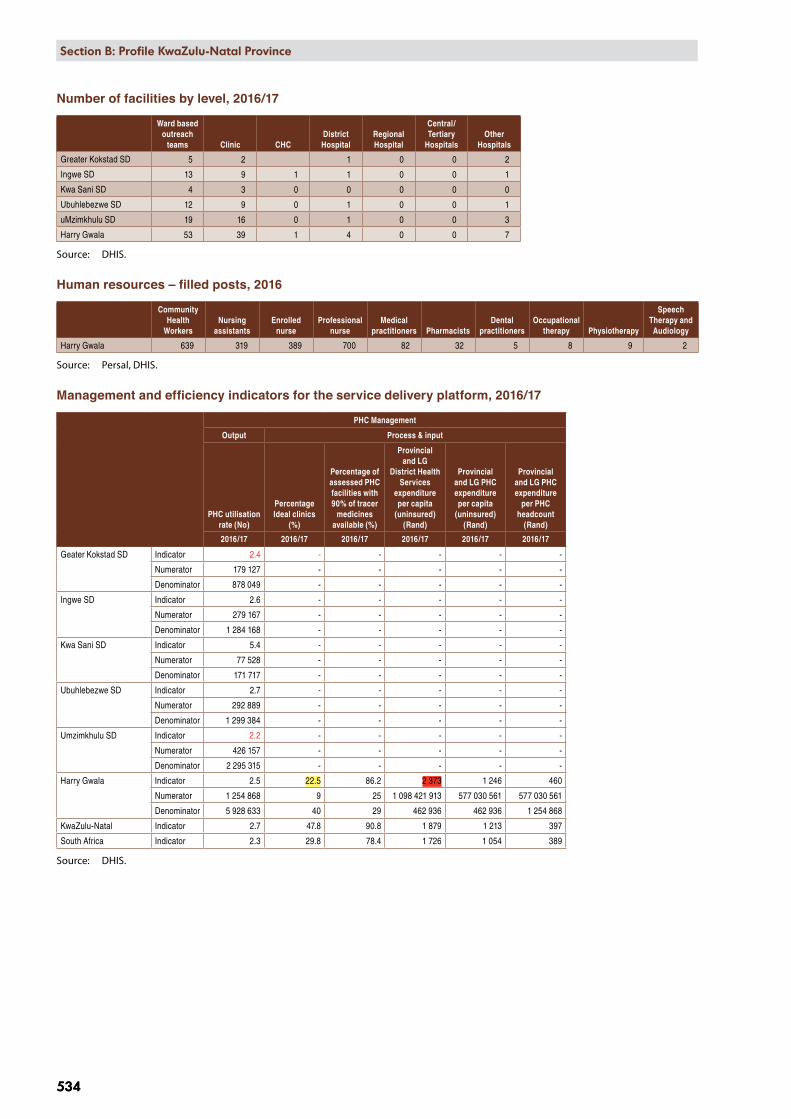
534
Section B: National and District Profiles
534
Section B: Profile KwaZulu-Natal Province
Number of facilities by level, 2016/17
Ward based outreach
teams Clinic CHCDistrict Hospital
Regional Hospital
Central/Tertiary
HospitalsOther
Hospitals
Greater Kokstad SD 5 2 1 0 0 2
Ingwe SD 13 9 1 1 0 0 1
Kwa Sani SD 4 3 0 0 0 0 0
Ubuhlebezwe SD 12 9 0 1 0 0 1
uMzimkhulu SD 19 16 0 1 0 0 3
Harry Gwala 53 39 1 4 0 0 7
Source: DHIS.
Human resources – filled posts, 2016
Community Health
WorkersNursing
assistantsEnrolled
nurseProfessional
nurseMedical
practitioners PharmacistsDental
practitionersOccupational
therapy Physiotherapy
Speech Therapy and Audiology
Harry Gwala 639 319 389 700 82 32 5 8 9 2
Source: Persal, DHIS.
Management and efficiency indicators for the service delivery platform, 2016/17
PHC Management
Output Process & input
PHC utilisation rate (No)
Percentage Ideal clinics
(%)
Percentage of assessed PHC facilities with 90% of tracer
medicines available (%)
Provincial and LG
District Health Services
expenditure per capita
(uninsured) (Rand)
Provincial and LG PHC expenditure per capita
(uninsured) (Rand)
Provincial and LG PHC expenditure
per PHC headcount
(Rand)
2016/17 2016/17 2016/17 2016/17 2016/17 2016/17
Geater Kokstad SD Indicator 2.4 - - - - -
Numerator 179 127 - - - - -
Denominator 878 049 - - - - -
Ingwe SD Indicator 2.6 - - - - -
Numerator 279 167 - - - - -
Denominator 1 284 168 - - - - -
Kwa Sani SD Indicator 5.4 - - - - -
Numerator 77 528 - - - - -
Denominator 171 717 - - - - -
Ubuhlebezwe SD Indicator 2.7 - - - - -
Numerator 292 889 - - - - -
Denominator 1 299 384 - - - - -
Umzimkhulu SD Indicator 2.2 - - - - -
Numerator 426 157 - - - - -
Denominator 2 295 315 - - - - -
Harry Gwala Indicator 2.5 22.5 86.2 2 373 1 246 460
Numerator 1 254 868 9 25 1 098 421 913 577 030 561 577 030 561
Denominator 5 928 633 40 29 462 936 462 936 1 254 868
KwaZulu-Natal Indicator 2.7 47.8 90.8 1 879 1 213 397
South Africa Indicator 2.3 29.8 78.4 1 726 1 054 389
Source: DHIS.
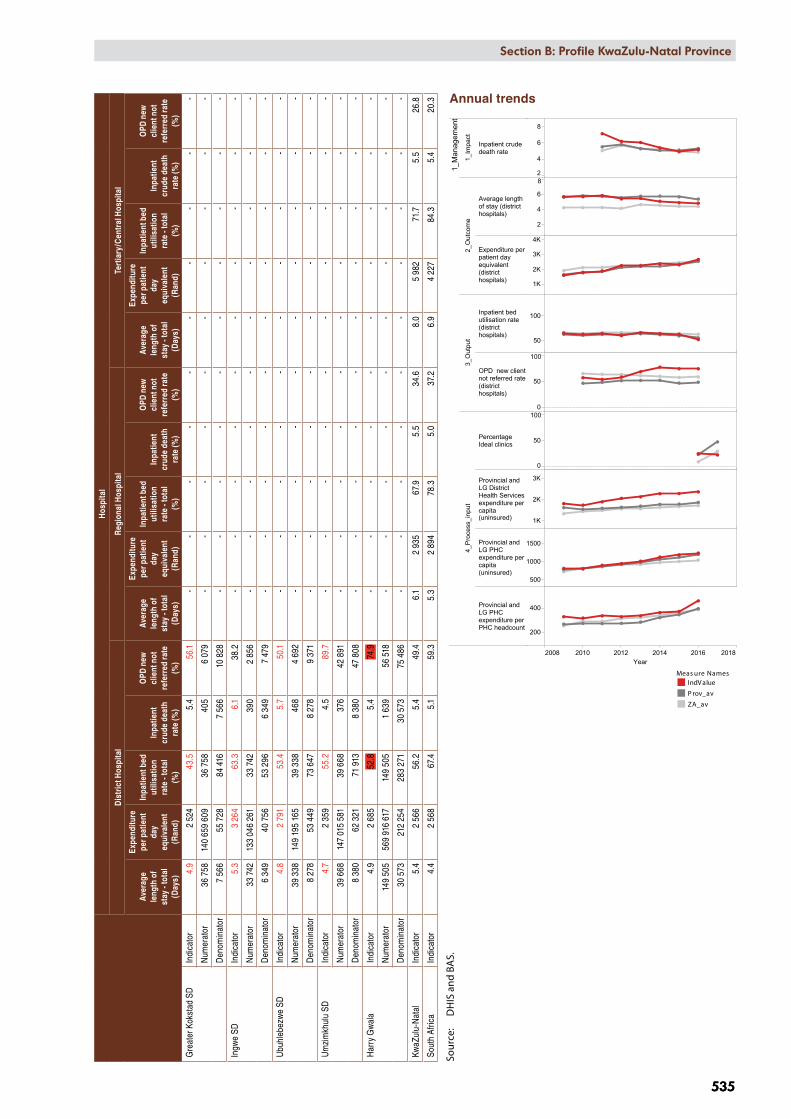
2008 2010 2012 2014 2016 2018Year
1_M
anag
emen
t
1_Im
pact
Inpatient crudedeath rate
2_O
utco
me
Average lengthof stay (districthospitals)
Expenditure perpatient dayequivalent(districthospitals)
3_O
utpu
t
Inpatient bedutilisation rate(districthospitals)
OPD new clientnot referred rate(districthospitals)
4_P
roce
ss_i
nput
PercentageIdeal clinics
Provincial andLG DistrictHealth Servicesexpenditure percapita(uninsured)
Provincial andLG PHCexpenditure percapita(uninsured)
Provincial andLG PHCexpenditure perPHC headcount
2
4
6
8
2
4
6
8
1K
2K
3K
4K
50
100
0
50
100
0
50
100
1K
2K
3K
500
1000
1500
200
400
KZN, DC43, Harry Gwala District Municipality, SEQ 1 (most deprived)
Measure NamesIndValueProv_avZA_av
Meas ure NamesIndV alue
P rov_av
ZA_av
Section B: National and District Profiles
535
Section B: Profile KwaZulu-Natal Province
535
Hos
pita
l
Dis
tric
t Hos
pita
lR
egio
nal H
ospi
tal
Tert
iary
/Cen
tral
Hos
pita
l
Aver
age
leng
th o
f st
ay -
tota
l (D
ays)
Expe
nditu
re
per p
atie
nt
day
equi
vale
nt
(Ran
d)
Inpa
tient
bed
ut
ilisa
tion
rate
- to
tal
(%)
Inpa
tient
cr
ude
deat
h ra
te (%
)
OPD
new
cl
ient
not
re
ferr
ed ra
te
(%)
Aver
age
leng
th o
f st
ay -
tota
l (D
ays)
Expe
nditu
re
per p
atie
nt
day
equi
vale
nt
(Ran
d)
Inpa
tient
bed
ut
ilisa
tion
rate
- to
tal
(%)
Inpa
tient
cr
ude
deat
h ra
te (%
)
OPD
new
cl
ient
not
re
ferr
ed ra
te
(%)
Aver
age
leng
th o
f st
ay -
tota
l (D
ays)
Expe
nditu
re
per p
atie
nt
day
equi
vale
nt
(Ran
d)
Inpa
tient
bed
ut
ilisa
tion
rate
- to
tal
(%)
Inpa
tient
cr
ude
deat
h ra
te (%
)
OPD
new
cl
ient
not
re
ferr
ed ra
te
(%)
Gre
ater
Kok
stad
SD
Indi
cato
r4.
92
524
43.5
5.4
56.1
- -
- -
- -
- -
- -
Num
erat
or36
758
140
659
609
36 7
5840
56
079
- -
- -
- -
- -
- -
Den
omin
ator
7 56
655
728
84 4
167
566
10 8
28 -
- -
- -
- -
- -
-
Ingw
e SD
Indi
cato
r5.
33
264
63.3
6.1
38.2
- -
- -
- -
- -
- -
Num
erat
or33
742
133
046
261
33 7
4239
02
856
- -
- -
- -
- -
- -
Den
omin
ator
6 34
940
756
53 2
966
349
7 47
9 -
- -
- -
- -
- -
-
Ubu
hleb
ezw
e SD
Indi
cato
r4.
82
791
53.4
5.7
50.1
- -
- -
- -
- -
- -
Num
erat
or39
338
149
195
165
39 3
3846
84
692
- -
- -
- -
- -
- -
Den
omin
ator
8 27
853
449
73 6
478
278
9 37
1 -
- -
- -
- -
- -
-
Um
zim
khul
u SD
Indi
cato
r4.
72
359
55.2
4.5
89.7
- -
- -
- -
- -
- -
Num
erat
or39
668
147
015
581
39 6
6837
642
891
- -
- -
- -
- -
- -
Den
omin
ator
8 38
062
321
71 9
138
380
47 8
08 -
- -
- -
- -
- -
-
Har
ry G
wal
a In
dica
tor
4.9
2 68
552
.85.
474
.9 -
- -
- -
- -
- -
-
Num
erat
or14
9 50
556
9 91
6 61
714
9 50
51
639
56 5
18 -
- -
- -
- -
- -
-
Den
omin
ator
30 5
7321
2 25
428
3 27
130
573
75 4
86 -
- -
- -
- -
- -
-
KwaZ
ulu-
Nat
alIn
dica
tor
5.4
2 56
656
.25.
449
.46.
12
935
67.9
5.5
34.6
8.0
5 98
271
.75.
526
.8
Sout
h Af
rica
Indi
cato
r4.
42
568
67.4
5.1
59.3
5.3
2 89
478
.35.
037
.26.
94
227
84.3
5.4
20.3
Sour
ce:
DH
IS a
nd B
AS.
Annual trends
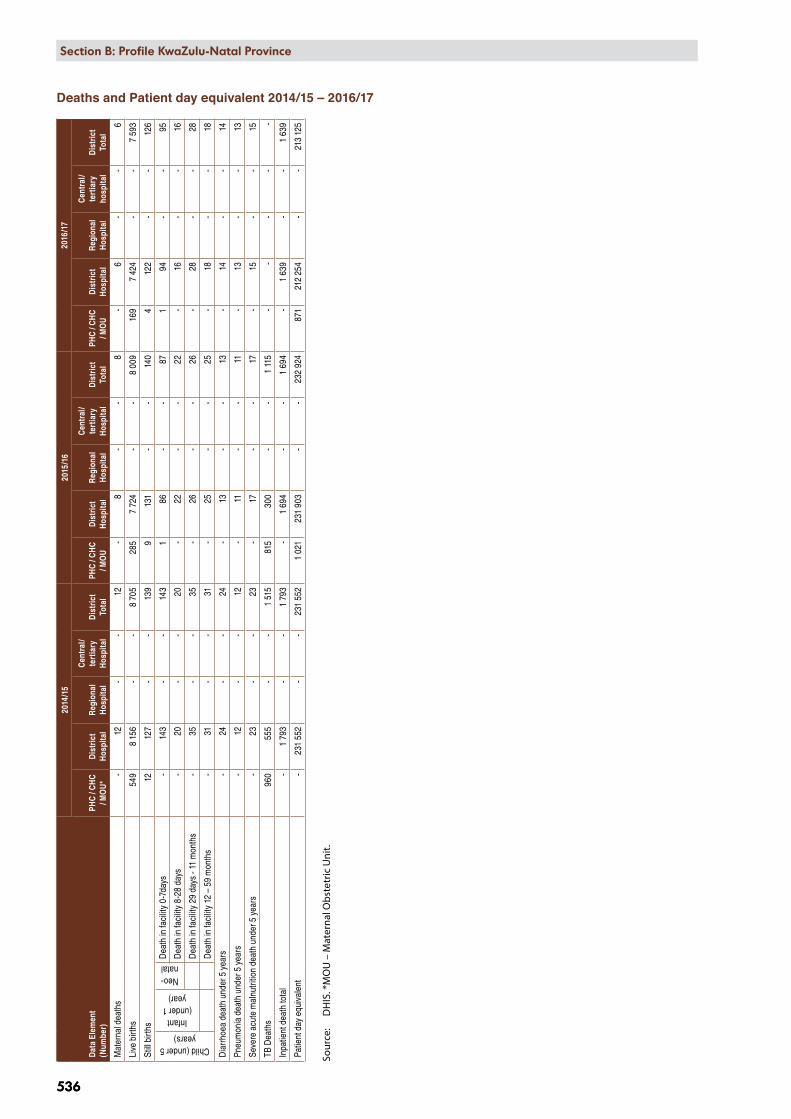
536
Section B: National and District Profiles
536
Section B: Profile KwaZulu-Natal Province
Deaths and Patient day equivalent 2014/15 – 2016/17
Dat
a El
emen
t(N
umbe
r)
2014
/15
2015
/16
2016
/17
PHC
/ CH
C / M
OU
*D
istr
ict
Hos
pita
lR
egio
nal
Hos
pita
l
Cen
tral
/te
rtia
ry
Hos
pita
lD
istr
ict
Tota
lPH
C / C
HC
/ MO
UD
istr
ict
Hos
pita
lR
egio
nal
Hos
pita
l
Cen
tral
/te
rtia
ry
Hos
pita
lD
istr
ict
Tota
lPH
C / C
HC
/ MO
UD
istr
ict
Hos
pita
lR
egio
nal
Hos
pita
l
Cen
tral
/te
rtia
ry
hosp
ital
Dis
tric
t To
tal
Mat
erna
l dea
ths
-12
--
12-
8-
-8
-6
--
6
Live
birt
hs54
98
156
--
8 70
528
57
724
--
8 00
916
97
424
--
7 59
3
Still
birth
s12
127
--
139
913
1-
-14
04
122
--
126
Child (under 5 years)
Infant (under 1
year)
Neo-natal
Dea
th in
faci
lity
0-7d
ays
-14
3-
-14
31
86-
-87
194
--
95
Dea
th in
faci
lity
8-28
day
s -
20-
-20
-22
--
22-
16-
-16
Dea
th in
faci
lity
29 d
ays
- 11
mon
ths
-35
--
35-
26-
-26
-28
--
28
Dea
th in
faci
lity
12 –
59
mon
ths
-31
--
31-
25-
-25
-18
--
18
Dia
rrho
ea d
eath
und
er 5
yea
rs
-24
--
24
-13
--
13-
14-
-14
Pneu
mon
ia d
eath
und
er 5
yea
rs-
12-
-12
-11
--
11-
13-
-13
Seve
re a
cute
mal
nutri
tion
deat
h un
der 5
yea
rs
-23
--
23-
17-
-17
-15
--
15
TB D
eath
s 96
055
5-
-1
515
815
300
--
1 11
5-
--
--
Inpa
tient
dea
th to
tal
-1
793
--
1 79
3-
1 69
4-
-1
694
-1
639
--
1 63
9
Patie
nt d
ay e
quiv
alen
t-
231
552
--
231
552
1 02
123
1 90
3-
-23
2 92
487
121
2 25
4-
-21
3 12
5
Sour
ce:
DH
IS. *
MO
U –
Mat
erna
l Obs
tetr
ic U
nit.
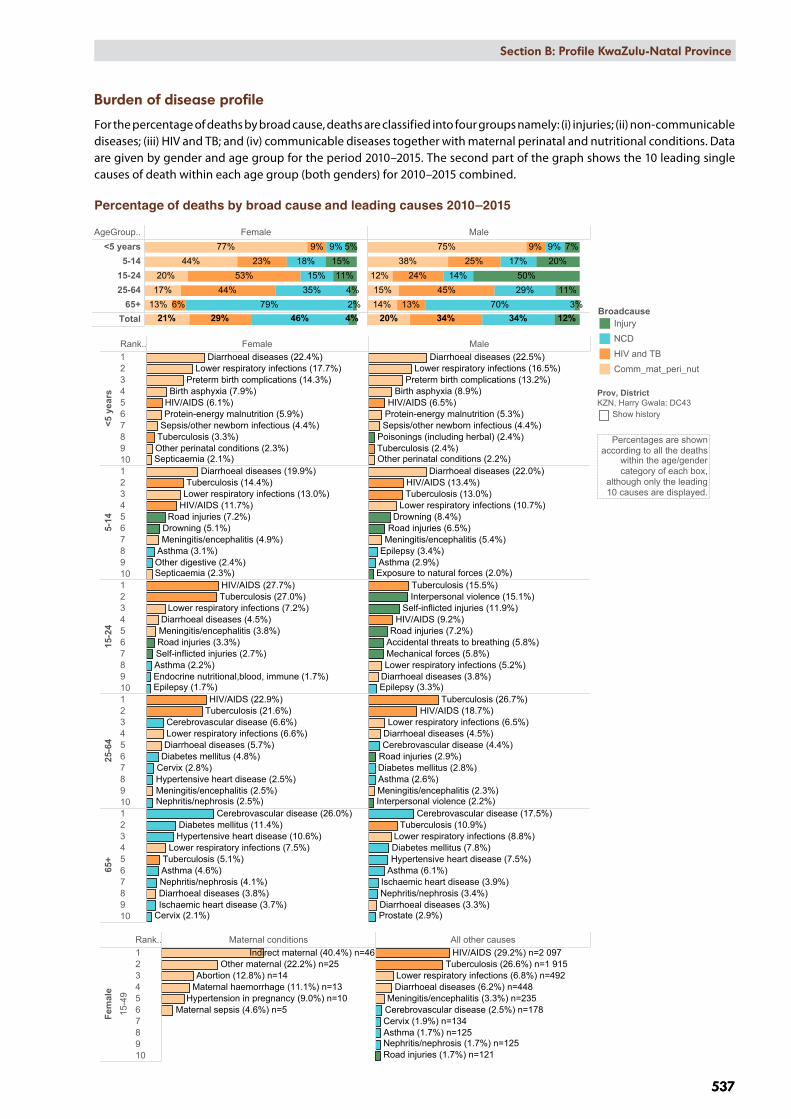
AgeGroup.. Female Male<5 years
5-1415-2425-64
65+Total 21%
13%17%20%
44%77%
29%6%
44%53%
23%9%
46%79%
35%15%
18%9%
4%2%4%
11%15%
5%
20%14%15%
12%38%
75%
34%13%
45%24%
25%9%
34%70%
29%14%
17%9%
12%3%
11%50%
20%7%
KZN, Harry Gwala: DC43, 2010 - 2015
Rank.. Female Male
<5 y
ears
12345678910
5-14
12345678910
15-2
4
12345678910
25-6
4
12345678910
65+
12345678910
Other perinatal conditions (2.3%)
Sepsis/other newborn infectious (4.4%)
Birth asphyxia (7.9%)
Protein-energy malnutrition (5.9%)
Preterm birth complications (14.3%)
Septicaemia (2.1%)
Diarrhoeal diseases (22.4%)Lower respiratory infections (17.7%)
Tuberculosis (3.3%)
HIV/AIDS (6.1%)
Drowning (5.1%)
Other digestive (2.4%)Asthma (3.1%)
Septicaemia (2.3%)
Meningitis/encephalitis (4.9%)
Road injuries (7.2%)
Diarrhoeal diseases (19.9%)
Lower respiratory infections (13.0%)Tuberculosis (14.4%)
HIV/AIDS (11.7%)
Self-inflicted injuries (2.7%)
Epilepsy (1.7%)
Asthma (2.2%)Endocrine nutritional,blood, immune (1.7%)
Meningitis/encephalitis (3.8%)Road injuries (3.3%)
Diarrhoeal diseases (4.5%)Lower respiratory infections (7.2%)
Tuberculosis (27.0%)HIV/AIDS (27.7%)
Cervix (2.8%)
Meningitis/encephalitis (2.5%)Nephritis/nephrosis (2.5%)
Hypertensive heart disease (2.5%)
Diabetes mellitus (4.8%)Diarrhoeal diseases (5.7%)
Cerebrovascular disease (6.6%)Lower respiratory infections (6.6%)
Tuberculosis (21.6%)HIV/AIDS (22.9%)
Cervix (2.1%)
Asthma (4.6%)Nephritis/nephrosis (4.1%)
Hypertensive heart disease (10.6%)Diabetes mellitus (11.4%)
Diarrhoeal diseases (3.8%)Ischaemic heart disease (3.7%)
Cerebrovascular disease (26.0%)
Lower respiratory infections (7.5%)Tuberculosis (5.1%)
Other perinatal conditions (2.2%)
Sepsis/other newborn infectious (4.4%)Poisonings (including herbal) (2.4%)
Birth asphyxia (8.9%)
Protein-energy malnutrition (5.3%)
Preterm birth complications (13.2%)
Diarrhoeal diseases (22.5%)Lower respiratory infections (16.5%)
Tuberculosis (2.4%)
HIV/AIDS (6.5%)
Exposure to natural forces (2.0%)
Drowning (8.4%)
Epilepsy (3.4%)Asthma (2.9%)
Meningitis/encephalitis (5.4%)Road injuries (6.5%)
Diarrhoeal diseases (22.0%)
Lower respiratory infections (10.7%)Tuberculosis (13.0%)HIV/AIDS (13.4%)
Self-inflicted injuries (11.9%)
Epilepsy (3.3%)
Mechanical forces (5.8%)Accidental threats to breathing (5.8%)
Interpersonal violence (15.1%)
Road injuries (7.2%)
Diarrhoeal diseases (3.8%)Lower respiratory infections (5.2%)
Tuberculosis (15.5%)
HIV/AIDS (9.2%)
Asthma (2.6%)Meningitis/encephalitis (2.3%)Interpersonal violence (2.2%)
Road injuries (2.9%)Diabetes mellitus (2.8%)
Diarrhoeal diseases (4.5%)Cerebrovascular disease (4.4%)
Lower respiratory infections (6.5%)
Tuberculosis (26.7%)HIV/AIDS (18.7%)
Prostate (2.9%)
Asthma (6.1%)
Nephritis/nephrosis (3.4%)
Hypertensive heart disease (7.5%)Diabetes mellitus (7.8%)
Diarrhoeal diseases (3.3%)
Ischaemic heart disease (3.9%)
Cerebrovascular disease (17.5%)
Lower respiratory infections (8.8%)Tuberculosis (10.9%)
Rank.. Maternal conditions All other causes
Fem
ale
15-4
9
12345678910
Maternal sepsis (4.6%) n=5
Abortion (12.8%) n=14Maternal haemorrhage (11.1%) n=13
Hypertension in pregnancy (9.0%) n=10
Other maternal (22.2%) n=25Indirect maternal (40.4%) n=46
Asthma (1.7%) n=125
Road injuries (1.7%) n=121
Cervix (1.9%) n=134
Nephritis/nephrosis (1.7%) n=125
Cerebrovascular disease (2.5%) n=178Meningitis/encephalitis (3.3%) n=235
Diarrhoeal diseases (6.2%) n=448Lower respiratory infections (6.8%) n=492
Tuberculosis (26.6%) n=1 915HIV/AIDS (29.2%) n=2 097
Percentage ofdeaths by broad
causes andsingle leading
causes
BroadcauseInjury
NCD
HIV and TB
Comm_mat_peri_nut
Prov, DistrictKZN, Harry Gwala: DC43
Show history
Percentages are shownaccording to all the deaths
within the age/gendercategory of each box,
although only the leading10 causes are displayed.
Section B: National and District Profiles
537
Section B: Profile KwaZulu-Natal Province
537
Burden of disease profile
For the percentage of deaths by broad cause, deaths are classified into four groups namely: (i) injuries; (ii) non-communicable diseases; (iii) HIV and TB; and (iv) communicable diseases together with maternal perinatal and nutritional conditions. Data are given by gender and age group for the period 2010–2015. The second part of the graph shows the 10 leading single causes of death within each age group (both genders) for 2010–2015 combined.
Percentage of deaths by broad cause and leading causes 2010–2015
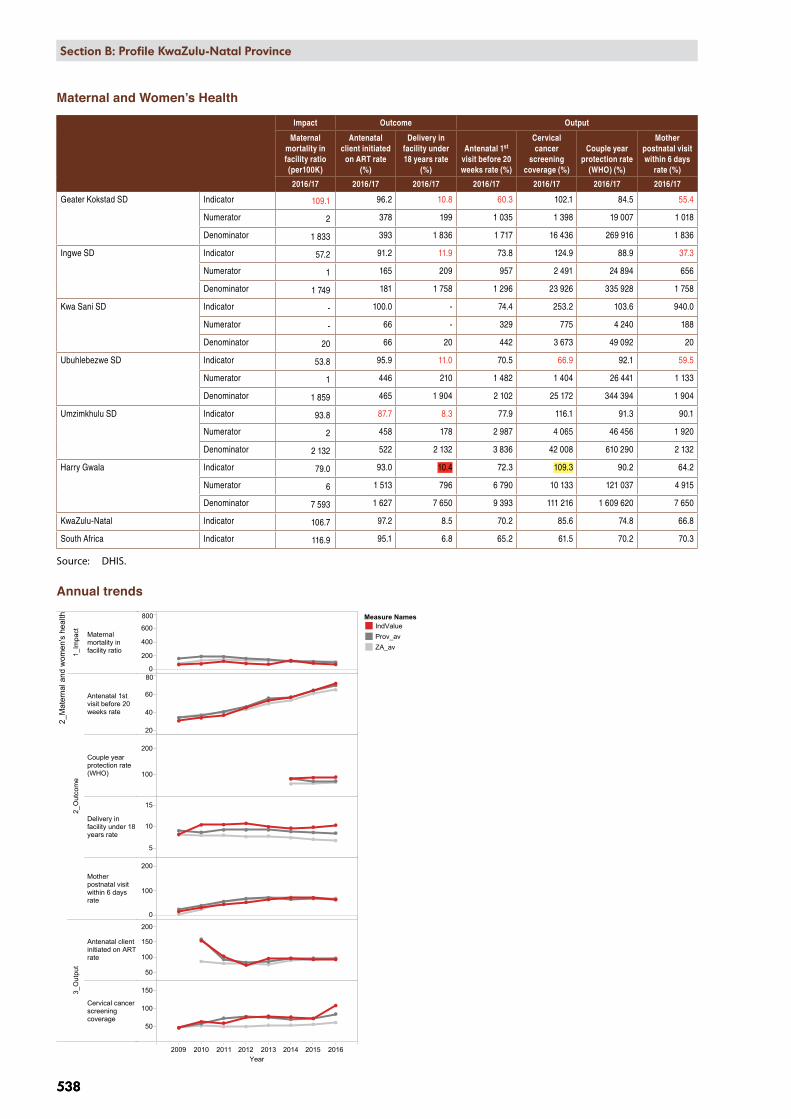
2009 2010 2011 2012 2013 2014 2015 2016Year
2_M
ater
nal a
nd w
omen
's h
ealth
1_Im
pact Maternal
mortality infacility ratio
2_O
utco
me
Antenatal 1stvisit before 20weeks rate
Couple yearprotection rate(WHO)
Delivery infacility under 18years rate
Motherpostnatal visitwithin 6 daysrate
3_O
utpu
t
Antenatal clientinitiated on ARTrate
Cervical cancerscreeningcoverage
0
200
400
600
800
20
40
60
80
100
200
5
10
15
0
100
200
50
100
150
200
50
100
150
KZN, DC43, Harry Gwala District Municipality, SEQ 1 (most deprived)
Measure NamesIndValueProv_avZA_av
538
Section B: National and District Profiles
538
Section B: Profile KwaZulu-Natal Province
Maternal and Women’s Health
Impact Outcome Output
Maternal mortality in facility ratio (per100K)
Antenatal client initiated
on ART rate (%)
Delivery in facility under 18 years rate
(%)
Antenatal 1st visit before 20 weeks rate (%)
Cervical cancer
screening coverage (%)
Couple year protection rate
(WHO) (%)
Mother postnatal visit within 6 days
rate (%)
2016/17 2016/17 2016/17 2016/17 2016/17 2016/17 2016/17
Geater Kokstad SD Indicator 109.1 96.2 10.8 60.3 102.1 84.5 55.4
Numerator 2 378 199 1 035 1 398 19 007 1 018
Denominator 1 833 393 1 836 1 717 16 436 269 916 1 836
Ingwe SD Indicator 57.2 91.2 11.9 73.8 124.9 88.9 37.3
Numerator 1 165 209 957 2 491 24 894 656
Denominator 1 749 181 1 758 1 296 23 926 335 928 1 758
Kwa Sani SD Indicator - 100.0 - 74.4 253.2 103.6 940.0
Numerator - 66 - 329 775 4 240 188
Denominator 20 66 20 442 3 673 49 092 20
Ubuhlebezwe SD Indicator 53.8 95.9 11.0 70.5 66.9 92.1 59.5
Numerator 1 446 210 1 482 1 404 26 441 1 133
Denominator 1 859 465 1 904 2 102 25 172 344 394 1 904
Umzimkhulu SD Indicator 93.8 87.7 8.3 77.9 116.1 91.3 90.1
Numerator 2 458 178 2 987 4 065 46 456 1 920
Denominator 2 132 522 2 132 3 836 42 008 610 290 2 132
Harry Gwala Indicator 79.0 93.0 10.4 72.3 109.3 90.2 64.2
Numerator 6 1 513 796 6 790 10 133 121 037 4 915
Denominator 7 593 1 627 7 650 9 393 111 216 1 609 620 7 650
KwaZulu-Natal Indicator 106.7 97.2 8.5 70.2 85.6 74.8 66.8
South Africa Indicator 116.9 95.1 6.8 65.2 61.5 70.2 70.3
Source: DHIS.
Annual trends

Section B: National and District Profiles
539
Section B: Profile KwaZulu-Natal Province
539
Child and School HealthIm
pact
Out
com
eO
utpu
t
Chi
ld u
nder
5
year
s di
arrh
oea
case
fata
lity
rate
(%)
Chi
ld u
nder
5
year
s pn
eum
onia
ca
se fa
talit
y ra
te (%
)
Chi
ld u
nder
5
year
s se
vere
acu
te
mal
nutr
ition
ca
se fa
talit
y ra
te (%
)
Inpa
tient
de
ath
unde
r 1
year
rate
(%)
Inpa
tient
de
ath
unde
r 5
year
rate
(%)
Inpa
tient
ea
rly n
eona
tal
deat
h ra
te
(per
1K)
Inpa
tient
ne
onat
al
deat
h ra
te
(per
1K)
Infa
nt P
CR
test
pos
itive
ar
ound
10
wee
ks ra
te
(%)
Imm
unis
atio
n co
vera
ge
unde
r 1 y
ear
(%)
Infa
nt
excl
usiv
ely
brea
stfe
d at
D
TaP-
IPV-
Hib
-HB
V 3rd
do
se ra
te (%
)
Mea
sles
2nd
dos
e co
vera
ge (%
)
Scho
ol G
rade
1
scre
enin
g co
vera
ge (%
)
Scho
ol G
rade
8
scre
enin
g co
vera
ge (%
)
Vita
min
A
dose
12-
59
mon
ths
cove
rage
(%)
2016
/17
2016
/17
2016
/17
2016
/17
2016
/17
2016
/17
2016
/17
2016
/17
2016
/17
2016
/17
2016
/17
2016
/17
2016
/17
2016
/17
Gea
ter K
okst
ad S
DIn
dica
tor
0.8
0.8
2.1
6.4
3.7
9.3
11.5
0.6
83.8
34.9
128.
942
.729
.162
.7
Num
erat
or1
11
2930
1721
41
343
566
1 97
760
749
07
324
Den
omin
ator
132
122
4745
581
81
833
1 83
370
819
227
1 62
218
408
1 42
31
683
140
256
Ingw
e SD
Indi
cato
r1.
72.
12.
17.
24.
713
.214
.91.
956
.845
.192
.641
.211
.656
.3
Num
erat
or2
31
2934
2326
41
662
721
2 70
21
349
258
13 0
53
Den
omin
ator
121
145
4840
173
01
749
1 74
920
735
100
1 60
035
004
3 27
62
220
277
986
Kwa
Sani
SD
Indi
cato
r-
--
--
--
3.5
114.
355
.418
1.8
68.3
0.0
127.
4
Num
erat
or-
--
--
--
429
420
046
036
20
2 49
2
Den
omin
ator
--
--
-20
2011
43
087
361
3 03
653
017
623
472
Ubu
hleb
ezw
e SD
Indi
cato
r6.
92.
611
.96.
44.
48.
19.
10.
582
.254
.911
7.0
41.4
21.3
69.6
Num
erat
or10
68
2735
1517
52
306
1 24
73
238
1 46
175
215
156
Den
omin
ator
144
233
6742
478
91
859
1 85
999
733
675
2 27
233
219
3 53
13
526
261
126
Um
zim
khul
u SD
Indi
cato
r0.
62.
612
.813
.68.
018
.822
.00.
765
.751
.797
.637
.832
.484
.0
Num
erat
or1
35
5458
4047
53
523
2 15
35
195
2 31
11
449
35 3
51
Den
omin
ator
174
117
3939
872
72
132
2 13
267
264
341
4 16
163
864
6 10
84
466
505
218
Har
ry G
wal
a In
dica
tor
2.5
2.1
7.5
8.3
5.1
12.5
14.6
0.8
70.5
48.8
106.
141
.024
.472
.9
Num
erat
or14
1315
139
157
9511
122
9 12
84
887
13 5
726
090
2 94
973
376
Den
omin
ator
571
617
201
1 67
83
064
7 59
37
593
2 69
815
5 43
010
016
153
531
178
416
144
852
1 20
8 05
8
KwaZ
ulu-
Nat
alIn
dica
tor
2.0
1.8
7.4
6.4
4.5
9.7
12.4
1.0
85.8
53.9
99.8
26.2
16.4
62.1
Sout
h Af
rica
Indi
cato
r2.
02.
08.
06.
34.
49.
912
.41.
382
.341
.696
.233
.019
.858
.0
Sour
ce:
DH
IS.
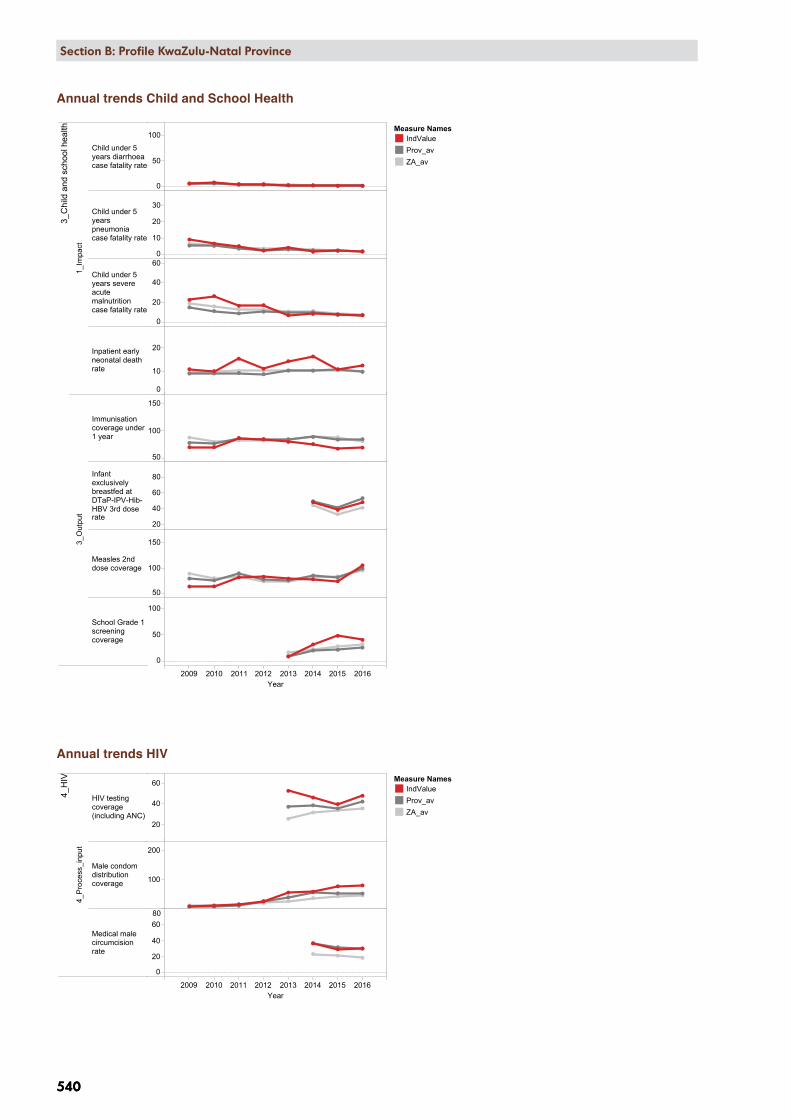
2009 2010 2011 2012 2013 2014 2015 2016Year
3_C
hild
and
sch
ool h
ealth
1_Im
pact
Child under 5years diarrhoeacase fatality rate
Child under 5yearspneumoniacase fatality rate
Child under 5years severeacutemalnutritioncase fatality rate
Inpatient earlyneonatal deathrate
3_O
utpu
t
Immunisationcoverage under1 year
Infantexclusivelybreastfed atDTaP-IPV-Hib-HBV 3rd doserate
Measles 2nddose coverage
School Grade 1screeningcoverage
0
50
100
0
10
20
30
0
20
40
60
0
10
20
50
100
150
20
40
60
80
50
100
150
0
50
100
KZN, DC43, Harry Gwala District Municipality, SEQ 1 (most deprived)
Measure NamesIndValueProv_avZA_av
2009 2010 2011 2012 2013 2014 2015 2016Year
4_H
IV
4_P
roce
ss_i
nput
HIV testingcoverage(including ANC)
Male condomdistributioncoverage
Medical malecircumcisionrate
20
40
60
100
200
0
20
40
6080
KZN, DC43, Harry Gwala District Municipality, SEQ 1 (most deprived)
Measure NamesIndValueProv_avZA_av
540
Section B: National and District Profiles
540
Section B: Profile KwaZulu-Natal Province
Annual trends HIV
Annual trends Child and School Health

Section B: National and District Profiles
541
Section B: Profile KwaZulu-Natal Province
541
HIV
3rd 9
0-90
-90
2nd 9
0-90
-90
1st 90
-90-
90
Out
com
eO
utpu
tPr
oces
s &
inpu
t
Adu
lt w
ith v
iral
load
com
plet
ion
rate
at 1
2 m
onth
s (%
)
Chi
ld w
ith v
iral
load
com
plet
ion
rate
at 1
2 m
onth
s (%
)
Adu
lt w
ith v
iral
load
sup
pres
sed
rate
12
mon
ths
(%)
Chi
ld w
ith v
iral
load
sup
pres
sed
rate
12
mon
ths
(%)
Adu
lt pe
rcen
tage
on
AR
T af
ter 1
2 m
onth
s (%
)
Chi
ld p
erce
ntag
e on
AR
T af
ter 1
2 m
onth
s (%
)C
lient
s re
mai
ning
on
AR
T ra
te (%
)
HIV
test
pos
itive
cl
ient
15
year
s an
d ol
der r
ate
(incl
udin
g A
NC
) (%
)
HIV
test
ing
cove
rage
(in
clud
ing
AN
C)
(%)
Mal
e co
ndom
di
strib
utio
n co
vera
ge (N
o)
Med
ical
mal
e ci
rcum
cisi
on ra
te
(per
1K)
2015
2015
2015
2015
2015
2015
2016
/17
2016
/17
2016
/17
2016
/17
2016
/17
Gr K
okst
ad S
DIn
dica
tor
68.9
81.8
86.1
57.8
72.3
79.2
- -
34.6
65.5
17.4
Num
erat
or -
45 -
26 -
61 -
-16
041
1 70
7 67
950
8
Den
omin
ator
1 04
355
719
451
613
77 -
-55
5 81
331
2 74
435
1 21
6
Ingw
e SD
Indi
cato
r48
.152
.689
.763
.381
.192
.1 -
-48
.179
.733
.8
Num
erat
or -
30 -
19 -
58 -
-25
533
2 32
0 34
51
208
Den
omin
ator
1 09
457
526
301
447
63 -
-63
7 40
434
9 16
442
8 62
5
Kwa
Sani
SD
Indi
cato
r46
.450
.086
.757
.186
.193
.8 -
-55
.260
.012
.9
Num
erat
or -
7 -
4 -
15 -
-5
110
355
521
82
Den
omin
ator
373
1417
37
453
16 -
-11
1 11
771
082
76 5
21
Ubu
hleb
ezw
e SD
Indi
cato
r47
.647
.584
.737
.573
.086
.0 -
-54
.081
.243
.8
Num
erat
or -
48 -
18 -
111
- -
30 0
082
521
910
1 63
4
Den
omin
ator
2 20
210
11
049
483
146
129
- -
666
870
372
537
447
915
Um
zim
khul
u SD
Indi
cato
r49
.554
.481
.967
.476
.282
.4 -
-50
.493
.829
.3
Num
erat
or -
43 -
29 -
84 -
-46
730
4 56
3 84
51
781
Den
omin
ator
1 93
079
955
432
698
102
- -
1 11
2 35
258
3 89
072
9 10
5
Har
ry G
wal
a In
dica
tor
51.5
56.5
85.1
55.5
75.7
85.0
56.5
7.8
48.0
81.5
30.8
Num
erat
or -
173
-96
-32
949
519
10 6
1012
3 42
211
469
300
5 21
3
Den
omin
ator
6 64
230
63
422
173
9 35
738
787
579
135
215
3 08
3 55
61
689
417
2 03
3 38
2
KwaZ
ulu-
Nat
alIn
dica
tor
58.0
56.8
91.8
68.5
75.9
78.5
61.3
11.4
42.5
53.9
30.5
Sout
h Af
rica
Indi
cato
r -
- -
- -
-55
.08.
235
.947
.519
.0
Sour
ce:
DH
IS.

2009 2010 2011 2012 2013 2014 2015 2016Year
5_TB
1_Im
pact
TB death rate(ETR.net)
TB DR clientdeath rate(EDRWeb)
2_O
utco
me
TB client lost tofollow up rate(ETR.Net)
TB clienttreatmentsuccess rate(ETR.net)
TB DR clientloss to follow uprate (EDRWeb)
TB DRtreatmentsuccess rate(EDRWeb)
TB Rifampicinresistanceconfirmed clientrate
TB/HIVco-infectedclient on ARTrate (ETR.Net)
4_P
roce
ss_i
nput
TB symptom 5years and olderscreened infacility rate
5
10
15
0
20
40
60
0
5
10
15
40
60
80
0
20
40
0
20
40
60
0
10
20
0
50
100
0
50
100
KZN, DC43, Harry Gwala District Municipality, SEQ 1 (most deprived)
Measure NamesIndValueProv_avZA_av
Meas ure NamesIndV alue
P rov_av
ZA_av
542
Section B: National and District Profiles
542
Section B: Profile KwaZulu-Natal Province
TB
Impa
ctO
utco
me
Out
put
Proc
ess
& in
put
TB d
eath
rate
(E
TR.n
et) (
%)
TB D
R cl
ient
de
ath
rate
(E
DR
Web
) (%
)
TB c
lient
loss
to
follo
w u
p ra
te
(ETR
.Net
) (%
)
TB c
lient
tr
eatm
ent
succ
ess
rate
(E
TR.n
et) (
%)
TB D
R cl
ient
loss
to
follo
w u
p ra
te
(ED
RW
eb) (
%)
TB D
R tr
eatm
ent
succ
ess
rate
(E
DR
Web
) (%
)
TB R
ifam
pici
n re
sist
ance
co
nfirm
ed c
lient
ra
te (%
)
TB R
ifam
pici
n re
sist
ant c
lient
s tr
eatm
ent
initi
atio
n ra
te (%
)
TB/H
IV c
o-in
fect
ed c
lient
on
AR
T ra
te (E
TR.
Net
) (%
)
TB c
lient
initi
ated
on
trea
tmen
t ra
te (%
)
TB s
ympt
om 5
ye
ars
and
olde
r sc
reen
ed in
fa
cilit
y ra
te (%
)
2015
2014
2015
2015
2014
2014
2016
2016
2016
2016
2016
/17
Gr K
okst
ad S
DIn
dica
tor
7.0
-11
.273
.2 -
- -
-63
.7 -
93.0
Num
erat
or69
-11
172
3 -
- -
-26
3 -
130
415
Den
omin
ator
988
-98
898
8 -
- -
-41
3 -
140
225
Ingw
e SD
Indi
cato
r13
.3 -
1.3
81.5
- -
- -
95.8
-84
.5
Num
erat
or61
-6
374
- -
- -
182
-19
0 31
8
Den
omin
ator
459
-45
945
9 -
- -
-19
0 -
225
257
Kwa
Sani
SD
Indi
cato
r5.
4 -
0.0
93.2
- -
- -
90.0
-76
.2
Num
erat
or4
-0
69 -
- -
-18
-51
855
Den
omin
ator
74 -
7474
- -
- -
20 -
68 0
10
Ubu
hleb
ezw
e SD
Indi
cato
r5.
3 -
0.4
90.3
- -
- -
97.8
-74
.7
Num
erat
or38
-3
650
- -
- -
317
-17
7 37
4
Den
omin
ator
720
-72
072
0 -
- -
-32
4 -
237
436
Um
zim
khul
u SD
Indi
cato
r7.
0 -
2.4
82.7
- -
- -
99.8
-78
.3
Num
erat
or76
-26
897
- -
- -
430
-25
8 54
2
Den
omin
ator
1 08
5 -
1 08
51
085
- -
- -
431
-33
0 28
5
Har
ry G
wal
a In
dica
tor
7.5
28.5
4.4
81.6
13.9
54.3
6.8
63.8
87.8
58.5
80.8
Num
erat
or24
843
146
2 71
321
8214
190
1 21
01
220
808
504
Den
omin
ator
3 32
615
13
326
3 32
615
115
12
085
141
1 37
82
085
1 00
1 21
3
KwaZ
ulu-
Nat
alIn
dica
tor
5.4
19.0
4.8
82.7
17.2
59.6
7.7
73.8
85.7
62.4
78.3
Sout
h Af
rica
Indi
cato
r6.
623
.06.
481
.017
.950
.56.
268
.088
.372
.851
.6
Sour
ce:
DH
IS.
Annual trends
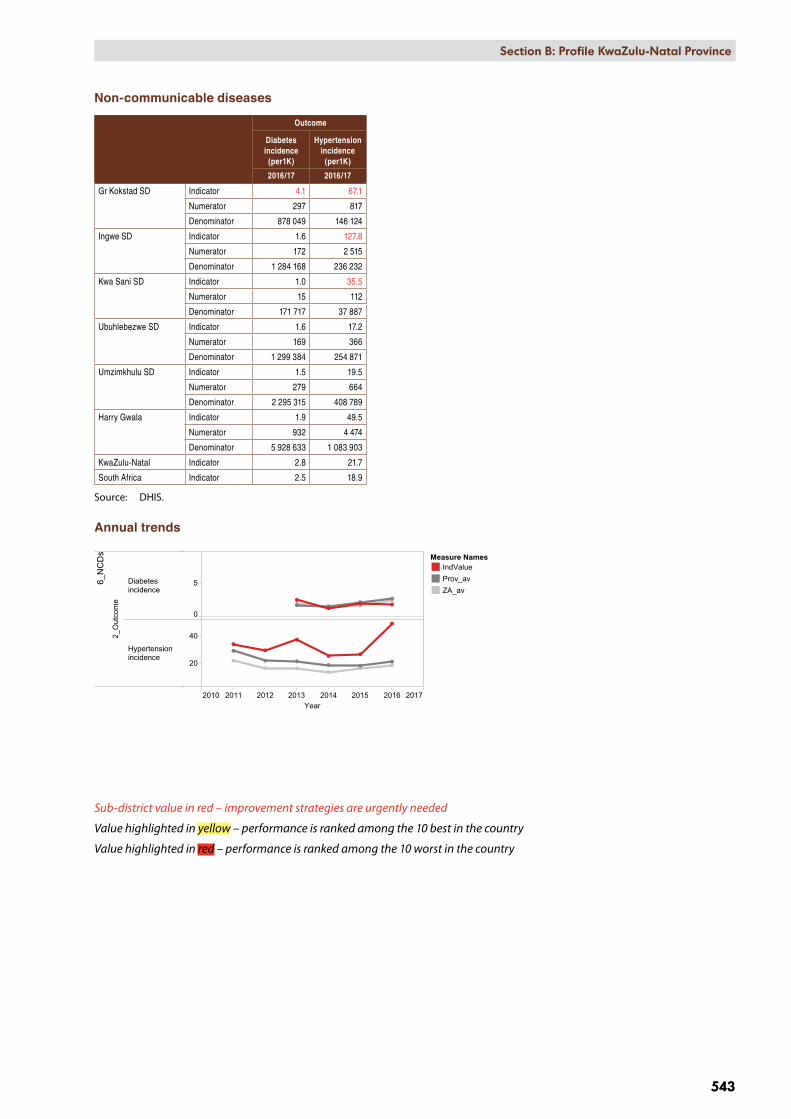
2010 2011 2012 2013 2014 2015 2016 2017Year
6_NCDs
2_Outcome
Diabetesincidence
Hypertensionincidence
0
5
20
40
KZN, DC43, Harry Gwala District Municipality, SEQ 1 (most deprived)
Measure NamesIndValueProv_avZA_av
Section B: National and District Profiles
543
Section B: Profile KwaZulu-Natal Province
543
Non-communicable diseases
Outcome
Diabetes incidence
(per1K)
Hypertension incidence
(per1K)
2016/17 2016/17
Gr Kokstad SD Indicator 4.1 67.1
Numerator 297 817
Denominator 878 049 146 124
Ingwe SD Indicator 1.6 127.8
Numerator 172 2 515
Denominator 1 284 168 236 232
Kwa Sani SD Indicator 1.0 35.5
Numerator 15 112
Denominator 171 717 37 887
Ubuhlebezwe SD Indicator 1.6 17.2
Numerator 169 366
Denominator 1 299 384 254 871
Umzimkhulu SD Indicator 1.5 19.5
Numerator 279 664
Denominator 2 295 315 408 789
Harry Gwala Indicator 1.9 49.5
Numerator 932 4 474
Denominator 5 928 633 1 083 903
KwaZulu-Natal Indicator 2.8 21.7
South Africa Indicator 2.5 18.9
Source: DHIS.
Annual trends
Sub-district value in red – improvement strategies are urgently needed
Value highlighted in yellow – performance is ranked among the 10 best in the country
Value highlighted in red – performance is ranked among the 10 worst in the country
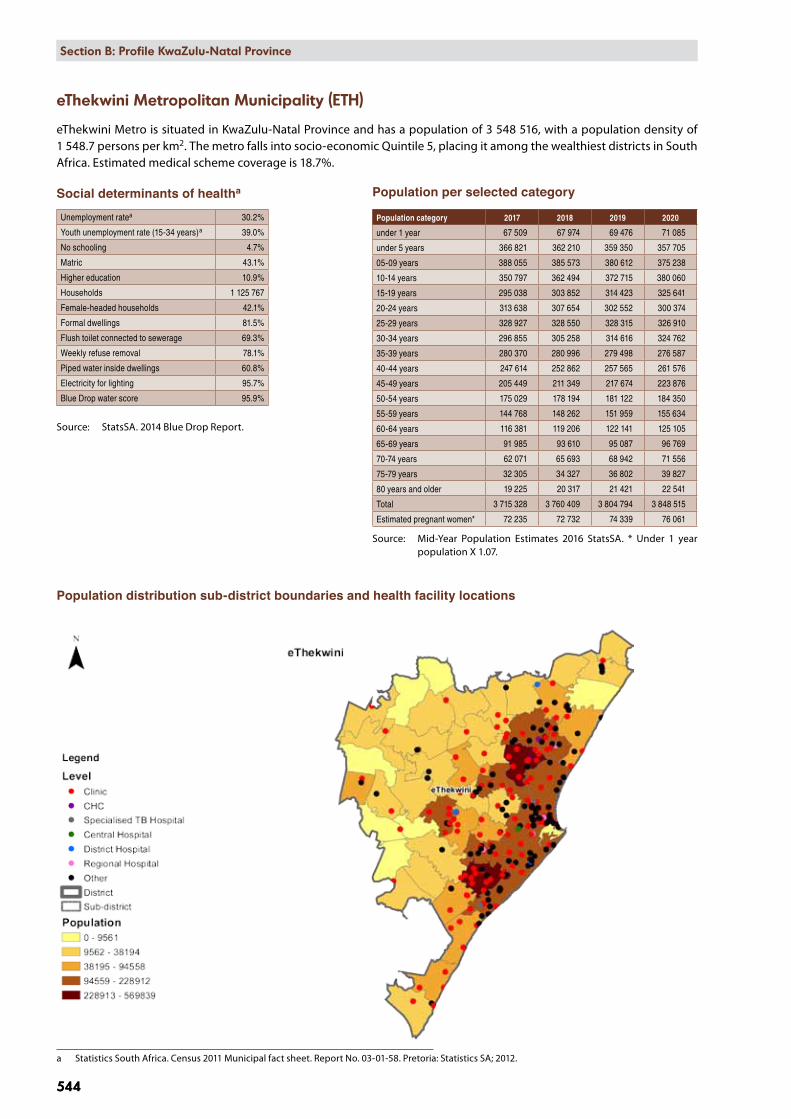
544
Section B: National and District Profiles
544
Section B: Profile KwaZulu-Natal Province
eThekwini Metropolitan Municipality (ETH)
eThekwini Metro is situated in KwaZulu-Natal Province and has a population of 3 548 516, with a population density of 1 548.7 persons per km2. The metro falls into socio-economic Quintile 5, placing it among the wealthiest districts in South Africa. Estimated medical scheme coverage is 18.7%.
Social determinants of healtha
Unemployment ratea 30.2%
Youth unemployment rate (15-34 years)a 39.0%
No schooling 4.7%
Matric 43.1%
Higher education 10.9%
Households 1 125 767
Female-headed households 42.1%
Formal dwellings 81.5%
Flush toilet connected to sewerage 69.3%
Weekly refuse removal 78.1%
Piped water inside dwellings 60.8%
Electricity for lighting 95.7%
Blue Drop water score 95.9%
Source: StatsSA. 2014 Blue Drop Report.
Population distribution sub-district boundaries and health facility locations
a Statistics South Africa. Census 2011 Municipal fact sheet. Report No. 03-01-58. Pretoria: Statistics SA; 2012.
Population per selected category
Population category 2017 2018 2019 2020
under 1 year 67 509 67 974 69 476 71 085
under 5 years 366 821 362 210 359 350 357 705
05-09 years 388 055 385 573 380 612 375 238
10-14 years 350 797 362 494 372 715 380 060
15-19 years 295 038 303 852 314 423 325 641
20-24 years 313 638 307 654 302 552 300 374
25-29 years 328 927 328 550 328 315 326 910
30-34 years 296 855 305 258 314 616 324 762
35-39 years 280 370 280 996 279 498 276 587
40-44 years 247 614 252 862 257 565 261 576
45-49 years 205 449 211 349 217 674 223 876
50-54 years 175 029 178 194 181 122 184 350
55-59 years 144 768 148 262 151 959 155 634
60-64 years 116 381 119 206 122 141 125 105
65-69 years 91 985 93 610 95 087 96 769
70-74 years 62 071 65 693 68 942 71 556
75-79 years 32 305 34 327 36 802 39 827
80 years and older 19 225 20 317 21 421 22 541
Total 3 715 328 3 760 409 3 804 794 3 848 515
Estimated pregnant women* 72 235 72 732 74 339 76 061
Source: Mid-Year Population Estimates 2016 StatsSA. * Under 1 year population X 1.07.

Section B: National and District Profiles
545
Section B: Profile KwaZulu-Natal Province
545
Number of facilities by level, 2016/17
Ward based outreach
teams Clinic CHCDistrict Hospital
Regional Hospital
Central/Tertiary
HospitalsOther
Hospitals
eThekwini 48 129 8 4 5 2 30
Source: DHIS.
Human resources – filled posts, 2016
Community Health
WorkersNursing
assistantsEnrolled
nurseProfessional
nurseMedical
practitioners PharmacistsDental
practitionersOccupational
therapy Physiotherapy
Speech Therapy and Audiology
eThekwini 1 663 2 269 3 276 5 209 1 301 344 39 65 124 45
Source: Persal, DHIS.
Management and efficiency indicators for the service delivery platform, 2016/17
PHC Management
Output Process & input
PHC utilisation rate (No)
Percentage Ideal clinics
(%)
Percentage of assessed PHC facilities with 90% of tracer
medicines available (%)
Provincial and LG
District Health Services
expenditure per capita
(uninsured) (Rand)
Provincial and LG PHC expenditure per capita
(uninsured) (Rand)
Provincial and LG PHC expenditure
per PHC headcount
(Rand)
2016/17 2016/17 2016/17 2016/17 2016/17 2016/17
eThekwini Indicator 2.7 17.7 94.4 1 424 1 157 354
Numerator 9 427 971 20 84 4 108 445 771 3 339 114 743 3 339 114 743
Denominator 42 632 217 113 89 2 885 513 2 885 513 9 427 971
KwaZulu-Natal Indicator 2.7 47.8 90.8 1 879 1 213 397
South Africa Indicator 2.3 29.8 78.4 1 726 1 054 389
Source: DHIS.
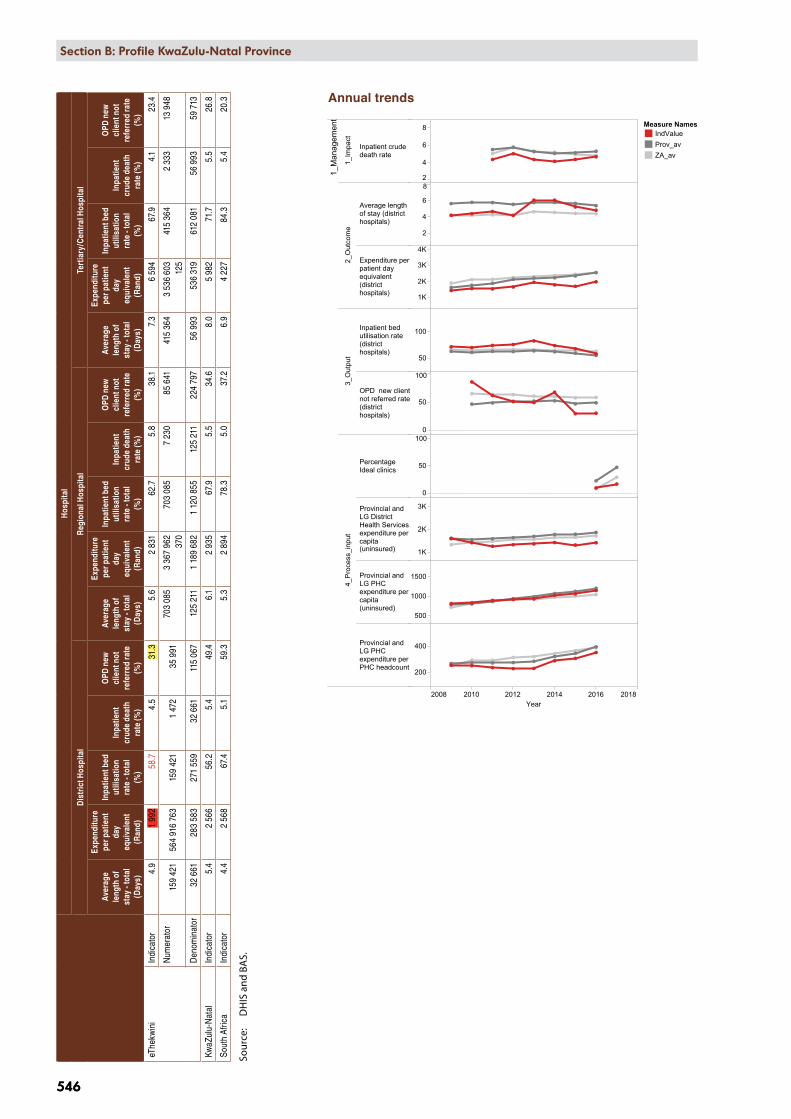
2008 2010 2012 2014 2016 2018Year
1_M
anag
emen
t
1_Im
pact
Inpatient crudedeath rate
2_O
utco
me
Average lengthof stay (districthospitals)
Expenditure perpatient dayequivalent(districthospitals)
3_O
utpu
t
Inpatient bedutilisation rate(districthospitals)
OPD new clientnot referred rate(districthospitals)
4_P
roce
ss_i
nput
PercentageIdeal clinics
Provincial andLG DistrictHealth Servicesexpenditure percapita(uninsured)
Provincial andLG PHCexpenditure percapita(uninsured)
Provincial andLG PHCexpenditure perPHC headcount
2
4
6
8
2
4
6
8
1K
2K
3K
4K
50
100
0
50
100
0
50
100
1K
2K
3K
500
1000
1500
200
400
KZN, ETH, eThekwini Metropolitan Municipality, SEQ 5 (least deprived)
Measure NamesIndValueProv_avZA_av
546
Section B: National and District Profiles
546
Section B: Profile KwaZulu-Natal ProvinceH
ospi
tal
Dis
tric
t Hos
pita
lR
egio
nal H
ospi
tal
Tert
iary
/Cen
tral
Hos
pita
l
Aver
age
leng
th o
f st
ay -
tota
l (D
ays)
Expe
nditu
re
per p
atie
nt
day
equi
vale
nt
(Ran
d)
Inpa
tient
bed
ut
ilisa
tion
rate
- to
tal
(%)
Inpa
tient
cr
ude
deat
h ra
te (%
)
OPD
new
cl
ient
not
re
ferr
ed ra
te
(%)
Aver
age
leng
th o
f st
ay -
tota
l (D
ays)
Expe
nditu
re
per p
atie
nt
day
equi
vale
nt
(Ran
d)
Inpa
tient
bed
ut
ilisa
tion
rate
- to
tal
(%)
Inpa
tient
cr
ude
deat
h ra
te (%
)
OPD
new
cl
ient
not
re
ferr
ed ra
te
(%)
Aver
age
leng
th o
f st
ay -
tota
l (D
ays)
Expe
nditu
re
per p
atie
nt
day
equi
vale
nt
(Ran
d)
Inpa
tient
bed
ut
ilisa
tion
rate
- to
tal
(%)
Inpa
tient
cr
ude
deat
h ra
te (%
)
OPD
new
cl
ient
not
re
ferr
ed ra
te
(%)
eThe
kwin
iIn
dica
tor
4.9
1 99
258
.74.
531
.35.
62
831
62.7
5.8
38.1
7.3
6 59
467
.94.
123
.4
Num
erat
or15
9 42
156
4 91
6 76
315
9 42
11
472
35 9
9170
3 08
53
367
962
370
703
085
7 23
085
641
415
364
3 53
6 60
3 12
541
5 36
42
333
13 9
48
Den
omin
ator
32 6
6128
3 58
327
1 55
932
661
115
067
125
211
1 18
9 68
21
120
855
125
211
224
797
56 9
9353
6 31
961
2 08
156
993
59 7
13
KwaZ
ulu-
Nat
alIn
dica
tor
5.4
2 56
656
.25.
449
.46.
12
935
67.9
5.5
34.6
8.0
5 98
271
.75.
526
.8
Sout
h Af
rica
Indi
cato
r4.
42
568
67.4
5.1
59.3
5.3
2 89
478
.35.
037
.26.
94
227
84.3
5.4
20.3
Sour
ce:
DH
IS a
nd B
AS.
Annual trends

Section B: National and District Profiles
547
Section B: Profile KwaZulu-Natal Province
547
Deaths and Patient day equivalent 2014/15 – 2016/17
Dat
a El
emen
t(N
umbe
r)
2014
/15
2015
/16
2016
/17
PHC
/ CH
C / M
OU
*D
istr
ict
Hos
pita
lR
egio
nal
Hos
pita
l
Cen
tral
/te
rtia
ry
Hos
pita
lD
istr
ict
Tota
lPH
C / C
HC
/ MO
UD
istr
ict
Hos
pita
lR
egio
nal
Hos
pita
l
Cen
tral
/te
rtia
ry
Hos
pita
lD
istr
ict
Tota
lPH
C / C
HC
/ MO
UD
istr
ict
Hos
pita
lR
egio
nal
Hos
pita
l
Cen
tral
/te
rtia
ry
hosp
ital
Dis
tric
t To
tal
Mat
erna
l dea
ths
34
3416
57-
334
2158
16
3518
60
Live
birt
hs7
383
10 8
5126
993
7 48
352
710
7 07
210
438
26 6
406
670
50 8
206
224
9 44
627
215
6 44
249
327
Still
birth
s73
183
730
256
1 24
279
177
703
259
1 21
877
142
668
213
1 10
0
Child (under 5 years)
Infant (under 1
year)
Neo-natal
Dea
th in
faci
lity
0-7d
ays
1195
300
231
637
1199
347
198
655
1859
312
124
513
Dea
th in
faci
lity
8-28
day
s 1
675
9918
12
881
9118
2-
865
8515
8
Dea
th in
faci
lity
29 d
ays
- 11
mon
ths
953
109
232
403
356
9814
129
82
3072
8518
9
Dea
th in
faci
lity
12 –
59
mon
ths
133
161
183
378
616
9193
206
110
8055
146
Dia
rrho
ea d
eath
und
er 5
yea
rs
613
291
498
934
1061
-6
2411
41
Pneu
mon
ia d
eath
und
er 5
yea
rs1
634
2970
44
2553
86-
223
3257
Seve
re a
cute
mal
nutri
tion
deat
h un
der 5
yea
rs
210
467
654
530
1453
-12
2112
45
TB D
eath
s 95
484
1320
1 07
190
773
182
1 00
0-
--
--
Inpa
tient
dea
th to
tal
191
2 14
36
359
2 17
910
872
229
2 04
66
571
2 29
011
136
150
1 47
27
230
2 33
311
185
Patie
nt d
ay e
quiv
alen
t28
242
323
524
1 28
1 81
658
9 40
12
222
983
30 6
6132
3 09
91
230
818
575
848
2 16
0 42
634
825
2835
831
189
682
536
318
2 04
4 40
8
Sour
ce:
DH
IS. *
MO
U –
Mat
erna
l Obs
tetr
ic U
nit.
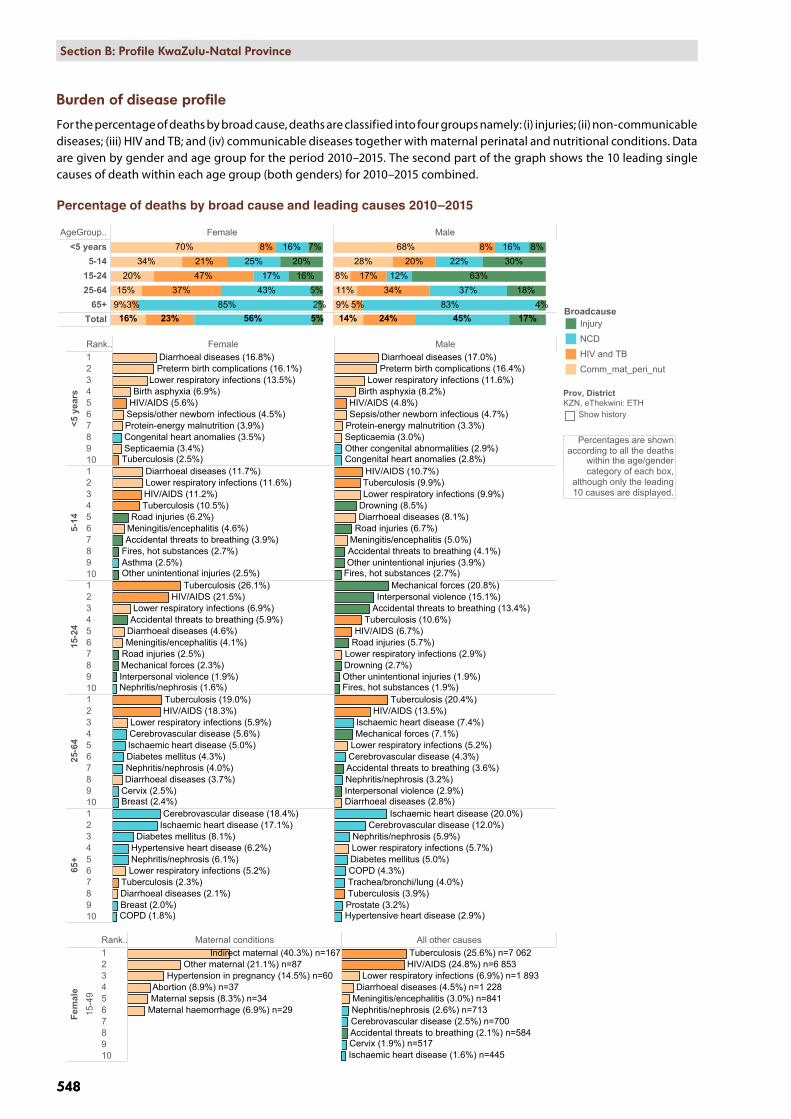
AgeGroup.. Female Male<5 years
5-1415-2425-64
65+Total 16%
9%15%
20%34%
70%
23%3%
37%47%21%
8%
56%85%
43%17%
25%16%
5%2%
5%16%
20%7%
14%9%11%8%
28%68%
24%5%
34%17%
20%8%
45%83%
37%12%
22%16%
17%4%
18%63%
30%8%
KZN, eThekwini: ETH, 2010 - 2015
Rank.. Female Male
<5 y
ears
12345678910
5-14
12345678910
15-2
4
12345678910
25-6
4
12345678910
65+
12345678910
Congenital heart anomalies (3.5%)
Sepsis/other newborn infectious (4.5%)
Birth asphyxia (6.9%)
Protein-energy malnutrition (3.9%)
Preterm birth complications (16.1%)
Septicaemia (3.4%)
Diarrhoeal diseases (16.8%)
Lower respiratory infections (13.5%)
Tuberculosis (2.5%)
HIV/AIDS (5.6%)
Other unintentional injuries (2.5%)
Fires, hot substances (2.7%)Asthma (2.5%)
Meningitis/encephalitis (4.6%)Accidental threats to breathing (3.9%)
Road injuries (6.2%)
Diarrhoeal diseases (11.7%)Lower respiratory infections (11.6%)
Tuberculosis (10.5%)HIV/AIDS (11.2%)
Meningitis/encephalitis (4.1%)
Mechanical forces (2.3%)
Accidental threats to breathing (5.9%)
Interpersonal violence (1.9%)
Road injuries (2.5%)
Nephritis/nephrosis (1.6%)
Diarrhoeal diseases (4.6%)
Lower respiratory infections (6.9%)
Tuberculosis (26.1%)HIV/AIDS (21.5%)
Breast (2.4%)Cervix (2.5%)
Nephritis/nephrosis (4.0%)Diabetes mellitus (4.3%)
Diarrhoeal diseases (3.7%)
Ischaemic heart disease (5.0%)Cerebrovascular disease (5.6%)Lower respiratory infections (5.9%)
Tuberculosis (19.0%)HIV/AIDS (18.3%)
Breast (2.0%)COPD (1.8%)
Nephritis/nephrosis (6.1%)Hypertensive heart disease (6.2%)
Diabetes mellitus (8.1%)
Diarrhoeal diseases (2.1%)
Ischaemic heart disease (17.1%)Cerebrovascular disease (18.4%)
Lower respiratory infections (5.2%)Tuberculosis (2.3%)
Other congenital abnormalities (2.9%)Congenital heart anomalies (2.8%)
Sepsis/other newborn infectious (4.7%)
Birth asphyxia (8.2%)
Protein-energy malnutrition (3.3%)
Preterm birth complications (16.4%)
Septicaemia (3.0%)
Diarrhoeal diseases (17.0%)
Lower respiratory infections (11.6%)
HIV/AIDS (4.8%)
Other unintentional injuries (3.9%)
Drowning (8.5%)
Fires, hot substances (2.7%)
Meningitis/encephalitis (5.0%)Accidental threats to breathing (4.1%)
Road injuries (6.7%)Diarrhoeal diseases (8.1%)
Lower respiratory infections (9.9%)Tuberculosis (9.9%)HIV/AIDS (10.7%)
Other unintentional injuries (1.9%)Drowning (2.7%)
Fires, hot substances (1.9%)
Mechanical forces (20.8%)
Accidental threats to breathing (13.4%)Interpersonal violence (15.1%)
Road injuries (5.7%)Lower respiratory infections (2.9%)
Tuberculosis (10.6%)HIV/AIDS (6.7%)
Mechanical forces (7.1%)
Accidental threats to breathing (3.6%)
Interpersonal violence (2.9%)Nephritis/nephrosis (3.2%)
Diarrhoeal diseases (2.8%)
Ischaemic heart disease (7.4%)
Cerebrovascular disease (4.3%)Lower respiratory infections (5.2%)
Tuberculosis (20.4%)HIV/AIDS (13.5%)
Prostate (3.2%)
Trachea/bronchi/lung (4.0%)COPD (4.3%)
Nephritis/nephrosis (5.9%)
Hypertensive heart disease (2.9%)
Diabetes mellitus (5.0%)
Ischaemic heart disease (20.0%)Cerebrovascular disease (12.0%)
Lower respiratory infections (5.7%)
Tuberculosis (3.9%)
Rank.. Maternal conditions All other causes
Fem
ale
15-4
9
12345678910
Maternal sepsis (8.3%) n=34Abortion (8.9%) n=37
Maternal haemorrhage (6.9%) n=29
Hypertension in pregnancy (14.5%) n=60Other maternal (21.1%) n=87
Indirect maternal (40.3%) n=167
Accidental threats to breathing (2.1%) n=584
Ischaemic heart disease (1.6%) n=445Cervix (1.9%) n=517
Nephritis/nephrosis (2.6%) n=713Cerebrovascular disease (2.5%) n=700
Meningitis/encephalitis (3.0%) n=841Diarrhoeal diseases (4.5%) n=1 228
Lower respiratory infections (6.9%) n=1 893
Tuberculosis (25.6%) n=7 062HIV/AIDS (24.8%) n=6 853
Percentage ofdeaths by broad
causes andsingle leading
causes
BroadcauseInjury
NCD
HIV and TB
Comm_mat_peri_nut
Prov, DistrictKZN, eThekwini: ETH
Show history
Percentages are shownaccording to all the deaths
within the age/gendercategory of each box,
although only the leading10 causes are displayed.
548
Section B: National and District Profiles
548
Section B: Profile KwaZulu-Natal Province
Burden of disease profile
For the percentage of deaths by broad cause, deaths are classified into four groups namely: (i) injuries; (ii) non-communicable diseases; (iii) HIV and TB; and (iv) communicable diseases together with maternal perinatal and nutritional conditions. Data are given by gender and age group for the period 2010–2015. The second part of the graph shows the 10 leading single causes of death within each age group (both genders) for 2010–2015 combined.
Percentage of deaths by broad cause and leading causes 2010–2015
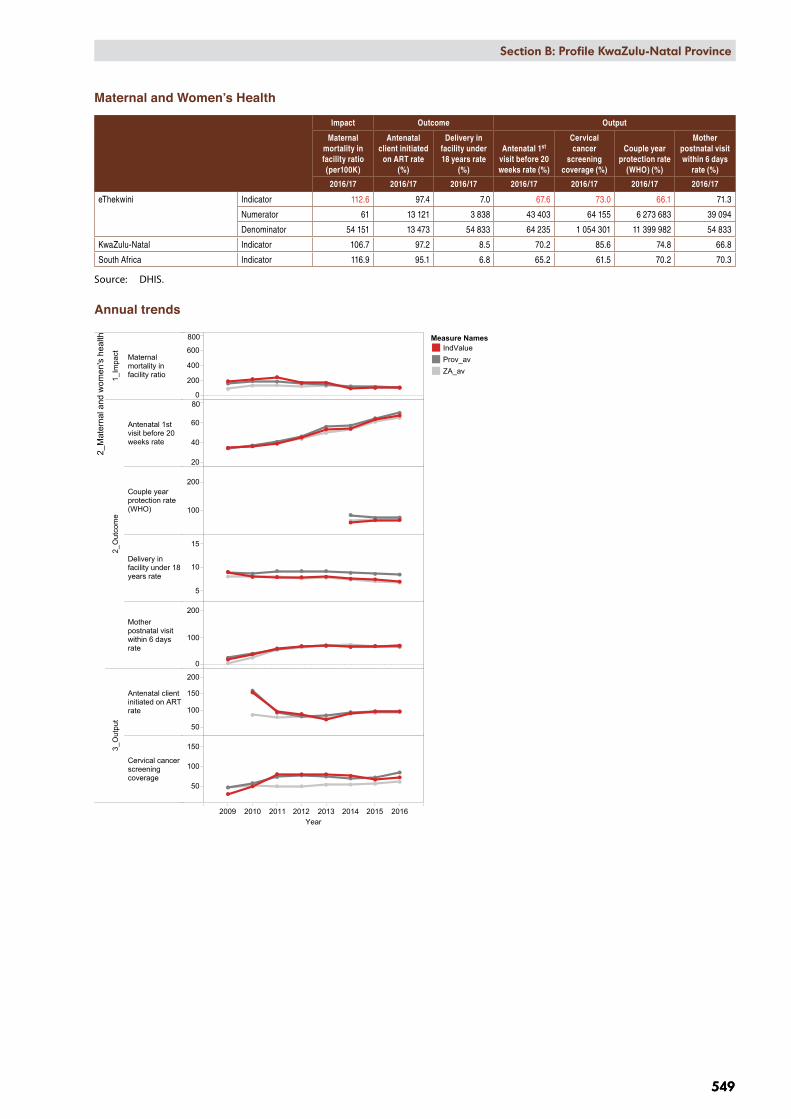
2009 2010 2011 2012 2013 2014 2015 2016Year
2_M
ater
nal a
nd w
omen
's h
ealth
1_Im
pact Maternal
mortality infacility ratio
2_O
utco
me
Antenatal 1stvisit before 20weeks rate
Couple yearprotection rate(WHO)
Delivery infacility under 18years rate
Motherpostnatal visitwithin 6 daysrate
3_O
utpu
t
Antenatal clientinitiated on ARTrate
Cervical cancerscreeningcoverage
0
200
400
600
800
20
40
60
80
100
200
5
10
15
0
100
200
50
100
150
200
50
100
150
KZN, ETH, eThekwini Metropolitan Municipality, SEQ 5 (least deprived)
Measure NamesIndValueProv_avZA_av
Section B: National and District Profiles
549
Section B: Profile KwaZulu-Natal Province
549
Maternal and Women’s Health
Impact Outcome Output
Maternal mortality in facility ratio (per100K)
Antenatal client initiated
on ART rate (%)
Delivery in facility under 18 years rate
(%)
Antenatal 1st visit before 20 weeks rate (%)
Cervical cancer
screening coverage (%)
Couple year protection rate
(WHO) (%)
Mother postnatal visit within 6 days
rate (%)
2016/17 2016/17 2016/17 2016/17 2016/17 2016/17 2016/17
eThekwini Indicator 112.6 97.4 7.0 67.6 73.0 66.1 71.3
Numerator 61 13 121 3 838 43 403 64 155 6 273 683 39 094
Denominator 54 151 13 473 54 833 64 235 1 054 301 11 399 982 54 833
KwaZulu-Natal Indicator 106.7 97.2 8.5 70.2 85.6 74.8 66.8
South Africa Indicator 116.9 95.1 6.8 65.2 61.5 70.2 70.3
Source: DHIS.
Annual trends

2009 2010 2011 2012 2013 2014 2015 2016Year
3_C
hild
and
sch
ool h
ealth
1_Im
pact
Child under 5years diarrhoeacase fatality rate
Child under 5yearspneumoniacase fatality rate
Child under 5years severeacutemalnutritioncase fatality rate
Inpatient earlyneonatal deathrate
3_O
utpu
t
Immunisationcoverage under1 year
Infantexclusivelybreastfed atDTaP-IPV-Hib-HBV 3rd doserate
Measles 2nddose coverage
School Grade 1screeningcoverage
0
50
100
0
10
20
30
0
20
40
60
0
10
20
50
100
150
20
40
60
80
50
100
150
0
50
100
KZN, ETH, eThekwini Metropolitan Municipality, SEQ 5 (least deprived)
Measure NamesIndValueProv_avZA_av
550
Section B: National and District Profiles
550
Section B: Profile KwaZulu-Natal Province
Child and School Health
Impa
ctO
utco
me
Out
put
Chi
ld u
nder
5
year
s di
arrh
oea
case
fata
lity
rate
(%)
Chi
ld u
nder
5
year
s pn
eum
onia
ca
se fa
talit
y ra
te (%
)
Chi
ld u
nder
5
year
s se
vere
acu
te
mal
nutr
ition
ca
se fa
talit
y ra
te (%
)
Inpa
tient
de
ath
unde
r 1
year
rate
(%)
Inpa
tient
de
ath
unde
r 5
year
rate
(%)
Inpa
tient
ea
rly n
eona
tal
deat
h ra
te
(per
1K)
Inpa
tient
ne
onat
al
deat
h ra
te
(per
1K)
Infa
nt P
CR
test
pos
itive
ar
ound
10
wee
ks ra
te
(%)
Imm
unis
atio
n co
vera
ge
unde
r 1 y
ear
(%)
Infa
nt
excl
usiv
ely
brea
stfe
d at
D
TaP-
IPV-
Hib
-HB
V 3rd
do
se ra
te (%
)
Mea
sles
2nd
dos
e co
vera
ge (%
)
Scho
ol G
rade
1
scre
enin
g co
vera
ge (%
)
Scho
ol G
rade
8
scre
enin
g co
vera
ge (%
)
Vita
min
A
dose
12-
59
mon
ths
cove
rage
(%)
2016
/17
2016
/17
2016
/17
2016
/17
2016
/17
2016
/17
2016
/17
2016
/17
2016
/17
2016
/17
2016
/17
2016
/17
2016
/17
2016
/17
eThe
kwin
i In
dica
tor
1.8
2.0
6.2
5.6
4.2
10.1
13.1
0.8
109.
445
.910
6.4
20.1
11.2
61.7
Num
erat
or41
5945
903
1 05
054
671
212
962
946
27 0
4163
051
12 9
296
195
302
605
Den
omin
ator
2 25
72
886
731
16 0
6424
763
54 1
5154
151
15 2
0569
0 71
458
957
711
339
772
380
666
372
5 88
9 86
4
KwaZ
ulu-
Nat
alIn
dica
tor
2.0
1.8
7.4
6.4
4.5
9.7
12.4
1.0
85.8
53.9
99.8
26.2
16.4
62.1
Sout
h Af
rica
Indi
cato
r2.
02.
08.
06.
34.
49.
912
.41.
382
.341
.696
.233
.019
.858
.0
Sour
ce:
DH
IS.
Annual trends

2009 2010 2011 2012 2013 2014 2015 2016Year
4_H
IV
4_P
roce
ss_i
nput
HIV testingcoverage(including ANC)
Male condomdistributioncoverage
Medical malecircumcisionrate
20
40
60
100
200
0
20
40
6080
KZN, ETH, eThekwini Metropolitan Municipality, SEQ 5 (least deprived)
Measure NamesIndValueProv_avZA_av
Section B: National and District Profiles
551
Section B: Profile KwaZulu-Natal Province
551
HIV
3rd 9
0-90
-90
2nd 9
0-90
-90
1st 90
-90-
90
Out
com
eO
utpu
tPr
oces
s &
inpu
t
Adu
lt w
ith v
iral
load
com
plet
ion
rate
at 1
2 m
onth
s (%
)
Chi
ld w
ith v
iral
load
com
plet
ion
rate
at 1
2 m
onth
s (%
)
Adu
lt w
ith v
iral
load
sup
pres
sed
rate
12
mon
ths
(%)
Chi
ld w
ith v
iral
load
sup
pres
sed
rate
12
mon
ths
(%)
Adu
lt pe
rcen
tage
on
AR
T af
ter 1
2 m
onth
s (%
)
Chi
ld p
erce
ntag
e on
AR
T af
ter 1
2 m
onth
s (%
)C
lient
s re
mai
ning
on
AR
T ra
te (%
)
HIV
test
pos
itive
cl
ient
15
year
s an
d ol
der r
ate
(incl
udin
g A
NC
) (%
)
HIV
test
ing
cove
rage
(in
clud
ing
AN
C)
(%)
Mal
e co
ndom
di
strib
utio
n co
vera
ge (N
o)
Med
ical
mal
e ci
rcum
cisi
on ra
te
(per
1K)
2015
2015
2015
2015
2015
2015
2016
/17
2016
/17
2016
/17
2016
/17
2016
/17
eThe
kwin
i In
dica
tor
- -
- -
- -
61.1
11.4
46.8
37.8
19.4
Num
erat
or -
- -
- -
-37
9 83
310
9 04
390
6 66
748
498
377
28 0
05
Den
omin
ator
- -
- -
- -
621
411
952
769
23 2
50 6
3015
383
517
17 3
51 4
42
KwaZ
ulu-
Nat
alIn
dica
tor
58.0
56.8
91.8
68.5
75.9
78.5
61.3
11.4
42.5
53.9
30.5
Sout
h Af
rica
Indi
cato
r -
- -
- -
-55
.08.
235
.947
.519
.0
Sour
ce:
DH
IS.
Annual trends
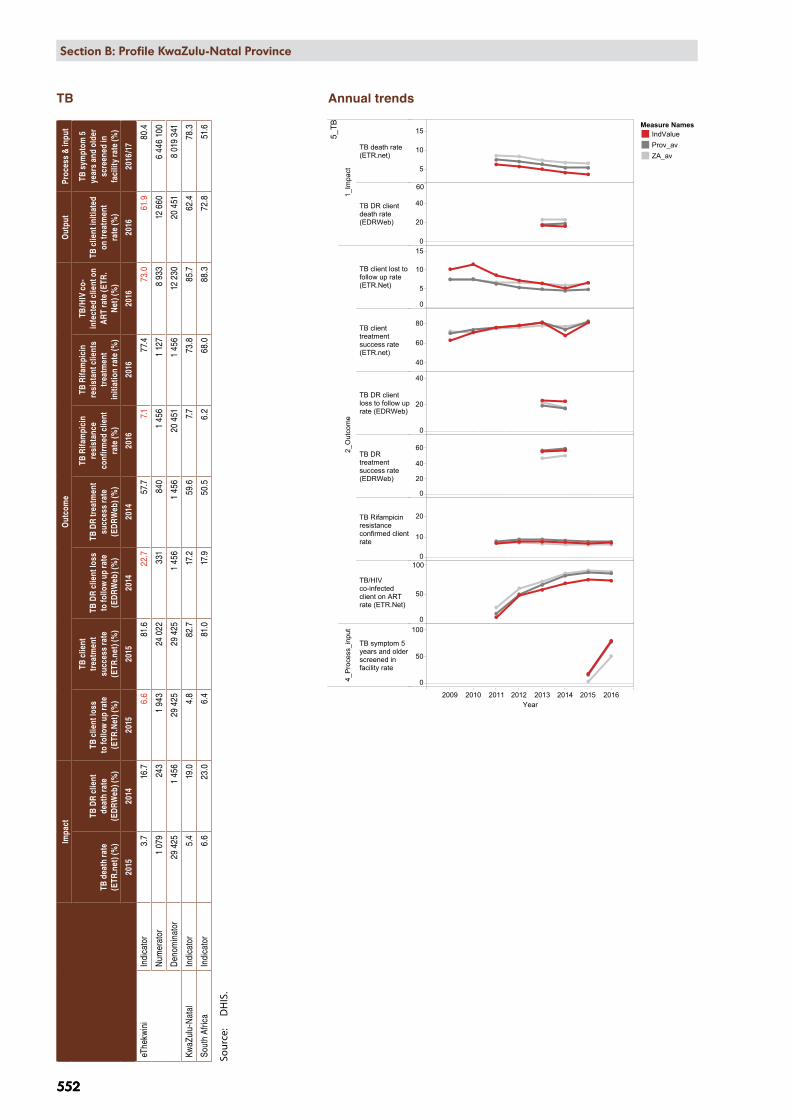
2009 2010 2011 2012 2013 2014 2015 2016Year
5_TB
1_Im
pact
TB death rate(ETR.net)
TB DR clientdeath rate(EDRWeb)
2_O
utco
me
TB client lost tofollow up rate(ETR.Net)
TB clienttreatmentsuccess rate(ETR.net)
TB DR clientloss to follow uprate (EDRWeb)
TB DRtreatmentsuccess rate(EDRWeb)
TB Rifampicinresistanceconfirmed clientrate
TB/HIVco-infectedclient on ARTrate (ETR.Net)
4_P
roce
ss_i
nput
TB symptom 5years and olderscreened infacility rate
5
10
15
0
20
40
60
0
5
10
15
40
60
80
0
20
40
0
20
40
60
0
10
20
0
50
100
0
50
100
KZN, ETH, eThekwini Metropolitan Municipality, SEQ 5 (least deprived)
Measure NamesIndValueProv_avZA_av
552
Section B: National and District Profiles
552
Section B: Profile KwaZulu-Natal Province
TB
Impa
ctO
utco
me
Out
put
Proc
ess
& in
put
TB d
eath
rate
(E
TR.n
et) (
%)
TB D
R cl
ient
de
ath
rate
(E
DR
Web
) (%
)
TB c
lient
loss
to
follo
w u
p ra
te
(ETR
.Net
) (%
)
TB c
lient
tr
eatm
ent
succ
ess
rate
(E
TR.n
et) (
%)
TB D
R cl
ient
loss
to
follo
w u
p ra
te
(ED
RW
eb) (
%)
TB D
R tr
eatm
ent
succ
ess
rate
(E
DR
Web
) (%
)
TB R
ifam
pici
n re
sist
ance
co
nfirm
ed c
lient
ra
te (%
)
TB R
ifam
pici
n re
sist
ant c
lient
s tr
eatm
ent
initi
atio
n ra
te (%
)
TB/H
IV c
o-in
fect
ed c
lient
on
AR
T ra
te (E
TR.
Net
) (%
)
TB c
lient
initi
ated
on
trea
tmen
t ra
te (%
)
TB s
ympt
om 5
ye
ars
and
olde
r sc
reen
ed in
fa
cilit
y ra
te (%
)
2015
2014
2015
2015
2014
2014
2016
2016
2016
2016
2016
/17
eThe
kwin
i In
dica
tor
3.7
16.7
6.6
81.6
22.7
57.7
7.177
.473
.061
.980
.4
Num
erat
or1
079
243
1 94
324
022
331
840
1 45
61
127
8 93
312
660
6 44
6 10
0
Den
omin
ator
29 4
251
456
29 4
2529
425
1 45
61
456
20 4
511
456
12 2
3020
451
8 01
9 34
1
KwaZ
ulu-
Nat
alIn
dica
tor
5.4
19.0
4.8
82.7
17.2
59.6
7.7
73.8
85.7
62.4
78.3
Sout
h Af
rica
Indi
cato
r6.
623
.06.
481
.017
.950
.56.
268
.088
.372
.851
.6
Sour
ce:
DH
IS.
Annual trends

2010 2011 2012 2013 2014 2015 2016 2017Year
6_NCDs
2_Outcome
Diabetesincidence
Hypertensionincidence
0
5
20
40
KZN, ETH, eThekwini Metropolitan Municipality, SEQ 5 (least deprived)
Measure NamesIndValueProv_avZA_av
Section B: National and District Profiles
553
Section B: Profile KwaZulu-Natal Province
553
Non-communicable diseases
Outcome
Diabetes incidence
(per1K)
Hypertension incidence
(per1K)
2016/17 2016/17
eThekwini Indicator 2.1 22.9
Numerator 7 489 25 965
Denominator 42 632 217 13 603 392
KwaZulu-Natal Indicator 2.8 21.7
South Africa Indicator 2.5 18.9
Source: DHIS.
Annual trends
Sub-district value in red – improvement strategies are urgently needed
Value highlighted in yellow – performance is ranked among the 10 best in the country
Value highlighted in red – performance is ranked among the 10 worst in the country