Embed Size (px)
Citation preview

Huntington Bancshares Incorporated2018 RBC Capital Markets
Financial Institutions ConferenceMarch 7, 2018
Welcome
©2018 Huntington Bancshares Incorporated. All rights reserved. (NASDAQ: HBAN)

Disclaimer
1
CAUTION REGARDING FORWARD-LOOKING STATEMENTSThis communication contains certain forward-looking statements, including, but not limited to, certain plans, expectations, goals, projections, and statements, which are not historical facts and are subject to numerous assumptions, risks, and uncertainties. Statements that do not describe historical or current facts, including statements about beliefs and expectations, are forward-looking statements. Forward-looking statements may be identified by words such as expect, anticipate, believe, intend, estimate, plan, target, goal, or similar expressions, or future or conditional verbs such as will, may, might, should, would, could, or similar variations. The forward-looking statements are intended to be subject to the safe harbor provided by Section 27A of the Securities Act of 1933, Section 21E of the Securities Exchange Act of 1934, and the Private Securities Litigation Reform Act of 1995.
While there is no assurance that any list of risks and uncertainties or risk factors is complete, below are certain factors which could cause actual results to differ materially from those contained or implied in the forward-looking statements: changes in general economic, political, or industry conditions; uncertainty in U.S. fiscal and monetary policy, including the interest rate policies of the Federal Reserve Board; volatility and disruptions in global capital and credit markets; movements in interest rates; competitive pressures on product pricing and services; success, impact, and timing of our business strategies, including market acceptance of any new products or servicesimplementing our “Fair Play” banking philosophy; the nature, extent, timing, and results of governmental actions, examinations, reviews, reforms, regulations, and interpretations, including those related to the Dodd-Frank Wall Street Reform and Consumer Protection Act and the Basel III regulatory capital reforms, as well as those involving the OCC, Federal Reserve, FDIC, and CFPB; and other factors that may affect our future results. Additional factors that could cause results to differ materially from those described above can be found in our Annual Report on Form 10-K for the year ended December 31, 2017, which is on file with the Securities and Exchange Commission (the “SEC”) and available in the “Investor Relations” section of our website, http://www.huntington.com, under the heading “Publications and Filings” and in other documents we file with the SEC.
All forward-looking statements speak only as of the date they are made and are based on information available at that time. We do not assume any obligation to update forward-looking statements to reflect circumstances or events that occur after the date the forward-looking statements were made or to reflect the occurrence of unanticipated events except as required by federal securities laws. As forward-looking statements involve significant risks and uncertainties, caution should be exercised against placing undue reliance on such statements.

Ranked #2 in deposit market share in Ohio (15%) and #6 in Michigan (7%)
Founded in 1866 in Columbus, Ohio Traditional regional bank with strategic focus on small to medium-sized businesses, consumers,
and vehicle finance
Huntington Bancshares Overview$104 billion asset Midwest financial services holding company
Huntington’s top 10 deposit MSAs represent ~78% of total deposits
Combined GDP of 8 state core footprint represents 4th largest economy in world (1)
Ranked #1 in deposit share in 14% of total footprint MSAs and top 3 in 41%
Ranked #1 in branch market share in both Ohio (13%) and Michigan (12%)
Ranked #1 SBA 7(a) lender in footprint and #2 in nation (2)
2
Ranked #4 mortgage lender in footprint (3)
$15B
$1B
$2B $3B$50B
$4B
$2B
$1B
Source: SNL Financial, FDIC deposit data as of June 30, 2017(1) Source: 2016 International Monetary Fund and US Bureau of Economic Analysis; (2) Rankings for SBA 2018 first fiscal quarter (December 31 quarter-end); (3) Ranking among Icon Advisory Group's Retail Mortgage Consortium of leading lenders YTD 9/17
Small and Medium
Businesses
Small and Medium
BusinessesConsumerConsumer
VehicleFinanceVehicleFinance
3
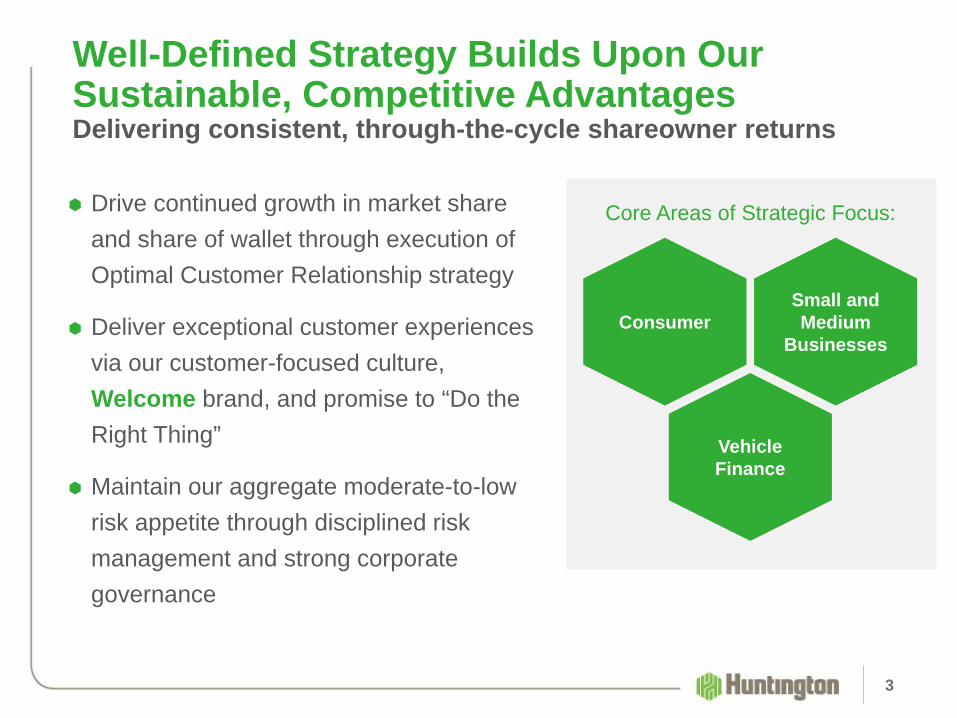
Well-Defined Strategy Builds Upon Our Sustainable, Competitive AdvantagesDelivering consistent, through-the-cycle shareowner returns
Drive continued growth in market share and share of wallet through execution of Optimal Customer Relationship strategy
Deliver exceptional customer experiences via our customer-focused culture, Welcome brand, and promise to “Do the Right Thing”
Maintain our aggregate moderate-to-low risk appetite through disciplined risk management and strong corporate governance
Core Areas of Strategic Focus:

0%
3%
6%
9%
12%
15%
0%
4%
8%
12%
16%
20%
Driving Toward a Best-in-Class Return ProfileActions taken since 2009 accelerated performance
4
Focused theBusiness Model
Aggregate Moderate-to-Low
Risk Appetite
Invested in the Franchise
(1) See reconciliation on slide 17; Peer data on a core basis, Source: SNL Financial and company reports
Built the Brand
Disciplined Execution
Strong Management / Shareowner Alignment
Peer Median: 8.9%
Peer Median: 11.2%
GAAP 15.7%Core 15.4%
HBAN GAAP HBAN Core (Non-GAAP)
HBAN GAAP HBAN Core (Non-GAAP)
2017 Core ROTCE vs. Peers (1)
GAAP 11.6%Core 11.4%
2017 Core ROCE vs. Peers (1)

Net Interest Margin (FTE)Managing NIM with disciplined loan and deposit pricing
5
3.41% 3.38%3.45% 3.42% 3.37%
3.44% 3.41%3.52%
3.60%3.70% 3.75% 3.78% 3.83%
0.32% 0.32% 0.36% 0.39% 0.41% 0.46% 0.50% 0.49% 0.48% 0.54%0.61%
0.68% 0.73%
3.18% 3.15% 3.20% 3.16%3.09% 3.11% 3.06%
3.18% 3.25%3.30% 3.31% 3.29% 3.30%
0.23% 0.22% 0.22%
0.22% 0.22% 0.22% 0.20% 0.18% 0.18% 0.19% 0.21% 0.22% 0.22%
3.06% 3.07%3.14% 3.16% 3.18% 3.20%
0.07% 0.07% 0.07% 0.08% 0.08% 0.09% 0.09% 0.09% 0.09% 0.11% 0.15% 0.20% 0.24%
1.50%
2.00%
2.50%
3.00%
3.50%
4.00%
4Q14 1Q15 2Q15 3Q15 4Q15 1Q16 2Q16 3Q16 4Q16 1Q17 2Q17 3Q17 4Q17
Earning Asset Yield Cost of Interest Bearing LiabilitiesNet Interest Margin Cost of Consumer Core DepositsCore NIM (1) Cost of Commercial Core Deposits
0.00%
0.75%
≈
(1) Net of purchase accounting adjustments; see reconciliation on slide 18

Cycle-to-Date Cumulative Deposit BetaDeposit beta remains in-line with peers with an expected through the cycle beta of approximately 50%
6
10% 9%
4%
0%3%
6%
10%
13% 13%
-4%
3%5%
8%6%
6%8%
11%12%
14%
21%23%
20%
14%
17%
24% 23%
-9% -8%
-4%-5%
0%1% 2%
4%
4Q15 1Q16 2Q16 3Q16 4Q16 1Q17 2Q17 3Q17 4Q17
HBAN Peer Mean Peer* High Peer* Low
*CIT and MTB are excluded from the High – Low range as material outliers
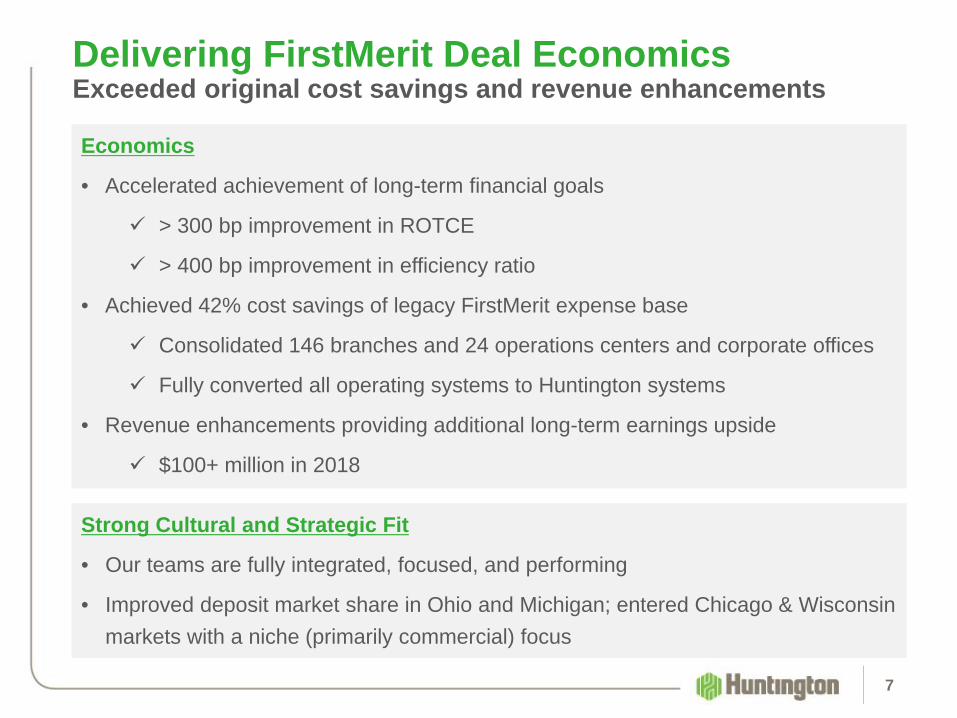
Delivering FirstMerit Deal EconomicsExceeded original cost savings and revenue enhancements
7
Strong Cultural and Strategic Fit
• Our teams are fully integrated, focused, and performing
• Improved deposit market share in Ohio and Michigan; entered Chicago & Wisconsin markets with a niche (primarily commercial) focus
Economics
• Accelerated achievement of long-term financial goals
> 300 bp improvement in ROTCE
> 400 bp improvement in efficiency ratio
• Achieved 42% cost savings of legacy FirstMerit expense base
Consolidated 146 branches and 24 operations centers and corporate offices
Fully converted all operating systems to Huntington systems
• Revenue enhancements providing additional long-term earnings upside
$100+ million in 2018

Achieved All Long-Term Financial Goals in 4Q17
8
Long-TermFinancial
Goal GAAPAdjusted
(Non-GAAP)1 GAAPAdjusted
(Non-GAAP)1
Revenue (FTE) Growth (Y/Y) 4% - 6% +4% +4% +22% +22%
Expense Growth (Y/Y)Positive
OperatingLeverage
(7%) 1% +13% +18%
Efficiency Ratio 56% - 59% 55% 55% 61% 57%
NCO 35 - 55 bp 24 bp 24 bp 23 bp 23 bp
ROTCE 13% - 15% 23% 16% 16% 15%
(1) Reconciliation on slides 17, 19, and 20
4Q17 FY17

9
Long-TermFinancial
Goal
Tax Reform Adjusted
Long-TermFinancial
Goal2018
Target
Revenue (FTE) Growth (Y/Y) 4% - 6% 4% - 6%
Expense Growth (Y/Y)Positive
OperatingLeverage
PositiveOperatingLeverage
Efficiency Ratio 56% - 59% 56% - 59%
NCO 35 - 55 bp 35 - 55 bp
ROTCE 13% - 15% 15% - 17%
Long-Term Financial Goals – Tax Reform UpdateThe long-term financial goals set in 2014 were restated for tax reform

Top-Line Revenue Growth
Top-Line Revenue Growth
Business Model
Evolution &
Disruption
Business Model
Evolution &
Disruption
10
Strategic Planning ProcessInitiated the strategic planning process in 1Q18 which will yield new long-term goals for the company
Initial areas of focus for the 2018 Strategic
Planning Process:
Capital Optimization
2014 Strategic Plan Outcomes:
✔ Improved scale
✔ Accelerated achievement of long-term financial goals
✔ Best in class return profile
2009 Strategic Plan Outcomes:
✔ Disciplined risk management
✔ Fair Play strategy
✔ Huntington brand

Pro Forma* 4Q17 3Q17 2Q17 1Q17 4Q16
Tang. common equity / tang. assets 7.65% 7.34% 7.42% 7.41% 7.28% 7.16%
Common equity Tier 1 (CET1) 10.46 10.01 9.94 9.88 9.74 9.56
Tier 1 leverage 9.58 9.09 8.96 8.98 8.76 8.70
Tier 1 risk-based capital 11.95 11.34 11.30 11.24 11.11 10.92
Total risk-based capital 14.00 13.39 13.39 13.33 13.26 13.05
Total risk-weighted assets ($B) $80.3 $80.3 $78.6 $78.4 $77.6 $78.3
Double leverage(2) 105% 109% 108% 108% 107% 108%
Capital(1)
4Q17 pro forma capital ratios adjusted for impact of the Series A preferred conversion and Series E preferred issuance in February
(1) End of period(2) (Parent company investments in subsidiaries + goodwill) / equity 11*Note: Reconciliation on slide 21

2.41%2.27%
8.0%
8.0%
4.5%
4.5%
6.0%
1.7%
6.0%
1.5%
14.0%
9.7%
10.5%
6.0%
Minimum Buffer
Common Equity Tier 1 (CET1) Ratio
2017 CCAR minimum (4)
4Q17 Pro Forma (5)
Total Risk-Based Capital Ratio
2017 CCAR minimum (4)
4Q17 Pro Forma (5)
Positioned for Strong Relative Performance Through-the-Cycle
12
50%50% Loans (3)
$69 B 52%48%Core
Deposits (3)
$74 B
Commercial Consumer
Well-Diversified Balance SheetStrengthened Pretax Pre-Provision Net Revenue (1)
Disciplined Management of Credit Risk
(1) Non-GAAP financial metric; see Appendix slide 22; (2) Annualized; (3) 4Q17 average balances; (4) projected minimum in the Federal Reserve Severely Adverse Scenario; (5) Reconciliation on slide 21
$1.0 $1.1$1.4
$1.8 $1.8 $1.9
2014 2015 2016 2017 4Q16 4Q17
Cumulative Losses as a % of Average Total Loans in Dodd-Frank Act Stress Test (DFAST)
Supervisory Severely Adverse Scenario
20154.2%
#1
20164.8%
#4
20174.6%
#4
Note: Ranking among 19 traditional commercial banks
$ billions
Strong Capital Base and Capital Management
(2)
(2)
(2)
(2)% of RWA
1.86% 1.86% 1.75% 2.26%
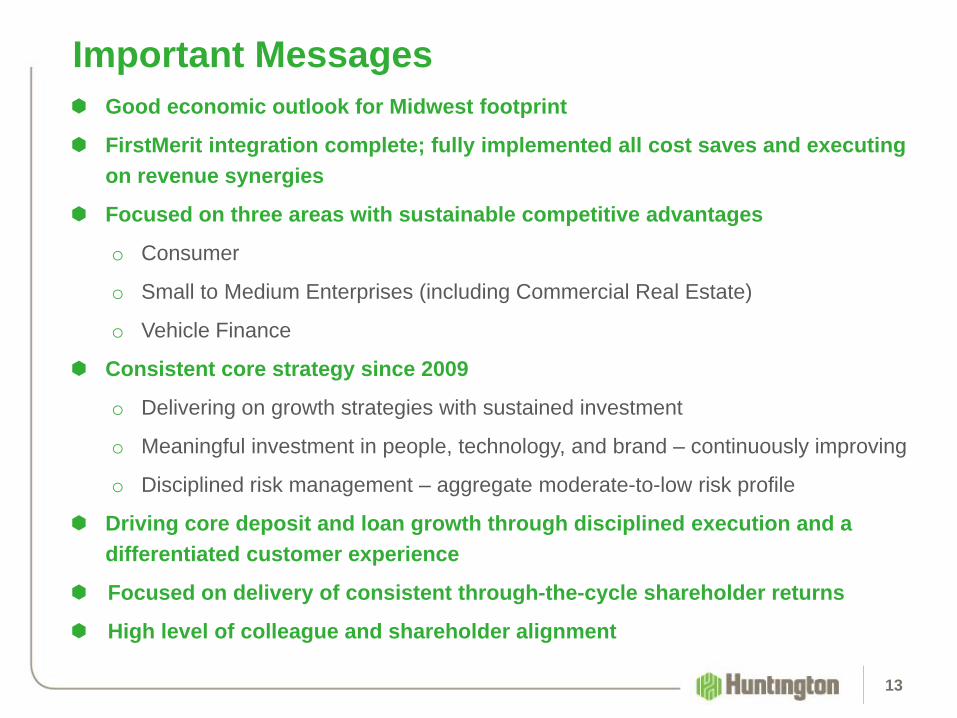
Good economic outlook for Midwest footprint
FirstMerit integration complete; fully implemented all cost saves and executing on revenue synergies
Focused on three areas with sustainable competitive advantages
o Consumer
o Small to Medium Enterprises (including Commercial Real Estate)
o Vehicle Finance
Consistent core strategy since 2009
o Delivering on growth strategies with sustained investment
o Meaningful investment in people, technology, and brand – continuously improving
o Disciplined risk management – aggregate moderate-to-low risk profile
Driving core deposit and loan growth through disciplined execution and a differentiated customer experience
Focused on delivery of consistent through-the-cycle shareholder returns
High level of colleague and shareholder alignment
Important Messages
13

Appendix
14

2018 Expectations
15
Avg Loan Balances 4% - 6% growth (assumes $500 MM Auto securitization in 3Q18)
Avg Deposit Balances 3% - 5% growth
Revenue 4% - 6% growth (assumes no rate hikes in 2018)
Net Interest Margin GAAP NIM flat; Core NIM up modestly (new money yields above back book yields across all loan categories)
Noninterest Expense 2% - 4% decrease
Efficiency Ratio 55% - 57%
Effective Tax Rate 16% - 17%
Net charge-offs Remain below long-term expectations of 35 bp – 55 bp
Note: All metrics presented on a GAAP basis assuming an unchanged rate environment
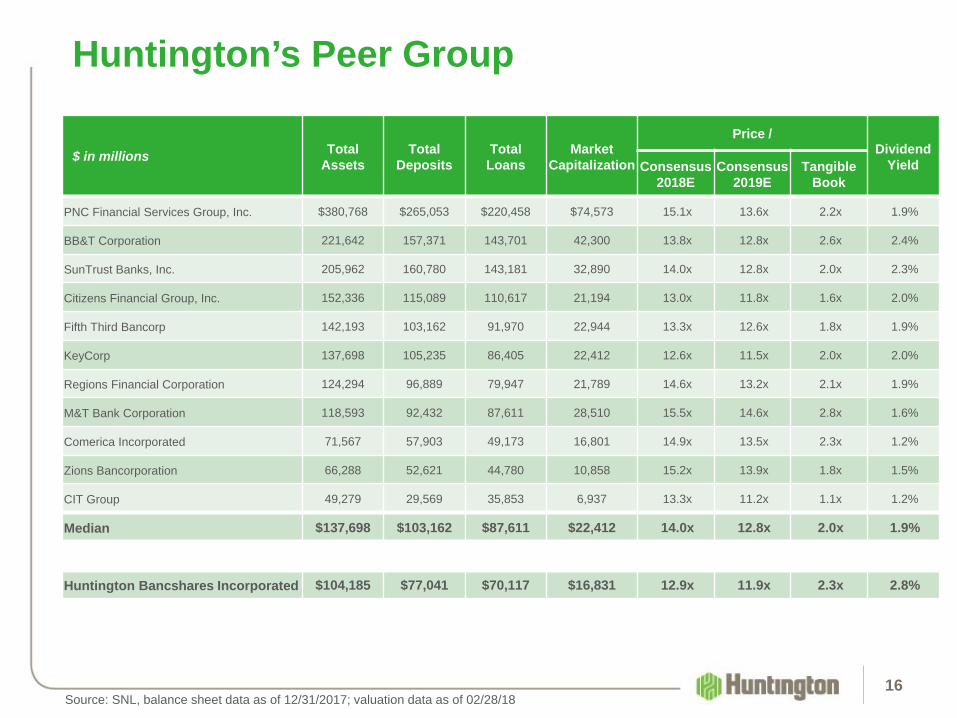
Huntington’s Peer Group
16
$ in millions TotalAssets
TotalDeposits
Total Loans
Market Capitalization
Price /Dividend
YieldConsensus2018E
Consensus2019E
Tangible Book
PNC Financial Services Group, Inc. $380,768 $265,053 $220,458 $74,573 15.1x 13.6x 2.2x 1.9%
BB&T Corporation 221,642 157,371 143,701 42,300 13.8x 12.8x 2.6x 2.4%
SunTrust Banks, Inc. 205,962 160,780 143,181 32,890 14.0x 12.8x 2.0x 2.3%
Citizens Financial Group, Inc. 152,336 115,089 110,617 21,194 13.0x 11.8x 1.6x 2.0%
Fifth Third Bancorp 142,193 103,162 91,970 22,944 13.3x 12.6x 1.8x 1.9%
KeyCorp 137,698 105,235 86,405 22,412 12.6x 11.5x 2.0x 2.0%
Regions Financial Corporation 124,294 96,889 79,947 21,789 14.6x 13.2x 2.1x 1.9%
M&T Bank Corporation 118,593 92,432 87,611 28,510 15.5x 14.6x 2.8x 1.6%
Comerica Incorporated 71,567 57,903 49,173 16,801 14.9x 13.5x 2.3x 1.2%
Zions Bancorporation 66,288 52,621 44,780 10,858 15.2x 13.9x 1.8x 1.5%
CIT Group 49,279 29,569 35,853 6,937 13.3x 11.2x 1.1x 1.2%
Median $137,698 $103,162 $87,611 $22,412 14.0x 12.8x 2.0x 1.9%
Huntington Bancshares Incorporated $104,185 $77,041 $70,117 $16,831 12.9x 11.9x 2.3x 2.8%
Source: SNL, balance sheet data as of 12/31/2017; valuation data as of 02/28/18
17
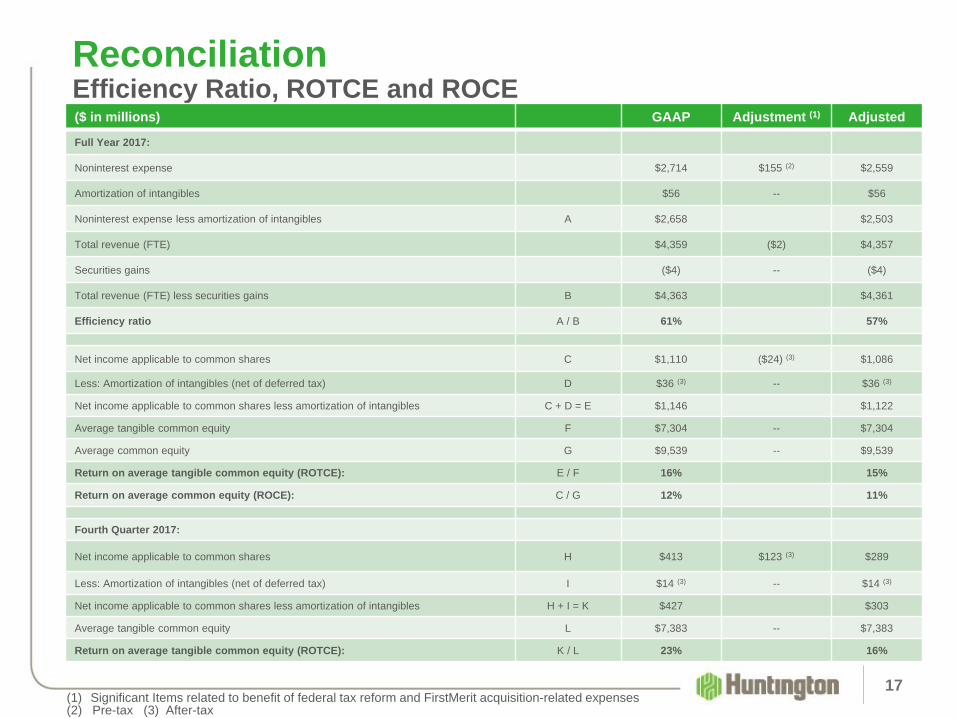
ReconciliationEfficiency Ratio, ROTCE and ROCE($ in millions) GAAP Adjustment (1) Adjusted
Full Year 2017:
Noninterest expense $2,714 $155 (2) $2,559
Amortization of intangibles $56 -- $56
Noninterest expense less amortization of intangibles A $2,658 $2,503
Total revenue (FTE) $4,359 ($2) $4,357
Securities gains ($4) -- ($4)
Total revenue (FTE) less securities gains B $4,363 $4,361
Efficiency ratio A / B 61% 57%
Net income applicable to common shares C $1,110 ($24) (3) $1,086
Less: Amortization of intangibles (net of deferred tax) D $36 (3) -- $36 (3)
Net income applicable to common shares less amortization of intangibles C + D = E $1,146 $1,122
Average tangible common equity F $7,304 -- $7,304
Average common equity G $9,539 -- $9,539
Return on average tangible common equity (ROTCE): E / F 16% 15%
Return on average common equity (ROCE): C / G 12% 11%
Fourth Quarter 2017:
Net income applicable to common shares H $413 $123 (3) $289
Less: Amortization of intangibles (net of deferred tax) I $14 (3) -- $14 (3)
Net income applicable to common shares less amortization of intangibles H + I = K $427 $303
Average tangible common equity L $7,383 -- $7,383
Return on average tangible common equity (ROTCE): K / L 23% 16%
(2) Pre-tax (3) After-tax(1) Significant Items related to benefit of federal tax reform and FirstMerit acquisition-related expenses

18
ReconciliationNet Interest Margin
($ in millions) 4Q17 3Q17 2Q17 1Q17 4Q16 3Q16
Net Interest Income (FTE) – reported $782 $771 $757 $742 $748 $636
Purchase accounting impact (performing loans) 20 22 27 30 35 20
Purchase accounting impact (credit impaired loans) 4 4 5 5 4 1
Total Loan Purchase Accounting Impact 24 26 32 34 39 21
Debt 1 1 1 1 0 0
Deposit accretion 0 0 1 2 3 2
Total Net Purchase Accounting Adjustments $24 $27 $34 $37 $42 $22
Net Interest Income (FTE) - core $758 $744 $723 $705 $705 $614
Average Earning Assets ($B) $93.9 $92.8 $91.7 $91.1 $91.5 $79.7
Net Interest Margin - reported 3.30% 3.29% 3.31% 3.30% 3.25% 3.18%
Net Interest Margin - core 3.20% 3.18% 3.16% 3.14% 3.07% 3.06%
19
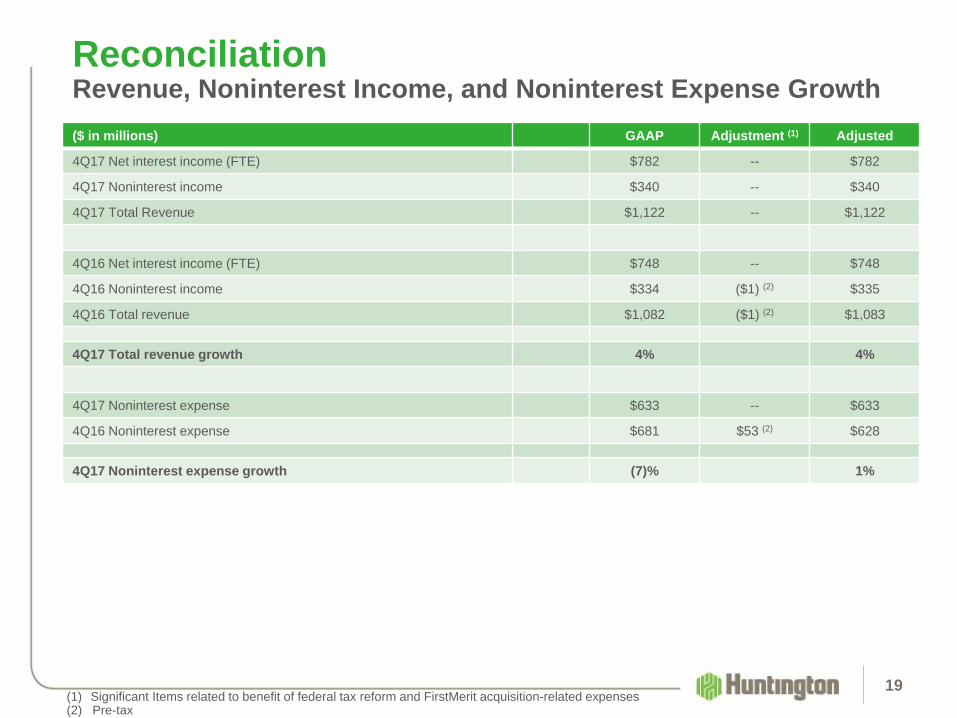
ReconciliationRevenue, Noninterest Income, and Noninterest Expense Growth($ in millions) GAAP Adjustment (1) Adjusted
4Q17 Net interest income (FTE) $782 -- $782
4Q17 Noninterest income $340 -- $340
4Q17 Total Revenue $1,122 -- $1,122
4Q16 Net interest income (FTE) $748 -- $748
4Q16 Noninterest income $334 ($1) (2) $335
4Q16 Total revenue $1,082 ($1) (2) $1,083
4Q17 Total revenue growth 4% 4%
4Q17 Noninterest expense $633 -- $633
4Q16 Noninterest expense $681 $53 (2) $628
4Q17 Noninterest expense growth (7)% 1%
(1) Significant Items related to benefit of federal tax reform and FirstMerit acquisition-related expenses(2) Pre-tax
20
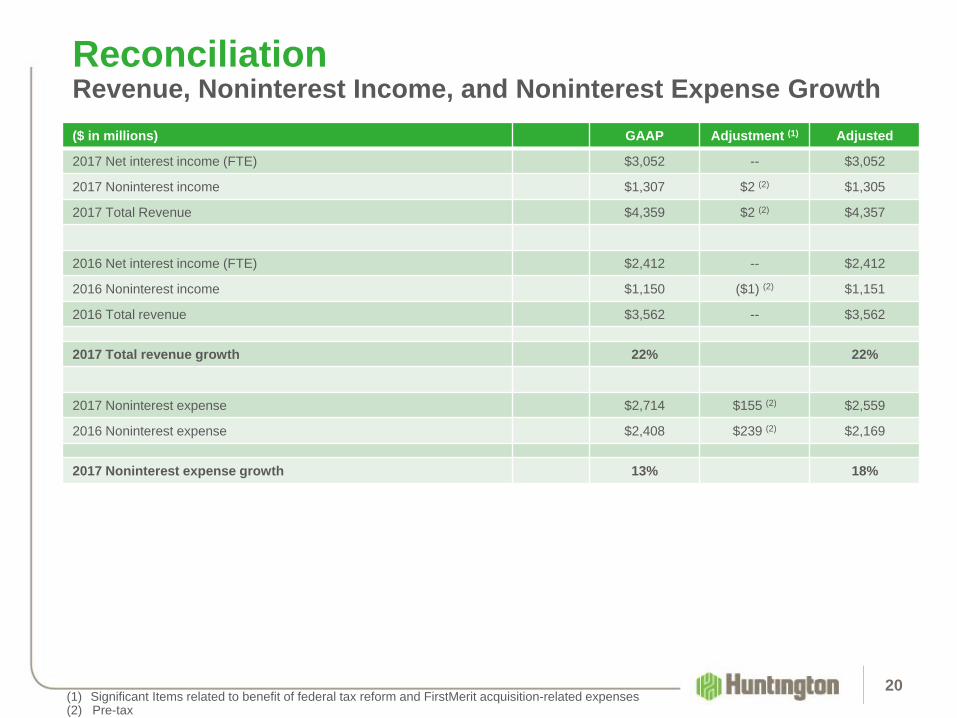
ReconciliationRevenue, Noninterest Income, and Noninterest Expense Growth($ in millions) GAAP Adjustment (1) Adjusted
2017 Net interest income (FTE) $3,052 -- $3,052
2017 Noninterest income $1,307 $2 (2) $1,305
2017 Total Revenue $4,359 $2 (2) $4,357
2016 Net interest income (FTE) $2,412 -- $2,412
2016 Noninterest income $1,150 ($1) (2) $1,151
2016 Total revenue $3,562 -- $3,562
2017 Total revenue growth 22% 22%
2017 Noninterest expense $2,714 $155 (2) $2,559
2016 Noninterest expense $2,408 $239 (2) $2,169
2017 Noninterest expense growth 13% 18%
(1) Significant Items related to benefit of federal tax reform and FirstMerit acquisition-related expenses(2) Pre-tax

21
ReconciliationCapital ratios
($ in millions) GAAP Preferred Equity Conversion
Preferred Equity Issuance Adjusted
Total tangible common equity (TCE) A $7,477 $362 -- $7,839
Total tangible assets B $101,919 -- $493 $102,411
TCE Ratio A / B 7.34% 0.35% -0.04% 7.65%
CET 1 capital C $8,041 $362 -- $8,403
Tier 1 capital D $9,110 -- $493 $9,604
Total risk-based capital E $10,757 -- $493 $11,250
Total investments in subsidiaries plus goodwill F $11,819 -- -- $11,819
Risk-weighted assets (RWA) G $80,340 -- -- $80,340
Total assets for leverage ratio(1) H $100,267 -- -- $100,267
Total capital I $10,814 -- $493 $11,307
CET 1 ratio C / G 10.01% 0.45% -- 10.46%
Tier 1 leverage ratio D / H 9.09% -- 0.49% 9.58%
Tier 1 risk-based capital ratio D / G 11.34% -- 0.61% 11.95%
Total risk-based capital ratio E / G 13.39% -- 0.61% 14.00%
Double leverage ratio F / I 109% -- 5% 104%
(1) Total average assets net of goodwill, certain other intangible assets, and certain other deductions
22
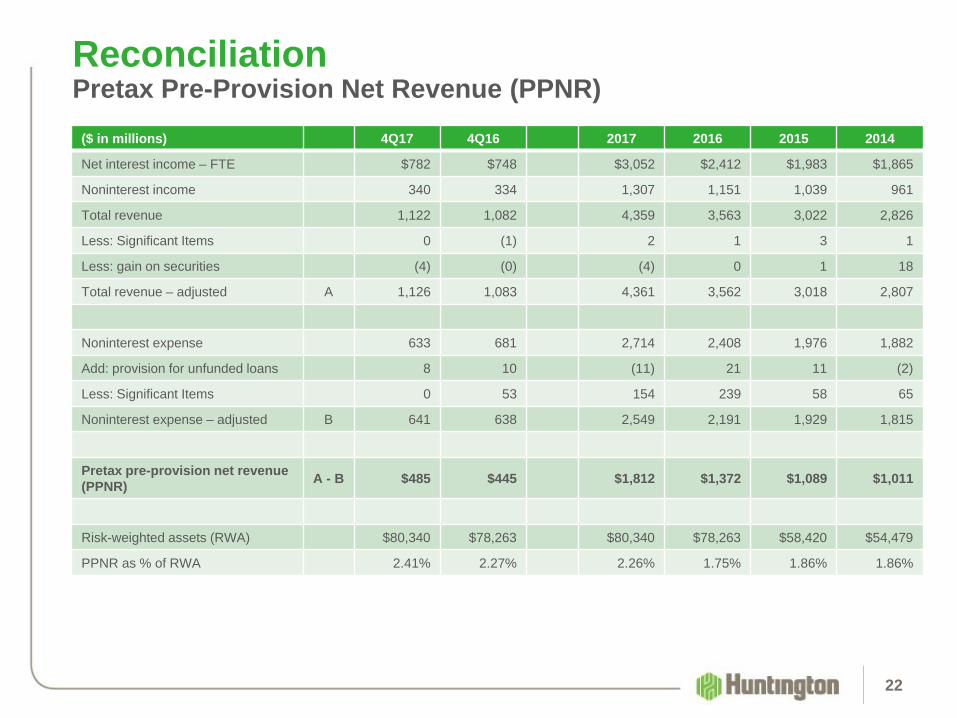
ReconciliationPretax Pre-Provision Net Revenue (PPNR)
($ in millions) 4Q17 4Q16 2017 2016 2015 2014
Net interest income – FTE $782 $748 $3,052 $2,412 $1,983 $1,865
Noninterest income 340 334 1,307 1,151 1,039 961
Total revenue 1,122 1,082 4,359 3,563 3,022 2,826
Less: Significant Items 0 (1) 2 1 3 1
Less: gain on securities (4) (0) (4) 0 1 18
Total revenue – adjusted A 1,126 1,083 4,361 3,562 3,018 2,807
Noninterest expense 633 681 2,714 2,408 1,976 1,882
Add: provision for unfunded loans 8 10 (11) 21 11 (2)
Less: Significant Items 0 53 154 239 58 65
Noninterest expense – adjusted B 641 638 2,549 2,191 1,929 1,815
Pretax pre-provision net revenue (PPNR) A - B $485 $445 $1,812 $1,372 $1,089 $1,011
Risk-weighted assets (RWA) $80,340 $78,263 $80,340 $78,263 $58,420 $54,479
PPNR as % of RWA 2.41% 2.27% 2.26% 1.75% 1.86% 1.86%
Use of Non-GAAP Financial MeasuresThis document contains GAAP financial measures and non-GAAP financial measures where management believes it to be helpful in understanding Huntington’s results of operations or financial position. Where non-GAAP financial measures are used, the comparable GAAP financial measure, as well as the reconciliation to the comparable GAAP financial measure, can be found in this document, the earnings press release, or the Form 8-K related to this document, all of which can be found on Huntington’s website at www.huntington-ir.com.
Annualized DataCertain returns, yields, performance ratios, or quarterly growth rates are presented on an “annualized” basis. This is done for analytical and decision-making purposes to better discern underlying performance trends when compared to full-year or year-over-year amounts. For example, loan and deposit growth rates, as well as net charge-off percentages, are most often expressed in terms of an annual rate like 8%. As such, a 2% growth rate for a quarter would represent an annualized 8% growth rate.
Fully-Taxable Equivalent Interest Income and Net Interest MarginIncome from tax-exempt earning assets is increased by an amount equivalent to the taxes that would have been paid if this income had been taxable at statutory rates. This adjustment puts all earning assets, most notably tax-exempt municipal securities and certain lease assets, on a common basis that facilitates comparison of results to results of competitors.
Earnings per Share Equivalent DataSignificant income or expense items may be expressed on a per common share basis. This is done for analytical and decision-making purposes to better discern underlying trends in total corporate earnings per share performance excluding the impact of such items. Investors may also find this information helpful in their evaluation of the company’s financial performance against published earnings per share mean estimate amounts, which typically exclude the impact of Significant Items. Earnings per share equivalents are usually calculated by applying an effective tax rate to a pre-tax amount to derive an after-tax amount, which is divided by the average shares outstanding during the respective reporting period. Occasionally, when the item involves special tax treatment, the after-tax amount is disclosed separately, with this then being the amount used to calculate the earnings per share equivalent.
RoundingPlease note that columns of data in this document may not add due to rounding.
Basis of Presentation
23
Do we consolidate this and next slide?
Significant Items
From time to time, revenue, expenses, or taxes are impacted by items judged by Management to be outside of ordinary banking activities and/or by items that, while they may be associated with ordinary banking activities, are so unusually large that their outsized impact is believed by Management at that time to be infrequent or short term in nature. We refer to such items as “Significant Items”. Most often, these Significant Items result from factors originating outside the company – e.g., regulatory actions/assessments, windfall gains, changes in accounting principles, one-time tax assessments/refunds, litigation actions, etc. In other cases they may result from Management decisions associated with significant corporate actions out of the ordinary course of business – e.g., merger/restructuring charges, recapitalization actions, goodwill impairment, etc.
Even though certain revenue and expense items are naturally subject to more volatility than others due to changes in market and economic environment conditions, as a general rule volatility alone does not define a Significant Item. For example, changes in the provision for credit losses, gains/losses from investment activities, asset valuation write-downs, etc., reflect ordinary banking activities and are, therefore, typically excluded from consideration as a Significant Item.
Management believes the disclosure of “Significant Items”, when appropriate, aids analysts/investors in better understanding corporate performance and trends so that they can ascertain which of such items, if any, they may wish to include/exclude from their analysis of the company’s performance - i.e., within the context of determining how that performance differed from their expectations, as well as how, if at all, to adjust their estimates of future performance accordingly. To this end, Management has adopted a practice of listing “Significant Items” in its external disclosure documents (e.g., earnings press releases, quarterly performance discussions, investor presentations, Forms 10-Q and 10-K).
“Significant Items” for any particular period are not intended to be a complete list of items that may materially impact current or future period performance. A number of items could materially impact these periods, including those described in Huntington’s 2017 Annual Report on Form 10-K and other factors described from time to time in Huntington’s other filings with the Securities and Exchange Commission.
Basis of Presentation
24

Welcome
©2018 Huntington Bancshares Incorporated. All rights reserved. (NASDAQ: HBAN)
Mark A. MuthDirector of Investor Relations
Office: 614.480.4720E-mail: [email protected]
For additional information, please visit:
http://www.huntington.com