Embed Size (px)
Citation preview
18. PROFILE ON THE PRODUCTION OF PEANUT
BUTTER
18-1
TABLE OF CONTENTS
PAGE
I. SUMMARY 18-2
II. PRODUCT DESCRIPTION & APPLICATION 18-3
III. MARKET STUDY AND PLANT CAPACITY 18-3
A. MARKET STUDY 18-3
B. PLANT CAPACITY & PRODUCTION PROGRAM 18-6
IV. MATERIALS AND INPUTS 18-7
A. RAW & AUXILIARY MATERIALS 18-7
B. UTILITIES 18-8
V. TECHNOLOGY & ENGINEERING 18-9
A. TECHNOLOGY 18-9
B. ENGINEERING 18-9
VI. HUMAN RESOURCE & TRAINING REQUIREMENT 18-13
A. HUMAN RESOURCE REQUIREMENT 18-13
B. TRAINING REQUIREMENT 18-14
VII. FINANCIAL ANLYSIS 18-15
A. TOTAL INITIAL INVESTMENT COST 18-15
B. PRODUCTION COST 18-16
C. FINANCIAL EVALUATION 18-17
D. ECONOMIC & SOCIAL BENEFITS 18-19
18-2
I. SUMMARY
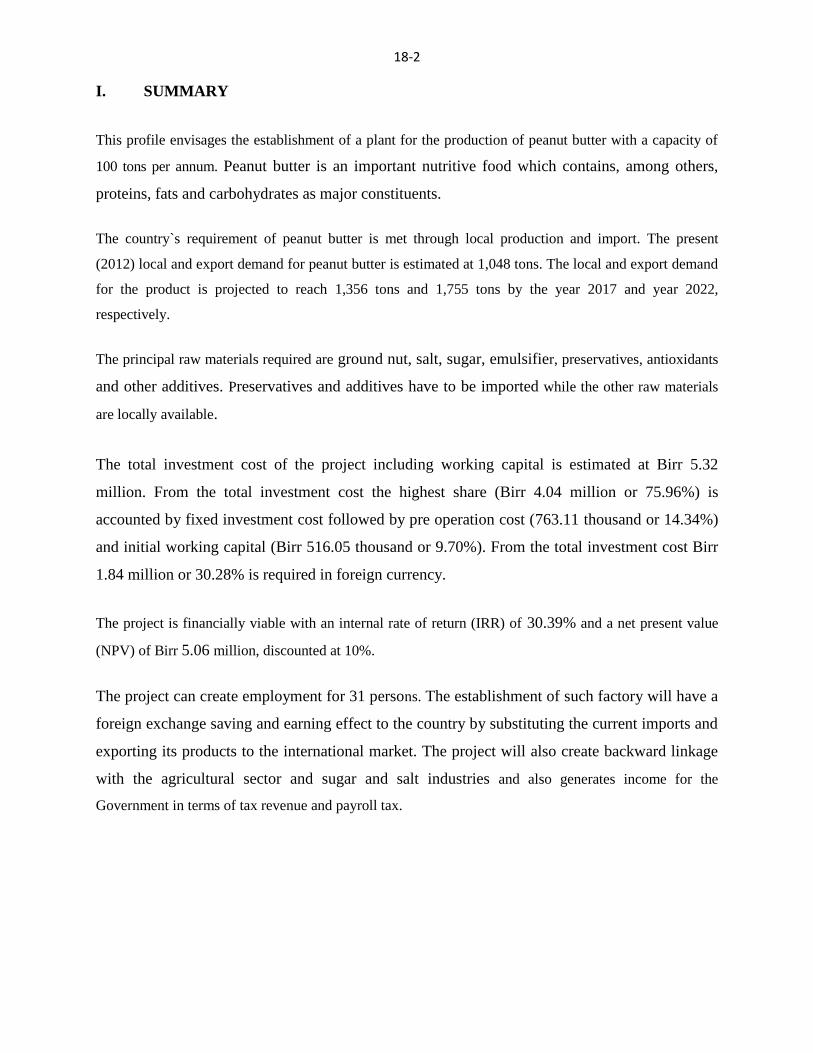
This profile envisages the establishment of a plant for the production of peanut butter with a capacity of
100 tons per annum. Peanut butter is an important nutritive food which contains, among others,
proteins, fats and carbohydrates as major constituents.
The country`s requirement of peanut butter is met through local production and import. The present
(2012) local and export demand for peanut butter is estimated at 1,048 tons. The local and export demand
for the product is projected to reach 1,356 tons and 1,755 tons by the year 2017 and year 2022,
respectively.
The principal raw materials required are ground nut, salt, sugar, emulsifier, preservatives, antioxidants
and other additives. Preservatives and additives have to be imported while the other raw materials
are locally available.
The total investment cost of the project including working capital is estimated at Birr 5.32
million. From the total investment cost the highest share (Birr 4.04 million or 75.96%) is
accounted by fixed investment cost followed by pre operation cost (763.11 thousand or 14.34%)
and initial working capital (Birr 516.05 thousand or 9.70%). From the total investment cost Birr
1.84 million or 30.28% is required in foreign currency.
The project is financially viable with an internal rate of return (IRR) of 30.39% and a net present value
(NPV) of Birr 5.06 million, discounted at 10%.
The project can create employment for 31 persons. The establishment of such factory will have a
foreign exchange saving and earning effect to the country by substituting the current imports and
exporting its products to the international market. The project will also create backward linkage
with the agricultural sector and sugar and salt industries and also generates income for the
Government in terms of tax revenue and payroll tax.

18-3
II. PRODUCT DESCRIPTION AND APPLICATION
Peanut products comprise peanut butter, oil and others as well. However, the most important on
today’s market is the peanut butter. It is yellowish- brown color product made from ground nuts
or peanuts.
Peanut butter is an important nutritive food which contains, among others, proteins, fats and
carbohydrates as major constituents. It is easily spreadable and has a flavor of fresh roasted
peanut and good taste. It is most used in a harried meal style for the purpose of having a balanced
diet.. This product is also used for making sandwiches, candy and bakery products as well.
III. MARKET STUDY AND PLANT CAPACITY
A. MARKET STUDY
1. Past Supply and Present Demand
The country`s requirement of industrially processed butter is mainly met through local
production. There is also a small amount of import and export to and from Ethiopia. The
domestic production, import and export of butter for the period covering 2002--2011 is shown in
Table 3.1.
18-4
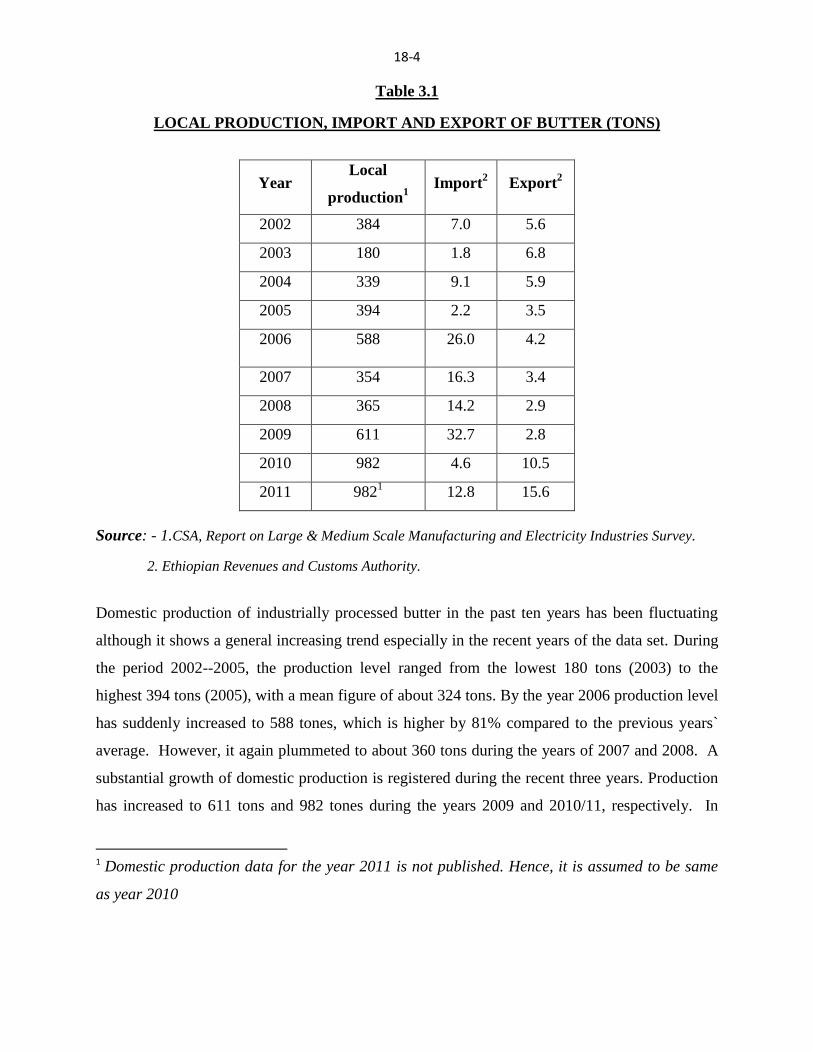
Table 3.1
LOCAL PRODUCTION, IMPORT AND EXPORT OF BUTTER (TONS)
Year Local
production1
Import2
Export2
2002 384 7.0 5.6
2003 180 1.8 6.8
2004 339 9.1 5.9
2005 394 2.2 3.5
2006 588 26.0 4.2
2007 354 16.3 3.4
2008 365 14.2 2.9
2009 611 32.7 2.8
2010 982 4.6 10.5
2011 9821 12.8 15.6
Source: - 1.CSA, Report on Large & Medium Scale Manufacturing and Electricity Industries Survey.
2. Ethiopian Revenues and Customs Authority.
Domestic production of industrially processed butter in the past ten years has been fluctuating
although it shows a general increasing trend especially in the recent years of the data set. During
the period 2002--2005, the production level ranged from the lowest 180 tons (2003) to the
highest 394 tons (2005), with a mean figure of about 324 tons. By the year 2006 production level
has suddenly increased to 588 tones, which is higher by 81% compared to the previous years`
average. However, it again plummeted to about 360 tons during the years of 2007 and 2008. A
substantial growth of domestic production is registered during the recent three years. Production
has increased to 611 tons and 982 tones during the years 2009 and 2010/11, respectively. In
1 Domestic production data for the year 2011 is not published. Hence, it is assumed to be same
as year 2010
18-5
general, domestic production of industrially processed butter was satisfying more than 98% of
the demand.
Imported quantity of butter is also characterized by fluctuations although it shows a general
increasing trend. The yearly average level of import during the period 2002--2005 was only 5
tones but it increased to annual average of about 18 tons during the period 2006--2011.
Exported quantity of butter during the period 2002--2009 was fluctuating between 3 to 7 tones,
with a yearly average of about 4.4 tones. A modest growth in export of butter is observed during
the recent two years of 2010 and 2011. The exported quantity has reached 10.5 tones and 15.6
tones by the year 2010 and year 2011, respectively.
In estimating the present demand for domestic consumption and export, the following
assumptions are utilized.
Year 2011 domestic production plus import and minus export is assumed to reflect the
effective demand for year 2011;
Annual growth of local demand for industrially processed butter is assumed to be 5%,
taking urban population growth and income rise in to account; and
Export demand is assumed to increase by 25% per annum.
Based on the above assumptions, the current effective local demand and export demand is
calculated at 1,028 tones and 20 tons, respectively.
2. Demand Projection
The local demand for industrially processed butter depends on the growth of urban population
and disposable income. Hence, the domestic consumption of industrially processed butter is
conservatively forecasted to increases by 5% per annum. For the export market a 15% growth is
applied since the base figure is at a very low level. The projected demand (local and export), the
existing production and the unsatisfied demand is presented in Table 3.2.

18-6
Table 3.2
PROJECTED DEMAND FOR BUTTER (TONS)
The local unsatisfied demand for industrially processed butter will increase from 1,079 tons in
the year 2013 to 1,378 tons and 1,674 tones by the year 2018 and 2022, respectively. On the
other hand, the export market will increase from 23 tones in the year 2013 to 81 tons by the year
2022.
3. Pricing and Distribution:
Current average retail price of peanut butter is about Birr 56 per kilogram. Allowing 30% profit
margin for distributors and retailers the recommended factory gate price is Birr 43 per kilogram.
Butter is a consumer product which is demanded by the middle and higher income group of the
urban population. Hence, to reach the end consumer the plant has to appoint distributors in
selected towns of the country. Then, the product will reach the end users through the existing
supermarkets and general merchandise shops.
B. PLANT CAPACITY AND PRODUCTION PROGRAM
1. Plant Capacity
On the basis of the forecasted demand for peanut butter in the market study and considering the
minimum economic scale of production, the envisaged project will have a production capacity of
Year Local
Demand
Export
Demand
Total
Demand
Existing
Production
Unsatisfied
Demand
2013 1,079 23 1,102 982 120
2014 1,133 26 1,159 982 177
2015 1,190 30 1,220 982 238
2016 1,250 35 1,285 982 303
2017 1,312 40 1,356 982 374
2018 1,378 46 1,424 982 442
2019 1,146 53 1,199 982 217
2020 1,519 61 1,580 982 598
2021 1,595 70 1,665 982 683
2022 1,674 81 1,755 982 773

18-7
100 tons of peanut butter per annum. This production capacity is proposed on the basis of single
shift of 8 hours per day and 300 working days per annum. Annual production can be increased
by operating the plant in two or three shifts as required.
2. Production Program
It is planned that the envisaged plant will start production at 90% of its installed capacity which
will grow to 100% in the second year and onwards. Details of annual production program are
shown in Table 3.3.
Table 3.3
ANNUAL PRODUCTION PROGRAM
Sr.
No.
Description Unit of
Measure
Production Year
1st 2nd
&
Onwards
1 Peanut butter ton 90 100
2 Capacity utilization rate % 90 100
IV. MATERIAL AND INPUTS
A. RAW MATERIALS
The major raw materials required for production of peanut butter is include ground nut, salt,
sugar, emulsifier, preservatives, antioxidants, and other additives. Most of the raw materials are
available locally. The preservatives and additives have to be imported. The annual requirement
for raw materials at full capacity production of the envisaged plant and the estimated costs are
given in Table 4.1.
18-8
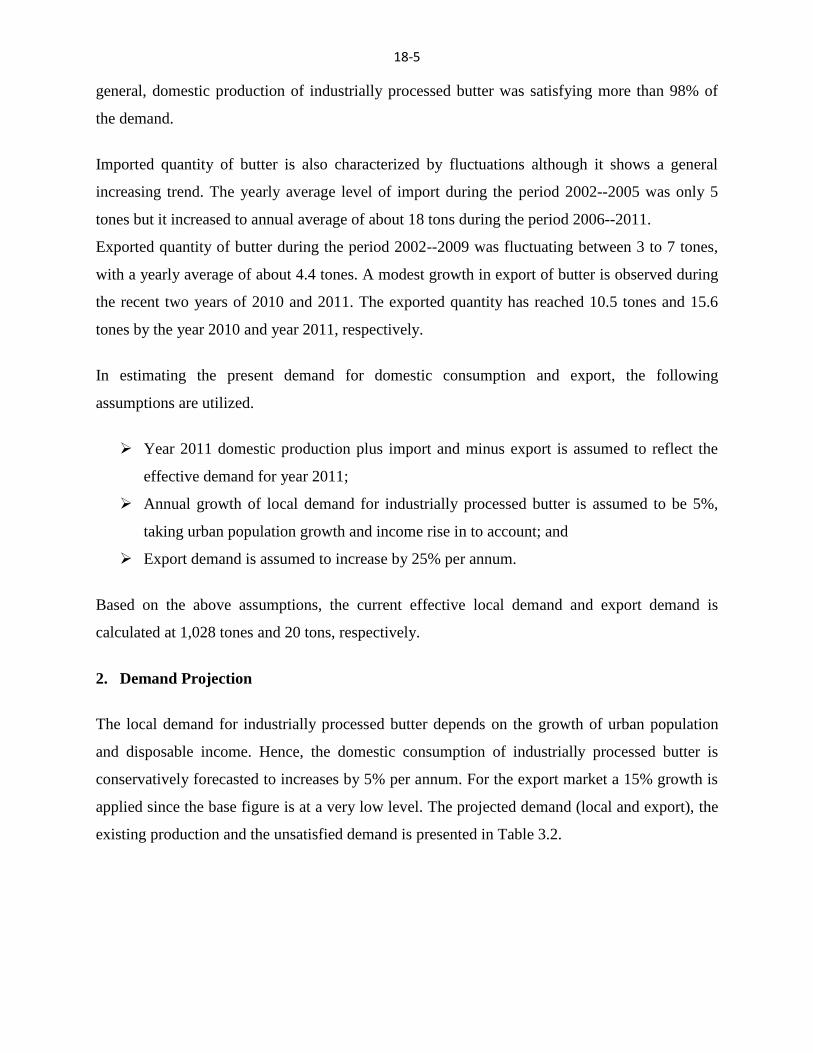
Table 4.1
ANNUAL RAW MATERIALS REQUIREMENT AND ESTIMATED COST
Sr.
No.
Description Unit of
Measure
Required
Qty
Unit
Price
Cost ( '000 Birr)
F. C. L. C. Total
1 Ground nut ton 142.0 8,500.00 1,207.000 1,207.000
2 Common salt ton 1.5 2,500.00 3.750 3.750
3 Sugar ton 3.0 14,000.00 42.000 42.000
4 Emulsifier ton 1.5 85.00 0.128 0.128
5 Preservatives kg 100.0 204.00 16.320 4.080 20.400
6 Antioxidants kg 10.0 1,520.00 12.160 3.040 15.200
7 Other additives kg 26.7 2531.00 54.062 13.516 67.578
Total 82.542 1,273.51 1,356.056
The auxiliary material required for the envisaged plant is packing material, aluminum foil. The
annual requirement for the auxiliary material at full capacity production of the plant amounts to
27 kg of aluminum foil and the total cost is estimated Birr 212,625, of which Birr 170,100 will
be required in foreign currency.
B. UTILITIES
The utilities required for the envisaged project include electric power and water. The annual
requirement for utilities at full capacity production of the plant and the estimated costs are shown
in Table 4.2.
Table 4.2
ANNUAL UTILITIES REQUIREMENT AND ESTIMATED COSTS
Sr.
No.
Description Unit of
Measure
Required
Qty
Unit Price,
Birr/Unit
Cost, ('000 Birr)
F.C. L.C. Total
1 Electric power kWh 90,000 0.58 52.2 52.2
2 Water m3 1,250 10.00 12.5 12.5
Total 64.7 64.7
18-9
V. TECHNOLOGY AND ENGINEERING
A. TECHNOLOGY
1. Production Process
The peanut butter production technology involves operations such as decorticating, roasting,
blanking, grinding, paste forming, and packing. As mentioned above, the production process
starts with removing of the shells from the incoming peanuts by using the decorticating machine.
The shelled peanuts are then heated to a temperature of about 145 0 C to obtain the proper
roasted flavor. Then the influence of roasting time on sensory attributes and chemical
measurements of flavor components are examined. The roasted peanuts undergo blanching to
remove the peanut skin. Then, a course or medium grinding is carried out, the ingredients are
added and blended. The oil level is controlled at 3% by keeping the mix at low temperature.
The final grinding is prepared at an appropriate temperature to produce the desired texture of
smooth creamy paste. Air is removed by vacuum and the mixture is cooled, and finally the
peanut butter is packed by using a vacuum fill type packing unit. The premises under which
peanut butter is manufactured, packed, stored and distributed, and the equipment used during
processing shall be maintained under strict hygienic conditions.
2. Environmental Impact
The unit operations involved in production of peanut butter do not have any toxicant or pollutant
emitted to the environment. Thus the envisaged project is environment friendly.
B. ENGINEERING
1. Machinery and Equipment
The machinery and equipment required for the envisaged plant comprise mainly decorticator,
roasting and blanching equipment, grinding and mixing machine, packing machine, etc. The list
of plant machinery and equipment and the estimated costs are indicated in Table 5.1.
18-10
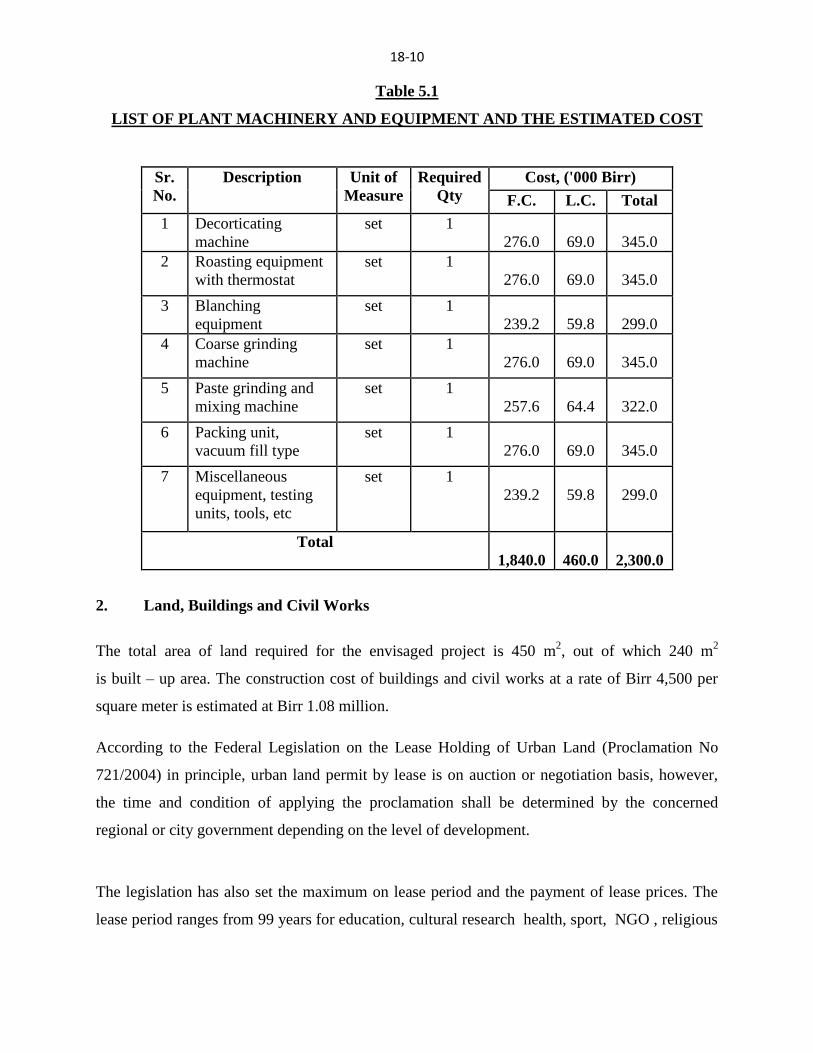
Table 5.1
LIST OF PLANT MACHINERY AND EQUIPMENT AND THE ESTIMATED COST
Sr.
No.
Description Unit of
Measure
Required
Qty
Cost, ('000 Birr)
F.C. L.C. Total
1 Decorticating
machine
set 1
276.0
69.0
345.0
2 Roasting equipment
with thermostat
set 1
276.0
69.0
345.0
3 Blanching
equipment
set 1
239.2
59.8
299.0
4 Coarse grinding
machine
set 1
276.0
69.0
345.0
5 Paste grinding and
mixing machine
set 1
257.6
64.4
322.0
6 Packing unit,
vacuum fill type
set 1
276.0
69.0
345.0
7 Miscellaneous
equipment, testing
units, tools, etc
set 1
239.2
59.8
299.0
Total
1,840.0
460.0
2,300.0
2. Land, Buildings and Civil Works
The total area of land required for the envisaged project is 450 m2, out of which 240 m
2
is built – up area. The construction cost of buildings and civil works at a rate of Birr 4,500 per
square meter is estimated at Birr 1.08 million.
According to the Federal Legislation on the Lease Holding of Urban Land (Proclamation No
721/2004) in principle, urban land permit by lease is on auction or negotiation basis, however,
the time and condition of applying the proclamation shall be determined by the concerned
regional or city government depending on the level of development.
The legislation has also set the maximum on lease period and the payment of lease prices. The
lease period ranges from 99 years for education, cultural research health, sport, NGO , religious

18-11
and residential area to 80 years for industry and 70 years for trade while the lease payment
period ranges from 10 years to 60 years based on the towns grade and type of investment.
Moreover, advance payment of lease based on the type of investment ranges from 5% to
10%.The lease price is payable after the grace period annually. For those that pay the entire
amount of the lease will receive 0.5% discount from the total lease value and those that pay in
installments will be charged interest based on the prevailing interest rate of banks. Moreover,
based on the type of investment, two to seven years grace period shall also be provided.
However, the Federal Legislation on the Lease Holding of Urban Land apart from setting the
maximum has conferred on regional and city governments the power to issue regulations on the
exact terms based on the development level of each region.
In Addis Ababa, the City’s Land Administration and Development Authority is directly
responsible in dealing with matters concerning land. However, regarding the manufacturing
sector, industrial zone preparation is one of the strategic intervention measures adopted by the
City Administration for the promotion of the sector and all manufacturing projects are assumed
to be located in the developed industrial zones.
Regarding land allocation of industrial zones if the land requirement of the project is below
5,000 m2,
the land lease request is evaluated and decided upon by the Industrial Zone
Development and Coordination Committee of the City’s Investment Authority. However, if the
land request is above 5,000 m2 the request is evaluated by the City’s Investment Authority and
passed with recommendation to the Land Development and Administration Authority for
decision, while the lease price is the same for both cases.
Moreover, the Addis Ababa City Administration has recently adopted a new land lease floor
price for plots in the city. The new prices will be used as a benchmark for plots that are going to
be auctioned by the city government or transferred under the new “Urban Lands Lease Holding
Proclamation.”
The new regulation classified the city into three zones. The first Zone is Central Market District
Zone, which is classified in five levels and the floor land lease price ranges from Birr 1,686 to

18-12
Birr 894 per m2. The rate for Central Market District Zone will be applicable in most areas of the
city that are considered to be main business areas that entertain high level of business activities.
The second zone, Transitional Zone, will also have five levels and the floor land lease price
ranges from Birr 1,035 to Birr 555 per m2 .This zone includes places that are surrounding the city
and are occupied by mainly residential units and industries.
The last and the third zone, Expansion Zone, is classified into four levels and covers areas that
are considered to be in the outskirts of the city, where the city is expected to expand in the future.
The floor land lease price in the Expansion Zone ranges from Birr 355 to Birr 191 per m2
(see
Table 5.2).
Table 5.2
NEW LAND LEASE FLOOR PRICE FOR PLOTS IN ADDIS ABABA
Zone Level
Floor
Price/m2
Central Market
District
1st 1686
2nd
1535
3rd
1323
4th
1085
5th
894
Transitional zone
1st 1035
2nd
935
3rd
809
4th
685
5th
555
Expansion zone
1st 355
2nd
299
3rd
217
4th
191
Accordingly, in order to estimate the land lease cost of the project profiles it is assumed that all
new manufacturing projects will be located in industrial zones located in expansion zones.
Therefore, for the profile a land lease rate of Birr 266 per m2
which is equivalent to the average
floor price of plots located in expansion zone is adopted.
18-13
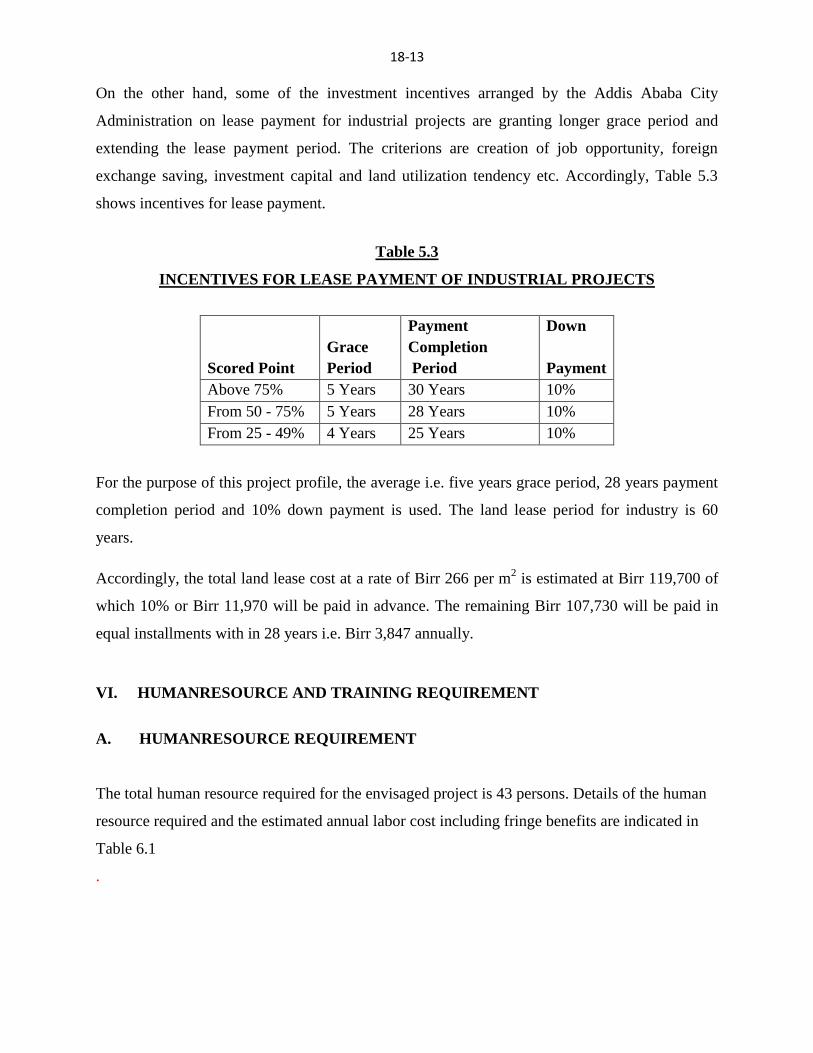
On the other hand, some of the investment incentives arranged by the Addis Ababa City
Administration on lease payment for industrial projects are granting longer grace period and
extending the lease payment period. The criterions are creation of job opportunity, foreign
exchange saving, investment capital and land utilization tendency etc. Accordingly, Table 5.3
shows incentives for lease payment.
Table 5.3
INCENTIVES FOR LEASE PAYMENT OF INDUSTRIAL PROJECTS
Scored Point
Grace
Period
Payment
Completion
Period
Down
Payment
Above 75% 5 Years 30 Years 10%
From 50 - 75% 5 Years 28 Years 10%
From 25 - 49% 4 Years 25 Years 10%
For the purpose of this project profile, the average i.e. five years grace period, 28 years payment
completion period and 10% down payment is used. The land lease period for industry is 60
years.
Accordingly, the total land lease cost at a rate of Birr 266 per m2 is estimated at Birr 119,700 of
which 10% or Birr 11,970 will be paid in advance. The remaining Birr 107,730 will be paid in
equal installments with in 28 years i.e. Birr 3,847 annually.
VI. HUMANRESOURCE AND TRAINING REQUIREMENT
A. HUMANRESOURCE REQUIREMENT
The total human resource required for the envisaged project is 43 persons. Details of the human
resource required and the estimated annual labor cost including fringe benefits are indicated in
Table 6.1
.

18-14
Table 6.1
HUMAN RESOURCE REQUIREMENT AND LABOR COST
Sr.
No.
Job Title Required
No. of
Persons
Salary ( in Birr)
Monthly Annual
1 Plant manager 1 5,000 60,000
2 Secretary 1 850 10,200
3 Personnel 1 850 10,200
4 Accountant/clerk 2 1,700 20,400
5 Cashier 1 800 9,600
6 Salesman 2 1,600 19,200
7 Purchaser 1 800 9,600
8 Store keeper 2 1,600 19,200
9 Production supervisor 1 2,000 24,000
10 Quality controller/chemist 1 1,700 20,400
11 Mechanic 1 1,700 20,400
12 Electrician 1 850 10,200
13 Operator 4 2,000 24,000
14 Laborer 8 3,200 38,400
15 Driver 1 750 9,000
16 Guard 3 1,200 14,400
Sub - total 31 26,600 319,200
Employees benefit, 20% of basic salary 5,320 63,840
Total 31,920 383,040
B. TRAINING REQUIREMENT
The production supervisor, the quality controller, a mechanic and an electrician should be given
a two weeks on - the - job training on the production technology, quality control, operation and
maintenance of machinery and equipment by advanced technician of the equipment supplier
during plant erection and commissioning. Then after, the production supervisor and the quality
controller should orient the operators before start - up of production for five days on how to
operate the production equipment. The total cost of training is estimated at Birr 160,000.
18-15
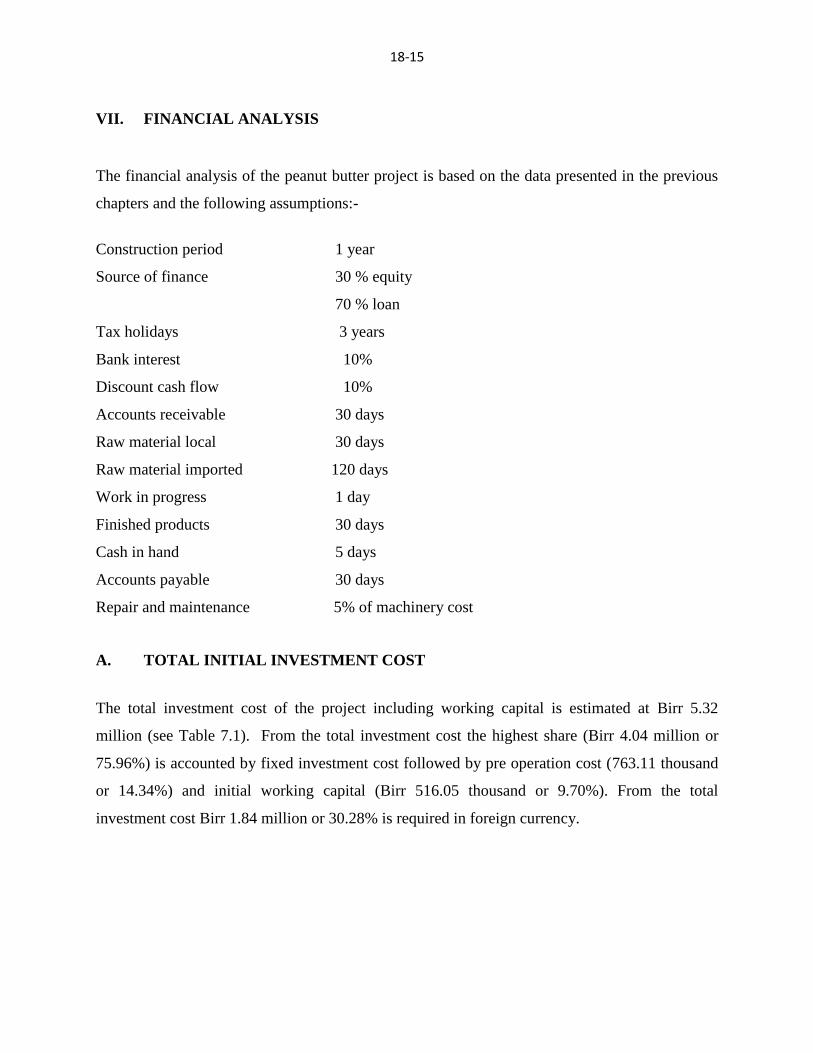
VII. FINANCIAL ANALYSIS
The financial analysis of the peanut butter project is based on the data presented in the previous
chapters and the following assumptions:-
Construction period 1 year
Source of finance 30 % equity
70 % loan
Tax holidays 3 years
Bank interest 10%
Discount cash flow 10%
Accounts receivable 30 days
Raw material local 30 days
Raw material imported 120 days
Work in progress 1 day
Finished products 30 days
Cash in hand 5 days
Accounts payable 30 days
Repair and maintenance 5% of machinery cost
A. TOTAL INITIAL INVESTMENT COST
The total investment cost of the project including working capital is estimated at Birr 5.32
million (see Table 7.1). From the total investment cost the highest share (Birr 4.04 million or
75.96%) is accounted by fixed investment cost followed by pre operation cost (763.11 thousand
or 14.34%) and initial working capital (Birr 516.05 thousand or 9.70%). From the total
investment cost Birr 1.84 million or 30.28% is required in foreign currency.
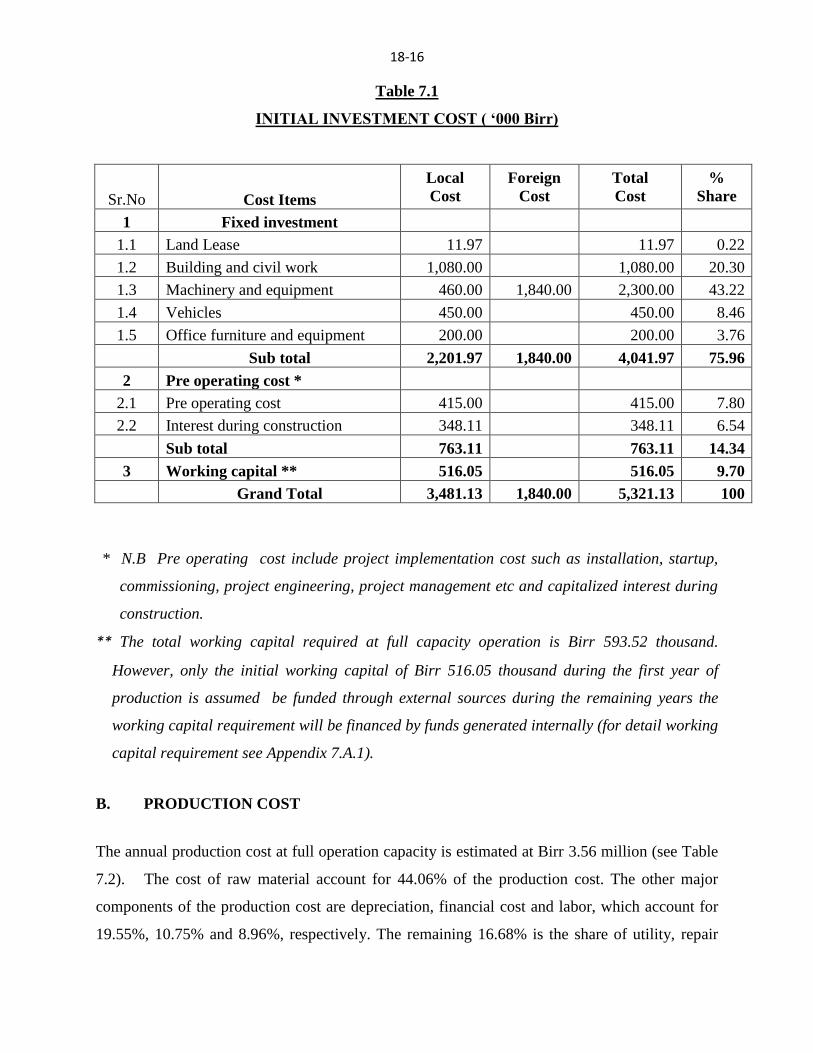
18-16
Table 7.1
INITIAL INVESTMENT COST ( ‘000 Birr)
Sr.No Cost Items
Local
Cost
Foreign
Cost
Total
Cost
%
Share
1 Fixed investment
1.1 Land Lease 11.97 11.97 0.22
1.2 Building and civil work 1,080.00 1,080.00 20.30
1.3 Machinery and equipment 460.00 1,840.00 2,300.00 43.22
1.4 Vehicles 450.00 450.00 8.46
1.5 Office furniture and equipment 200.00 200.00 3.76
Sub total 2,201.97 1,840.00 4,041.97 75.96
2 Pre operating cost *
2.1 Pre operating cost 415.00 415.00 7.80
2.2 Interest during construction 348.11 348.11 6.54
Sub total 763.11 763.11 14.34
3 Working capital ** 516.05 516.05 9.70
Grand Total 3,481.13 1,840.00 5,321.13 100
* N.B Pre operating cost include project implementation cost such as installation, startup,
commissioning, project engineering, project management etc and capitalized interest during
construction.
** The total working capital required at full capacity operation is Birr 593.52 thousand.
However, only the initial working capital of Birr 516.05 thousand during the first year of
production is assumed be funded through external sources during the remaining years the
working capital requirement will be financed by funds generated internally (for detail working
capital requirement see Appendix 7.A.1).
B. PRODUCTION COST
The annual production cost at full operation capacity is estimated at Birr 3.56 million (see Table
7.2). The cost of raw material account for 44.06% of the production cost. The other major
components of the production cost are depreciation, financial cost and labor, which account for
19.55%, 10.75% and 8.96%, respectively. The remaining 16.68% is the share of utility, repair
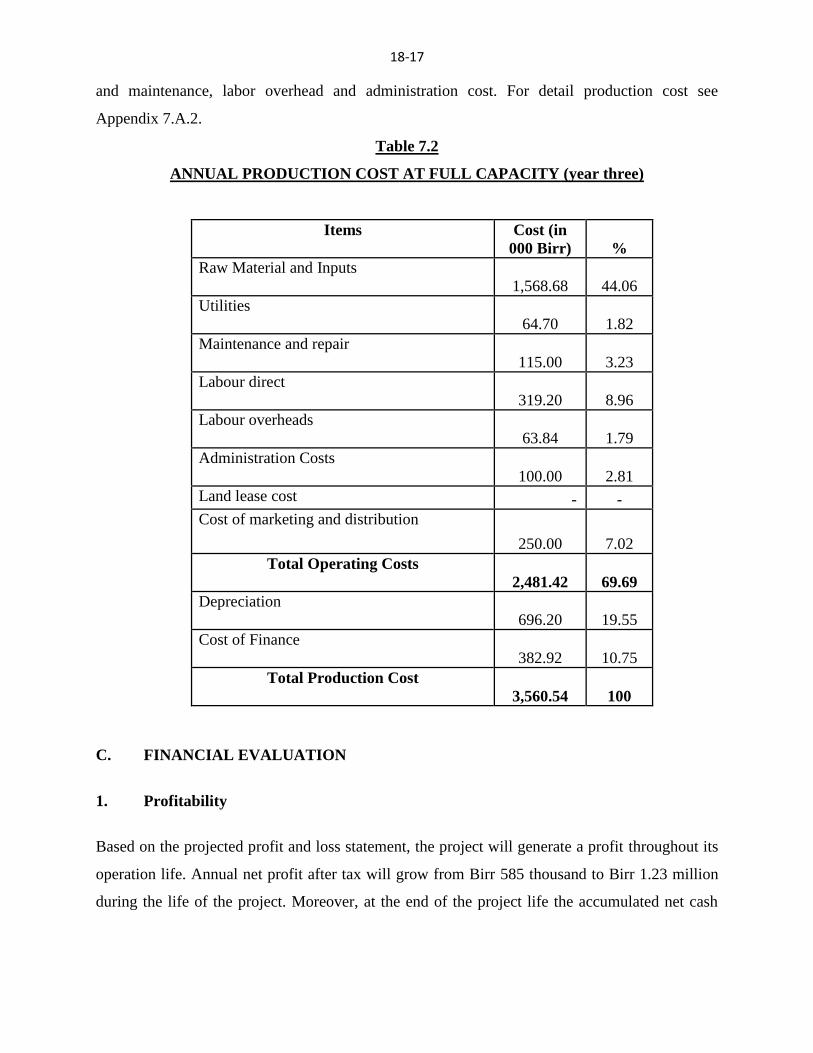
18-17
and maintenance, labor overhead and administration cost. For detail production cost see
Appendix 7.A.2.
Table 7.2
ANNUAL PRODUCTION COST AT FULL CAPACITY (year three)
Items Cost (in
000 Birr) %
Raw Material and Inputs
1,568.68 44.06
Utilities
64.70 1.82
Maintenance and repair
115.00 3.23
Labour direct
319.20 8.96
Labour overheads
63.84 1.79
Administration Costs
100.00 2.81
Land lease cost - -
Cost of marketing and distribution
250.00 7.02
Total Operating Costs
2,481.42 69.69
Depreciation
696.20 19.55
Cost of Finance
382.92 10.75
Total Production Cost
3,560.54 100
C. FINANCIAL EVALUATION
1. Profitability
Based on the projected profit and loss statement, the project will generate a profit throughout its
operation life. Annual net profit after tax will grow from Birr 585 thousand to Birr 1.23 million
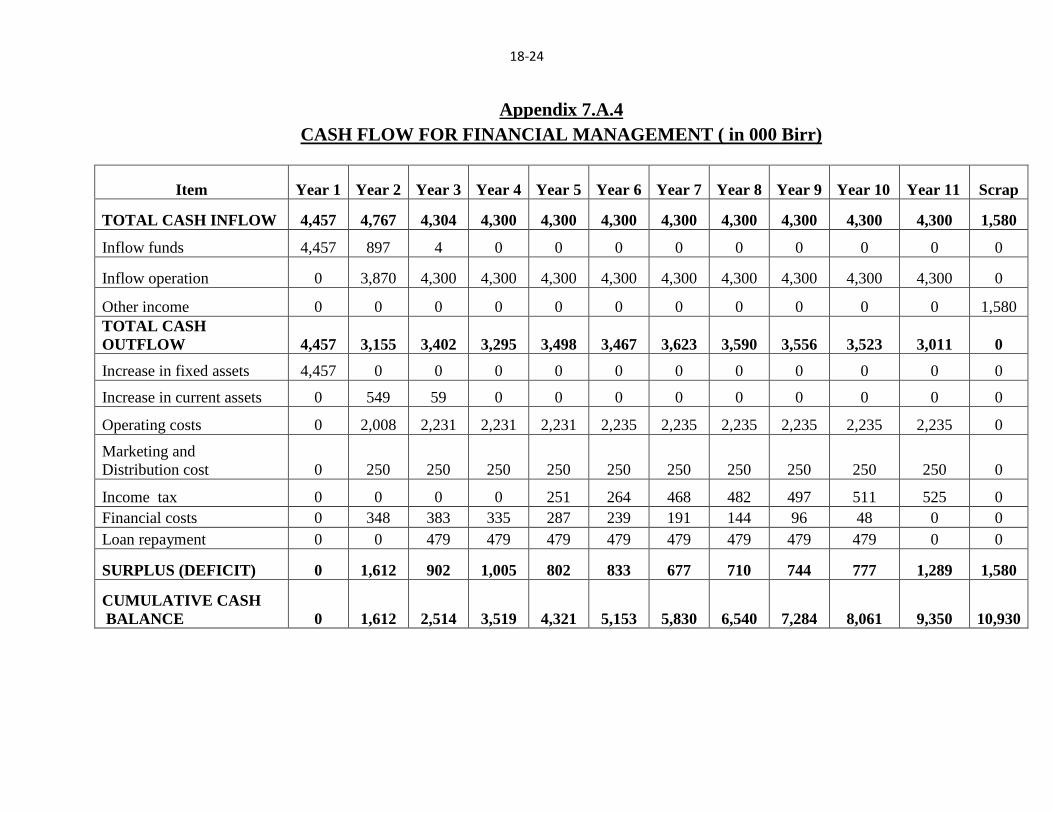
during the life of the project. Moreover, at the end of the project life the accumulated net cash

18-18
flow amounts to Birr 10.93 million. For profit and loss statement and cash flow projection see
Appendix 7.A.3 and 7.A.4, respectively.
2. Ratios
In financial analysis, financial ratios and efficiency ratios are used as an index or yardstick for
evaluating the financial position of a firm. It is also an indicator for the strength and weakness of
the firm or a project. Using the year-end balance sheet figures and other relevant data, the most
important ratios such as return on sales which is computed by dividing net income by revenue,
return on assets (operating income divided by assets), return on equity (net profit divided by
equity) and return on total investment (net profit plus interest divided by total investment) has
been carried out over the period of the project life and all the results are found to be satisfactory.
3. Break-even Analysis
The break-even analysis establishes a relationship between operation costs and revenues. It
indicates the level at which costs and revenue are in equilibrium. To this end, the break-even
point for capacity utilization and sales value estimated by using income statement projection are
computed as followed.
Break- Even Sales Value = Fixed Cost + Financial Cost = Birr 1,806,000
Variable Margin ratio (%)
Break -Even Capacity utilization = Break- even Sales Value X 100 = 45.74%
Sales revenue
4. Pay-back Period
The pay- back period, also called pay – off period is defined as the period required for recovering
the original investment outlay through the accumulated net cash flows earned by the project.
Accordingly, based on the projected cash flow it is estimated that the project’s initial investment
will be fully recovered within 4 years.

18-19
5. Internal Rate of Return
The internal rate of return (IRR) is the annualized effective compounded return rate that can be
earned on the invested capital, i.e., the yield on the investment. Put another way, the internal rate
of return for an investment is the discount rate that makes the net present value of the
investment's income stream total to zero. It is an indicator of the efficiency or quality of an
investment. A project is a good investment proposition if its IRR is greater than the rate of return
that could be earned by alternate investments or putting the money in a bank account.
Accordingly, the IRR of this project is computed to be 30.39% indicating the viability of the
project.
6. Net Present Value
Net present value (NPV) is defined as the total present (discounted) value of a time series of cash
flows. NPV aggregates cash flows that occur during different periods of time during the life of a
project in to a common measuring unit i.e. present value. It is a standard method for using the
time value of money to appraise long-term projects. NPV is an indicator of how much value an
investment or project adds to the capital invested. In principle, a project is accepted if the NPV is
non-negative.
Accordingly, the net present value of the project at 10% discount rate is found to be Birr 5.06
million which is acceptable. For detail discounted cash flow see Appendix 7.A.5.
D. ECONOMIC AND SOCIAL BENEFITS
The project can create employment for 31 persons. The project will generate Birr 2.10 million in
terms of tax revenue. The establishment of such factory will have a foreign exchange saving and
earning effect to the country by substituting the current imports and exporting its products to the
international market. The project will also create backward linkage with the agricultural sector
and sugar and salt industries and also generates income for the Government in terms of payroll
tax.

18-20
Appendix 7.A
FINANCIAL ANALYSES SUPPORTING TABLES

18-21
Appendix 7.A.1
NET WORKING CAPITAL ( in 000 Birr)
Items Year 2 Year 3 Year 4 Year 5 Year 6 Year 7 Year 8 Year 9 Year 10 Year 11
Total inventory 352.95 392.17 392.17 392.17 392.17 392.17 392.17 392.17 392.17 392.17
Accounts receivable 188.19 206.79 206.79 206.79 207.11 207.11 207.11 207.11 207.11 207.11
Cash-in-hand 7.48 8.31 8.31 8.31 8.36 8.36 8.36 8.36 8.36 8.36
CURRENT ASSETS 548.62 607.26 607.26 607.26 607.64 607.64 607.64 607.64 607.64 607.64
Accounts payable 32.57 36.18 36.18 36.18 36.18 36.18 36.18 36.18 36.18 36.18
CURRENT LIABILITIES 32.57 36.18 36.18 36.18 36.18 36.18 36.18 36.18 36.18 36.18
TOTAL WORKING
CAPITAL 516.05 571.08 571.08 571.08 571.45 571.45 571.45 571.45 571.45 571.45
18-22
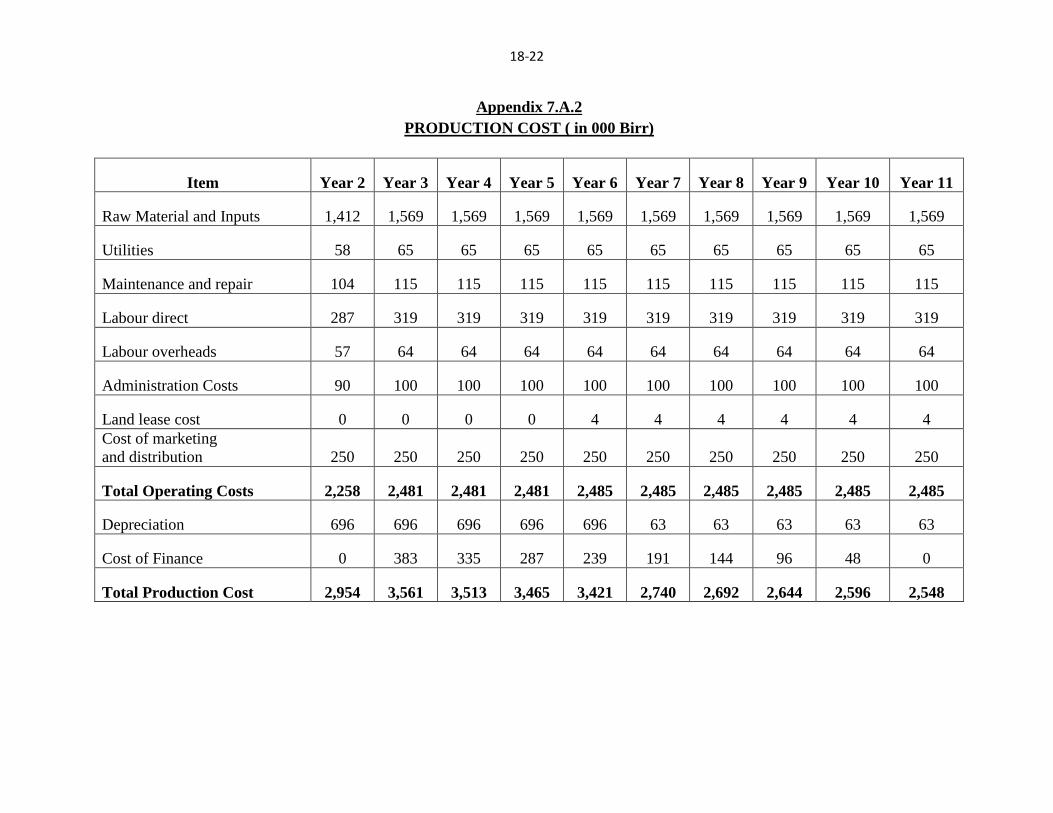
Appendix 7.A.2
PRODUCTION COST ( in 000 Birr)
Item Year 2 Year 3 Year 4 Year 5 Year 6 Year 7 Year 8 Year 9 Year 10 Year 11
Raw Material and Inputs 1,412 1,569 1,569 1,569 1,569 1,569 1,569 1,569 1,569 1,569
Utilities 58 65 65 65 65 65 65 65 65 65
Maintenance and repair 104 115 115 115 115 115 115 115 115 115
Labour direct 287 319 319 319 319 319 319 319 319 319
Labour overheads 57 64 64 64 64 64 64 64 64 64
Administration Costs 90 100 100 100 100 100 100 100 100 100
Land lease cost 0 0 0 0 4 4 4 4 4 4
Cost of marketing
and distribution 250 250 250 250 250 250 250 250 250 250
Total Operating Costs 2,258 2,481 2,481 2,481 2,485 2,485 2,485 2,485 2,485 2,485
Depreciation 696 696 696 696 696 63 63 63 63 63
Cost of Finance 0 383 335 287 239 191 144 96 48 0
Total Production Cost 2,954 3,561 3,513 3,465 3,421 2,740 2,692 2,644 2,596 2,548
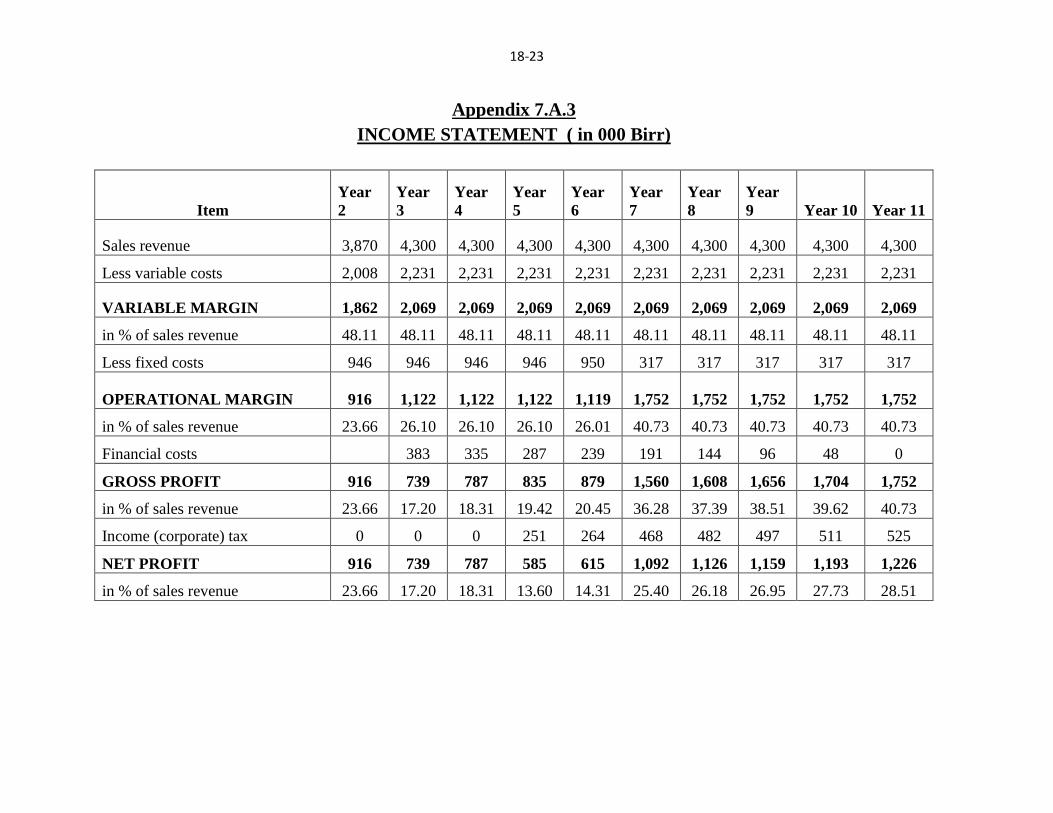
18-23
Appendix 7.A.3
INCOME STATEMENT ( in 000 Birr)
Item
Year
2
Year
3
Year
4
Year
5
Year
6
Year
7
Year
8
Year
9 Year 10 Year 11
Sales revenue 3,870 4,300 4,300 4,300 4,300 4,300 4,300 4,300 4,300 4,300
Less variable costs 2,008 2,231 2,231 2,231 2,231 2,231 2,231 2,231 2,231 2,231
VARIABLE MARGIN 1,862 2,069 2,069 2,069 2,069 2,069 2,069 2,069 2,069 2,069
in % of sales revenue 48.11 48.11 48.11 48.11 48.11 48.11 48.11 48.11 48.11 48.11
Less fixed costs 946 946 946 946 950 317 317 317 317 317
OPERATIONAL MARGIN 916 1,122 1,122 1,122 1,119 1,752 1,752 1,752 1,752 1,752
in % of sales revenue 23.66 26.10 26.10 26.10 26.01 40.73 40.73 40.73 40.73 40.73
Financial costs 383 335 287 239 191 144 96 48 0
GROSS PROFIT 916 739 787 835 879 1,560 1,608 1,656 1,704 1,752
in % of sales revenue 23.66 17.20 18.31 19.42 20.45 36.28 37.39 38.51 39.62 40.73
Income (corporate) tax 0 0 0 251 264 468 482 497 511 525
NET PROFIT 916 739 787 585 615 1,092 1,126 1,159 1,193 1,226
in % of sales revenue 23.66 17.20 18.31 13.60 14.31 25.40 26.18 26.95 27.73 28.51
18-24
Appendix 7.A.4
CASH FLOW FOR FINANCIAL MANAGEMENT ( in 000 Birr)
Item Year 1 Year 2 Year 3 Year 4 Year 5 Year 6 Year 7 Year 8 Year 9 Year 10 Year 11 Scrap
TOTAL CASH INFLOW 4,457 4,767 4,304 4,300 4,300 4,300 4,300 4,300 4,300 4,300 4,300 1,580
Inflow funds 4,457 897 4 0 0 0 0 0 0 0 0 0
Inflow operation 0 3,870 4,300 4,300 4,300 4,300 4,300 4,300 4,300 4,300 4,300 0
Other income 0 0 0 0 0 0 0 0 0 0 0 1,580
TOTAL CASH
OUTFLOW 4,457 3,155 3,402 3,295 3,498 3,467 3,623 3,590 3,556 3,523 3,011 0
Increase in fixed assets 4,457 0 0 0 0 0 0 0 0 0 0 0
Increase in current assets 0 549 59 0 0 0 0 0 0 0 0 0
Operating costs 0 2,008 2,231 2,231 2,231 2,235 2,235 2,235 2,235 2,235 2,235 0
Marketing and
Distribution cost 0 250 250 250 250 250 250 250 250 250 250 0
Income tax 0 0 0 0 251 264 468 482 497 511 525 0
Financial costs 0 348 383 335 287 239 191 144 96 48 0 0
Loan repayment 0 0 479 479 479 479 479 479 479 479 0 0
SURPLUS (DEFICIT) 0 1,612 902 1,005 802 833 677 710 744 777 1,289 1,580
CUMULATIVE CASH
BALANCE 0 1,612 2,514 3,519 4,321 5,153 5,830 6,540 7,284 8,061 9,350 10,930
18-25
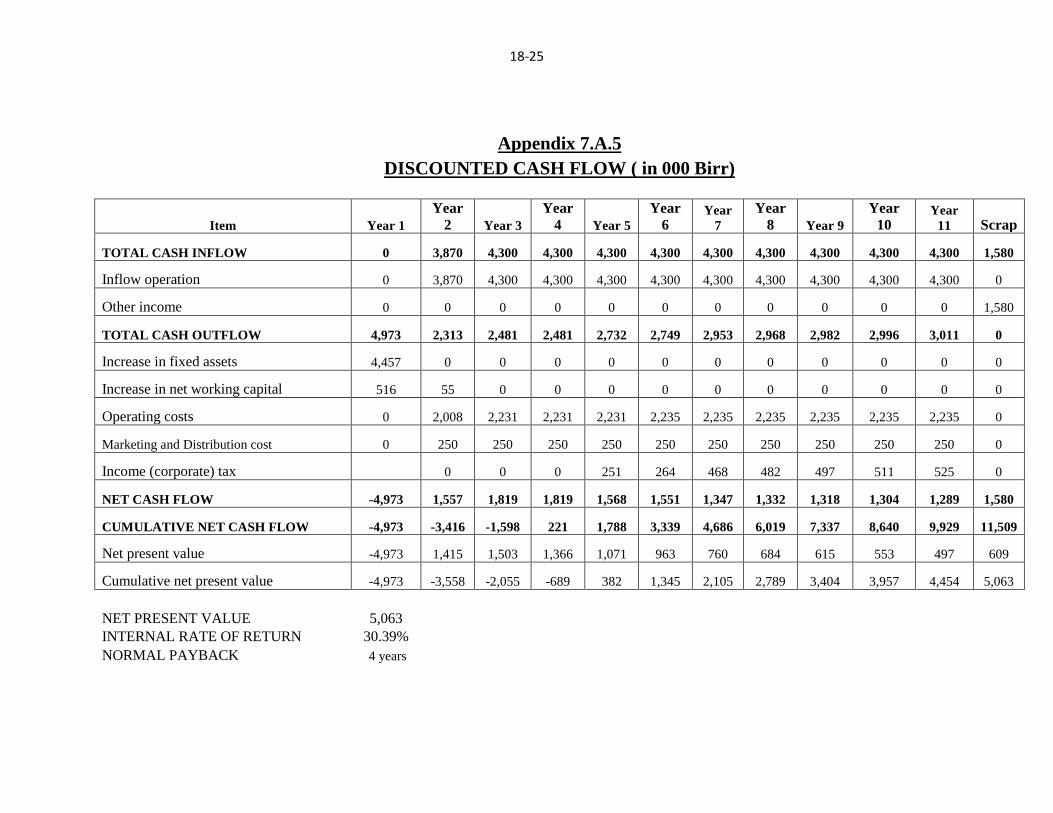
Appendix 7.A.5
DISCOUNTED CASH FLOW ( in 000 Birr)
Item Year 1
Year
2 Year 3
Year
4 Year 5
Year
6 Year
7
Year
8 Year 9
Year
10 Year
11 Scrap
TOTAL CASH INFLOW 0 3,870 4,300 4,300 4,300 4,300 4,300 4,300 4,300 4,300 4,300 1,580
Inflow operation 0 3,870 4,300 4,300 4,300 4,300 4,300 4,300 4,300 4,300 4,300 0
Other income 0 0 0 0 0 0 0 0 0 0 0 1,580
TOTAL CASH OUTFLOW 4,973 2,313 2,481 2,481 2,732 2,749 2,953 2,968 2,982 2,996 3,011 0
Increase in fixed assets 4,457 0 0 0 0 0 0 0 0 0 0 0
Increase in net working capital 516 55 0 0 0 0 0 0 0 0 0 0
Operating costs 0 2,008 2,231 2,231 2,231 2,235 2,235 2,235 2,235 2,235 2,235 0
Marketing and Distribution cost 0 250 250 250 250 250 250 250 250 250 250 0
Income (corporate) tax 0 0 0 251 264 468 482 497 511 525 0
NET CASH FLOW -4,973 1,557 1,819 1,819 1,568 1,551 1,347 1,332 1,318 1,304 1,289 1,580
CUMULATIVE NET CASH FLOW -4,973 -3,416 -1,598 221 1,788 3,339 4,686 6,019 7,337 8,640 9,929 11,509
Net present value -4,973 1,415 1,503 1,366 1,071 963 760 684 615 553 497 609
Cumulative net present value -4,973 -3,558 -2,055 -689 382 1,345 2,105 2,789 3,404 3,957 4,454 5,063
NET PRESENT VALUE 5,063
INTERNAL RATE OF RETURN 30.39%
NORMAL PAYBACK 4 years