Embed Size (px)
Citation preview

16A.6 CONVECTIVE ENVIRONMENTS ACROSS THE MARITIME CONTINENT DURING THE BOREAL SUMMER
INTRASEASONAL OSCILLATION
Benjamin A. Toms*, Susan C. van den Heever, Emily M. Riley Dellaripa, and Stephen M. Saleeby Department of Atmospheric Science, Colorado State University, Fort Collins, CO
1. INTRODUCTION
The boreal summer intraseasonal oscillation (BSISO), an off-equatorial mode of summertime tropical intraseasonal variability, is characterized by a convective dipole that propagates north and east across the Indo-West Pacific (Lawrence and Webster, 2002; Jiang et al., 2004). While related to the Madden-Julian Oscillation (MJO), the northward propagation of the convective dipole within the BSISO is distinct from the primarily eastward propagating MJO (Kikuchi et al., 2012; Lee et al., 2013). The northward propagating mode is highly correlated with the eastward propagating modes of the MJO, however, so the BSISO is likely coupled to the MJO (Lee et al., 2013). In this sense, the BSISO may be interpreted as the interaction between the boreal summertime MJO and the southeastern Asian monsoon.
While the BSISO itself is regional in scale, individual convective elements constitute the convective envelope within the positively active portion of the dipole (Lawrence and Webster, 2002; Straub and Kiladis, 2003). By considering the convective envelope as an agglomeration of mesoscale elements, it may be separated into distinct environments within which convective systems of varying morphology and structure occur. The sparsity of observational data within the Indo-West Pacific precludes an observational approach to identifying such convective regimes (Bukowski et al., 2017); therefore, modeling is required to dissect the BSISO down to the mesoscale. 2. EVENT IDENTIFICATION AND LARGE-SCALE PATTERN A canonical BSISO event was identified that had a persistent, strong (i.e. greater than 1-sigma) signal captured by both the Outgoing Longwave Radiation (OLR) MJO Index (OMI; Kiladis et al., 2014) and the
Figure 1. Hovmoller diagrams of anomalous surface precipitation observed by GPM across the simulation domain from July 10 2016, 0000 UTC through August 14 2016, 0000 UTC. The Hovmoller diagram on the left shows latitudinally averaged data, while the Hovmoller diagram in the upper right shows longitudinally averaged data. Open contours denote anomalies associated with waves with periods of greater than 17.5 days, while the filled contours show the total anomaly. Anomalies are departures from the mean precipitation across the simulation domain throughout the entire July 10 through August 14 period. The phase diagram in the lower right shows the OMI phase and the associated amplitude of the leading two principal components (black and red, respectively).
*Corresponding author address: Benjamin A. Toms, Colorado State University, Department of Atmospheric Science, Fort Collins, CO; E-mail: [email protected]

Bimodal ISO Index (Kikuchi et al., 2012). Both OMI and the Bimodal ISO Index are based on the primary modes of OLR variability within the tropics, which, given the focus of this study on the convective properties of the BSISO, lends confidence that the identified event has a robust convective signal. Furthermore, by ensuring the event is strong within both the OMI and Bimodal ISO index, the identified event is comprised of both prominent eastward and northward propagating components. The BSISO event of July/August 2016 was defined by a persistent convective signal within both OMI and the Bimodal ISO Index, and Global Precipitation Measurement (GPM; Smith et al., 2007) IMERG precipitation data suggest the presence of both an eastward and northward propagating component to the regional wave (Figure 1). While the northward propagating component of the wave persists as it traverses the Maritime Continent, the eastward propagating mode appears to disintegrate into shorter period waves prior to regenerating on the eastern periphery of the Filipino Archipelago (Figure 1). 3. SIMULATION DESIGN AND PERFORMANCE We identify environments within which deep convection occurs during a canonical BSISO event using a cloud-resolving simulation centered over the Maritime Continent (see domain in Figure 3). The Regional Atmospheric Modeling System (RAMS; Cotton et al., 2003; Saleeby and van den Heever, 2013), an open-source cloud-resolving model with an integrated bin-emulating double-moment microphysics scheme, was
used to simulate a 35-day period during July and August of 2016. The lateral boundaries were forced with ERA-5 reanalysis, while the interior of the domain was allowed to freely evolve according to the model physics. Hovmoller diagrams of the simulated surface precipitation fields are similar to the GPM IMERG data, with both eastward and northward propagating modes
Figure 2. As in Figure 1, but for the simulation output.
Figure 3. Convective cell tracks within the simulation during the July 13, 0000 UTC to August 14, 0000 UTC period. Line width signifies the total volume of the convective features.
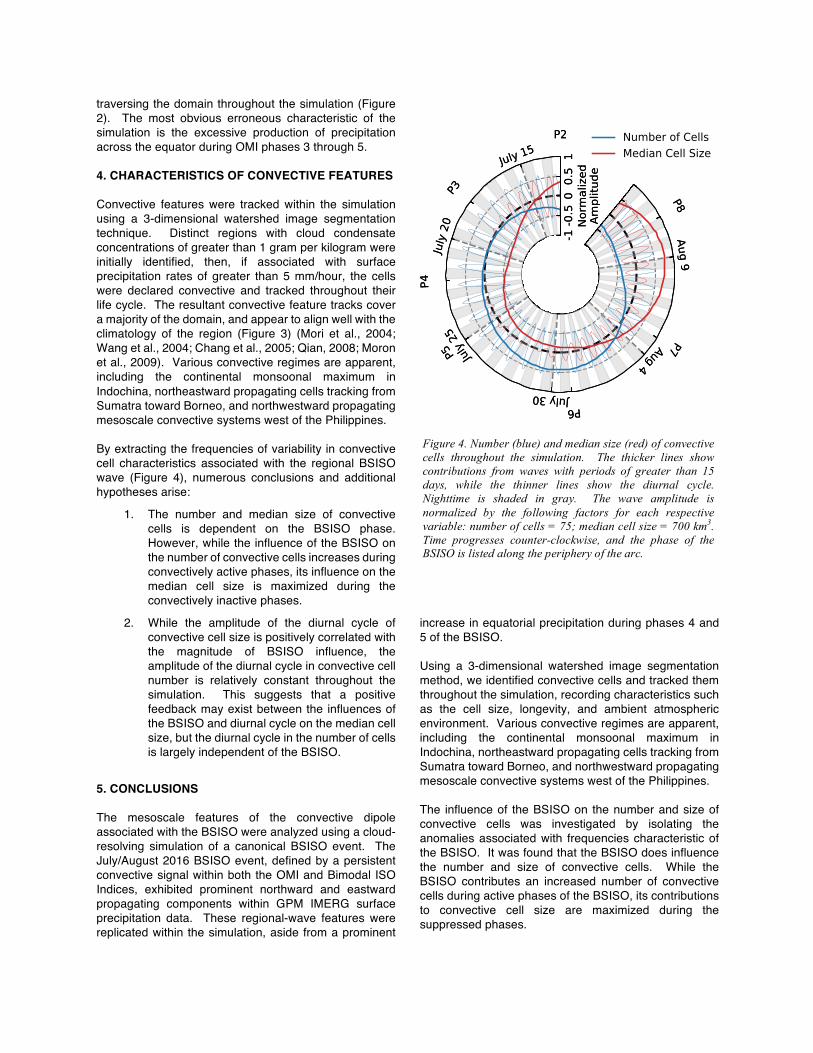
traversing the domain throughout the simulation (Figure 2). The most obvious erroneous characteristic of the simulation is the excessive production of precipitation across the equator during OMI phases 3 through 5. 4. CHARACTERISTICS OF CONVECTIVE FEATURES Convective features were tracked within the simulation using a 3-dimensional watershed image segmentation technique. Distinct regions with cloud condensate concentrations of greater than 1 gram per kilogram were initially identified, then, if associated with surface precipitation rates of greater than 5 mm/hour, the cells were declared convective and tracked throughout their life cycle. The resultant convective feature tracks cover a majority of the domain, and appear to align well with the climatology of the region (Figure 3) (Mori et al., 2004; Wang et al., 2004; Chang et al., 2005; Qian, 2008; Moron et al., 2009). Various convective regimes are apparent, including the continental monsoonal maximum in Indochina, northeastward propagating cells tracking from Sumatra toward Borneo, and northwestward propagating mesoscale convective systems west of the Philippines. By extracting the frequencies of variability in convective cell characteristics associated with the regional BSISO wave (Figure 4), numerous conclusions and additional hypotheses arise:
1. The number and median size of convective cells is dependent on the BSISO phase. However, while the influence of the BSISO on the number of convective cells increases during convectively active phases, its influence on the median cell size is maximized during the convectively inactive phases.
2. While the amplitude of the diurnal cycle of convective cell size is positively correlated with the magnitude of BSISO influence, the amplitude of the diurnal cycle in convective cell number is relatively constant throughout the simulation. This suggests that a positive feedback may exist between the influences of the BSISO and diurnal cycle on the median cell size, but the diurnal cycle in the number of cells is largely independent of the BSISO.
5. CONCLUSIONS The mesoscale features of the convective dipole associated with the BSISO were analyzed using a cloud-resolving simulation of a canonical BSISO event. The July/August 2016 BSISO event, defined by a persistent convective signal within both the OMI and Bimodal ISO Indices, exhibited prominent northward and eastward propagating components within GPM IMERG surface precipitation data. These regional-wave features were replicated within the simulation, aside from a prominent
increase in equatorial precipitation during phases 4 and 5 of the BSISO. Using a 3-dimensional watershed image segmentation method, we identified convective cells and tracked them throughout the simulation, recording characteristics such as the cell size, longevity, and ambient atmospheric environment. Various convective regimes are apparent, including the continental monsoonal maximum in Indochina, northeastward propagating cells tracking from Sumatra toward Borneo, and northwestward propagating mesoscale convective systems west of the Philippines. The influence of the BSISO on the number and size of convective cells was investigated by isolating the anomalies associated with frequencies characteristic of the BSISO. It was found that the BSISO does influence the number and size of convective cells. While the BSISO contributes an increased number of convective cells during active phases of the BSISO, its contributions to convective cell size are maximized during the suppressed phases.
Figure 4. Number (blue) and median size (red) of convective cells throughout the simulation. The thicker lines show contributions from waves with periods of greater than 15 days, while the thinner lines show the diurnal cycle. Nighttime is shaded in gray. The wave amplitude is normalized by the following factors for each respective variable: number of cells = 75; median cell size = 700 km3. Time progresses counter-clockwise, and the phase of the BSISO is listed along the periphery of the arc.

6. REFERENCES
1. Bukowski, Jennie, D. J. Posselt, J. S. Reid, and S. A. Atwood, 2017: Modes of vertical thermodynamic and wind variability over the Maritime Continent. Atmospheric Chemistry and Physics, 17, 4611-4626.
2. Chang, C., Z. Wang, J. McBride, and C. Liu, 2005: Annual Cycle of Southeast Asia—Maritime Continent Rainfall and the Asymmetric Monsoon Transition. J. Climate, 18, 287–301.
3. Cotton, W.R., R.A. Pielke, Sr., R.L. Walko, G.E. Liston, C.J. Tremback, H. Jiang, R.L. McAnelly, J.Y. Harrington, M.E. Nicholls, G.G. Carrio, J.P. McFadden, 2003: RAMS 2001: Current status and future directions. Meteor. Atmos. Physics, 82, 5-29.
4. Jiang, X., T. Li, and B. Wang, 2004: Structures and Mechanisms of the Northward Propagating Boreal Summer Intraseasonal Oscillation. J. Climate, 17, 1022–1039.
5. Lawrence, D.M. and P.J. Webster, 2002: The Boreal Summer Intraseasonal Oscillation: Relationship between Northward and Eastward Movement of Convection. J. Atmos. Sci., 59, 1593–1606.
6. Lee, June-Yi, B. Wang, M. C. Wheeler, X. Fu, D. E. Waliser, and I. Kang, 2013: Real-time multivariate indices for the boreal summer intraseasonal oscillation over the Asian summer monsoon region. Climate Dynamics, 40, 493-509.
7. Kikuchi, K., B. Wang, and Y. Kajikawa, 2012: Bimodal representation of the tropical intraseasonal oscillation. Climate Dynamics, 38, 1989-2000.
8. Kiladis, G.N., J. Dias, K.H. Straub, M.C. Wheeler, S.N. Tulich, K. Kikuchi, K.M. Weickmann, and M.J.
Ventrice, 2014: A Comparison of OLR and Circulation-Based Indices for Tracking the MJO. Mon. Wea. Rev., 142, 1697–1715.
9. Mori, S., H. Jun-Ichi, Y.I. Tauhid, M.D. Yamanaka, N. Okamoto, F. Murata, N. Sakurai, H. Hashiguchi, and T. Sribimawati, 2004: Diurnal Land–Sea Rainfall Peak Migration over Sumatera Island, Indonesian Maritime Continent, Observed by TRMM Satellite and Intensive Rawinsonde Soundings. Mon. Wea. Rev., 132, 2021–2039.
10. Moron, V., A. Lucero, F. Hilario, B. Lyon, A. W. Robertson, D. DeWitt, 2009: Spatio-temporal variability and predictability of summer monsoon onset over the Philippines. Climate dynamics, 33, 1159-1177.
11. Qian, J., 2008: Why Precipitation Is Mostly Concentrated over Islands in the Maritime Continent. J. Atmos. Sci., 65, 1428–1441.
12. Saleeby, S.M., and S.C. van den Heever, 2013: Developments in the CSU-RAMS Aerosol Model: Emissions, Nucleation, Regeneration, Deposition, and Radiation. J. Appl. Meteor. Climatol., 52, 2601-262.
13. Smith, Eric A. and coauthors, 2007: International global precipitation measurement (GPM) program and mission: An overview. Measuring precipitation from space. Springer Netherlands, 611-653.
14. Straub, K.H. and G.N. Kiladis, 2003: Interactions between the Boreal Summer Intraseasonal Oscillation and Higher-Frequency Tropical Wave Activity. Mon. Wea. Rev., 131,945–960.
15. Wang, B., LinHo, Y. Zhang, and M. Lu, 2004: Definition of South China Sea Monsoon Onset and Commencement of the East Asia Summer Monsoon. J. Climate, 17, 699–710.