Embed Size (px)
Citation preview

A. Peña-Ayala (Ed.): Educational Data Mining: Applications and Trends, SCI 16, pp. 1–30.
springerlink.com © Springer-Verlag Berlin Heidelberg 2013
Chapter 16
Collaborative Learning of Students in Online Discussion
Forums: A Social Network Analysis Perspective
Reihaneh Rabbany1, Samira ElAtia2, Mansoureh Takaffoli1, and Osmar R. Zaïane1
1 Department of Computing Science, 2 Campus Saint Jean
University of Alberta, Edmonton, Canada
{rabbanyk, selatia, takaffol, zaiane}@ualberta.ca
Abstract. Many courses are currently delivered using Course Management Sys-
tems (CMS). Discussion forums within these systems provide the basis for col-
laborative learning. In this chapter, we present the use of Social Network Analy-
sis (SNA) to analyze the structure of interactions between the students in these
forums. Various metrics are introduced for ranking and determining roles, while
clustering and temporal analysis techniques are applied to study the student com-
munications, the forming of groups, the role changes, as well as scrutinizing the
content of the exchanged messages. Our approach provides the instructor with
better means to assess the participation of students by 1) identification of partic-
ipants' roles; 2) dynamic visualization of interactions between the participants
and the groups they formed; 3) presenting hierarchy of the discussed topics; and
4) tracking the evolution and growth of these patterns and roles over time. The
applicability of the proposed analyses are illustrated through several case studies.
Keywords. Social Network Analysis, Student Participation Assessment, Student
Monitoring, Content Summarization, Discussion Forums
16.1 Introduction
There is a growing number of courses delivered using e-learning environments both
using computer-supported collaborative learning (CSCL) tools: such as Moodle,
WebCT and Blackboard, or massive open online course (MOOC) delivery systems,
such as Coursera, Udacity, and EdX. Online asynchronous discussions in these envi-
ronments play an important role in collaborative learning processes of students.
Through interaction, students become more actively engaged in sharing information
and perspectives with each other [1]. These e-learning course adds-on environment pro-
vide a fertile ground for independent learning and a wealth of information that teachers
can use to enhance teaching and learning.
More than four decades now, several studies have investigated and emphasized the
benefits of collaborative learning in general. CSCL, in particular, offers a unique media
2 R. Rabbany et al.
for collaborative learning activities, where peer and independent learning as well as
peer feedback are thriving, i.e., threaded discussion forums. Consequently, there is a
theoretical emphasis in CSCL literature on the role of threaded discussion forums for
collaborative learning activities [2]. Even basic CSCL tools enable the development of
these threads where the learners could access text, revise it or reinterpret it; which allow
them to connect, build, and refine ideas, along with stimulating deeper reflection [2].
From a teacher’s perspective, these types of activities provide insight into the quality
of learning and teaching. By being able to assess on a general level without much in-
tervention from the teacher, s/he can actually have a better grasp of what has been
learned and what challenges the students are still having during the course. The teacher
then can benefit from the information accumulated through the students’ interactions
to build a diagnostic assessment model that would allow for directing both teaching and
learning. By working independently on these assignments, students engage in a
self/peer-learning process that help demonstrate what they have acquired in the course.
The element of pressure from being observed by the teacher is lessened, and students
are more comfortable seeking help from each other on matters they are still struggling
with. It is in a way, a great tool for inductive learning/teaching where students come to
grasp with the concepts being studied.
However, a large amount of messages/entries are generated within few weeks within
these forums, often containing lengthy discussions bearing many interactions between
students. This amount of generated data can be overwhelming to teachers who want to
monitor and assess these interactions in these forums. Given this situation, CSCL tools,
should provide means to facilitate the instructors’ task of evaluating students input. It
would be time consuming and even impossible for teachers to manually analyze this
data. Moreover, the magnitude of this information deluge is even more accentuated
with the advent and quick popularity of MOOCs where thousands of learners can take
a course at the same time [3].
On the other hand, current CSCL tools do not provide much information regarding
the participation of students and structure of interactions between them in discussion
threads. In many cases, only some statistical information is provided such as frequency
of postings, which is not a sufficient or even useful measure for interaction activity [1].
This means that the instructors who are using these tools, do not have access to con-
venient indicators that would allow them to evaluate the participation and interaction
in their classes [4]. Instructors usually have to monitor the discussion threads manually
which is hard, time consuming, and prone to human error and in the case of MOOCs,
manual monitoring is hardly possible.
There exists a large body of research on studying the participation of students in such
discussion threads using traditional research methods: content analysis, interviews, sur-
vey observations and questionnaires [5]. These methods try to detect the activities that
students are involved in while ignoring the relations between students. For example,
content analysis methods, as the most common traditional methods, provide deep in-
formation about specific participants. However, they neglect the relationships between
the participants while their focus is on the content, not on the structure [4].
In order to fully appreciate the participation of students, we need to understand their
patterns of interactions and answer questions like who is involved in each discussion,

16 Collaborative Learning of Students in Online Discussion Forums 3
who is the active/peripheral participant in a discussion thread [5]. The practicality of
social network analysis methods in CSCL is demonstrated in [6-8], as methods for ob-
taining information about relations, fundamental structural and collaborative patterns.
Moreover, there is a recent line of work on applying social network analysis techniques
for evaluating the participation of students in online courses e.g. [1], [4-5], [9-11]. The
major challenges these attempts tried to tackle are: extracting social networks from
asynchronous discussion forums (might require content analysis), finding appropriate
indicators for evaluating participation (from education's point of view) and measuring
these indicators using social network analysis. As clarified in the background and re-
lated works section, none of these works provides a complete or specific mechanism or
framework for analyzing discussion threads. However, they attempted to address one
of these challenges to some extent.
In the rest of this chapter, we elaborate on the importance of social network analysis
for mining structural data in the field of computer science and its applicability to the
domain of education specifically for evaluating collaborative learning of students
within the media of discussion forums. This chapter is an extension of our earlier works
in [12-13], where we first introduced Meerkat-ED. Meerkat-ED is a specific and prac-
tical toolbox for analyzing interactions of students in asynchronous discussion forums
of online courses. Through our case studies we present how Meerkat-ED analyzes both
the structure and content of these interactions using social network analysis techniques
including community mining. Which gives the instructor a quick view of what is dis-
cussed in these forums, what are the topics, and how much each student has participated
in these topics and how they collaborated on each discussion. In the following, we first
introduce some basic concepts in social network analysis. We then illustrate two infor-
mation networks that can be extracted from an on-line course and discuss different
structural analyses that can be performed on these networks. Finally we present Meer-
kat-ED – a comprehensive social network analysis toolbox specific for analysis of
online courses and illustrate its practicality on our case study data.
16.2 Background and Related Works
In this section, we first overview the two recent paradigm shifts in Education: the first
one in the method of learning shifted toward collaborative learning and the second on
in the mode of delivery shifted toward e-learning. After educational background on
collaborative learning and e-learning, we then we review the background on social net-
works analysis, its major techniques. Finally we survey relevant research that use these
techniques to assess collaboration of students and individuals’ level of participation in
(discussion threads i.e. a means for collaborative learning) a course.
16.2.1 On Collaborative learning and e-learning: An Educational Perspective
In the last fifty years, we witnessed two major shifts in education: the first one in the
relationship between students and teacher and second on in the mode of delivery. In the
first one, higher education is no longer one way method of learning/teaching, where a

4 R. Rabbany et al.
teacher lectures and students listen, and learn individually, and where the focus is
mostly on the lower levels of the cognitive domains. It is now a two-way approach to
learning, where the classical teacher is replaced with a facilitator and where the focus
is on working in groups collaboratively in problem solving, finishing various tasks and
projects, and on creating and innovating. The second shift, deals with the mode of de-
livery. We are no longer bound with the classical classroom and library. E-learning and
social networking as tools of interaction and as platform to working in groups are pre-
sent more in our lives than ever in history. Both two shifts are interconnected and we
are witnessing a major paradigm shift in education where the two converge into one
major change in education.
Collaborative learning fosters learning and e-learning. When a student works in col-
laborative situation, s/he is able to perform intellectually at a much higher level of
thinking1 [15]. As Gokhale [16] advocates, “the peer support system makes it possible
for the learner to internalize both external knowledge and critical thinking skills.” When
working in groups, we are faced with different perspectives and interpretations that
each member in the group brings in to the work. Gokhale [17] contends that collabora-
tive learning yields significantly better learning results, particularly at higher levels of
critical of thinking. Bruner [17] further argues, collaborative and/or cooperative learning
methods improve problem-solving strategies. Pantiz [18] lists many benefits to collab-
orative learning that could be categorizes into social, psychological, and academic
level. For the academic benefits group, Laal and Ghodsi [19] make two distinction: the
first group deals with the student’s own learning benefit; in the second group, collabo-
rative learning brings in a new ways for assessment and interaction between teacher
and students.
Threaded discussion forums offer a unique media for collaborative learning activi-
ties, where peer and independent learning as well as peer feedback are thriving. Ana-
lyzing the structure and quality of these messages gives indications of higher-order
thinking and a clearer insight into collaborative learning [20]. Therefore there are many
literature with a theoretical emphasis on the role of threaded discussion forums in col-
laborative learning activities in CSCL [2], however the empirical studies are rather lim-
ited [21]. Many visualization approaches have been investigated to support analysis of
these forums, mainly focusing on one discussion or one thread, a comparison of these
could be found in [20]. Here we investigate monitoring and assessing the collaborative
activities of students within these forums using the power of social networks.
16.2.2 Social Networks: A Data Mining Perspective
Social networks are first introduced in social and behavioural sciences and focus on
relations between entities and patterns of these relations. Social Networks are formally
defined as a set of actors which are tied by one or more types of relations [21]. The
actors are most commonly persons or organizations, however, they could be any entities
1 We are using the levels of the learning domains from Bloom’s taxonomy [14]. According to
Bloom, the cognitive domain is divided into the following six levels of thinking/learning:
Knowledge, comprehension, application, analysis, synthesis and evaluation.

16 Collaborative Learning of Students in Online Discussion Forums 5
such as web pages, countries, proteins, documents, etc. There could also be many dif-
ferent types of relationships, to name a few, collaborations, friendships, web links, ci-
tations, information flow, etc. These relations are represented by the edges in the net-
work connecting the actors and may have a direction indicating the flow from one actor
to the other; and a strength denoting how much, how often, or how important the rela-
tionship is. See Fig. 16.1 as an example.
Fig. 16.1. Social network of students interacting in an online discussion forum. Nodes represent
actors or students, while an edge from a student to the other summarizes messages sent in that
direction and the thickness of that edge corresponds to the number of messages sent.
Social Network Analysis.
Unlike proponents of attribute based social sciences, social network analysts argue that
causation is not located in the individuals, but in the social structure [22]. Social net-
work analysis is the study of this structure. Rooted in sociology, nowadays, social net-
work analysis has become an interdisciplinary area of study, including researchers from
anthropology, communications, computer science, education, economics, criminology,
management science, medicine, political science, and other disciplines [22]. For exam-
ple in medicine, it is used to understand the progression of the spread of an infectious
disease [23]; in criminology, it is an important part of a conspiracy investigation and
identifying the nature and extent of conspiratorial involvement [24]; or in education it
is helpful in monitoring interactions and participation of students in online courses [7].
Social network analysis examines the structure and composition of ties in a given
network and provides insights into its structural characteristics. There are several anal-
yses that could be done on social networks. The most common analysis is ranking in-
dividuals based on different centrality measures to find actors with the most prestige,
influence, prominence or to detect the outlier actors. The general statistics of the net-
work itself could also be insightful, such as, the density i.e. proportion of possible ties
that actually exist in the network, or the clustering coefficient, i.e., how much actors
tend to group together. The actors that are communicating more often with each other,
are called communities and could be detected using a communing mining approach.
6 R. Rabbany et al.
The other upcoming trend is dynamic analysis of networks to examine the evolution
of networks over time, which is useful to predict changes or to make recommendations
based on the social structure of actors. Based on the application in hand, one could also
perform many further analyses, for example, to examine the flow and diffusion of in-
formation within the network and to find actors that are involved in passing information
through the network. In the following, we elaborate more on some of these structural
analyses that are useful in our analysis of educational discussion forums.
Centrality of a node in a network/community measures its relative importance
within that network/community. There are many measures defined for measuring cen-
trality in social networks. The three most common ones are namely degree centrality,
betweenness centrality, and closeness centrality. The degree centrality of a node simply
measures the number of edges incident upon that node which implies to some extent
the popularity of that node in the network; In Fig. 16.1, size of nodes corresponds to
their degree centralities. The betweenness centrality, represents the control of a node
over communication within its community which measures the number of shortest
paths between any other nodes that have to pass through this node. Actors/nodes with
high betweenness centrality tend to be the hubs in the network connecting different
groups of actors, i.e. communities. On the basis of which, they are often called media-
tors. The closeness centrality, on the other hand, ranks nodes based on their position in
the network -- how fast they can spread the information to the whole network, which
can be estimated by averaging shortest paths from this node to all the other nodes.
Detecting communities: Densely connected actors have been pursued by sociolo-
gists for many decades. More recently, it has also attracted attention from physicists,
applied mathematicians and computer scientists [25] as a result of its significant prac-
tical importance. The availability and growth of large datasets of information networks
makes community detection a very challenging research topic in social networks anal-
ysis. This line of research resembles well-studied clustering methods in machine learn-
ing. However, clustering approach in machine learning is closer to individualist ap-
proach in social sciences, as they both focus on the attributes of data entities. This
interest resulted in the emergence of a variety of different community detection ap-
proaches, e.g. Clique percolation [26], FastModularity [27] and Local [28]; refer to [29]
for a recent survey. For instance, [26] proposed clique Percolation method, known as
CFinder, to partition networks into overlapping communities. Based on the observation
that edges within communities are likely to form cliques, they defined a community as
the union of adjacent cliques.
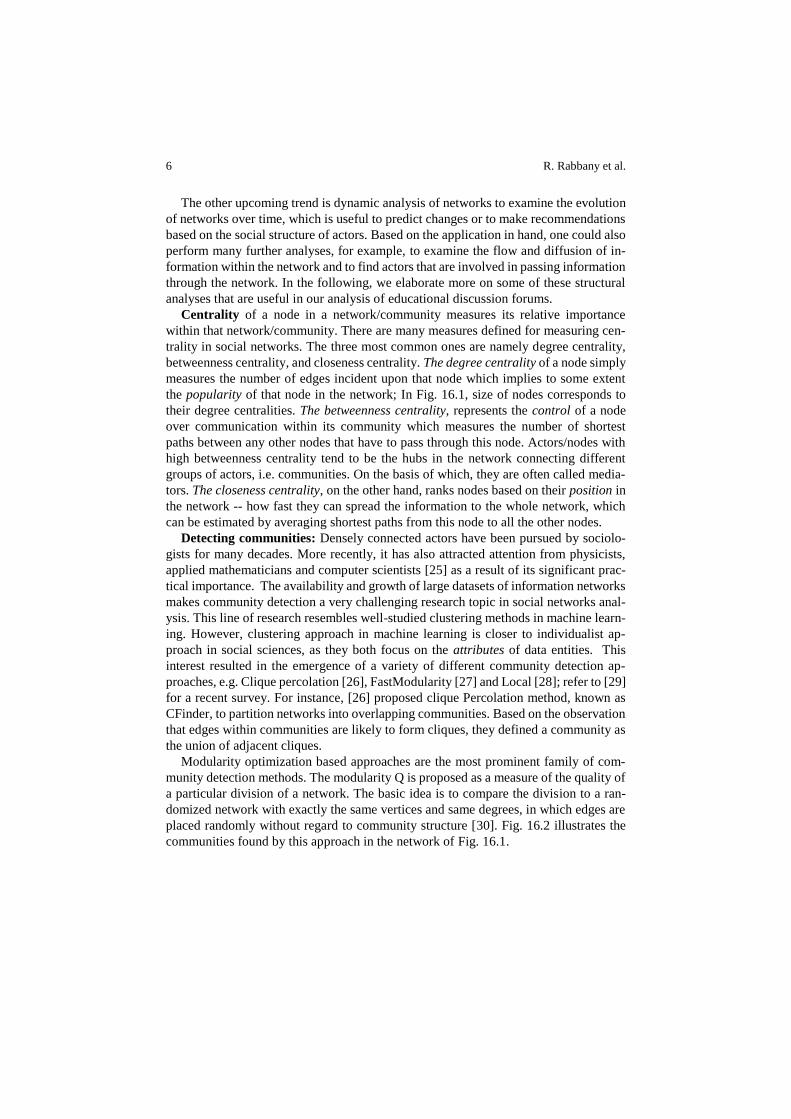
Modularity optimization based approaches are the most prominent family of com-
munity detection methods. The modularity Q is proposed as a measure of the quality of
a particular division of a network. The basic idea is to compare the division to a ran-
domized network with exactly the same vertices and same degrees, in which edges are
placed randomly without regard to community structure [30]. Fig. 16.2 illustrates the
communities found by this approach in the network of Fig. 16.1.
16 Collaborative Learning of Students in Online Discussion Forums 7
Fig. 16.2. Communities detected by FastModularity approach in the social network of students
interacted in the online discussion forum. Different colours represent the three different com-
munities of students that communicated mostly within themselves throughout the course.
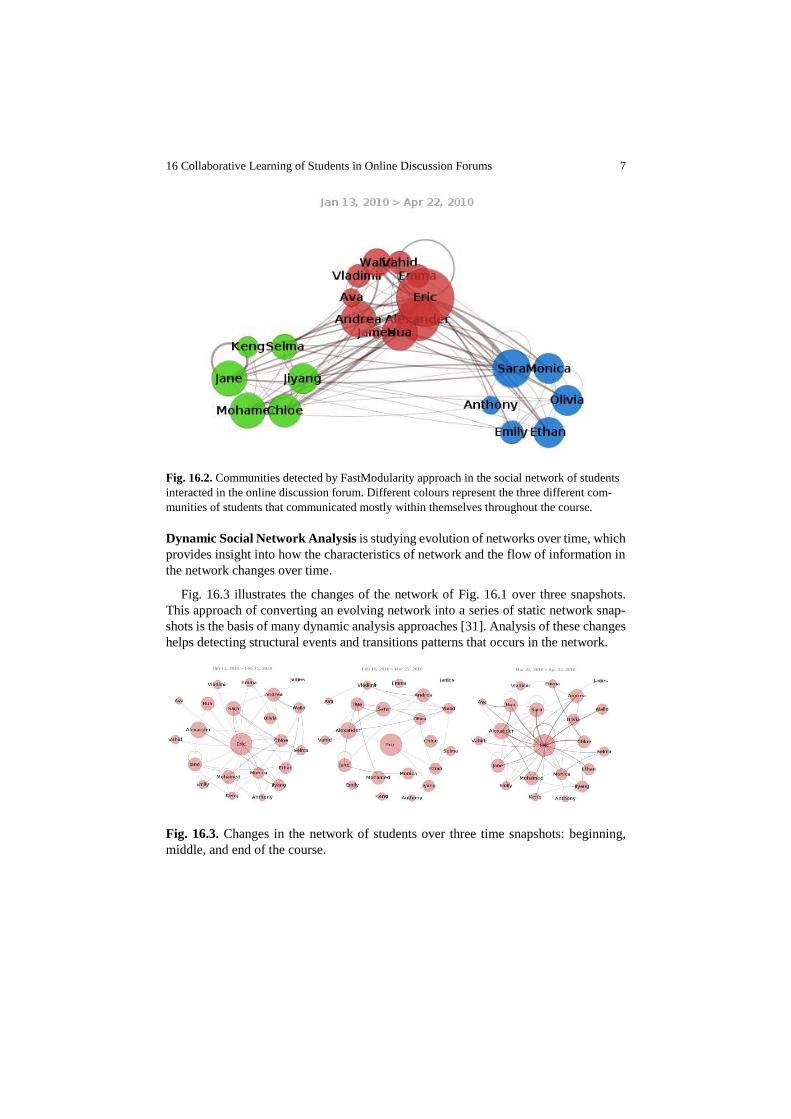
Dynamic Social Network Analysis is studying evolution of networks over time, which
provides insight into how the characteristics of network and the flow of information in
the network changes over time.
Fig. 16.3 illustrates the changes of the network of Fig. 16.1 over three snapshots.
This approach of converting an evolving network into a series of static network snap-
shots is the basis of many dynamic analysis approaches [31]. Analysis of these changes
helps detecting structural events and transitions patterns that occurs in the network.
Fig. 16.3. Changes in the network of students over three time snapshots: beginning,
middle, and end of the course.
8 R. Rabbany et al.
16.2.3 Social Network Analysis of Online Educational Forums: Related Works
In the following we review the related work specific to social network analysis of asyn-
chronous discussion forums in online courses offered using e-learning environments
particularly to assess participation of students. We first overview the related work to
how to extract the social network from the e-learning forums, and then we summarize
different measures they defined for assessing effective participation.
CSCL tools, used to provide e-learning environments, usually record log files that
contain the detailed actions made by learners. These log files include information about
the activity of the participants in the discussion forums [1], [4-6], [11] used the log files
to extract the social network underneath of discussion threads. Laghos et al. [11] stated
that they considered each message as directed to all participants in that discussion
thread while others considered it as only directed to the previous message. Fig. 16.1
shows a network extracted using the latter approach, which we used in our analysis.
Gruzd et al. [32-33] proposed an alternative and more complicated way of extracting
social networks, called named network. They argue that using this common method
(connecting a poster to the previous poster in the thread) would result in losing much
of the connections. Their approach briefly is: first using named entity recognition to
find the nodes of the network, then counting the number of times that each name is
mentioned in posts by others to obtain the ties, and finally weighting these ties by the
amount of information exchanged in the posts. However, their final reported results are
not that promising and even obtaining those results required many manual corrections
during the process.
More recently, Dawson et al. [9, 34] developed a cross platform toolbox called
SNAPP which is able to capture the discussion threads of different CSCL platforms
from their content in the web browser. However this crawling process is very time con-
suming compared to reading an input log file. Regarding what we should consider as
the participation in extracting the social network, Hrastinski [35] suggested that apart
from writing, there are other indicators of participation like accessing the e-learning
environment, reading posts or the quantity and quality of the writing. Particularly, one
might construct the network by linking the author of a message and all other participants
whom read that message. However, all of methods mentioned above extract networks
just based on posts by student -- writing level.
For measuring the effectiveness of participation, Daradoumis et al. [36] defined high
level weighted (showing the importance) indicators to represent collaboration learning
process; task performance, group functioning, social support, and help services. They
further divided these indicators to skills and sub-skills, and assigned every sub-skill to
an action. For example, group functioning is divided into: active participation behav-
iour, task processing, communication processing, etc. On the other hand, communica-
tion processing is itself divided into more sub-skills: clarification, evaluation, illustra-
tion, etc. and clarification is then mapped to the action of changing description of a
document.
In the education context, Calvani et al. [2] defined 9 indicators for measuring the
effectiveness of participation to compare different groups within a class; extent of par-

16 Collaborative Learning of Students in Online Discussion Forums 9
ticipation (number of messages ), proposing attitude (number of messages with pro-
posal label), equal participation (variance of messages for users), extent of role (portion
of roles used), rhythm (variance of daily messages per day), reciprocal reading (portion
of messages that have been read), depth (average response depth), reactivity to proposal
(number of direct answers to messages with proposal label) and conclusiveness (num-
ber of messages with conclusion label); all summarized for the group interactions and
compared relatively to the mean behaviour of all groups. Similarly, Nandi et al. [21],
review the necessity of evaluating the interaction of students in the discussion forums,
proposing a set of criteria for evaluating the interactions, including use of social cues
or emotions to engage, and the consistency of participation.
However, for measuring the effectiveness of participation, most of the previous
works simply use general social network measures (different centrality measures, be-
tweenness, etc.), available in one of the common generic social network analysis
toolboxes. [10], [5], [4], and [1] used UCINET [37]; [11] used NetMiner [38]; finally
[9], and [34] developed their own SNA toolbox which offers simple visualization and
limited analyses, basically a subset of the analyses we are presenting in this Chapter.
There are recent studies investigating the correlation between level of participation of
students in the discussion forums and their final grades, for example see [39]. Another
work that could be mentioned here is that of Stewart et al. [40] on applying similar
techniques to clinical online forums in order to compare participation of institutions
and professions.
16.3 Network Analysis in E-Learning
In this section, we illustrate the practicality of social network analysis in analyzing in-
formation networks underlying e-learning environments. Particularly we focus on two
types of networks, the network of interactions between students in a course and the
network of terms they have used in their interactions. These networks could be ex-
tracted from any e-learning environment and analyzing these networks is helpful in
monitoring the students, evaluating their participation in the course, detecting periph-
eral and central students, etc. Here we describe different analysis on each of these two
networks.
16.3.1 Students Interaction Network
The network of interactions between students summarizes all the interactions that
occurred during the course. Visualizing this network provides an easy way for the in-
structor to monitor the structure of these interactions, examine which students are the
leaders, and who are the peripheral students. Here, we first describe how the network
is extracted based on the information from the discussion threads. Then, we continue
by bringing an analysis of leadership of the students, the collaborative groups of stu-
dents, and also dynamic analysis of these aspects. In the students’ interaction network,
each node stands for a student and edges between nodes encode interactions between
the students. Fig. 16.4 illustrates an example of a student interaction network.

10 R. Rabbany et al.
Fig. 16.4. Visualization of network of students interacting in an online discussion forum. Nodes
represent actors or students, edges the interactions, and the thickness of an edge corresponds to
the volume of the interaction.
Here, we extracted the network from the discussion forums recorded in the e-learn-
ing environment. Consequently, edges correspond to exchange written messages. These
edges are weighted by the number of messages passed between the two incident stu-
dents. This network could be built either directed or undirected. In the directed model,
each message is considered connecting the author of the message to the author of its
parent message, while in the undirected network, each edge contains all the correspond-
ences between the two students, see Fig. 16.5. Each interaction edge incorporates sev-
eral messages. This visualization of the structure of the interactions in the course pro-
vides an overall view of the underlying structure of the communications in the course,
and an apparent way to examine them.
Size of the nodes in Fig. 16.4 corresponds to their centrality in the network. Since
centrality measures the relative importance, the leadership and influence of students in
the discussions could be compared by analyzing the centrality of nodes corresponding
to them in the network. Consequently, students could be ranked explicitly in a concen-
tric centrality graph in which the more central/powerful the node is, the closer it is to
the center, see Fig. 16.6. This ranking of the students clearly distinguishes how active
students are in the course and outlines the peripheral students.

16 Collaborative Learning of Students in Online Discussion Forums 11
Fig. 16.5. Each interaction edge consists of several messages. This Figure investigates the content
of messages in the interaction edge between two students -- Chloe and Eric.
Fig. 16.6. Ranking students based on their centrality in the students interaction network. Students
closer to the center are more central in the student network, i.e., have participated more in the
discussions of the course. Likewise, the further from the center, the less the student was active.
12 R. Rabbany et al.
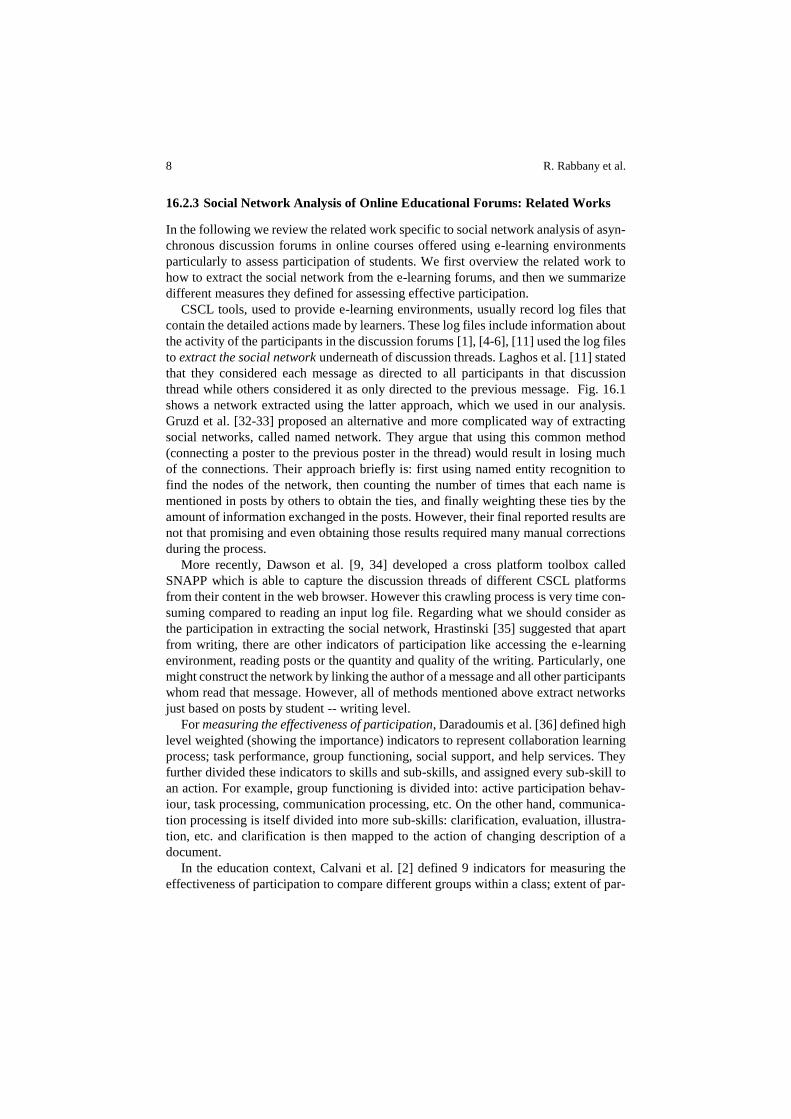
Fig. 16.7. Changes of students' roles during the course. We could see this overall pat-
tern that in the middle snapshot, students tend to be less active. We could also focus
in each of the students and monitor how he/she is changing his behaviour throughout
the course.
All the analyses mentioned so far on the students’ interaction network can be performed
in consecutive timestamps. This dynamic analysis demonstrates how the interactions,
the students’ roles and the collaboration groups are changing over time. Particularly,
the dynamic analysis of the ranking of students illustrates changes in the roles and the
activeness of students during the course; which can be seen in Fig. 16.7.
This systematic monitoring can produce an effective vision for the instructor and/or
students about the flow of the course, which can be used to recommend and implement
necessary changes. For instance this monitoring can alert the instructor about the unu-
sual low participation of some students in some periods of time. Also it can be used to
detect students that are losing interest in the course and recommend and intervene to
motivate them to engage more.
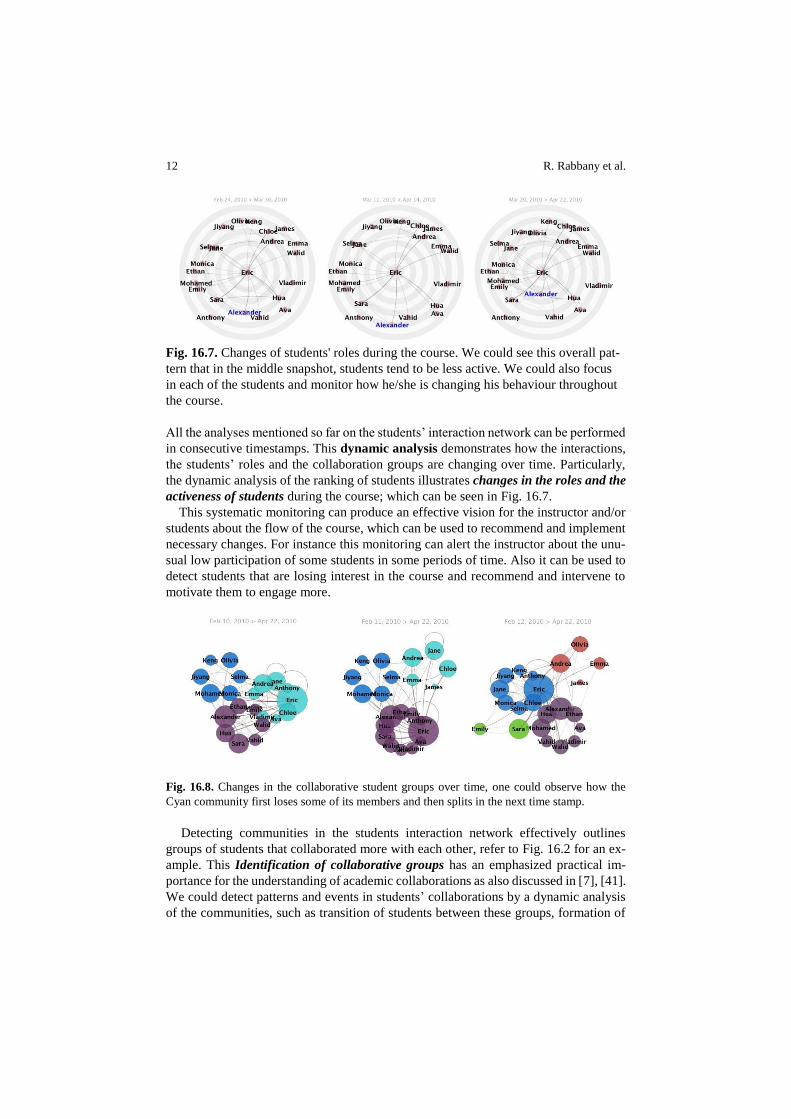
Fig. 16.8. Changes in the collaborative student groups over time, one could observe how the
Cyan community first loses some of its members and then splits in the next time stamp.
Detecting communities in the students interaction network effectively outlines
groups of students that collaborated more with each other, refer to Fig. 16.2 for an ex-
ample. This Identification of collaborative groups has an emphasized practical im-
portance for the understanding of academic collaborations as also discussed in [7], [41].
We could detect patterns and events in students’ collaborations by a dynamic analysis
of the communities, such as transition of students between these groups, formation of

16 Collaborative Learning of Students in Online Discussion Forums 13
new discussion groups and much more. Such events can affect participation and en-
gagement of students in the course and detecting these events could be used to make
proper recommendation to modify students’ behaviours affected by these changes. For
instance a community split is detected in Fig. 16.8, and it can be predicted that the
participation level of the detached students would drop, accordingly, they could be rec-
ommended and/or invited by one of the remaining collaboration groups to join and en-
gage in their discussions.
16.3.2 Term Co-occurrence Network
In addition to the different analyses on the structure of interactions between the stu-
dents, content analysis of these interactions could yield to more profound realization
about the essence of engagement of students. With this in mind, we have extracted the
network of terms used by students in their interactions. In this network, nodes are terms
and edges are their co-occurrence in the same context, i.e. same sentence. Building such
network has previously been discussed for different purposes such as improving the
results of a search engine [42]. In fact it has been observed that different sets of terms
are used to discuss different topics and therefore, word sense community detection can
frame the topics. Here we discuss different analyses that can be done using this term
co-occurrence network.
Fig. 16.9. Visualization of network of terms used in an online discussion forum. Nodes represent
noun phrases, edges their co-occurrence, and the thickness of an edge corresponds to the fraction
of times they have been used in the same sentence. Filtering this graph on term frequency and/or
topics can weed out irrelevant terms.
14 R. Rabbany et al.
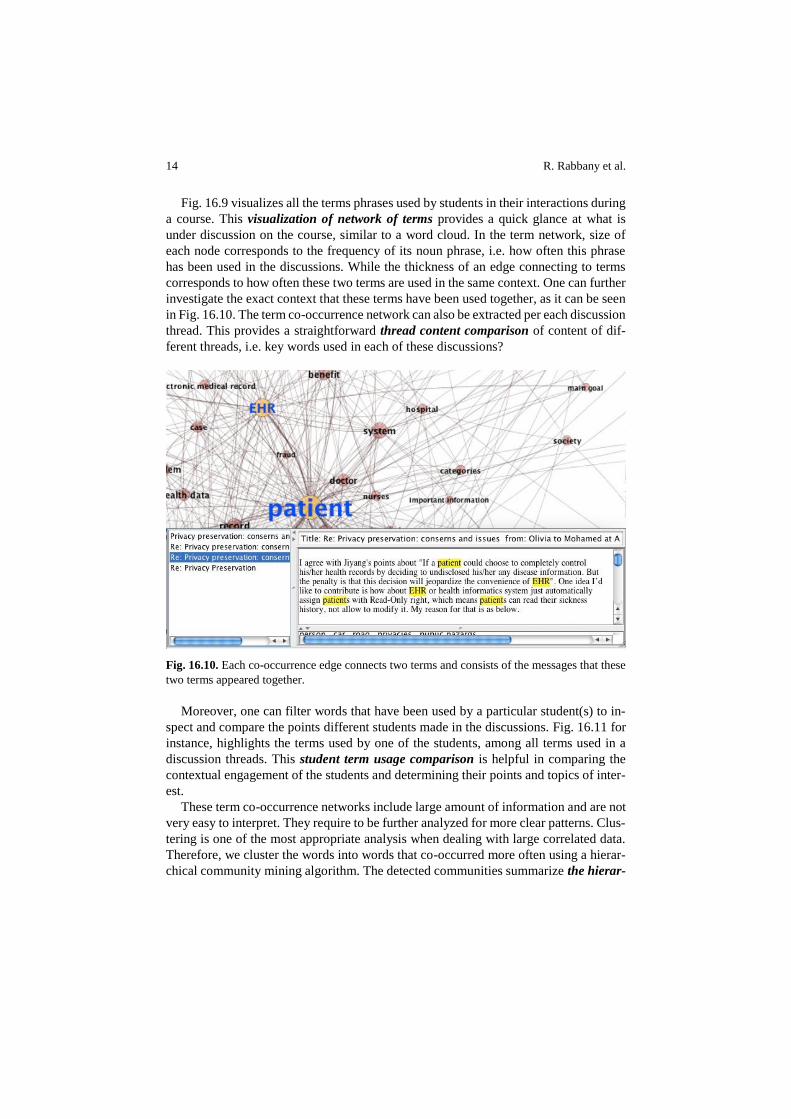
Fig. 16.9 visualizes all the terms phrases used by students in their interactions during
a course. This visualization of network of terms provides a quick glance at what is
under discussion on the course, similar to a word cloud. In the term network, size of
each node corresponds to the frequency of its noun phrase, i.e. how often this phrase
has been used in the discussions. While the thickness of an edge connecting to terms
corresponds to how often these two terms are used in the same context. One can further
investigate the exact context that these terms have been used together, as it can be seen
in Fig. 16.10. The term co-occurrence network can also be extracted per each discussion
thread. This provides a straightforward thread content comparison of content of dif-
ferent threads, i.e. key words used in each of these discussions?
Fig. 16.10. Each co-occurrence edge connects two terms and consists of the messages that these
two terms appeared together.
Moreover, one can filter words that have been used by a particular student(s) to in-
spect and compare the points different students made in the discussions. Fig. 16.11 for
instance, highlights the terms used by one of the students, among all terms used in a
discussion threads. This student term usage comparison is helpful in comparing the
contextual engagement of the students and determining their points and topics of inter-
est.
These term co-occurrence networks include large amount of information and are not
very easy to interpret. They require to be further analyzed for more clear patterns. Clus-
tering is one of the most appropriate analysis when dealing with large correlated data.
Therefore, we cluster the words into words that co-occurred more often using a hierar-
chical community mining algorithm. The detected communities summarize the hierar-

16 Collaborative Learning of Students in Online Discussion Forums 15
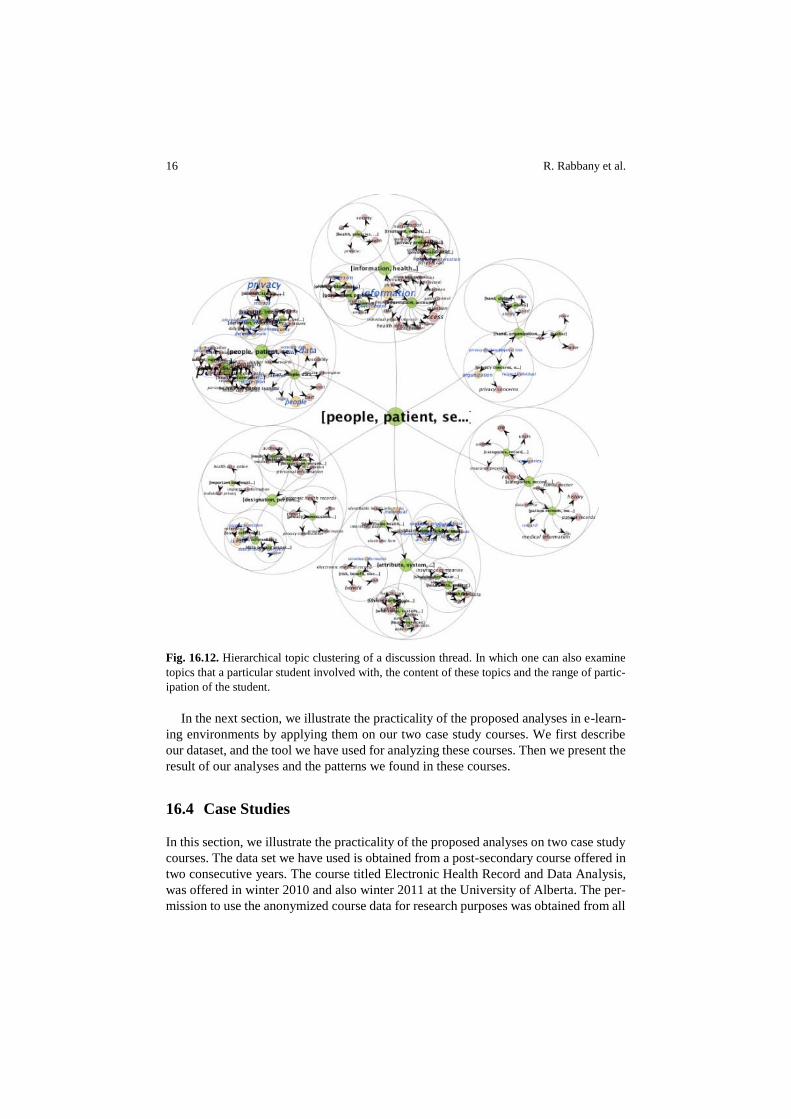
chy of the discussed topics in the course. This analysis can also be performed per spe-
cific discussion thread to obtain thread topic comparison. Fig. 16.12 illustrates the
structure of hierarchical topics discovered for the discussion thread of Fig. 16.11.
Additionally, these topics could be filtered for a specific student(s) to outline his/her
topics of interest and involvement. This student topic involvement comparison is illus-
trated in Fig. 16.12. Using this approach, we could compare the range of participation
of different students and detect students who participated in a wider range of topics. In
like manner, we could also filter and rank students by their participation in a particular
topic. This Ranking of students by their level of engagement in each topic can be used
to recommend the less active students to engage more on that particular topic.
Fig. 16.11. Examining words used by a particular student in one of the discussion threads in an
e-learning course. This can be used to determine and compare interest of different students as
well as their level of participation.
16 R. Rabbany et al.
Fig. 16.12. Hierarchical topic clustering of a discussion thread. In which one can also examine
topics that a particular student involved with, the content of these topics and the range of partic-
ipation of the student.
In the next section, we illustrate the practicality of the proposed analyses in e-learn-
ing environments by applying them on our two case study courses. We first describe
our dataset, and the tool we have used for analyzing these courses. Then we present the
result of our analyses and the patterns we found in these courses.
16.4 Case Studies
In this section, we illustrate the practicality of the proposed analyses on two case study
courses. The data set we have used is obtained from a post-secondary course offered in
two consecutive years. The course titled Electronic Health Record and Data Analysis,
was offered in winter 2010 and also winter 2011 at the University of Alberta. The per-
mission to use the anonymized course data for research purposes was obtained from all
16 Collaborative Learning of Students in Online Discussion Forums 17
the students registered in the course, at the end of the semester so as not to bias the
communications taking place.
This data is further anonymized by assigning fake names to students and replacing
any occurrence of first, last or user name of the students in the data (including content
of the messages in discussion forums) with the assigned fake name. We also removed
all email addresses from the data. In the chosen course, as is also usual in other courses,
the instructor initiated different discussion threads. For each thread he posted a question
or provided some information and asked students to discuss the issue.
Consequently students posted subsequent messages in the thread, responding to the
original question or to the response of other students. This course was offered using
Moodle which is a widely-used course management system. Moodle like other CSCL
tools, enables interaction and collaborative construction of content, mostly using its
Forum tool which is a place for students to share their ideas [Error! Reference source
not found.].
Only using Moodle, to evaluate student participation the instructor is limited to shal-
low means such as the number of posts per thread and eventually the apparent size of
messages. The instructor would have to manually monitor the content of each interac-
tion to measure the extent of individual participation, which is hard, time consuming
and even unrealistic in large classes or forums with large volume, where different par-
ticipants can be assigned to moderate different discussions and threads.
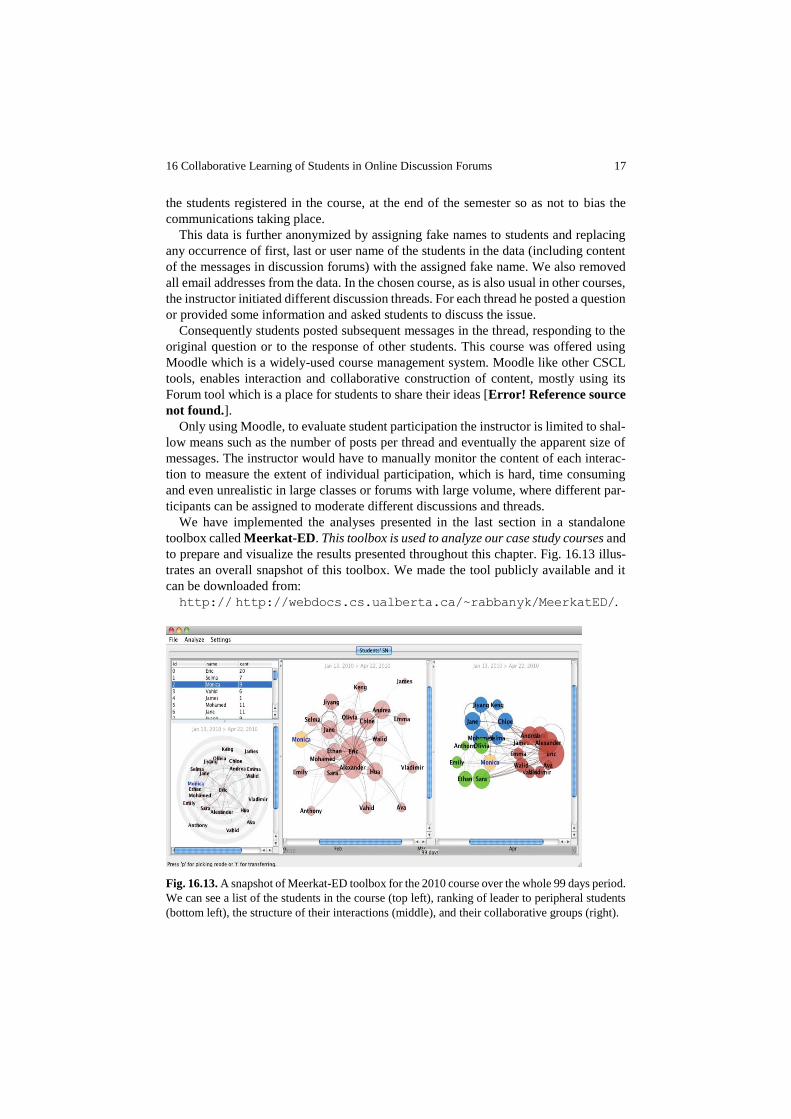
We have implemented the analyses presented in the last section in a standalone
toolbox called Meerkat-ED. This toolbox is used to analyze our case study courses and
to prepare and visualize the results presented throughout this chapter. Fig. 16.13 illus-
trates an overall snapshot of this toolbox. We made the tool publicly available and it
can be downloaded from:
http:// http://webdocs.cs.ualberta.ca/~rabbanyk/MeerkatED/.
Fig. 16.13. A snapshot of Meerkat-ED toolbox for the 2010 course over the whole 99 days period.
We can see a list of the students in the course (top left), ranking of leader to peripheral students
(bottom left), the structure of their interactions (middle), and their collaborative groups (right).
18 R. Rabbany et al.
16.4.1 Extracting Networks
Meerkat-ED extracts two kinds of networks: the social network of students and the
network of the terms used by them. These networks are extracted from the backup file
that Moodle provides for a course. This file records all the students and the discussion
forums occurred in the course. The student interaction network, therefore can be ex-
tracted straightforwardly by parsing this backup file.
Building the term network, however, requires more efforts. For building this net-
work, we need to first extract the noun phrases from the discussions, then build the
network by setting the extracted phrases as nodes and checking their co-occurrence in
all the sentences of every message in order to create the edges. We have used the
OpenNlp toolbox (http://opennlp.apache.org/) for extracting noun phrases out of dis-
cussions. OpenNlp is a set of natural language processing tools for performing sentence
detection, tokenization, pos-tagging, chunking, parsing, and etc. Using sentence detec-
tor in OpenNlp, we first segmented the content of messages into sentences. The to-
kenizer was used to break down those sentences to words. Having the tokenized words,
we used the Part-Of-Speech tagger to determine their grammatical tags -- whether they
are noun, verbs, adjective, etc. Then using the chunker, we grouped these words into
phrases, and picked the detected noun phrases, which are sequences of words surround-
ing at least one noun and functioning as a single unit in the syntax.
For obtaining better sets of terms to represent the content of the discussions, pruning
on the extracted noun phrases was necessary. We removed all the stop words, and split
the phrases that have stop word(s) within into two different phrases. For example the
phrase "privacy and confidentiality" is split into two terms: "privacy", and "confidenti-
ality". To avoid having duplicates, the first characters were converted to lower case (if
the other characters of the phrase are in lowercase) and plurals to singular forms (if the
singular form appeared in the content). For instance "Patients" would be "patients" then
"patient". As a final modification, we removed all the noun phrases that only occurred
once.
16.4.2 Interpreting Students Interaction Network
We have already reported partial results of the analyses on the 2010 course in the last
section for illustrations. Fig. 16.4 shows the structure of interaction between students
in the 2010 course, while Fig. 16.3 represents the dynamics of these interactions over
tree snapshots -- beginning, middle and end of the course. Using these visualizations
we can overview the structure of interactions between students and detect the interest-
ing patterns. For example, the snapshots of Fig. 16.3 clearly outlines a less engagement
from students in the middle of the course, compared to the higher activity at the begin-
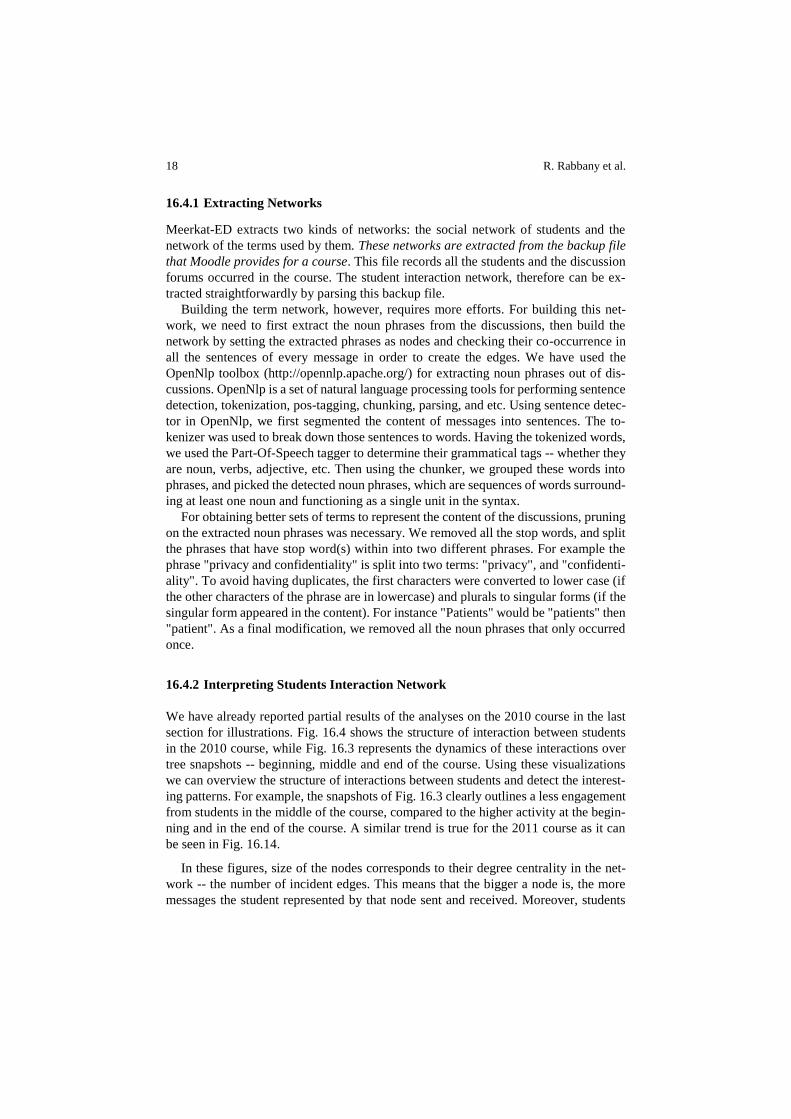
ning and in the end of the course. A similar trend is true for the 2011 course as it can
be seen in Fig. 16.14.
In these figures, size of the nodes corresponds to their degree centrality in the net-
work -- the number of incident edges. This means that the bigger a node is, the more
messages the student represented by that node sent and received. Moreover, students
16 Collaborative Learning of Students in Online Discussion Forums 19
are ranked more explicitly in a concentric centrality graph in which the more cen-
tral/powerful the node is, the closer it is to the center, as presented in Fig. 16.6. From
this graph we can see that Eric is notably the most active member in the course, whom
is in fact the instructor. Besides the instructor, the rest of students have about the same
participation overall, except for the few that have very low activity -- James, Antony,
Vahid and Ava. The dynamics of this concentric view determines the role change of
students in different time periods.
Fig. 16.14. Changes in the network of students over three time snapshots: beginning, middle, and
end of the course offered in the 2011.
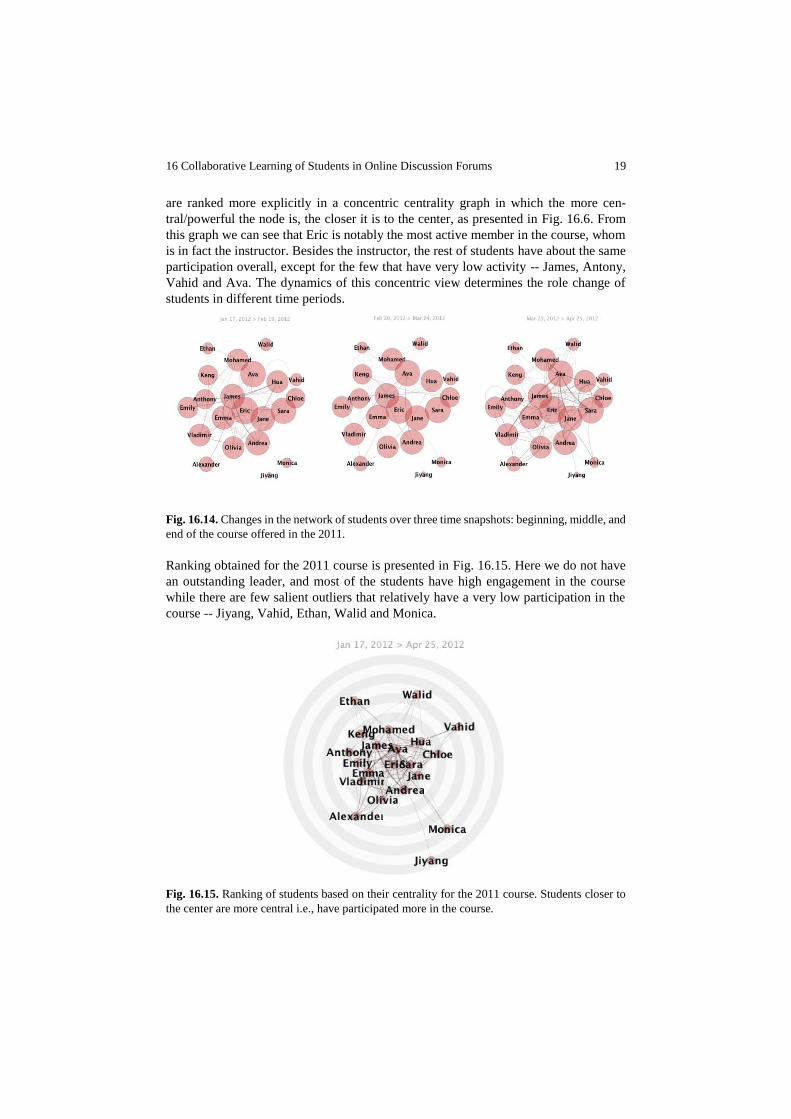
Ranking obtained for the 2011 course is presented in Fig. 16.15. Here we do not have
an outstanding leader, and most of the students have high engagement in the course
while there are few salient outliers that relatively have a very low participation in the
course -- Jiyang, Vahid, Ethan, Walid and Monica.
Fig. 16.15. Ranking of students based on their centrality for the 2011 course. Students closer to
the center are more central i.e., have participated more in the course.

20 R. Rabbany et al.
We can also monitor how the roles are changing during the course by dynamic analysis
of this concentric graph. An example is given in Fig. 16.7 for the 2010 course where
roles are pretty much preserved, as Eric always is the main leader and the rest of the
class have about the same activity with minor changes. This however is not the case for
the 2011 course. As we can see in Fig. 16.16, the leader changes during the course,
from Emma at the beginning to James in the middle of the course and Eric in the end.
Fig. 16.16. Changes of students' roles during the 2011 course.
Furthermore, we can monitor the changes in collaborative groups of students and
detect events and patterns. For example in Fig. 16.8, we have seen a community split
that have occurred during the 2010 course. A community growth can also be detected
proceeding that community split as illustrated in Fig. 17. Where the Red community
recruits new members while at the same time the Green community dissolves into Pur-
ple. We can also see the effect of the leader move between communities that clearly
has triggered most of these events. In Fig. 16.8 for example, moving Eric from the Cyan
community to Purple community caused the Cyan one to split, while in Fig. 17 his next
move from Purple to Blue, helped the Red community to enlist some of the Purple
members.
Fig. 16.17. The effect of leader move in collaborative groups, 1) the Green community follows
leader into the Purple community, 2) Purple members leave the community after the leader moves
to the Blue community.
16 Collaborative Learning of Students in Online Discussion Forums 21
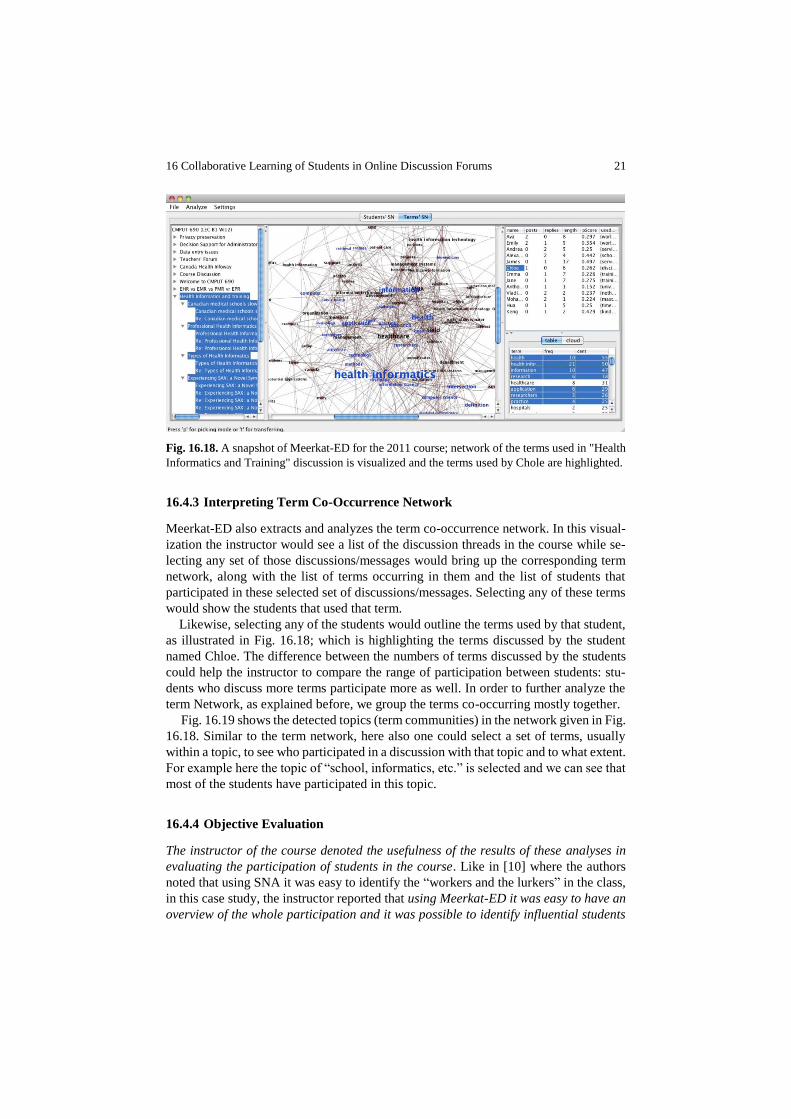
Fig. 16.18. A snapshot of Meerkat-ED for the 2011 course; network of the terms used in "Health
Informatics and Training" discussion is visualized and the terms used by Chole are highlighted.
16.4.3 Interpreting Term Co-Occurrence Network
Meerkat-ED also extracts and analyzes the term co-occurrence network. In this visual-
ization the instructor would see a list of the discussion threads in the course while se-
lecting any set of those discussions/messages would bring up the corresponding term
network, along with the list of terms occurring in them and the list of students that
participated in these selected set of discussions/messages. Selecting any of these terms
would show the students that used that term.
Likewise, selecting any of the students would outline the terms used by that student,
as illustrated in Fig. 16.18; which is highlighting the terms discussed by the student
named Chloe. The difference between the numbers of terms discussed by the students
could help the instructor to compare the range of participation between students: stu-
dents who discuss more terms participate more as well. In order to further analyze the
term Network, as explained before, we group the terms co-occurring mostly together.
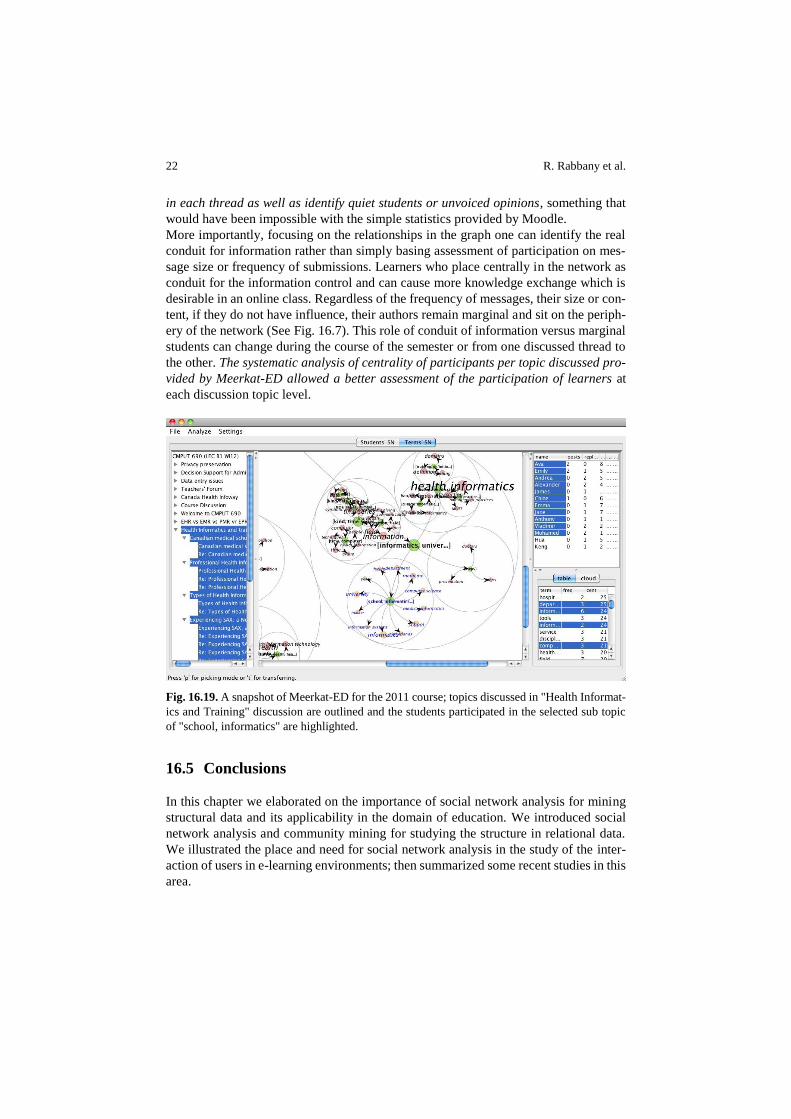
Fig. 16.19 shows the detected topics (term communities) in the network given in Fig.
16.18. Similar to the term network, here also one could select a set of terms, usually
within a topic, to see who participated in a discussion with that topic and to what extent.
For example here the topic of “school, informatics, etc.” is selected and we can see that
most of the students have participated in this topic.
16.4.4 Objective Evaluation
The instructor of the course denoted the usefulness of the results of these analyses in
evaluating the participation of students in the course. Like in [10] where the authors
noted that using SNA it was easy to identify the “workers and the lurkers” in the class,
in this case study, the instructor reported that using Meerkat-ED it was easy to have an
overview of the whole participation and it was possible to identify influential students
22 R. Rabbany et al.
in each thread as well as identify quiet students or unvoiced opinions, something that
would have been impossible with the simple statistics provided by Moodle.
More importantly, focusing on the relationships in the graph one can identify the real
conduit for information rather than simply basing assessment of participation on mes-
sage size or frequency of submissions. Learners who place centrally in the network as
conduit for the information control and can cause more knowledge exchange which is
desirable in an online class. Regardless of the frequency of messages, their size or con-
tent, if they do not have influence, their authors remain marginal and sit on the periph-
ery of the network (See Fig. 16.7). This role of conduit of information versus marginal
students can change during the course of the semester or from one discussed thread to
the other. The systematic analysis of centrality of participants per topic discussed pro-
vided by Meerkat-ED allowed a better assessment of the participation of learners at
each discussion topic level.
Fig. 16.19. A snapshot of Meerkat-ED for the 2011 course; topics discussed in "Health Informat-
ics and Training" discussion are outlined and the students participated in the selected sub topic
of "school, informatics" are highlighted.
16.5 Conclusions
In this chapter we elaborated on the importance of social network analysis for mining
structural data and its applicability in the domain of education. We introduced social
network analysis and community mining for studying the structure in relational data.
We illustrated the place and need for social network analysis in the study of the inter-
action of users in e-learning environments; then summarized some recent studies in this
area.

16 Collaborative Learning of Students in Online Discussion Forums 23
We also proposed Meerkat-ED, a specific, practical and interactive toolbox for ana-
lyzing students' interactions in asynchronous discussion forums. For any selected pe-
riod of time, our toolbox prepares and visualizes overall snapshots of participants in the
discussion forums, their interactions, the leaders/peripheral students, and collaborative
student groups. Moreover, it creates a hierarchical summarization of the discussed top-
ics, which gives the instructor a quick view of what is debated online. It further illus-
trates individual student participation in these topics, measured by their centrality in the
discussions on that topic, their number of posts, replies, and the portion of terms used
by them. We believe exploiting the mining abilities of this toolbox would facilitate
fairer evaluation of students' participation in online courses.
References
1. Erlin, Y.N., Rahman, A.: Students' interactions in online asynchronous discussion forum: A
social network analysis. In: International Conference on Education Technology and Com-
puter, pp. 25-29 (2009)
2. Calvani, A., Fini, A., Molino, M., Ranieri, M.: Visualizing and monitoring effective inter-
actions in online collaborative groups. In: British Journal of Educational Technology. (2009)
3. Mak, S., Williams, R., Mackness, J.: Blogs and forums as communication and learning tools
in a mooc. In: Dirckinck-Holmfeld, L., Hodgson, V., Jones, C., Laat, M.D., McConnell, D.,
Ryberg, T. (eds.) Proceedings of the 7th International Conference on Networked Learning,
pp. 275-285 (2010)
4. Willging, P.A.: Using social network analysis techniques to examine online interactions. In:
US-China Education Review, vol. 2(9), pp. 46-56 (2005)
5. de Laat, M., Lally, V., Lipponen, L., Simons, R.-J.: Investigating patterns of interaction in
networked learning and computer-supported collaborative learning: A role for social net-
work analysis. In: International Journal of Computer-Supported Collaborative Learning, vol.
2(1), pp. 87-103 (2007)
6. Nurmela, K., Lehtinen, E., Palonen, T.: Evaluating CSCL log files by social network analy-
sis. In: Computer Support for Collaborative Learning. (1999)
7. Haythornthwaite, C.: Building social networks via computer networks: Creating and sus-
taining distributed learning communities. In: Cambridge University Press, pp. 159-190
(2002)
8. Cho, H., Gay, G., Davidson, B., Ingraffea, A.: Social networks, communication styles, and
learning performance in a CSCL community. In: Computers & Education, vol. 49(2), pp.
309-329 (2007)
9. Dawson, S.: Seeing the learning community: An exploration of the development of a re-
source for monitoring online student networking. In: British Journal of Educational Tech-
nology, vol. 41(5), pp. 736-752 (2010)
10. Sundararajan, B.: Emergence of the most knowledgeable other (mko): Social network anal-
ysis of chat and bulletin board conversations in a CSCL system. In: Electronic Journal of e-
Learning, vol. 8, pp. 191-208 (2010)
11. Laghos, A., Zaphiris, P.: Sociology of student-centred e-learning communities: A network
analysis. In: IADIS international conference (2006)
12. Rabbany, R., Takaffoli, M., Zaïane, O. R.: Analyzing Participation of Students in Online
Courses Using Social Network Analysis Techniques. In: 4th International Conference on
Educational Data Mining (EDM) pp. 21-30 (2011)
24 R. Rabbany et al.
13. Rabbany, R., Takaffoli, M., Zaïane, O. R.: Social Network Analysis and Mining to Support
the Assessment of Online Student Participation, ACM SIGKDD Explorations on Educa-
tional Data mining, December (2011)
14. Bloom, B. S., Englehart, M. D., Furst, E. J., Hill, W. H., Krathwohl, D. R.: Taxonomy of
educational objectives: Handbook 1. Cognitive domain (1956)
15. Vygotskiĭ, L. L. S.: Mind in society: The development of higher psychological processes.
Cambridge, Harvard University Press (1978)
16. Gokhale, A.A.: Collaborative Learning Enhances Critical Thinking, Journal of Technology
Education, vol. 7(1) (1995)
17. Bruner, J.: Vygotsky: A historical and conceptual perspective, In: Wertsch, J. V. (Ed.), Cul-
ture, communication, and cognition: Vygotskian perspectives, 21-34, Cambridge University
Press, (1986)
18. Panitz, T.: Benefits of Cooperative Learning in Relation to Student Motivation, In: Theall,
M. (Ed.) Motivation from within: Approaches for encouraging faculty and students to excel,
New directions for teaching and learning, Josey-Bass publishing (1999)
19. Laal, M., Ghodsi, S. M.: Benefits of collaborative learning. Proceeding of Social and Be-
havioral Sciences, vol. 31, pp. 486 – 490 (2012)
20. Jyothi, S., McAvinia, C., Keating, J.: A visualisation tool to aid exploration of students’
interactions in asynchronous online communication. Computers & Education, 58(1), 30-42
(2012)
21. Nandi, D., Hamilton, M., Harland, J.: Evaluating the quality of interaction in asynchronous
discussion forums in fully online courses. Distance Education, 33(1), 5-30 (2012)
22. Marin, A.,Wellman, B.: Handbook of Social Network Analysis. In: Sage. (2010)
23. Keeling, M.J., Eames, K.T.: Networks and epidemic models. In: Journal of the Royal Soci-
ety Interface, vol. 2(4), pp. 295-307 (2005)
24. Davis, R.H.: Social network analysis - an aid in conspiracy investigations. In: FBI Law En-
forcement Bulletin, vol. 50(12), pp. 11-19 (1981)
25. Newman, M. E.J.: Detecting community structure in networks. In: European Physical Jour-
nal B, vol. 38, pp. 321-330 (2004)
26. Palla, G., Derenyi, I., Farkas, I., Vicsek, T.: Uncovering the overlapping community struc-
ture of complex networks in nature and society. In: Nature, vol. 435, pp. 814-818 (2005)
27. Clauset, A., Newman, M. E.J., Moore, C.: Finding community structure in very large net-
works. In: Physical Review E, vol. 70 (2004)
28. Chen, J., Zaïane, O.R., Goebel, R.: Detecting communities in large networks by iterative
local expansion. In: CASoN (2009)
29. Lancichinetti, A. Fortunato, S.: Community detection algorithms: A comparative analysis.
In: Physical Review E, vol. 80 (2009)
30. Newman, M. E.J., Girvan, M: Finding and evaluating community structure in networks. In:
Physical Review E, vol. 69. (2004)
31. Berger-Wolf, T.Y., Saia, J.: A framework for analysis of dynamic social networks. In: Pro-
ceedings of the 12th ACM SIGKDD international conference on Knowledge discovery and
data mining, KDD '06, 523-528 (2006)
32. Gruzd, A., Haythornthwaite, C.A.: The analysis of online communities using interactive
content-based social networks. In: Proceedings of the American Society for Information Sci-
ence and Technology (ASIS&T) Conference, 523-527 (2008)
33. Gruzd, A.: Automated Discovery of Social Networks in Online Learning Communities. In:
PhD thesis, University of Illinois at Urbana-Champaign (2009)
34. Dawson, S., Bakharia, A., Heathcote, E.: Snapp: Realising the affordances of real-time sna
within networked learning environments. In: Dirckinck-Holmfeld, L., Hodgson, V., Jones,

16 Collaborative Learning of Students in Online Discussion Forums 25
C., De~Laat, M., McConnell, D., Ryberg, T., editors, Proceedings of the 7th International
Conference on Networked Learning, 125-133 (2010)
35. Hrastinski, S.: What is online learner participation? a literature review. In: Computers &
Education, vol. 51(4), pp. 1755-1765 (2008)
36. Daradoumis, T., Martínez-Monés, A., Xhafa, F.: A layered framework for evaluating on-
line collaborative learning interactions. In: International Journal of Human-Computer Stud-
ies.Volume 64(7), pp. 622-635 (2006)
37. Borgatti, S.P., Everett, M.G., Freeman, L.C.: Ucinet for windows: Software for social net-
work analysis. (2002)
38. CYRAM: Netminer software. Available from http://www.netminer.com/, (Accessed
12 June 2012)
39. Lopez, M. I., Luna, J. M., Romero, C., Ventura, S.: Classification via clustering for predict-
ing final marks based on student participation in forums. In: 5th International Conference on
Educational Data Mining Proceedings (EDM) (2012)
40. Stewart, S. A., Abidi, S. S. R.: Applying social network analysis to understand the
knowledge sharing behaviour of practitioners in a clinical online discussion forum. Journal
of medical Internet research, 14(6), e170 (2012)
41. Reffay, C. and Chanier, T.: How social network analysis can help to measure cohesion in
collaborative distance-learning. In: Computer Supported Collaborative Learning, 343-352
(2003)
42. Chen, J., Zaïane, O.R., Goebel, R.: An unsupervised approach to cluster web search results
based on word sense communities. In: Proceedings of the 2008 IEEE/WIC/ACM Interna-
tional Conference on Web Intelligence and Intelligent Agent Technology, vol. 01, pp. 725-
729 (2008)