Embed Size (px)
Citation preview

(TSE: 6594 NYSE: NJ)http://www.nidec.com/
Nidec Corporation
Fiscal 2014 Financial Results
Fi l Y E d d M h 31 2015Fiscal Year Ended March 31, 2015<U.S.GAAP>April 23, 2015
Note Regarding Forward-looking Statements
These presentation materials and the related discussions contain forward-looking
g g g
These presentation materials and the related discussions contain forward-lookingstatements including expectations, estimates, projections, plans and strategies. Suchforward-looking statements are based on management’s targets, assumptions andbeliefs in light of the information currently available. Certain risks, uncertainties andbeliefs in light of the information currently available. Certain risks, uncertainties andother factors could cause actual results to differ materially from those discussed in theforward-looking statements. Such risks and uncertainties include, but are not limitedto, changes in customer circumstances and demand, exchange rate fluctuations, and, g , g ,the Nidec Group’s ability to design, develop, mass produce and win acceptance of itsproducts and to acquire and successfully integrate companies with complementarytechnologies and product lines. Please see other disclosure documents filed orpublished by the Nidec Group companies, including the latest Form 20-F andJapanese securities report, for additional information regarding such risks anduncertainties. Nidec undertakes no obligation to update the forward-lookingstatements unless required by law.
The first slide features the transmission oil pump of Geräte- und Pumpenbau GmbH Dr. Eugen Schmidt (currently, Nidec GPM
2
The first slide features the transmission oil pump of Geräte und Pumpenbau GmbH Dr. Eugen Schmidt (currently, Nidec GPM GmbH) the company acquired on February 2, 2015.
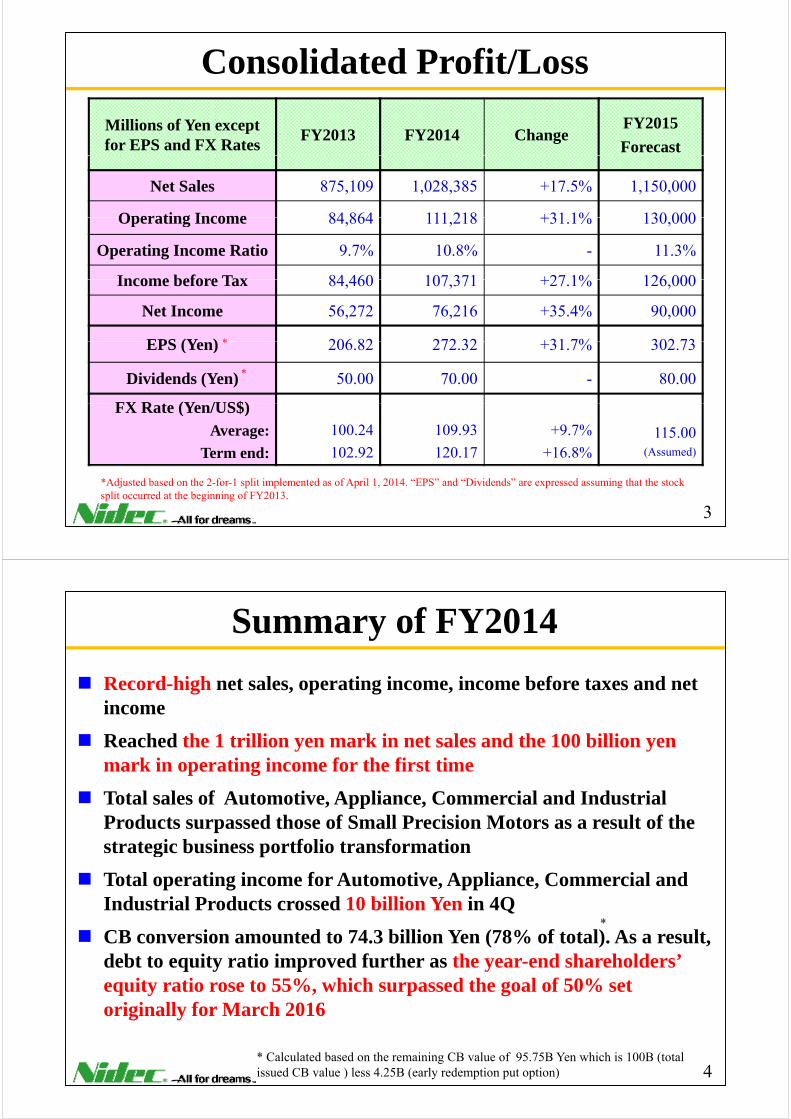
Consolidated Profit/Loss
Millions of Yen except for EPS and FX Rates
FY2013 FY2014 ChangeFY2015
Forecast
Net Sales 875,109 1,028,385 +17.5% 1,150,000
Operating Income 84 864 111 218 +31 1% 130 000Operating Income 84,864 111,218 +31.1% 130,000
Operating Income Ratio 9.7% 10.8% - 11.3%
Income before Tax 84 460 107 371 +27 1% 126 000Income before Tax 84,460 107,371 +27.1% 126,000
Net Income 56,272 76,216 +35.4% 90,000
EPS (Y ) 206 82 272 32 +31 7% 302 73*EPS (Yen) 206.82 272.32 +31.7% 302.73
Dividends (Yen) 50.00 70.00 - 80.00
FX R t (Y /US$)
*
*
FX Rate (Yen/US$)Average:
Term end:
100.24
102.92
109.93
120.17
+9.7%
+16.8%115.00
(Assumed)
*Adjusted based on the 2-for-1 split implemented as of April 1, 2014. “EPS” and “Dividends” are expressed assuming that the stock split occurred at the beginning of FY2013.
3
Summary of FY2014
Record-high net sales, operating income, income before taxes and net income
Reached the 1 trillion yen mark in net sales and the 100 billion yen mark in operating income for the first time
Total sales of Automotive, Appliance, Commercial and Industrial Products surpassed those of Small Precision Motors as a result of the strategic business portfolio transformation
Total operating income for Automotive, Appliance, Commercial and I d t i l P d t d 10 billi Y i 4QIndustrial Products crossed 10 billion Yen in 4Q
CB conversion amounted to 74.3 billion Yen (78% of total). As a result, debt to equity ratio improved further as the year-end shareholders’
*
debt to equity ratio improved further as the year-end shareholders equity ratio rose to 55%, which surpassed the goal of 50% set originally for March 2016
4* Calculated based on the remaining CB value of 95.75B Yen which is 100B (total issued CB value ) less 4.25B (early redemption put option)

FY2015 ForecastMillions of Yen, except for
EPS, dividends and FX rate 1H/FY2015 2H/FY2015 Full-Year
Net Sales 550,000 600,000 1,150,000
Operating Income 58,000 72,000 130,000
Operating Income Ratio 10.5% 12.0% 11.3%
Income before Tax 56,000 70,000 126,000
Net Income 40,000 50,000 90,000
EPS (Yen) 134 93 167 80 302 73EPS (Yen) 134.93 167.80 302.73
Dividends (Yen) 40.0 40.0 80.0
FX Rate (Yen/US$) 115 115 115FX Rate (Yen/US$) 115 115 115
FX Rate (Yen/Euro) 125 125 125
Note: Based on the current forecast of sales volume, every one yen appreciation or depreciation against the
5
Note: Based on the current forecast of sales volume, every one yen appreciation or depreciation against the U.S. dollar and the euro for FY2015 is estimated to have an annualized impact of 6.70 billion yen and 0.78 billion yen on sales, respectively, and 0.78 billion yen and 0.23 billion yen on operating income, respectively.
Consolidated Quarterly Sales and Operating Income
350 35
Sales (LHS) Operating Income (RHS)
(All figures in Billions of Yen)
Record-high achieved
250
300
25
30
S O
200
250
20
25
Sales
Operating
150 15
IncomeJapan
Earthquake
50
100
5
10ThaiFloods
0
50
1Q 2Q 3Q 4Q 1Q 2Q 3Q 4Q 1Q 2Q 3Q 4Q 1Q 2Q 3Q 4Q 1Q 2Q 3Q 4Q 1Q 2Q 3Q 4Q 1Q 2Q 3Q 4Q
0
5Lehman Crisis
-50
1Q 2Q 3Q 4Q 1Q 2Q 3Q 4Q 1Q 2Q 3Q 4Q 1Q 2Q 3Q 4Q 1Q 2Q 3Q 4Q 1Q 2Q 3Q 4Q 1Q 2Q 3Q 4Q
-5
Structural Reform
-25.4FY2009 FY2010 FY2011 FY2012FY2008 FY2013 FY2014
6

Consolidated Cash Flow
110 3150
Operating ActivitiesInvesting ActivitiesFree Cash Flow (Operating CF + Investing CF)
(Billions of Yen)
56.7
110.387.2 91.9
10.636.8 24.0
-23.60
-19.9
0
M&A I *
-81.2-63.2
M&A Investment-79 9 billion Yen
M&A Investment23 4 billi Y
*
M&A Investment+5.2 billion Yen
*
M&A Investment* *
-133.9-150
FY2011 FY2012 FY2013 FY2014
-79.9 billion Yen -23.4 billion Yen
*M&A investment: Acquisitions of business net of cash acquired in “Cash flows from investing activities”
-27.3 billion Yen
*M&A investment: Acquisitions of business, net of cash acquired in Cash flows from investing activitiesNidec Seimitsu Corp. (FY2011), Nidec Minster Corp., Nidec ASI S.p.A., Nidec Avtron Automation Corp., Nidec Kinetek Corp., Nidec Kaiyu Auto Electric (Jiangsu) Ltd., SCD Co., Ltd. (FY2012), Nidec Sankyo CMI Corp., Nidec Elesys Corp. (FY2013) and Nidec GPM GmbH (FY2014)
7
CAPEX, Depreciation and R&D
72 080
(Billions of Yen)
CAPEX Depreciation R&D
58 0 60.0
72.0
40 0
58.0
44.4
51.4
45.2
52.0
40.0 37.840
0FY13 FY14 FY15 FY13 FY14 FY15 FY13 FY14 FY15
(Forecast) (Forecast) (Forecast)
8

DividendsDividend payments continue to increase with growing
business results since the structural reform(Yen per share) (Yen)
120 400Dividends (LHS) EPS (RHS)(Yen per share) (Yen)
* *
272
303
20760 200
42.550.0
80.070.0
30
0
FY2012 FY2013 FY2014 FY2015
0
(Forecast)*Adjusted based on the 2-for-1 stock split implemented as of April 1, 2014. The figures for FY2012
and FY2013 are expressed assuming that the stock split occurred at the beginning of FY2012.9
Mid T S i G lMid T S i G lMid-Term Strategic GoalMid-Term Strategic Goal
Vision 2020Vision 2020
10
This section includes forward-looking statements. See disclaimer on page 2 of this presentation.

FY2020 New Mid-Term Strategic Target
Continuous pursuit for profit & strong growth
1 T t f lid t d t l 2 t illi Y1. Target for consolidated net sales: 2 trillion Yen(including new M&A of approx. 500 billion Yen)
2 Sales target for automotive: 700 billion to 1 trillion Yen2. Sales target for automotive: 700 billion to 1 trillion Yen3. Target for consolidated operating income ratio: 15%4. Target for ROE: 18%g
(Assuming shareholders’ equity ratio of 60%)5. Five regional HQ management
11
Targets for Net Sales and Operating Income Ratio
Aiming for both sales growth (organic + M&A) and profitability enhancement
(Sales in Trillions of Yen) (Operating Income Ratio %)2.5 15
Sales13.9% 13.7%
15%
(Sales in Trillions of Yen) (Operating Income Ratio, %)
2
10
2T
11.3%
13.7%
10.7% 10.8%
New M&A Approx.500B
Organic Growth + M&A
1.5
Sales
Sales 1.03T
Sales1.15T
9.7%
Organic growth(CAGR approx. 7%)
(CAGR approx. 12%)
0 5
1
5Sales571.6B
Sales676.0B
Sales682.3B
Sales709.3B
Sales875.1B
( pp )
0
0.5
0
2.5%
0
FY09 FY10 FY11 FY12 FY13 FY14 FY15 FY20
0
(Target)(Forecast)Structural Reform 12
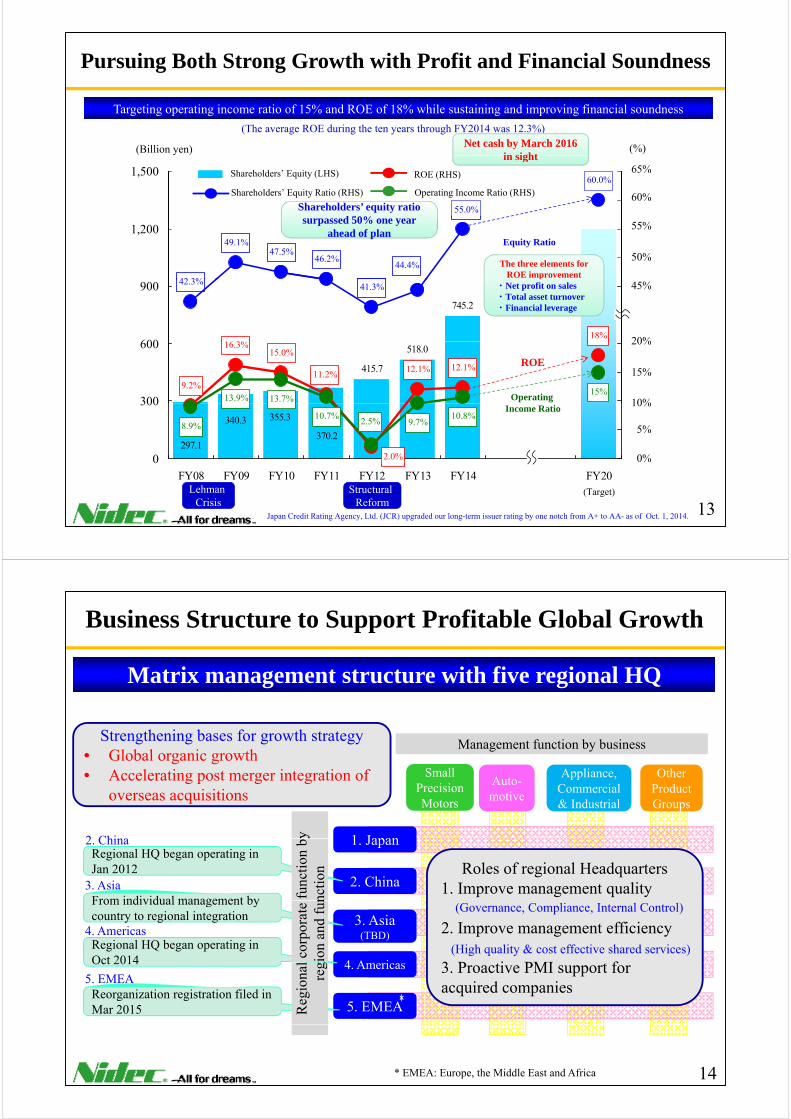
Pursuing Both Strong Growth with Profit and Financial Soundness
(Billion yen) (%)
Targeting operating income ratio of 15% and ROE of 18% while sustaining and improving financial soundness
(The average ROE during the ten years through FY2014 was 12.3%)Net cash by March 2016
in sight
60.0%
55.0%
1,500
60%
ROE (RHS)
Operating Income Ratio (RHS)
Shareholders’ Equity (LHS)
Shareholders’ Equity Ratio (RHS)
in sight
Shareholders’ equity ratio d 50%
65%
44.4%46.2%
47.5%49.1%
42 3%
1,200
50%
55%
Equity Ratio
The three elements for ROE improvement
psurpassed 50% one year
ahead of plan
745.2
16 3%
41.3%42.3%
18%600
900 45%
20%
p・ Net profit on sales ・ Total asset turnover・ Financial leverage
415.7
518.0
9.2%
16.3%15.0%
12.1%
13.9% 13.7%
12.1%11.2%
15%300
600
10%
15%
20%
ROE
Operating
370.2
355.3340.3
297.1
8.9%10.7%
9.7%10.8%
2.0%
2.5%
0
300
0%
5%
10%Income Ratio
FY08 FY09 FY10 FY11 FY12 FY13 FY14 FY20Structural
ReformLehman
CrisisJapan Credit Rating Agency, Ltd. (JCR) upgraded our long-term issuer rating by one notch from A+ to AA- as of Oct. 1, 2014.
(Target)
13
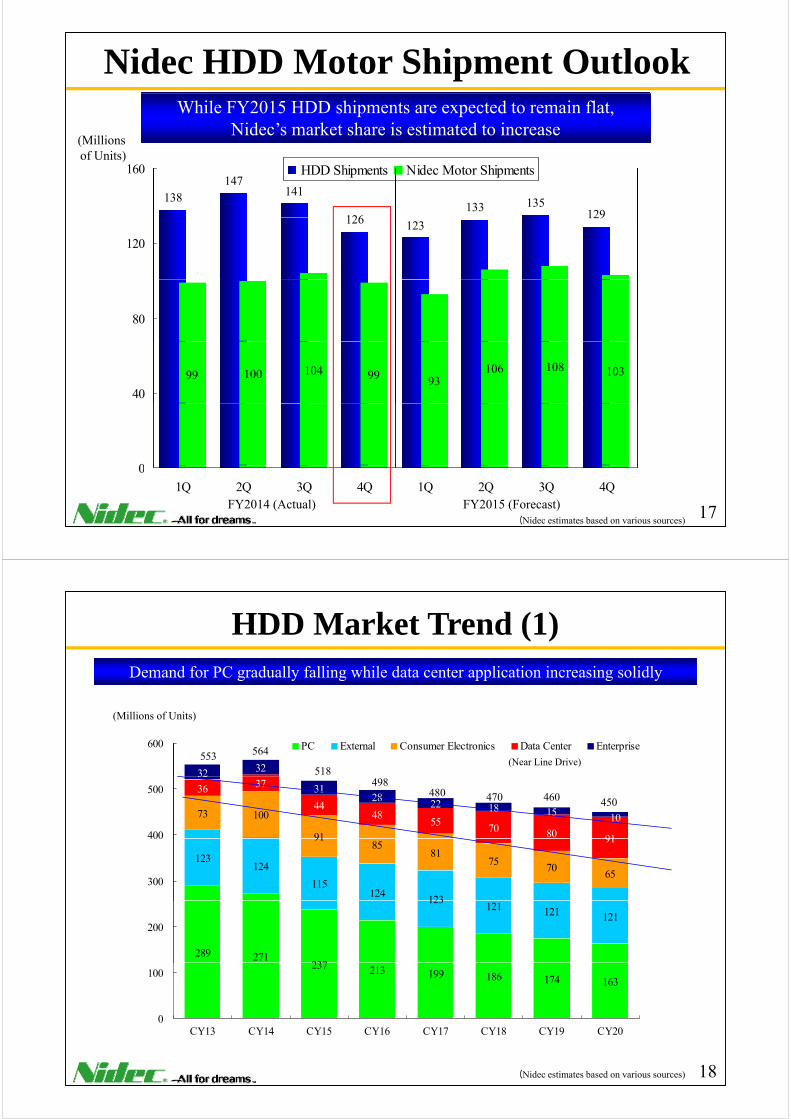
Business Structure to Support Profitable Global Growth
Matrix management structure with five regional HQ
Small A
Appliance, Other
Management function by business Strengthening bases for growth strategy
• Global organic growth• Accelerating post merger integration of
1 Japan
S aPrecision Motors
Auto-motive
Appliance, Commercial & Industrial
Other Product Groups
y
• Accelerating post merger integration of overseas acquisitions
2 China 1. Japan
2. China
Regional HQ began operating in Jan 2012
From individual management by func
tion
by
ncti
on
2. China
3. AsiaRoles of regional Headquarters
1. Improve management quality
3. Asia(TBD)
4 A i
Regional HQ began operating in Oct 2014
From individual management by country to regional integration
l cor
pora
te
gion
and
fun
4. Americas 2. Improve management efficiency
3 P i PMI f
(Governance, Compliance, Internal Control)
(High quality & cost effective shared services)4. Americas
5. EMEA*
Oct 2014
Reorganization registration filed in Mar 2015 R
egio
nal
reg
5. EMEA3. Proactive PMI support for acquired companies
* EMEA: Europe, the Middle East and Africa 14

Targets for Net Sales in FY2020 by Category
700B
Accelerate topline growth with focused allocation of management resources in fast growing areas
d i b t h l i l i ti
FY2020Sales: 2 Trillion Yen (Target)
(Sales: Billions of Yen)
to1 T
driven by technological innovations)
FY2010Sales: 676.0 Billion Yen
FY2015Sales: 1.15 Trillion Yen
(Target)
New M&A500
400 to 600
400 to
600
(Target)
(Sales: Billions of Yen)(Sales: Billions of Yen)
200
348.4
400
300 280
Key Growth Areas
to300 Small
Precision Motors Appliance,
Commercial & Industrial Other
69 2
94.2164.2
Small Precision Motors Automotive Appliance,
Commercial & Industrial Other
170 Small Precision Motors
Automotive
Appliance, Commercial Other
Automotive
Product Groups
69.2 & Industrial Other Product Groups
& Industrial Other
Product Groups
15
FY2015 Sales and Profitability Targets by Product Category
1 0T
(Sales in Billions of Yen)(Operating Income in
Billions of Yen)(Sales in Billions of Yen) (Operating Income in
Billions of Yen)
Small Precision MotorsSmall Precision Motors AutomotiveAutomotive Operating IncomeSales
84 3 86 7119.2
300.0
197.0200
400
60
1201.0T Yen
400to
400.0
331.4319.7
362.5398.0
300
600
60
120
700to
1 T84.3 86.7
6.716.6
-2.0
3.3
0
FY11 FY12 FY13 FY14 FY15 FY20
0
(Forecast) (Target)
to60063.156.754.2
22.60
300
0
60 1 T
-200 -60
(Operating Income in (Operating Income in Appliance, Commercial & IndustrialAppliance, Commercial & Industrial Other Product GroupsOther Product Groups
(Forecast) (Target)FY11 FY12 FY13 FY14 FY15 FY20
(Sales in Billions of Yen) Billions of Yen) (Sales in Billions of Yen) Billions of Yen)
600 60
170.0167.4
141 1
170.4142.4
300 40
200
226 1
124.2263.0 280.0
400to
600161.8
4.6
15.520.1300 30
141.1
13.9
21.9
14.9
0
150
FY11 FY12 FY13 FY14 FY15 FY20
0
20to300
16(Forecast) (Target)
(Forecast) (Target)
226.16.1
0
FY11 FY12 FY13 FY14 FY15 FY20
0-0.6
-150
FY11 FY12 FY13 FY14 FY15 FY20
-20
Nidec HDD Motor Shipment OutlookWhile FY2015 HDD shipments are expected to remain flat,
Nidec’s market share is estimated to increase(Millions of Units)
138147
141
126133 135
129
160 HDD Shipments Nidec Motor Shipmentsof Units)
126 123129
120
80
99 100 104 99 93106 108 103
40
00
1Q 2Q 3Q 4Q 1Q 2Q 3Q 4QFY2014 (Actual) FY2015 (Forecast) 17
(Nidec estimates based on various sources)
HDD Market Trend (1)
(Millions of Units)
Demand for PC gradually falling while data center application increasing solidly
32 32
600 PC External Consumer Electronics Data Center Enterprise
(Near Line Drive)553 564
518
(Millions of Units)
73 100
91
36 37
4448
5570 80 91
18 15 10
32
3128
22
400
500498
480 460 450470
123124
115124
123
9185
8175
7065
91
300
400
289 271237
123121 121 121
200
237 213 199 186 174 163
0
100
CY13 CY14 CY15 CY16 CY17 CY18 CY19 CY20
(Nidec estimates based on various sources) 18

HDD Market Trend (2)
HDD playing a major role in data storage in the era of Big DataComparison of data storage mediaMedia Characteristics (Advantage / Disadvantage) Application JudgmentMedia Characteristics (Advantage / Disadvantage) Application Judgment
HDD High capacity and cost performance / no major disadvantages Major role in data storage Good
SSDHigh speed access / less competitive in price, capacity and durability Frequently accessed data storage Fair
y
TapeData safely stored in the event of catastrophe / not suitable for network connection Off-line cold storage Fair
(Millions of Units)<HDD Shipment forecast for data center application>
More than double
100
80
<HDD Shipment forecast for data center application> double91
70
80
60
4037
4448
55
40
20
0
CY14 CY15 CY16 CY17 CY18 CY19 CY20
19(Nidec estimates based on various sources)
Other Small Precision Motor Trend (1)
Enhancing the Two Approaches
C t S ifi Application SpecificCustomer-Specific, Cross-Application Approach
Application-Specific, Cross-Customer Approach
e.g., Company X (global appliance
e.g., Cleaning robot
De
Motor demand from major appliance
(global appliance manufacturer)
application
eepening WideningCompany
A‘s Cleaning
Robot
Company B’s
Cleaning Robot
CompanyC’s
CleaningRobot
CompanyD’s
CleaningRobot
Company E’s
CleaningRobot
Approx. US$3.5B
(Nidec estimate)
major appliance manufacturers Adopted! Adopted! Adopted! Adopted! Adopted!
Proposing Solutions
Build up customer information thru App-Specific Approach
Make proposals in advance, across industries
Proposing Solutions
Take proactive strategy byTake proactive strategy by
e.g.,Modularization of product using non-customized chips
anticipating customer’s demand anticipating customer’s demand customized chips
Driver20
Other Small Precision Motor Trend (2)New Product, New Market and New Customer Challenge
E l 1 Vib ti t k t Example 2: New Market “Haptic Devices”Example 1: Vibration motor market Example 2: New Market Haptic Devices
(Billion Units)
<Outlook of vibration motor market> <Image of products using haptic technology>
2.5
3.0
Feature Phones
Gaming Console
Smartphones PC and Tablets
Built-in vibration motor 2.3
2.52.6
2.7
1 5
2.0
Phonesin touch panel
Smaller devise↓
Thin linearVibration motor
2.0
1.0
1.5Smart-phones Automotive Wearables
Vibration motors aroundFeedback
Strong growthin Smartphones
CY14 CY15 CY16 CY17 CY18
0
0.5
Vibration motors around the driver’s seat
when touching the device
CY14 CY15 CY16 CY17 CY18
(Nidec estimates based on various sources) e.g., Watches
21
Quarterly TrendsAutomotive, Appliance, Commercial and Industrial Products
Sales (LHS) (Operating Income (RHS)
Aiming to maintain the upward trend of sales and operating income beginning from the structural reform into FY2015
(Operating Income
200 20
Sales (LHS) (Operating Income (RHS)(Sales in Billions of Yen)
( p gin Billions of Yen)
110.2 108 1114.9
126.7
150 15
54 9 54 0 58.7 61.6
74.284.1 80.0 83.0
110.2 108.198.2
4 5 5.1 5.3
7.4
9.3
10.3
8.68.6100 10
54.9 51.9 49.6 52.2 54.0 58.7
2.5 2.51.9
2.5 2.7 2.2
0.7
4.5 5.1
50 5
0
1Q 2Q 3Q 4Q 1Q 2Q 3Q 4Q 1Q 2Q 3Q 4Q 1Q 2Q 3Q 4Q 1Q 2Q 3Q 4Q
0
FY2012 FY2013FY2011 FY2014 FY2015-3.0-50 -5
FY2012 FY2013FY2011(Actual)
FY2014(Actual) (Actual) (Forecast)(Actual)
FY2015
22*Please refer to Notes on page 35.
StructuralReform

New Mid-Term Strategic Goal for AutoTargeting 1 trillion Yen sales by FY2020, through focus on synergies and M&A
(Sales in Billions of Yen) 700B to 1 T Speed up sales growth through
Strategy 1to 1 T
1 Trillion
800
Integrating Nidec Group, differentiating products through modularizing to accelerate
Speed up sales growth through modularization and electrification
800 products through modularizing to accelerate speed of growth.
Initiate strategic in-house production600
Initiate strategic in house productionthrough process renewal
Large-scale orders enable us to step up in-house production of parts Aggressively
Strategy 2
400
197 0
300.0
house production of parts. Aggressively pushing to enhance profitability.
R li l l M&A200 197.0 Realize large-scale M&A
Well-timed large-scale cross border business acquisitions in the waves of
Strategy 3
FY14 FY15 FY16 FY17 FY18 FY19 FY20(Target)(Forecast)
23
business acquisitions in the waves of market consolidation greater synergies among Nidec operations
Automotive Market Environment (1)Speeding up globalization process to take advantage of larger order flows
OEMs are expanding adoption of common platforms to various models of cars
Model A Model B Model C Model D Model E
Tier 1 customers are expanding their operational size
Tier 1 customers are focusingmore on “local production for
globally, and pushing themselvestoward electrification
local consumption” with larger order flows
Largergorder flows
Electrification Increase in-houseElectrification Modularization capability of parts
24

Automotive Market Environment (2)Increase in adoption of AEBS driving rapid expansion of ADAS market
ADAS-equipped car production estimates
* *
q pp p
20
(Million cars)
20
20 million(Million cars) Previous estimate
(October 23, 2014)
Updated estimate
15.2 millionStrong upward revision
15 15
1010
5 5
0CY16 CY17 CY18 CY19 CY20
0CY16 CY17 CY18 CY19 CY20
*AEBS: Advanced Emergency Braking System*ADAS: Advanced Driver Assistance Systems
25(Nidec estimates based on various sources)
Pursue Differentiation through Modularization
Maximizing “One Nidec” synergies to enhance both sales and profit growth
Examples of Modularization of Auto Parts
(1) EPS Power Pack (2) EOP Power Pack
p
* *
Nidec Nidec Elesys Nidec Nidec TosokNidec GPMNidec Elesys
ECUInverter
Pump
MotorMotor
EPS Power Pack Case
EOP Power Pack
Plan to introduce ultra-small power pack for EPS with highly reliable safety functions
* EPS: Electric Power Steering* EOP: Electric Oil Pump 26

Global Network to Support “Local Production for Local Consumption”
id ll d id ( li )
Driving full-fledged in-house production of components enhanced by large-scale orders
*
NMA Spain
Nidec Elesys
Nidec (Zhejiang) Nidec Sankyo CMI NMA Germany
NMA Poland Nidec (Dalian)
Nidec GPM (Suzhou)
*
*
Nidec GPM(Germany)
Nidec Elesys (Zhongshan)
Nidec Automotive Motor (Juarez)
Nidec Tosok (San Luis Potosi)
P d t Production tools
Examples of in-house products
Nidec Automobile Motor (Zhejiang)
*
Nidec Elesys AmericasPressed parts Production tools
Nidec India
Molded Parts Processed shafts*
Nidec Tosok (Vietnam) (die casting)
Nidec Elesys (Thailand)Die cast parts
Processed housings
Nidec Tosok (Auto Parts)Nidec GPM (Brazil)
27*Nidec India Private Limited: Starting production in July, 2015*Nidec Tosok de Mexico, S.A. de C.V. : Starting production in May, 2015*NMA: Nidec Motors & Actuators
Seeking Higher Market Shares in Global Auto Parts
Aiming to become one of the leading global suppliers in the electrification age
EPS market and Nidec’s Target DCT market and Nidec’s Target(Million(Million
*
57 61 64 67 70
60
80
g g(Million Units)
Units)
6
8 8 9
10
8
12
20
40 FY2020 Aim for 50% market share
FY2020Aim for 70% market share
6
4
0FY16 FY17 FY18 FY19 FY20
EOP market and Nidec’s Target EWP market and Nidec’s Target(Million (Million
Market
Nidec Group*
0FY16 FY17 FY18 FY19 FY20
EOP market and Nidec s Target EWP market and Nidec s Target(Million Units)
(Million Units)
8 9
11 11
8
12
21 25
28 31 34
28
35
FY2020Aim for 30% market share
FY2020Aim for 20%
6
4
8
7
14
21
market share market share
*DCT: Dual Clutch Transmission *EWP: Electric Water Pump 28(Nidec estimates based on various sources)
0FY16 FY17 FY18 FY19 FY20
0FY16 FY17 FY18 FY19 FY20
New Mid-Term Strategic Targets for ACIM *
Adding value by evolving from discrete product to solution provider
600(Sales in Billions of Yen)
新中期戦略目標Strategy 1 5 Market Approaches
Sharing best practices among acquired
600400to
600
Sharing best practices among acquired companies450
Strategy 2 Steady Organic Growth
Maximizing sales & profitability on back*
300263
280
of transition to BLDC and invertors*
150Strategy 3 Proposing Solutions
Transforming the nature of business fromdi t d t t l ti id
FY14 FY15 FY16 FY17 FY18 FY19 FY20
discrete product to solution provider
(Target)(Forecast)29
*ACIM: Appliance, Commercial & Industrial Motor*BLDC: Brushless Direct Current Motors
5 Markets of ACIM
Serving markets with a globally integrated structureNidec AvtronA i
Nidec Techno Nidec Sole M
Nidec Motor Corporation
Nidec ASI
Nidec Kinetek Automation
FY08 FY09 FY10 FY11 FY12 FY13 FY14
Motor Motor
Sharing best practices in areas such as strategy planning, CFO function, HRM,
R&D intellectual property and purchasing
Commercial & Residential
Global Industrial Elevator & Nidec Techno
R&D, intellectual property and purchasing
Residential SolutionsAppliance SolutionsDrive SystemsMotor
Air conditioning motors, high efficiency industrial
Motors for washing machines, dryers, dish-
Commercial & residential air conditioner motors,
Elevator packages and related products, drives
Motors for industrial equipment and machines,
motors washers and kitchen ventilators
pool & spa pumps, gear motors for kitchen appliances
systems for autonomous electric devices
power electronic products such as drives (invertors), automation
30

Evolution of ACIM Business Model
Adding value by evolving from discrete product to solution provider
MotorsGenerators
Drives &Controls
Gears &Gearboxes
Service & Distribution
Automation Platform
Renewable Energy Storage System
Elevator packages
Industrial Solutions
Elevator &
South East Asia
Expan
Expand
Low speed electric vehicle
China new energy vehicle
Elevator & Drive Systems
Commercial & Residential
S l i
China
Europe / Middle East
nd Geogra
Custom
er
Automated Guided Vehicle
Aftermarket
Solutions
Global Appliance
Middle East
Americas
aphicR
eac
r/Market D
Integrated motor-drive system
Nidec Techno Motor
Japan
chDepth
Discrete Product Module Sale Solution Sale
Internet of Things
31
Long-Term Vision: Aiming for 10 Trillion Yen Sales by FY2030
Continuous growth for 42 years by turning big dreams into realityFY2030 target10T Y l
FY2025 target5T Yen sales
10T Yen sales
1973 1988 2001 2003
FY 2020 target2T Yen sales &15% operating
Initial Public
Offering
Listed on NYSE
New HQ on % p gincome ratio
Reached1T Yen
It all started with just 4g New HQ on
30th anniversary
1979 1984 1995 1998 2012
Production ofspindle motorsfor 8” HDDs
Expanded axialflow fans thruUS acquisition
Began R&D ofauto
Expanded Appliance &Commercial
Set foot into solar& wind powergeneration
Operating IncomeSales
motors motors
1973 1980 1990 2000 2010 2014 2020 2025 2030
Operating Income
First growth phase
(FY)
Second growth phase 32

Business Structure Eyeing FY2030 Facilities to promote in-house development of fundamental R&D
capabilities, optimum production engineering methods and global talent
Corporate university toThe Lab aims to realize
ti d ti
Nidec R&D Center, Japan(Opened in June 2012)
Corporate university to transplant “Nagamori-ism” to prospective executives
optimum production engineering methods suited for the age of Industry 4.0
Rendering Rendering
Nidec Business School Production Engineering Laboratory(Scheduled to open in FY 2016) (Scheduled to open in FY 2016 or later) 33
Aiming to Create New Large Businesses for 10 Trillion Yen Sales
Adding values of Nidec Group products through Internet of Things
Machine to machine S tS t S tS tS tS t S tS tMachine to machine-based IoT solution
Control cloud Big data analysis IoT visualization
SmartFactorySmart
FactorySmartPressSmartPress
SmartAGVSmartAGV
SmartEnergySmartEnergy*
Application/solution
Platform
N t k
Control cloudserver
Internet or Intranet
Big data analysisengine
IoT visualizationtool
Network
DeviceFactory
access point
Build a system based on our expertise on devices Power conditionerSensor
Measuringequipment
Manufacturingequipment
Smart hub
AGV*
Connect to cloud servers using sensing & communication terminalsg
LogisticsProduction linePhotovoltaic
generation/irrigation pump
Industries
34*AGV: Automated Guided Vehicle

Nidec IR Contacts
Japan Tel: +81-75-935-6140 E-mail: [email protected]. Tel: +44-870-351-7388 E-mail: [email protected]. Tel: +1-212-703-7988 E-mail: [email protected]
*Notes:Pursuant to ASC 805 “Business Combinations,” consolidated financial statements for 4QFY2013,1QFY2014 and 2QFY2014 have been retrospectively adjusted to reflect our valuation of the fair values of the assets acquired and the Q p y j qliabilities assumed upon the acquisitions of Nidec Sankyo CMI Corporation and Nidec Elesys Corporation in the fiscal year ended March 31, 2014. During 3QFY2014, we completed our valuation of such assets and liabilities of Nidec Sankyo CMI Corporation and Nidec Elesys Corporation.
Nidec logo is a registered trademark or a trademark of Nidec Corporation in Japan, the United States and/or certain other countries. “All for dreams” logo is a registered trademark of Nidec Corporation in Japan, and a trademark in the United States and/or certain other countries.
35
Appendix
Performance TrendsPerformance Trends&
Product Group Overview
36

Sales by Product Group (FY2014)
0.6%
Electronic & Optical Components
Electronic & Optical Components
OthersOthers
Logistics, services, i l d t
Parenthetic percentages represent FY2013 mix
38.7%
0.6%(0.9%)
Small Precision MotorsSmall Precision MotorsCamera shutters, switches, trimmer potentiometers, processing, precision plastic mold products
musical products
6.3% 38.7%(41.4%)
19.8%
9.6%(9.9%)
6.3%(8.3%)
HDD Motors
MachineryMachinery
Industrial robots, circuit board testers, high-speed
1,028.4B
Other Small MotorsOptical disk drive motorsOA equipment motorspolygon scanners
(21.2%)
18 9%
Appliance Commercial
board testers, high speed pressing machines, chip mounters, measuring equipment, power transmission
MPU cooling fansgame machine fansPC/communications equipment fans, home
18.9%(20.2%)
Auto
Commercial Industrial
25.6%(25.8%)
power transmission equipment, factory automation system, card readers
44.7%
appliance fans,automobile fans,vibration motors,brush motors,
19.1%(13.6%)
Automotive, Automotive, Appliance, Appliance,
Commercial Commercial and Industrialand Industrial
Automotive, Automotive, Appliance, Appliance,
Commercial Commercial and Industrialand Industrial 44.7%
(39.5%) stepping motors,actuator units
and Industrial and Industrial ProductsProducts
and Industrial and Industrial ProductsProducts
37
Consolidated Sales & Operating Income
Sales (LHS) Operating Income (RHS) Operating Income Ratio
(Billions of Yen)(Billions of Yen)
274.6264.3
249.3228 4
240.2
300 50
228.4218.4211.3 217.1
11.1%10.9%10.8%
10.4%9 8% 10.4% 10 1% 26 9 28.8
30.5
8.5%
9.8% 10.4% 10.1%
18.021.3 22.5 23.0
25.026.9
1Q/FY13 2Q 3Q 4Q 1Q/FY14 2Q 3Q 4Q00
38*Please refer to Notes on page 35.
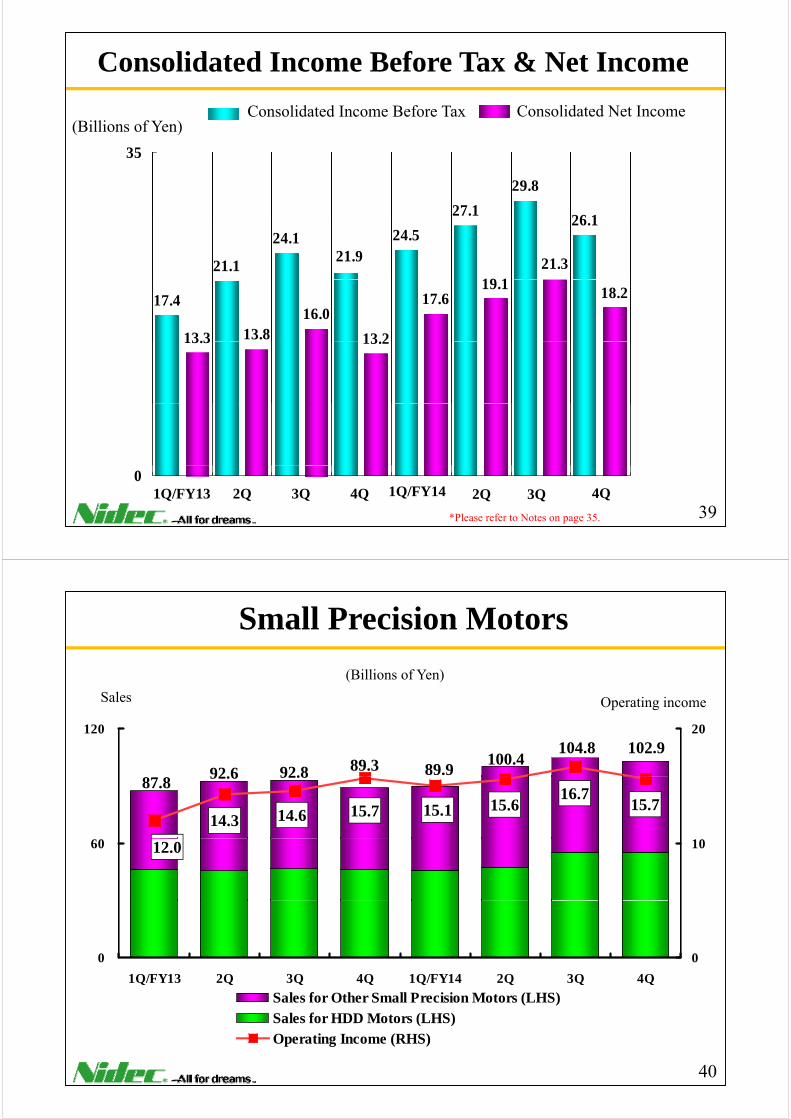
Consolidated Income Before Tax & Net Income
35
Consolidated Income Before Tax Consolidated Net Income(Billions of Yen)
27.1
29.8
26 1
35
21.1
24.1 24.5
19 121.3
26.1
21.9
13.3 13.816.0
13 2
17.619.1
18.217.4
13.3 13.2
01Q/FY13 2Q 3Q 4Q 1Q/FY14 2Q
393Q 4Q
*Please refer to Notes on page 35.
Small Precision Motors
(Billions of Yen)
Operating incomeSales
120 20
92.892.6 89.3 89.9100.4
104.8 102.9
87.892.892.6
14.315.714.6 15.1 15.6
16.715.7
60 1012.0
0 0
1Q/FY13 2Q 3Q 4Q 1Q/FY14 2Q 3Q 4Q
Sales for Other Small Precision Motors (LHS)Sales for HDD Motors (LHS)( )Operating Income (RHS)
40

Automotive, Appliance, Commercial and Industrial Products
150 15
Operating incomeSales(Billions of Yen)
150 15
110.2 108.1 114.9126.7
8.69.3
10.3
7.48.6
100 10
80.084.1 83.0
98.2
5.1 5.34.550 5
0
1Q/FY13 2Q 3Q 4Q 1Q/FY14 2Q 3Q 4Q
0
Q Q Q Q Q Q Q Q
Sales for Automotive (LHS)
Sales for Appliance, Commercial, Industrial (LHS)
O i I (RHS)Operating Income (RHS)
41*Please refer to Notes on page 35.
Machinery
(Billions of Yen)Operating incomeSales
4.74.9
30 6
23.8 23.5 22.3 22.726.1
27.7
4.7
3.8
2.92.8
3.1 2.83.3
20 419.9 19.722.3
10 2
0
1Q/FY13 2Q 3Q 4Q 1Q/FY14 2Q 3Q 4Q
0
Sales(LHS) Operating Income (RHS)
42

Electronic & Optical Components
(Billions of Yen)
Operating incomeSales
1 4
20 217.519.9 19.8
15.6 16.2
p g
16.3 16.7 15.81.4
1.7 1.31.1 1.30.810 1
-0.30
1Q/FY13 2Q 3Q 4Q 1Q/FY14 2Q 3Q 4Q
0
-0.8
-20
-10
-2
-1
20 2
Sales(LHS) Operating Income (RHS)
43
Others
(Billions of Yen)
3 0.6
Operating incomeSales
2 0.42.0 2.01.8 1.8
1.6 1.7 1.81.5
0.2
0.3
0 00.2
0 20 2
1 0.2
1.5
0.20.1
0.00.20.00.2
0
1Q/FY13 2Q 3Q 4Q 1Q/FY14 2Q 3Q 4Q
0
Sales(LHS) Operating Income (RHS)
44