Embed Size (px)
Citation preview

Second Quarter 2014 Trading Update
15 July 2014

PageGroup Second Quarter 2014 Trading Update | 2
Group Overview
Q2 Gross Profit
• +9% in constant currency • +2% in reported rates • Y-o-Y growth in all regions
H1 Headcount
• FE in Q2 +72 (+2%)
• +177 Fee Earners in H1
• + 30 Support staff in H1
• Other investment
Impact of FX
• Q2 Gross Profit lower by c.£10m
• c.£19m in H1
H1 Financial Position
• Cash of £41m at 30 June
• £22m Final dividend paid
• £25m EBT share hedging

PageGroup Second Quarter 2014 Trading Update | 3
Group Trading Performance
Growth Rates
Group Gross Profit £m £m Reported Constant
Q2 2014 vs Q2 2013 137.2 135.1 +1.5% +8.9%
Q2 2014 vs Q1 2014 137.2 126.6 +8.4% +8.9%
H1 2014 vs H1 2013 263.7 261.9 +0.7% +7.9%
H1 2014 vs H2 2013 263.7 251.9 +4.7% +12.2%
FX Impact YoY
• Q2 2014 reported rates: GP £10m lower
• H1 2014 reported rates: GP £19m lower

PageGroup Second Quarter 2014 Trading Update | 4
Group Permanent:Temporary
Q2 2014 Q2 2013 Growth Rates
Perm:Temp Gross Profit £m £m Reported Constant
Permanent 106.1 104.7 +1.3% +9.4%
Temporary 31.1 30.4 +2.4% +7.4%
Ratio (Perm:Temp) 77:23 77:23
• Perm:Temp ratio remains at 77:23
• Permanent growth ahead of temporary in constant currency • Reflection of geographic mix of business:
– due to strong GP growth in regions with little / no temp: LatAm, Asia, etc.
H1 2014 H1 2013 Growth Rates
Perm:Temp Gross Profit £m £m Reported Constant
Permanent 203.7 202.6 +0.5% +8.4%
Temporary 60.0 59.3 +1.2% +6.1%
Ratio (Perm:Temp) 77:23 77:23
PageGroup Second Quarter 2014 Trading Update | 5
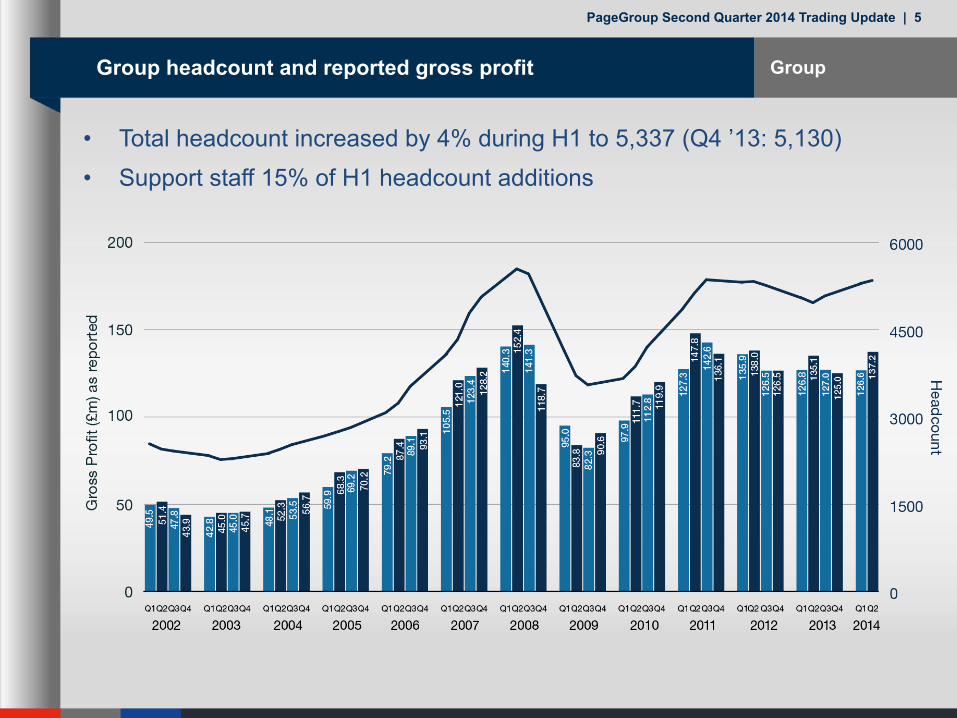
Group Group headcount and reported gross profit
• Support staff 15% of H1 headcount additions • Total headcount increased by 4% during H1 to 5,337 (Q4 ’13: 5,130)
PageGroup Second Quarter 2014 Trading Update | 6
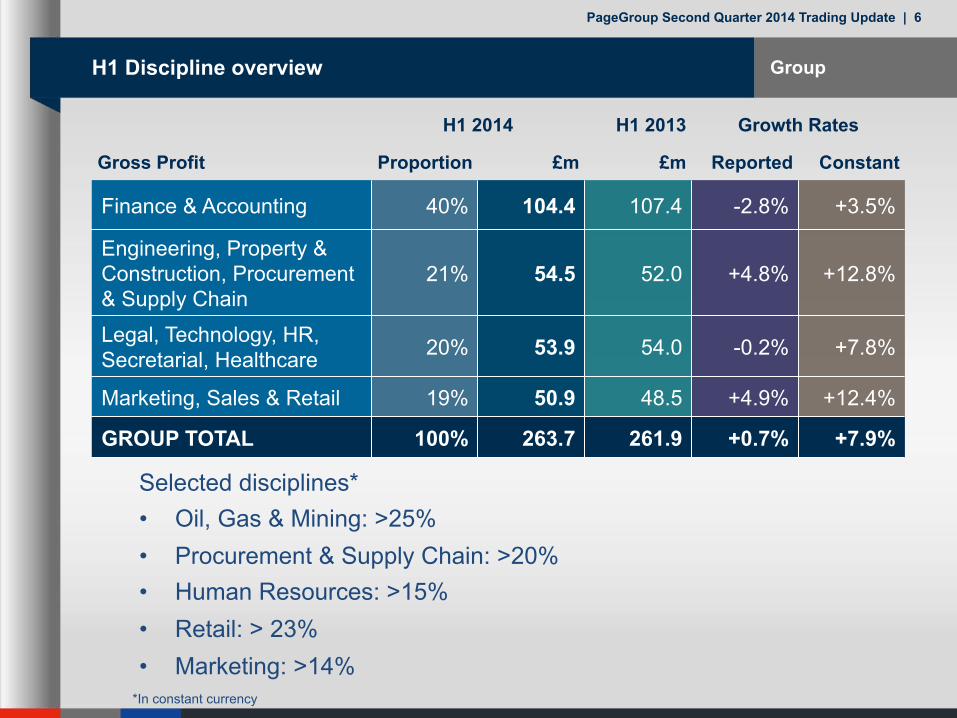
Group H1 Discipline overview
H1 2014 H1 2013 Growth Rates
Gross Profit Proportion £m £m Reported Constant
Finance & Accounting 40% 104.4 107.4 -2.8% +3.5%
Engineering, Property & Construction, Procurement & Supply Chain
21% 54.5 52.0 +4.8% +12.8%
Legal, Technology, HR, Secretarial, Healthcare 20% 53.9 54.0 -0.2% +7.8%
Marketing, Sales & Retail 19% 50.9 48.5 +4.9% +12.4%
GROUP TOTAL 100% 263.7 261.9 +0.7% +7.9%
Selected disciplines* • Oil, Gas & Mining: >25% • Procurement & Supply Chain: >20% • Human Resources: >15% • Retail: > 23% • Marketing: >14%
*In constant currency

PageGroup Second Quarter 2014 Trading Update | 7
Group Q2 Regional overview
Q2 2014 Q2 2013 Growth Rates
Gross Profit Proportion £m £m Reported Constant
EMEA 40% 54.8 55.0 -0.5% +5.0%
UK 25% 34.8 31.3 +11.1% +11.1%
Asia Pacific 21% 28.3 28.2 +0.6% +14.2%
Americas 14% 19.3 20.6 -6.6% +8.7%
Group Total 100% 137.2 135.1 +1.5% +8.9%
• 20 countries (56% of Group) grew >10%*
• Large, High Potential markets: +15%*
• Record quarters for 15 countries
*In constant currency

PageGroup Second Quarter 2014 Trading Update | 8
Group Year-on-Year Gross Profit growth rates
2013 2014
Q1 Q2 Q3 Q4 Q1 Q2
EMEA -15.0% -8.2% -7.1% -1.4% +5.7% +5.0%
UK -1.2% +0.3% +5.0% +5.1% +8.1% +11.1%
Asia Pacific -0.3% -8.0% -4.3% -5.7% +1.3% +14.2%
- Asia +13.5% +1.6% +7.4% +2.7% +8.0% +25.0%
- Australasia -16.1% -21.3% -19.7% -18.3% -9.5% -2.9%
Americas +2.1% +9.8% +16.8% +6.7% +16.2% +8.7%
- North America +15.8% +29.8% +26.0% +30.0% +30.5% +15.7%
- Latin America -2.1% +1.4% +12.6% -4.8% +7.4% +4.4%
Group Total -6.7% -3.8% -0.3% +0.3% +6.8% +8.9%
Growth rates in constant currency
PageGroup Second Quarter 2014 Trading Update | 9
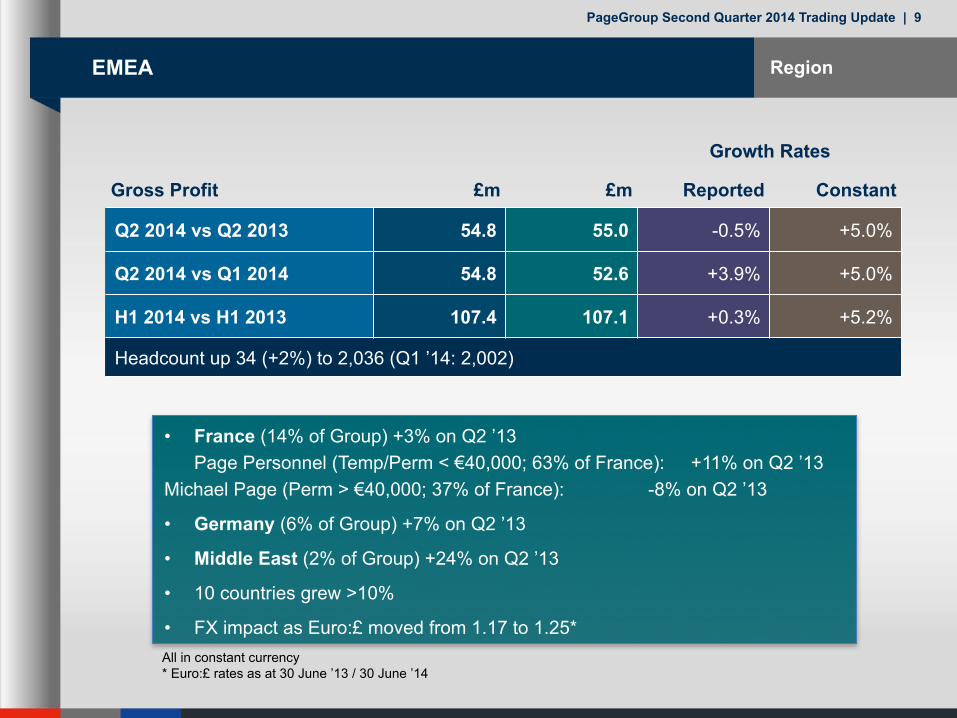
EMEA
Growth Rates
Gross Profit £m £m Reported Constant
Q2 2014 vs Q2 2013 54.8 55.0 -0.5% +5.0%
Q2 2014 vs Q1 2014 54.8 52.6 +3.9% +5.0%
H1 2014 vs H1 2013 107.4 107.1 +0.3% +5.2%
Headcount up 34 (+2%) to 2,036 (Q1 ’14: 2,002)
• France (14% of Group) +3% on Q2 ’13 Page Personnel (Temp/Perm < €40,000; 63% of France): +11% on Q2 ’13
Michael Page (Perm > €40,000; 37% of France): -8% on Q2 ’13
• Germany (6% of Group) +7% on Q2 ’13
• Middle East (2% of Group) +24% on Q2 ’13
• 10 countries grew >10%
• FX impact as Euro:£ moved from 1.17 to 1.25*
Region
All in constant currency * Euro:£ rates as at 30 June ’13 / 30 June ’14

PageGroup Second Quarter 2014 Trading Update | 10
Region UK
Gross Profit £m £m Growth Rates
Q2 2014 vs Q2 2013 34.8 31.3 +11.1%
Q2 2014 vs Q1 2014 34.8 32.8 +6.2%
H1 2014 vs H1 2013 67.6 61.4 +10.1%
Headcount up 11 (+1%) to 1,361 (Q1 ’14: 1,350)
• Private sector +11% on Q2 ’13
• Public sector +14% on Q2 ’13 (12% of UK)
• 5 out of 13 disciplines >10%
• Financial Services remains flat (3% of UK)
• Strong performances in HR, Finance & Accounting, Marketing

PageGroup Second Quarter 2014 Trading Update | 11
Region Asia Pacific
• Asia (14% of Group and 68% of Asia Pacific) +25% on Q2 ’13
• Greater China +37% on Q2 ’13
• Australia and New Zealand (7% of Group and 32% of Asia Pacific) -3% on Q2 ’13 (from -10% last quarter)
• Regional FX impact of nearly £4m in Q2
• Records in Japan, China, Malaysia
Growth Rates
Gross Profit £m £m Reported Constant
Q2 2014 vs Q2 2013 28.3 28.2 +0.6% +14.2%
Q2 2014 vs Q1 2014 28.3 23.0 +23.4% +23.5%
H1 2014 vs H1 2013 51.3 54.3 -5.5% +7.8%
Headcount flat at 1,114 (Q1 ’14: 1,112)
All in constant currency

PageGroup Second Quarter 2014 Trading Update | 12
Region Americas
• Latin America (8% of Group) +4% on Q2 ’13
• Brazil (58% of LatAm) -7% on Q2 ’13 and -4% on Q1
• LatAm excluding Brazil +24%
• Argentina and Colombia grew >40%
• North America (6% of Group) +16% on Q2 ’13
• US +17% on Q2 ’13 against increasingly tough comparators
Growth Rates
Gross Profit £m £m Reported Constant
Q2 2014 vs Q2 2013 19.3 20.6 -6.6% +8.7%
Q2 2014 vs Q1 2014 19.3 18.1 +6.3% +5.8%
H1 2014 vs H1 2013 37.4 39.1 -4.4% +11.8%
Headcount up 5 (+1%) to 826 (Q1 ’14: 821)
All in constant currency

PageGroup Second Quarter 2014 Trading Update | 13
Large High Potential Markets Strategic Focus: Large, High Potential Markets
• Strategy implemented in 2013
• Response to experience of 2009-2011 - FE headcount cuts impacted ability to respond as markets quickly recovered
• Commitment to invest through cycles
• Set criteria to qualify as Large, High Potential Market
• 5 markets identified: comprises 30% FY13 Group Gross Profit
US Germany China LatAm SE Asia

PageGroup Second Quarter 2014 Trading Update | 14
Large High Potential Markets Market Criteria: Large, High Potential Markets
Macro criteria • Leading global economies, positive long-term macro prospects • Ideally, under-developed recruitment outsourcing penetration • Scalable business opportunity / receptive marketplace • Attractive conversion rate potential
PageGroup criteria • PageGroup recruitment model proven locally • Ability to hire / retain / promote local consultants • Strength & depth in PageGroup management experience
able to move into market • Attractive salary levels & potential fee rates
PageGroup Second Quarter 2014 Trading Update | 15
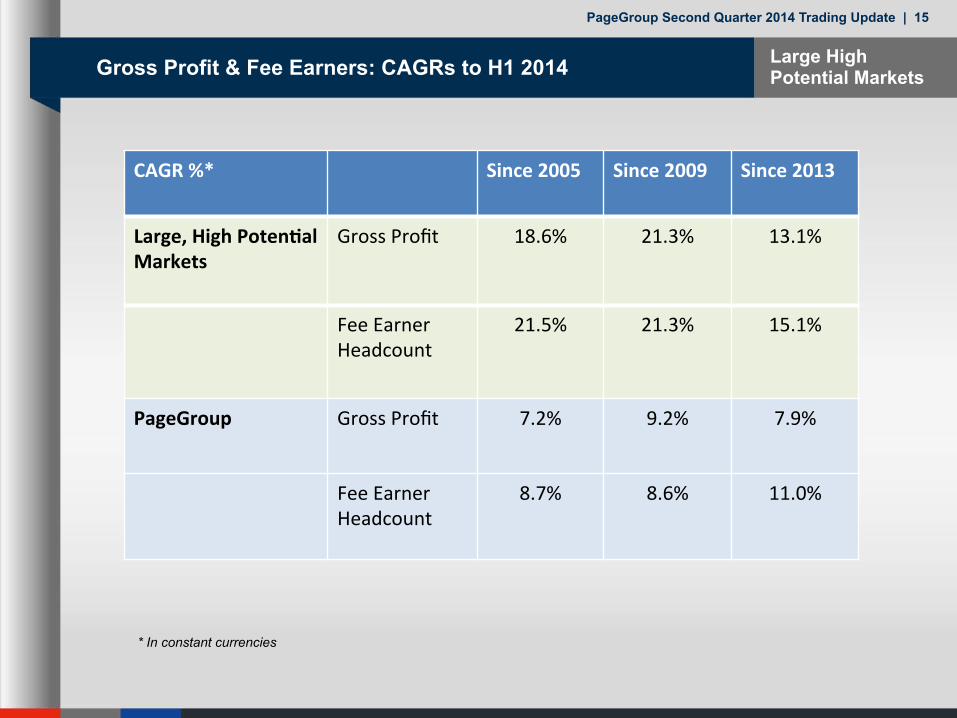
Large High Potential Markets Gross Profit & Fee Earners: CAGRs to H1 2014
CAGR %* Since 2005 Since 2009 Since 2013
Large, High Poten=al Markets
Gross Profit 18.6% 21.3% 13.1%
Fee Earner Headcount
21.5% 21.3% 15.1%
PageGroup Gross Profit 7.2% 9.2% 7.9%
Fee Earner Headcount
8.7% 8.6% 11.0%
* In constant currencies

PageGroup Second Quarter 2014 Trading Update | 16
Large High Potential Markets Performance: 2005 to 2013
£m / no. FEs 2005 2009 2013
Germany Gross Profit 10.7 19.6 29.0 Fee Earners 66 144 198
US Gross Profit 7.8 11.6 23.6 Fee Earners 80 95 211
LatAm Gross Profit 6.3 17.1 40.5 Fee Earners 58 159 384
China Gross Profit 7.4 8.8 31.0 Fee Earners 38 68 347
SE Asia Gross Profit 4.7 4.1 14.4 Fee Earners 21 21 118
Total Gross Profit 37 61 139 Fee Earners 263 487 1,258
* Figures stated are in single rate sterling, using closing rates H1 2014

PageGroup Second Quarter 2014 Trading Update | 17
Large High Potential Markets 2014 Business Environment
Macro environment
Professional recruitment Job Count Candidates
Fee rates/ salaries
GermanyGDP: +2.5%
Posi>ve, improving, but not yet robust
Confidence slowly improving; Perm candidates s>ll cau>ous
Slight increase vs 2013; limited momentum
Candidate-‐short in technical disciplines & temp market
Fee rates above Group average; salaries above European average
US GDP: +3.2%
Remains posi>ve, some long-‐term macro concerns
Confidence high amongst clients/ candidates
Remaining steady vs 2013
Candidate-‐short market in most areas
Fee rates above Group average, high salaries
LatAm GDP: +2.9%
Brazil/Argen>na challenging; elsewhere posi>ve
Buoyant market where macro strength
Ex-‐Brazil, improving trends
Candidate-‐short, par>cularly in technical areas
Posi>ve fee rates, wage infla>on
China GDP: +7.3%
Long-‐term GDP slowing, but s>ll strong
Limited compe>>on in largest of ci>es, elsewhere in infancy
Steady, healthy job flow
Limited, but growing talent pool; strong bilingual demand
Good fee rates, wage infla>on
SE Asia GDP: +6.3%
Stable in key markets; overall posi>ve commercial environment
Singapore is mature; Malaysia etc. have significant poten>al
Stable in Singapore, posi>ve trends elsewhere
Candidate-‐short in many areas
Fee rates v. strong; salaries high in Singapore, acceptable elsewhere
GDP estimates: av. 2015-16F. Source: Citi

PageGroup Second Quarter 2014 Trading Update | 18
Large High Potential Markets Strategy in 2014
Germany Expanding FE headcount Building temp business scale & capability; leveraging leading perm posi>on
US Transfers-‐in of experienced Page management (2 MDs YTD) Broadening of disciplines; opening of L.A. Office; growth of FE headcount
LatAm Cost base flexed by management transfers both within / outside region Brazil -‐ niche markets; FE growth in Mexico, Colombia & Chile; launch in Peru
China Ongoing hiring of FEs; discipline roll-‐out through office network Development of experienced local Chinese management base (80% of mgmt)
SE Asia Growing FE headcount in Singapore & Malaysia Expanding disciplines & territories; teams dedicated to Indonesia & Thailand

PageGroup Second Quarter 2014 Trading Update | 19
Conclusion
• Solid performance, improving trends
• High Potential Markets in positive growth
• Infrastructure roll-out: Website & PRS (Page Recruiting System) rolled out in more US offices (rest of US & UK starts in Q3)
• Remains in strong cash position following dividend & EBT cash outflows
• Leading KPI indicators positive for start of H2

PageGroup Second Quarter 2014 Trading Update | 20
Cautionary Statement
The information contained in this presentation is not audited, is for personal use and informational purposes only and is not intended for distribution to, or use by, any person or entity in any jurisdiction in any country where such distribution or use would be contrary to law or regulation, or which would subject any member of PageGroup to any registration requirement.
Certain statements included or incorporated by reference within this presentation may constitute “forward-looking statements” that are based on current expectations or beliefs, as well as assumptions about future events. There are risk factors that can cause actual results to differ materially from those expressed in or implied by such statements. Accordingly, no assurance can be given that any particular expectation will be met and reliance should not be placed on any forward-looking statement.
PageGroup disclaims any intention or obligation to revise or update any forward-looking statements that may be made in this presentation, regardless of whether those statements are affected as a result of new information, future events or otherwise. Nothing in this presentation should be construed as a profit forecast.
This presentation does not constitute or form part of any offer or invitation to sell, or any solicitation of any offer to purchase any shares in the Company, nor shall it or any part of it or the fact of its distribution form the basis of, or be relied on in connection with, any contract or commitment or investment decision relating thereto, nor does it constitute a recommendation regarding the shares of the Company. Past performance cannot be relied upon as a guide to future performance. Liability arising from anything in this presentation shall be governed by English Law. Nothing in this presentation shall exclude any liability under applicable laws that cannot be excluded in accordance with such laws.

PageGroup 2013 half year results | 21
PageGroup Second Quarter 2014 Trading Update | 22
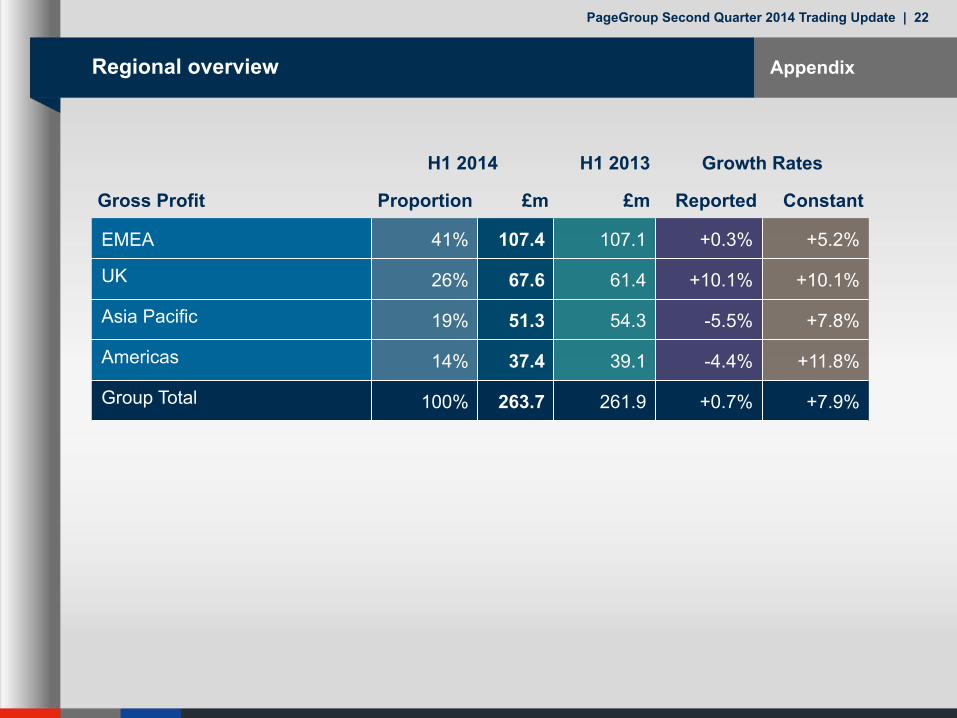
Appendix Regional overview
H1 2014 H1 2013 Growth Rates
Gross Profit Proportion £m £m Reported Constant
EMEA 41% 107.4 107.1 +0.3% +5.2%
UK 26% 67.6 61.4 +10.1% +10.1%
Asia Pacific 19% 51.3 54.3 -5.5% +7.8%
Americas 14% 37.4 39.1 -4.4% +11.8%
Group Total 100% 263.7 261.9 +0.7% +7.9%