Embed Size (px)
Citation preview

9HSTFMG*agaejb+
ISBN 978-952-60-6049-1 (printed) ISBN 978-952-60-6050-7 (pdf) ISSN-L 1799-4934 ISSN 1799-4934 (printed) ISSN 1799-4942 (pdf) Aalto University School of Electrical Engineering Department of Radio Science and Engineering www.aalto.fi
BUSINESS + ECONOMY ART + DESIGN + ARCHITECTURE SCIENCE + TECHNOLOGY CROSSOVER DOCTORAL DISSERTATIONS
Aalto-D
D 8
/2015
The dissertation presents three new methods to deal with certain limitations occurred during the antenna measurement processes. First, a new technique using the Chebyshev polynomials has been proposed to process the antenna measurements obtained in non-anechoic sites to obtain equivalent free space radiation patterns. Second, a new antenna pattern retrieval method from reflection coefficient measurements is proposed. Third, a new technique is presented to realize a wideband hologram compact antenna test range by linearly adjusting the feed location. The dissertation also discusses characterization of quasi-optics, i.e. MEMS-based high-impedance surface (HIS) and reflectarray elements. First, the reflection properties of the unit cell structure of MEMS-based HIS is studied, and beam steering of a large structure at 80 GHz has been demonstrated with a simplified model. Second, the design and optimization process of reconfigurable reflectarray element integrated with MEMS-based phase shifter at 120 GHz is studied.
Zhou D
u D
evelopment of C
haracterization Methods for A
ntennas and Quasi-O
pitcs A
alto U
nive
rsity
Department of Radio Science and Engineering
Development of Characterization Methods for Antennas and Quasi-
Zhou Du
DOCTORAL DISSERTATIONS
Op cs ti

Aalto University publication series DOCTORAL DISSERTATIONS 8/2015
Development of Characterization Methods for Antennas and Quasi-Optics
Zhou Du
A doctoral dissertation completed for the degree of Doctor of Science (Technology) to be defended, with the permission of the Aalto University School of Electrical Engineering, at a public examination held at the lecture hall S1 of the school on 30 January 2015 at 12 noon.
Aalto University School of Electrical Engineering Department of Radio Science and Engineering

Supervising professor Prof. Antti V. Räisänen Thesis advisors Dr. Juha Ala-Laurinaho Asst. Prof. Ville Viikari Preliminary examiners Prof. Claire Migliaccio, University of Nice Sophia Antipolis, France Prof. Manuel Sierra Castañer, Technical University of Madrid, Spain Opponent Assoc. Prof. Sergey Pivnenko, Technical University of Denmark, Denmark
Aalto University publication series DOCTORAL DISSERTATIONS 8/2015 © Zhou Du ISBN 978-952-60-6049-1 (printed) ISBN 978-952-60-6050-7 (pdf) ISSN-L 1799-4934 ISSN 1799-4934 (printed) ISSN 1799-4942 (pdf) http://urn.fi/URN:ISBN:978-952-60-6050-7 Unigrafia Oy Helsinki 2015 Finland

Abstract Aalto University, P.O. Box 11000, FI-00076 Aalto www.aalto.fi
Author Zhou Du Name of the doctoral dissertation Development of Characterization Methods for Antennas and Quasi-Optics Publisher School of Electrical Engineering Unit Department of Radio Science and Engineering
Series Aalto University publication series DOCTORAL DISSERTATIONS 8/2015
Field of research Radio Engineering
Manuscript submitted 16 September 2014 Date of the defence 30 January 2015
Permission to publish granted (date) 26 November 2014 Language English
Monograph Article dissertation (summary + original articles)
Abstract This dissertation focuses on the development of characterization methods for antennas and
quasi-optical components. The dissertation presents three new methods to deal with certain limitations occurred during the antenna measurement processes. First, a new technique using the Chebyshev polynomials has been proposed to process the antenna measurements obtained in non-anechoic sites to obtain equivalent free space radiation patterns. This new technique combines the principle of a FFT-based method with the special relationship between coefficients of the Bessel-Chebyshev polynomials. Experimental results are presented to demonstrate the potential of this approach over conventional time gating techniques for a certain class of problems. Second, a new antenna pattern retrieval method is proposed. In this method, the antenna reflection coefficient is measured many times when a unique reflective load with known spatial reflection properties is placed near the antenna in each measurement. The antenna pattern is obtained from the measurements with an inversion algorithm. Simulations have been used to verify the theoretical basis and the method has been experimentally demonstrated at 30 GHz. The results show that the method could enable sufficient accuracy with low gain antennas or in the vicinity of main lobe with directive antennas. Third, a new technique is presented to realize a wideband hologram compact antenna test range (CATR) by linearly adjusting the feed location. The wideband formulas for linearly adjusting the feed have been discussed and verified. The performance of the wideband operation has been demonstrated by the measured results at W (95 GHz) and D (170 GHz) bands for the hologram aperture diameter of 350 mm. The dissertation also discusses characterization of quasi-optics, namely, MEMS-based high-impedance surface (HIS) and reflectarray elements. First, the reflection properties of the single unit cell structure of MEMS-based HIS is studied, tunability of the MEMS varactors and beam steering of a large structure at 80 GHz has been demonstrated with a simplified model. The structure allows steering of the beam within the range from -45º to +45°. A quasi-optical measurement setup has been built for the experimental characterization. Second, the design and optimization process of reconfigurable reflectarray element integrated with MEMS-based phase shifter at 120 GHz is studied. Also, the dielectric properties of SU-8 substrate have been characterized with on-wafer measurements. Several design parameters which could affect the modulation efficiency have been studied.
Keywords antenna measurement, pattern retrieval, reflection coefficient, compact range, high-impedance surface, MEMS, reflectarray element
ISBN (printed) 978-952-60-6049-1 ISBN (pdf) 978-952-60-6050-7
ISSN-L 1799-4934 ISSN (printed) 1799-4934 ISSN (pdf) 1799-4942
Location of publisher Helsinki Location of printing Helsinki Year 2015
Pages 124 urn http://urn.fi/URN:ISBN:978-952-60-6050-7


5
Preface
The research in this dissertation has been mainly carried out at the Dept. of
Radio Science and Engineering of Aalto University (former Helsinki University
of Technology).
First, I would like to express my sincere gratitude to my supervisor, Prof.
Antti Räisänen for accepting me as a doctoral student in his group and for his
trust, encouragement, support, immense knowledge, and guidance during
these years. My two instructors/thesis advisors deserve special thanks. Dr.
Juha Ala-Laurinaho, thank you for your instructions, fruitful discussions,
practical skills which you shared to me, and especially for your rigorous
working attitude which I learned during these years. Prof. Ville Viikari, many
thanks to you for your patience, inspiration, and for always being open to
discuss new ideas and guiding me to find solutions in the project throughout
the final phase of my doctoral studies. It is my great honor and pleasure
working with you and this will definitely be my most cherish moment in Aalto
University.
I warmly thank my main collaborators, Dr. Dmitry Chicherin, Dr. Aleksi
Tamminen, and Dr. Zhiping Li (from Beihang University, Beijing, China) for
our nice collaborations during the research. My thanks go to my present and
former colleagues at the Dept. of Radio Science and Engineering for their help
and discussions, Afroza, Aki, Azremi, Clemens, Jinsong, Juha M, Katsu, Krista,
Linsheng, Reza, Sathya, Subash, Tommi, and many more. The help from
support personnel is appreciated for providing an enjoyable place to work in.
Thank you Eikka, Lauri, Lorenz, Mirjam, Sari, Stina, Timo, Tuula, Viktor.
I would like to thank the pre-examiners of my dissertation, Prof. Manuel
Sierra Castañer and Prof. Claire Migliaccio for their valuable reviews and
insightful comments to improve the quality of this dissertation. My
appreciation also goes to Prof. Sergey Pivnenko for accepting to be the
opponent during the public examination.

6
Prof. Jinhwan Koh from Gyeongsang National University, Jinju, South Korea
deserves thanks for his continuous support after I moved to Finland.
Finally, my deepest thanks go to my family. Without their support and love, I
could not be on this stage. To my parents, thank you for your unconditional
support and encouragement during these years. To my dear wife HeLi (pang
pang), thank you for your endless love, support, encouragement, and
understanding, especially when I was in a difficult time. You will always be my
strong backing and I will be yours. To our little girl Eden, thank you for joining
our family at this very special moment! You brought us a lot of happiness and
we love you so much!
Espoo, Dec. 22, 2014
Zhou Du

7
Contents
Preface ........................................................................................................ 5
List of Abbreviations ..................................................................................9
List of Symbols ......................................................................................... 11
List of Publications .................................................................................. 15
Author’s Contribution .............................................................................. 17
1. Introduction ..................................................................................... 19
1.1 Background, Motivation and Objectives .................................. 19
1.2 Contents of the Dissertation ..................................................... 21
1.3 Scientific Contributions ........................................................... 22
2. Characterization of MEMS-Based High-Impedance Surface ........ 23
2.1 Beam Steering using High-Impedance Surface ...................... 23
2.2 MEMS-based High-Impedance Surface .................................. 24
2.3 Beam Steering with MEMS-Based High-Impedance
Surface ...................................................................................... 25
2.3.1 Equivalent Circuit and Surface Tunability ........................... 25
2.3.2 Reflective Strip Beam Steering ............................................. 27
2.4 Reflection Phase Characterization of MEMS-Based HIS ....... 29
2.4.1 Quasi-Optical Measurement Setup....................................... 31
3. Design and Optimization of Reconfigurable Reflectarray
Element ............................................................................................ 35
3.1 Reconfigurable Reflectarray ..................................................... 35
3.2 Reflectarray Geometry Design ................................................. 36
3.2.1 Element Design .................................................................... 36
3.2.2 SU-8 Photoresist Measurement ........................................... 36

8
3.2.3 Active MEMS Phase Shifter .................................................. 37
3.3 Reflectarray Performance Evaluation ..................................... 38
4. Development of Methods for Antenna Measurement .................... 41
4.1 Generation of Radiation Pattern from Non-Anechoic
Measurements ......................................................................... 42
4.1.1 Description of the Measurement Scheme ........................... 43
4.1.2 FFT-Based Method ............................................................... 44
4.1.3 Chebyshev Polynomial Method ........................................... 45
4.2 Antenna Pattern Retrieval from Reflection Coefficients ........ 48
4.2.1 Reflection Coefficients and Antenna Aperture Field .......... 48
4.2.2 Simulations and Experiments .............................................. 50
4.2.3 Solving the Antenna Aperture Field ..................................... 51
4.3 Realization of Wideband Hologram Compact Antenna
Test Range ............................................................................... 53
4.3.1 Derivation of Wideband Formulas ...................................... 53
4.3.2 Experimental Verification and Performance........................ 55
5. Summary of the Publications ........................................................... 57
6. Conclusions and Future Work ......................................................... 61
Reference ................................................................................................. 63
Errata ........................................................................................................ 71

9
List of Abbreviations
1D 1 dimensional / 1 dimension
2D 2 dimensional / 2 dimensions
3D 3 dimensional / 3 dimensions
AUT Antenna under test
BW Bandwidth
CATR Compact antenna test range
CB-CPA Conductor-backed coplanar patch antenna
CB-CPW Conductor-backed coplanar waveguide
CGM Conjugate gradient method
CPA Coplanar patch antenna
CPW Coplanar waveguide
DC Direct current
EU European Union
FFT Fast Fourier Transform
FP7 The Seventh Framework Programme
HCATR Hologram-based compact antenna test range
HFSS High frequency structural simulator
HIS High-impedance surface
KTH Kungliga Tekniska Högskolan / Royal Institute of Technology
MEMS Microelectromechanical systems
MMID Millimeter-wave identification
PEC Perfect electric conductor
PP Peak-to-peak (derivation of the amplitude and phase response in quiet-zone)

List of Abbreviations
10
RCS Radar cross section
RF Radio frequency
RFID Radio-frequency identification
SEM Scanning electron microscopy
TD Time delay
TEKES Innovaatiorahoituskeskus / Finnish Funding Agency for Innovation
VTT Teknologian tutkimuskeskus VTT / VTT Technical Research Centre of Finland
WR Waveguide rectangular

11
List of Symbols
an Expansion coefficient of the polynomials
A Aperture dimension of the pyramidal horn antenna
Ainitial Initial guess of the amplitude
B Aperture dimension of the pyramidal horn antenna
c Speed of light
d Distance between hologram and the quiet-zone
dm Parallel separation between the metal plate and the AUT/probe
dp Distance between the probe and the AUT
D Largest dimension of the AUT aperture
DH Dimension of the hologram
Dmove Relative moving distance of reflective load
E Electric field
E0 Specular reflection of the electric field of the reflectarray element
EAUT(x, y, z) Electrical aperture distribution at the plane z
Em Modulated electric field of the reflectarray element
EΓ(x, y, z) Field reflected from the reflective surface at the plane z
f0 Resonance frequency
fM2 Frequency index
F Focal length
F’ Adjusted focal length
G Gap between patch and ground
Gf Gap between signal strip and ground
H Horizontal polarization
l2 Frequency scaling factor

List of Symbols
12
L Length of the reflective load
Lf Length of CPW feed line
Lhorn Flare length of the pyramidal horn antenna
Lp Reflectarray element patch length
LWG Waveguide length of the pyramidal horn antenna
M Scaled value in wideband HCATR
M2 The number of the frequency domain data
N Number of degree in the polynomials
R Reflection coefficient
S Aperture surface
S11 Reflection coefficient referenced to the antenna feed
S11, aperture Reflection coefficient referenced to aperture plane of a lossless and perfectly matched antenna
S11, static Constant term in reflection coefficient due to impedance mismatch
S21(f, ) Transmission coefficient / Frequency and angular domain response
S21(t, ) Transmission coefficient / Temporal and angular domain response
S-parameter Scattering parameter
Tn Chebyshev polynomials of the first kind
Un-1 Chebyshev polynomials of the second kind
V Vertical polarization
W Reflectarray element spacing
Wf Reflectarray element signal strip width
Wp Reflectarray element patch width
WPEC Width of the reflective load
x Cartesian coordinate
X(fM2) Frequency response at fM2 (for different azimuth angles )
y Cartesian coordinate
z Cartesian coordinate
zo Offset distance
Zg Capacitive grid impedance due to the adjacent metal patches

List of Symbols
13
Zpp Capacitive impedance due to the parallel-plate capacitor
Zs Inductive impedance
Ztot Total input impedance
α Attenuation constant between antenna feed and aperture plane
Γ(x, y) Spatial reflection coefficient
Δf Bandwidth
Modulation efficiency of the reflectarray element
θc Direction of plane wave propagation after collimation
θd Phase delay between antenna feed and aperture plane
θinitial Initial guess of the phase
θvalid Valid angular region
Wavelength
g Guided wavelength used in reflectarray element design
Azimuth angle

List of Symbols
14

15
List of Publications
This doctoral dissertation consists of a summary and of the following
publications which are referred to in the text by their Roman numerals.
I. Z. Du, D. Chicherin, and A. V. Räisänen, “Millimeter wave beam steering
with a MEMS-based high impedance surface,” in Proc. 41st European
Microwave Conference, Manchester, UK, Oct. 10-14, 2011, pp. 1043-1046.
II. Z. Du, J. Ala-Laurinaho, D. Chicherin, A. V. Räisänen, M. Sterner, and J.
Oberhammer, “Reflection phase characterization of the MEMS-based high
impedance surface,” in Proc. 42nd European Microwave Conference,
Amsterdam, The Netherlands, Oct. 29 – Nov. 1, 2012, pp. 617-620.
III. Z. Du, A. Tamminen, J. Ala-Laurinaho, J. Säily, P. Rantakari, A. Luukanen,
and A. V. Räisänen, “Design and optimization of reconfigurable reflectarray
element with MEMS phase shifter,” in Proc. 7th European Conference on
Antenna and Propagation, Gothenburg, Sweden, Apr. 8-12, 2013, pp. 2422-
2426.
IV. Z. Du, J. Moon, S. Oh, J. Koh, and T. K. Sarkar, “Generation of free space
radiation patterns from non-anechoic measurements using Chebyshev
polynomials,” IEEE Transactions on Antennas and Propagation, vol. 58, no.
8, pp. 2785-2790, Aug. 2010.
V. Z. Du, V. Viikari, J. Ala-Laurinaho, A. Tamminen, and A. V. Räisänen,
“Antenna pattern retrieval from reflection coefficient measurements with
reflective loads,” Progress in Electromagnetics Research, vol. 148, pp. 15-22,
2014.

List of Publications
16
VI. Z. Du, V. Viikari, J. Ala-Laurinaho, and A. V. Räisänen, “2D antenna
radiation pattern retrieval using reflection coefficient measurements,” in Proc.
2014 Asia-Pacific Microwave Conference (APMC2014), Sendai, Japan, Nov.
4-7, 2014, pp. 846-848.
VII. Z. Li, J. Ala-Laurinaho, Z. Du, and A. V. Räisänen, “Realization of
wideband hologram compact antenna test range by linearly adjusting the feed
location,” IEEE Transactions on Antennas and Propagation, vol. 62, no.11, pp.
5628-5633, Nov. 2014.

17
Author’s Contribution
Publication I: “Millimeter wave beam steering with a MEMS-based
high impedance surface”
The work was mainly done by the author. The author had the main
responsibility for developing the idea and was responsible for writing the
manuscript. Dr. Dmitry Chicherin participated in analysing the results,
measured the S-parameters and instructed the work.
Publication II: “Reflection phase characterization of the MEMS-
based high impedance surface”
The work was mainly done by the author. The author had the main
responsibility for developing the idea and was responsible for writing the
manuscript. Dr. Juha Ala-Laurinaho participated in analysing the results and
instructed the work.
Publication III: “Design and optimization of reconfigurable
reflectarray element with MEMS phase shifter”
The work was mainly done by the author. The author had the main
responsibility for developing the idea and was responsible for writing the
manuscript. Dr. Aleksi Tamminen measured the SU-8 photoresist
characteristics. Dr. Juha Ala-Laurinaho participated in analysing the results
and instructed the work.
Publication IV: “Generation of free space radiation patterns from
non-anechoic measurements using Chebyshev polynomials”

Author’s Contribution
18
The work was mainly done by the author. The author had the main
responsibility for developing the idea and was responsible for writing the
manuscript. The author formulated the methods in detail and carried out data
post-processing and analysis. Dr. Jung Ick Moon and Dr. Soon-soo Oh
provided the antenna measurement results. Prof. Jinhwan Koh participated in
analysing the results, instructed and supervised the work.
Publication V: “Antenna pattern retrieval from reflection
coefficient measurements with reflective loads”
The work was mainly done by the author. The author had the main
responsibility for developing the idea. The author formulated the methods in
detail, carried out simulations, measurements, data post-processing and
analysis. Prof. Ville Viikari and Dr. Juha Ala-Laurinaho participated in
analysing the results and instructed the work.
Publication VI: “2D antenna radiation pattern retrieval using
reflection coefficient measurements”
The work was mainly done by the author. The author had the main
responsibility for developing the idea and was responsible for writing the
manuscript. The author carried out simulations, data post-processing and
analysis. Prof. Ville Viikari participated in analysing the results and instructed
the work. Dr. Juha Ala-Laurinaho instructed the work.
Publication VII: “Realization of wideband hologram compact
antenna test range by linearly adjusting the feed location”
This is a result of collaborative work. Dr. Zhiping Li had the main
responsibility for developing the research idea. The author was involved in
simulations, measurements and analysis of the results. Dr. Juha Ala-
Laurinaho participated in analysing the results and instructed the work.

19
1. Introduction
1.1 Background, Motivation and Objectives
The antenna is an electrical device (usually a metallic structure) with the
function of transforming guided electromagnetic signals into electromagnetic
waves propagating in free space. Typically, the antenna can be used as either a
receiving or transmitting component. The antenna may also include additional
reflective elements or surfaces to direct the radio waves into a beam or other
desired radiation pattern [1].
Millimeter and sub-millimeter wave antennas have recently become
available even for relatively low-cost applications due to advances in
lithographic techniques. Recent development of RF MEMS
(microelectromechanical systems) has also enabled tunable and reconfigurable
mm/submm-wave antennas [2]. Use of such antennas are proposed for
various applications, e. g. automotive radar in 79 GHz band (77-81 GHz) in
European Union (EU) for the advantage of compact size, decreased weight and
small emission power needed [3], and the electrically controlled
reconfigurable reflectarray for millimeter-wave identification and radar
application [4], [5], etc. Several collaborative projects have been devoted to the
research of the aforementioned purposes also in Finland. An EU Seventh
Framework Programme (FP7) project TUMESA (MEMS tunable
metamaterials for smart wireless applications) was carried out during 2008-
2011. The main objective was to develop novel on-chip phase shifting and
beam steering devices based on MEMS tunable high-impedance surfaces (HIS)
[7], [8]. A NORDITE ICT project for automotive radar at 77 GHz in 2006-2010
focused on the utilization of RF MEMS technology for automotive radar
sensors. A project funded by Tekes focusing on silicon based millimeter wave
identification (MMID) system for imaging, sensing, and wireless
communication applications (SIMIDS) was carried out during 2010-2013
between Aalto University and VTT (Technical Research Centre of Finland).
Introduction
20
Some quasi-optical components, e.g. MEMS-based HIS structure and
reflectarray elements are crucial in these projects. Therefore, numerical and
experimental characterizations of these components are a necessary and
unavoidable step. In addition to the contribution in this dissertation [I]-[III],
some researches are reported in [4]-[12],
Traditionally the antenna is measured in far-field or near-field, or in a
compact antenna test range (CATR). In principle, any antenna could be
successfully measured using the aforementioned methods with proper
implementation. However, the options of choosing one method over the other
depend on the surrounding environment, cost of facilities, electrical
dimensions of the antenna, etc. Furthermore, each measurement technique
has certain advantages and limitations. The main research interests of this
dissertation are to solve to following issues [IV]-[VII], [13], [14]:
In the far-field technique, a reference antenna is placed in the far-field of
the antenna under test (AUT). The transmission between the AUT and the
reference antenna is then recorded at different rotations of the AUT. The
measurement is typically performed in an anechoic chamber to avoid
reflections. The purpose of employing an anechoic chamber is to eliminate
the reflected field components emanating from the measurement
enclosures so that the measured radiation pattern corresponds to the case
when similar data can be generated for the antenna in free space
conditions. Several mature signal processing methodologies have been
applied to further improve the quality of the data measured in moderately
good anechoic conditions [15]-[17]. However due to practical and monetary
constraints it is not always possible to emulate a perfect anechoic
environment. The objective is to further study the methods that may
eliminate the undesired reflections measured in non-anechoic conditions
through processing of the measured data [IV].
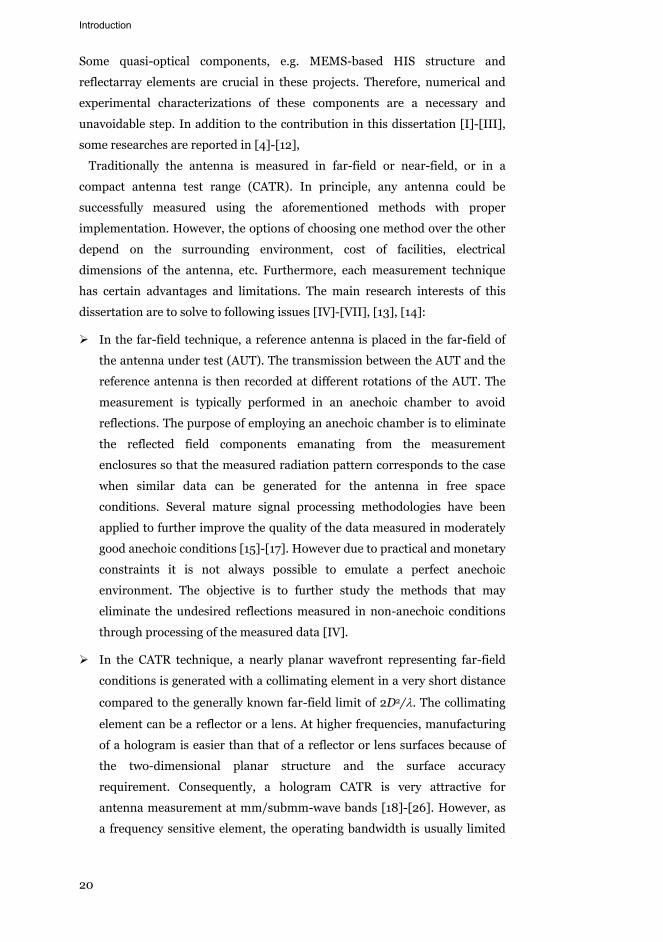
In the CATR technique, a nearly planar wavefront representing far-field
conditions is generated with a collimating element in a very short distance
compared to the generally known far-field limit of 2D2/ . The collimating
element can be a reflector or a lens. At higher frequencies, manufacturing
of a hologram is easier than that of a reflector or lens surfaces because of
the two-dimensional planar structure and the surface accuracy
requirement. Consequently, a hologram CATR is very attractive for
antenna measurement at mm/submm-wave bands [18]-[26]. However, as
a frequency sensitive element, the operating bandwidth is usually limited
Introduction
21
to 5%-10% [26]. One objective of the dissertation is to develop a
technique to realize a wide band hologram-based CATR [VII].
In any of the aforementioned methods, antennas are connected to the
measurement equipment with cables that, when moved or rotated, easily
change their properties, such as the electrical length. At high frequencies,
even a small relative change in the geometry or dimensions of the cable
may cause a huge phase change to the transmitted signal, as the cable can
be electrically very long. The objective is then to develop a method for
antenna measurement avoiding flexing cables and antenna movements [V],
[VI].
1.2 Contents of the Dissertation
A transmitting or receiving radio system includes always an antenna, but this
antenna may be either a clearly separate, independent device or an integrated
item with other radio electronics, or something between. Furthermore, an
antenna may be an element antenna, an array of element antennas, or in case
of reflector and lens antennas, a combination of an illuminating antenna and
the main focusing element.
In order to provide a desired illumination of the main focusing element, a
quasi-optical system is needed. The versatility of the antenna concept as
described above means that in order to be able to understand and design
various antenna systems, a very versatile set of different characterization
methods is needed. This dissertation discusses several of these methods,
ranging from characterization of an element antenna and quasi-optical
component to the measurement methods of large antenna systems.
The contents of this dissertation are organized as follows: Chapter 2 and
Chapter 3 are devoted to numerical investigation of MEMS-based HIS and
reflectarray elements. Particularly, Chapter 2 is focused on the feasibility study
of the beam steering and reflection phase properties of the MEMS-based
tunable HIS. The stability of the optimized structure for the desired frequency
is examined. Numerical and experimental analyses of the large impedance
surface for different angle of incidence are presented. Chapter 3 is focused on
the design and optimization of reflectarray elements using SU-8 as its
dielectric substrate material.
Chapter 4 is devoted to deal with certain limitations occurred during
different antenna measurement processes (as mentioned in Section 1.1).
Several new methods have been presented and discussed.

Introduction
22
The summary of the publications describing the contributions of this
dissertation is presented in Chapter 5. Chapter 6 presents conclusions and
future work.
1.3 Scientific Contributions
The scientific merits of this dissertation are:
1. The beam steering capacity of a large MEMS-based HIS has been
numerically demonstrated with a simplified model at W band. The
reflection properties of the MEMS-based HIS have been characterized
numerically and a quasi-optical measurement setup has been built for
the experimental characterization [I], [II].
2. The design and optimization process of the reconfigurable reflectarray
element with MEMS-based phase shifter at 120 GHz is studied [III].
3. A new technique using the Chebyshev polynomials has been proposed to
process the antenna measurements obtained in non-anechoic sites to
obtain equivalent free space radiation patterns [IV].
4. A new antenna pattern retrieval method from reflection coefficient
measurements with reflective loads has been proposed [V], [VI].
5. A new technique has been presented to realize the wideband hologram
compact antenna test range by linearly adjusting the feed location [VII].
23
2. Characterization of MEMS-Based High-Impedance Surface
The mushroom-type HIS was first introduced by Sievenpiper in 1999 [27]. It is
a type of metallic electromagnetic structure with high effective surface
impedance. Such surface is capable to suppress the propagating surface waves
within a particular frequency range and reflect the incident plane waves with
no phase reversal. Conventionally, it is formed by a sheet of electrically small
metal patches with or without vertical conducting vias connecting to metal
ground plane and the size of each patch is much smaller than the wavelength
of interest.
The HIS structure and its variations have attracted a lot of interest since it
was proposed, and they have been used in many applications. As an example,
the HIS was used to serve as the finite ground plane instead of a traditional
metal sheet to improve the antenna radiation pattern [28]. Another example is
in portable handset communications where it serves as a shield between the
antenna and the user to improve the antenna radiation efficiency and extend
the battery life [29].
This section is organized as follows. Section 2.1 introduces the beam steering
applications of HIS and Section 2.2 presents the MEMS-based HIS for
mm/submm-wave frequencies. The beam steering is demonstrated by
simulation in Section 2.3. Section 2.4 presents the numerical and experimental
studies of the reflection phase of the MEMS-based HIS.
2.1 Beam Steering using High-Impedance Surface
The mechanical beam steering application of HIS was introduced in [30], in
which the reflected plane wave on the HIS was steered by adding a layer of
adjustable plates overlapping the stationary ones and mechanically moving or
tuning the layer position with respect to the surface to generate the needed
reflection phase gradient. The electronic beam steering of HIS was elaborated
in [31] and experimentally verified in [32] and then extended for two-

Characterization of MEMS-Based High-Impedance Surface
24
dimensional (2D) beam steering for both polarizations [33] by introducing the
reverse-biased varactor diodes connected between each adjacent pairs of the
array on the surface. The effective capacitance between two neighbouring cells,
and consequently the effective input impedance and resonance frequency
could be changed by applying the bias voltage to the varactor diodes. Therefore,
a gradient of the reflection phase was created by adjusting the bias voltage
through the whole surface and the reflected beam was electronically steered
with different combination of the bias voltages. The steered angular range at
4.5 GHz from -40° to +40° at both polarizations was achieved with an average
gain of 14 dBi and an average beamwidth of 15°.
2.2 MEMS-based High-Impedance Surface
As mentioned in Section 1.1, an EU FP7 project TUMESA was devoted to
develop novel on-chip phase shifting and beam steering devices based on
MEMS tunable HIS for automotive radar application in 79 GHz band. This
section presents the relevant findings of the project.
MEMS fabrication techniques have been developed since the 1970s for
pressure and temperature sensors, etc. [2]. At millimeter and sub-millimeter
wave frequencies, the MEMS elements have been demonstrated as a relatively
mature technique due to its relatively small feature size and low losses
compared to other conventional solutions. Artificial electromagnetic materials
normally consist of a set of structural elements in an orderly arrangement [34],
i.e. arrays, and they usually exhibit advantageous electromagnetic properties.
From this point of view, a lattice of HIS is a particular case of artificial
electromagnetic materials.
Combining these features provided by the MEMS and the concept of artificial
HIS structures, a novel MEMS-based tunable HIS was proposed in 2006 [35].
It was applied to a phase shifter at millimeter and sub-millimeter wavelengths,
in which the proposed HIS was placed along the narrow walls of a rectangular
metal waveguide to affect the propagation constant, and then consequently
changed the phase of the propagating wave. Later the MEMS-based HIS was
introduced in a rectangular metal waveguide to create a reflection type phase
shifter [36], [37] and in a dielectric rod waveguide [38]. Figure 2.1 shows a
schematic layout of a unit cell of the MEMS-based HIS for beam steering
application [I]. The nominal design parameters are listed in Table 2. 1.

Characterization of MEMS-Based High-Impedance Surface
25
Figure 2.1 Top and side view of unit cell of the MEMS-based HIS [I].
Table 2. 1 Nominal design parameters shown in Figure 2.1 for beam steering applications.
Parameters b g h W
Value 350 μm 1.8 μm 110 μm 130 μm
2.3 Beam Steering with MEMS-Based High-Impedance Surface
The MEMS-based HIS is a multi-layer structure. It consists of an array of
electrically small MEMS parallel-plate capacitors, in which the top plate is
suspended by springs. The basic idea of the proposed variable capacitor is that
application of a bias voltage between the membrane and the bottom plate of
the MEMS varactor changes the distance between them, which in turn changes
the effective capacitance of the whole structure affecting the resonance
frequency of the HIS. It is also possible to introduce an actuation electrode
whose thickness is smaller than that of the bottom plate (see Figure 2.2(a)).
MEMS-based tunable HIS is a periodic array of unit cells with at least 5 x 5
cells (see Figure 2.2(b) for 3x3 array).
2.3.1 Equivalent Circuit and Surface Tunability
The effective input impedance of the MEMS-based HIS can be interpreted as
the parallel connection of the following three impedances [39]:
The capacitive grid impedance Zg due to the adjacent metal patches,

Characterization of MEMS-Based High-Impedance Surface
26
The capacitive impedance Zpp due to the parallel-plate capacitor between
the upper membrane and the lower patches,
The inductive impedance Zs due to the thin grounded dielectric layer.
(a)
(b)
Figure 2.2 MEMS-based HIS: (a) unit cell (with actuation electrode); (b) example of a 3x3
array (not to scale) [II].
For detailed interpretation of each impedance, see [I], [II]. Figure 2.3 shows
the equivalent transmission line model which indicates that the total input
impedance Ztot equals to
Ztot = (Zs-1 + Zpp-1 + Zg-1)-1. (2.1)
This equivalent circuit can be used to calculate the reflection coefficient R of
the incident electric field at the reflecting surface in terms of Ztot and Z0.
R = (Ztot – Z0) / (Ztot + Z0). (2.2)
Figure 2.3 Equivalent circuit model of the single unit cell structure [I], [II].

Characterization of MEMS-Based High-Impedance Surface
27
The beam steering can be achieved by programming the gradient of the
reflection phase as a function of the gap between the membrane and the lower
patches, which influences the effective surface input impedance.
HIS array is a periodic structure and its electromagnetic performance can be
simulated with simplified single unit cell with appropriate boundary
conditions. The tunability has been numerically studied with Ansoft HFSSTM
full wave 3D simulation software, in which two electric boundaries are
assigned on two opposing walls on x-y plane and two magnetic boundaries on
y-z plane [I].
Figure 2.4 shows simulation results of the reflection phase of the MEMS
tunable HIS for different values of the gap of the MEMS varactor. It indicates
that, by varying the gap to certain values, the resonant frequency is tuned
approximately from 70 GHz to 100 GHz. The maximum tuning range achieved
at 80 GHz is shown in right-hand side of Figure 2.4.
Figure 2.4 Reflection phase for single unit cell with 75 μm substrate thickness as a function of
frequency and gap (structure with electrode), simulated [I].
2.3.2 Reflective Strip Beam Steering
The MEMS tunable HIS can be used for electronic reflective beam steering by
inducing reconfigurable surface impedance through application of different
bias voltage to different rows of elements of the MEMS varactor array. Since
full-wave simulation of electrically large reflective surface with electrically
small features of MEMS varactors is computationally an extremely large
problem, a simplified model of a surface with strips formed by 40 impedance
elements of dimensions 0.35 x 0.35 mm2 is used (see Figure 2.5). Configuring
the surface so that different strips have different impedances and different

Characterization of MEMS-Based High-Impedance Surface
28
phase of the reflection coefficient, the reflected beam can be steered by
changing the gradient of the surface impedance.
Theoretically, the reflection phase of the neighbouring strips can be chosen
arbitrary taking into account 360° invariance. In the case of MEMS tunable
HIS, the tuning range of the MEMS tunable HIS is restricted by the limited
surface tunability which in turn limits the beam steering capability of the
whole HIS array. Figure 2.6 shows an example of the required reflection phase
impedances with incident angle from 45° and reflective beam to be steered to
0°. In order to model a planar array condition, 20 similar linear arrays with 0°
phase shift are added in the z-direction. When a wave impinges to a flat
surface obliquely, it will generate backward and forward reflected wave (see
Figure 2.5) and these waves contribute to the side lobe level at particular
angles.
Figure 2.5 40 impedance elements in the open boundary conditions, normal and 45° off
broadside incidence are excited to the surface [I].
Figure 2.6 The required reflection phase impedances with incident angle from 45° and
reflective beam to be steered to 0° [I].

Characterization of MEMS-Based High-Impedance Surface
29
Figure 2.7 shows a normalized radiation pattern of the steered beam desired
for -30°. The steered angle of the main lobe agrees well with the programmed
value, meanwhile, the side lobes still need to be optimized, i.e. the forward and
backward reflections. The results for other incidence and steering angles are
obtained in [I].
Figure 2.7 The normalized radiation pattern at 80 GHz with incident angle of 45° for the
surface which is programmed for -30° [I].
2.4 Reflection Phase Characterization of MEMS-Based HIS
The reflection phase feature attracts the most interest of the special properties
of the multilayer HIS structure. The reflection phase is defined as the phase of
the reflected electric field monitored at the surface. In this section, we present
the numerical analysis of the reflection properties of a MEMS-based HIS array
(with actuation electrode and a frozen membrane) when changing the angle of
incidence of the beam, and examine the stability of the optimized structure for
the desired operational frequency band. In addition, a quasi-optical
measurement setup is presented for measuring the reflection coefficient from
different oblique angles of incidence with a network vector analyser.
In order to characterize the reflection coefficient of the HIS illuminated by
an obliquely incident plane wave, the full wave simulator (Ansoft HFSSTM) is
used to construct the geometry of the unit cell and collect the reflection data.
Periodic boundary conditions are applied to the unit cell structure in x- and y-
directions to mimic an infinite array situation (see Figure 2.2(a)), and
observation plane is positioned at 0.55λ80GHz above the ground. The periodic
structure studied in this section is realized with silicon substrate with loss
tangent of 0.015. The unit cell of the multi-layer HIS consists of two lower
metal patches separated in E-field direction and of a metal upper membrane
suspended by 2 μm above the patches with a spring structure. The width of the
membrane along the E direction is 225 μm, the half-length of the lower patch

Characterization of MEMS-Based High-Impedance Surface
30
is 78 μm, and the height of the silicon substrate is 110 μm; the parameters are
optimized for operation at 84 GHz.
The simulated reflection properties of the unit cell of the MEMS-based HIS
for different angles of incidence are shown in Figure 2.8. The reflection phase
of the unit cell surface varies continuously from about 140° to -150° versus
frequency. Figure 2.9 shows the resonance frequency and the relative
bandwidth versus the angle of incidence of the unit cell. Both are slightly
increasing with the increase of θ, and most of the resonance frequencies lie
within the desired 84 GHz band. This means that the angle of incidence has
weak effects to the resonance frequency of the surface impedance. The
bandwidth of the resonance is defined as the range where the reflection phase
falls between 90° and -90°, meanwhile the relative bandwidth is the ratio
between the bandwidth and the resonance frequency .
Figure 2.8 Simulated reflection properties of the unit cell of MEMS-based HIS for different
angles of incidence: (a) phase; (b) amplitude [II].
Figure 2.9 Resonance frequency and the relative bandwidth versus angle of incidence [II].

Characterization of MEMS-Based High-Impedance Surface
31
2.4.1 Quasi-Optical Measurement Setup
The manufactured HIS prototype is an array of 200 x 52 unit cells with a
periodic length of 350 μm as shown in Figure 2.10. The HIS prototype has
been manufactured by Royal Institute of Technology (KTH) Sweden. The extra
electrode is introduced underneath the top membrane (see Figure 2.2 and
Figure 2.10) and the resonance frequency is estimated to be at 84 GHz [7]. The
structure is frozen, i.e. the MEMS membranes are not actuated during the
measurements.
Figure 2.10 Manufactured MEMS-based HIS: (a) optical image; (b) scanning electron
microscopy (SEM) image [II].
A quasi-optical measurement setup has been built for measuring the
reflection phase of the MEMS-based HIS array with three different angles of
incidence. Figure 2.11 shows the schematic design of the setup and Figure 2.12
shows the photograph of the measurement setup. Two standard horn antennas
with a very narrow beam are mounted at test ports 1 and 2 and thus acting as
the transmitting and receiving antennas. In addition, two parabolic reflectors
are used to collimate and focus the transmitted waves. The HIS acts as a
reflector and it is fixed on the rotator. The angle of incidence is defined by
tuning the rotator. Meanwhile, a flat mirror is mounted on a carrier rail in
order to position it properly with respect to the corresponding angle of
incidence. With the proposed setup, for a chosen angle of incidence and a fixed
polarization, the transmission coefficient of the HIS under test and the
reference aluminium plate is recorded through two test ports by the HP8510
(a)
(b)
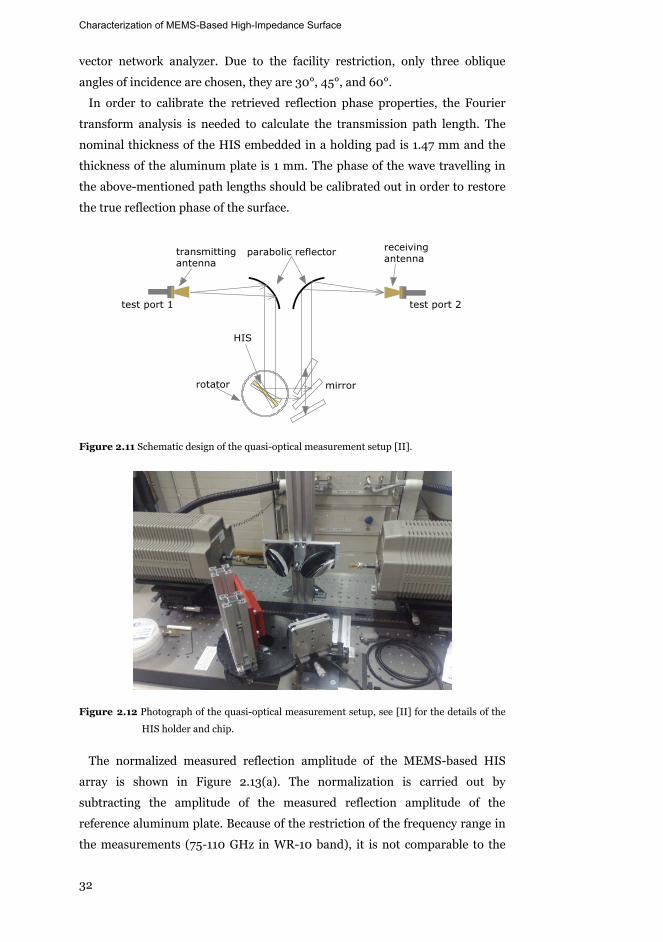
Characterization of MEMS-Based High-Impedance Surface
32
vector network analyzer. Due to the facility restriction, only three oblique
angles of incidence are chosen, they are 30°, 45°, and 60°.
In order to calibrate the retrieved reflection phase properties, the Fourier
transform analysis is needed to calculate the transmission path length. The
nominal thickness of the HIS embedded in a holding pad is 1.47 mm and the
thickness of the aluminum plate is 1 mm. The phase of the wave travelling in
the above-mentioned path lengths should be calibrated out in order to restore
the true reflection phase of the surface.
Figure 2.11 Schematic design of the quasi-optical measurement setup [II].
Figure 2.12 Photograph of the quasi-optical measurement setup, see [II] for the details of the
HIS holder and chip.
The normalized measured reflection amplitude of the MEMS-based HIS
array is shown in Figure 2.13(a). The normalization is carried out by
subtracting the amplitude of the measured reflection amplitude of the
reference aluminum plate. Because of the restriction of the frequency range in
the measurements (75-110 GHz in WR-10 band), it is not comparable to the

Characterization of MEMS-Based High-Impedance Surface
33
whole frequency band of the simulation result. The 9th degree polynomial
fitting is used to smooth the rapid variation of the amplitude response that is
caused by multipath components. Figure 2.13 shows the comparison of the
simulated and measured reflection coefficient of the MEMS-based HIS. The
reflection amplitude shows a good agreement between measured and
simulated results which indicate that the resonance frequency shifts with the
angle of incidence. The difference of the range of the reflection phase is caused
most probably by two reasons: the inaccuracy of the needed calibration length
that is used to retrieve true phase response and the non-ideality (non-planarity
of the surface due to the mechanical processing) of the aluminum plate that is
used to calibrate out the phase response of the HIS.
Figure 2.13 Measured reflection coefficient of the MEMS-based HIS: (a) amplitude; (b) phase
[II].

Characterization of MEMS-Based High-Impedance Surface
34

35
3. Design and Optimization of Reconfigurable Reflectarray Element
3.1 Reconfigurable Reflectarray
The concept of a reflectarray was first described and experimentally verified in
1963 using square waveguide [40]. The reflectarray combines certain features
and performance of the reflector and array antennas. In [40], the phase
variation was achieved by introducing short-circuited termination into
different depths of the waveguide sections to collimate waves from the feed
antenna. The reflectarray has attracted more interest since the development of
microstrip patch antennas in 1990’s [41], [42] due to its light weight, flatness
and conformity. When the elements of reflectarray are dynamically controlled
(herein refer to the phase shift), the radiation characteristics could be
manipulated accordingly. There are many techniques enabling active
reconfiguration of the phase shift of the reflectarrays, which depends on the
maturity, performance, and desired frequency range. For the phase tuning,
various elements were used, e.g. varactor diodes at 5.8 GHz [43] and in C-
band [44], MEMS switches at 12 GHz [45], p-i-n diodes at 60 GHz [46] and
liquid crystal at 77 GHz [47].
A project focusing on silicon based MMID system for imaging, sensing and
wireless communication applications was carried out between the Aalto
University and VTT during 2010-2013 [4]-[6]. In this project, a system for
MMID application was studied and especially 120 GHz reflectarrays and
related methods for design, simulation, and measurement were studied. The
research in this section provides an alternative solution to the design of
reflectarray elements in which SU-8 is used as the dielectric substrate material.

Design and Optimization of Reconfigurable Reflectarray Element
36
3.2 Reflectarray Geometry Design
3.2.1 Element Design
The antenna element design of the reflectarray employs the principle of
coplanar patch antenna (CPA) together with the conductor-backed coplanar
waveguide (CB-CPW) technology [48], [49].
The proposed element has a 50 μm-thick layer of SU-8 photoresist as a
substrate and two metallic layers on the opposite sides of the substrate. It is
realized for a 2x2 mm2 sized cell and targeting the 120 GHz frequency. The
element spacing is 0.8λ at 120 GHz, and the first grating lobe appears when
the theoretical steered angle is 14.5°. However, the element spacing is seen
adequate for the anticipated application [6]. A patch antenna is etched on the
upper ground layer and a 50-Ω coplanar waveguide (CPW) feed line having a
signal strip of width Wf and a gap of width Gf. The resonant frequency of the
CB-CPA element is preliminarily determined by the length of the patch
being the half the guided wavelength λg (see Figure 3.1). When the center
frequency is determined, the impedance matching can be realized by adjusting
the width of the patch Wp. Figure 3.1 shows the proposed geometry of the
conductor-backed coplanar patch antenna (CB-CPA) element without the
phase shifter.
Figure 3.1 The geometry of the CB-CPA element (not to scale, the salmon pink color and gray
color represent the metal portion, and the yellow color presents the etched slots):
(a) 3D view; (b) front view [III].
3.2.2 SU-8 Photoresist Measurement
The dielectric properties of SU-8 at millimeter wavelengths are studied in few
references, e.g., in [50]-[52]. There, the dielectric permittivity of SU-8 is
reported to be 3.10-3.25 and its loss tangent 0.027-0.05. The substrate
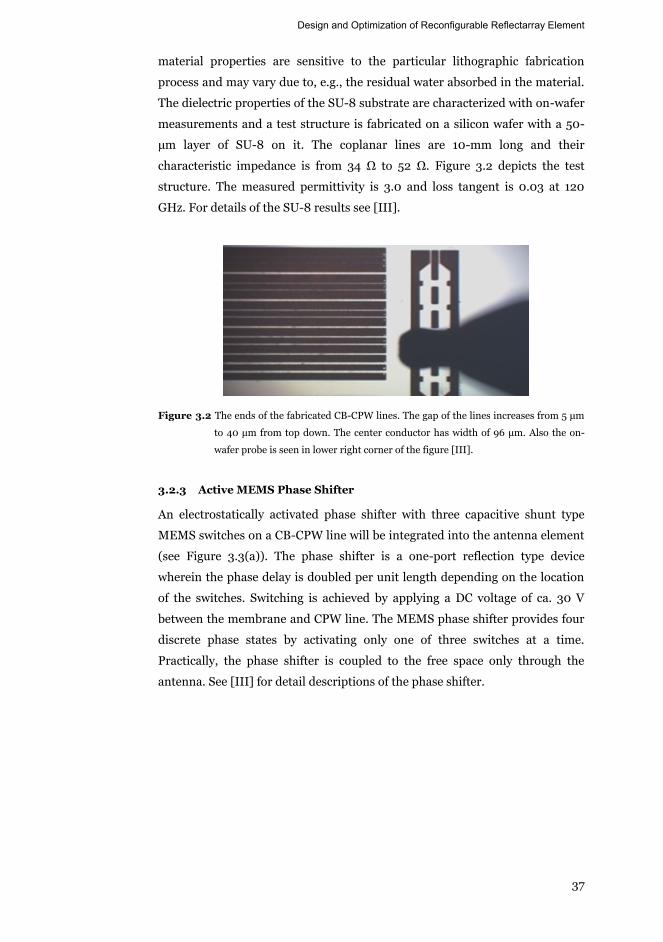
Design and Optimization of Reconfigurable Reflectarray Element
37
material properties are sensitive to the particular lithographic fabrication
process and may vary due to, e.g., the residual water absorbed in the material.
The dielectric properties of the SU-8 substrate are characterized with on-wafer
measurements and a test structure is fabricated on a silicon wafer with a 50-
μm layer of SU-8 on it. The coplanar lines are 10-mm long and their
characteristic impedance is from 34 Ω to 52 Ω. Figure 3.2 depicts the test
structure. The measured permittivity is 3.0 and loss tangent is 0.03 at 120
GHz. For details of the SU-8 results see [III].
Figure 3.2 The ends of the fabricated CB-CPW lines. The gap of the lines increases from 5 μm
to 40 μm from top down. The center conductor has width of 96 μm. Also the on-
wafer probe is seen in lower right corner of the figure [III].
3.2.3 Active MEMS Phase Shifter
An electrostatically activated phase shifter with three capacitive shunt type
MEMS switches on a CB-CPW line will be integrated into the antenna element
(see Figure 3.3(a)). The phase shifter is a one-port reflection type device
wherein the phase delay is doubled per unit length depending on the location
of the switches. Switching is achieved by applying a DC voltage of ca. 30 V
between the membrane and CPW line. The MEMS phase shifter provides four
discrete phase states by activating only one of three switches at a time.
Practically, the phase shifter is coupled to the free space only through the
antenna. See [III] for detail descriptions of the phase shifter.

Design and Optimization of Reconfigurable Reflectarray Element
38
Figure 3.3 The HFSS model for a reflectarray element: (a) MEMS-based phase shifter; (b) The
geometry and Floquet-port excitation, E-direction is along y-axis [III].
3.3 Reflectarray Performance Evaluation
The performance of the element is numerically analyzed in an array
environment at the frequency of interest. In the simulation environment, the
unit cell structure integrated with MEMS-based phase shifter is placed into the
computational domain and periodic boundary conditions are used to simulate
the infinite array of similar elements in two directions (x- and y-directions). A
Floquet port is excited at 1.25 mm above the antenna element and de-
embedded on the element surface (see Figure 3.3(b)). A parametric function
consisting four discrete states is added to the simulation. Only one polarization
is considered and E-direction is along y-axis.
The modulation efficiency of the reflectarray element is defined as:
(3.1)
where is the power density of the field reflected from the phase shifter
and is the total reflected power density [4]. The modulation
efficiency is calculated from the full-wave simulation result of reflectarray
element and this could be affected by several design parameters, i.e.:
A. Effect of the patch width Wp (impedance matching),
B. Effect of the length of CPW feed line Lf between antenna patch and MEMS
phase shifter,

Design and Optimization of Reconfigurable Reflectarray Element
39
C. Effect of the element spacing W.
The efficiency studies are carried out using the three above-mentioned
design parameters shown in Table 3.1. When one design parameter is studied,
other parameters are kept unchanged as nominal, unless mentioned otherwise.
Table 3.1 Nominal design parameters and geometric dimensions of the array element [III].
W L f W p L p
2000 μm 500 μm 1150 μm 630 μm
W f G G f
70 μm 70 μm 15 μm
Figure 3.4 illustrates the constellation diagram produced by the antenna
element in the bore-sight direction with four different Wp lengths for four
discrete phase shifts. The markers which evenly distribute on the fitted circle
represent four discrete phase states. The origin of the fitted circle represents
the specular reflection of the electric field E0 and the radius of the fitted circle
represents the absolute value of the modulated field Em. The array modulation
efficiency is also presented in Figure 3.4 according to the calculation using Eq.
(3.1). More results and discussion regarding the performance affected by other
parameters can be seen in [III].
Figure 3.4 Simulated S11-parameter with four discrete switching states with four different
patch widths Wp at 120 GHz [III].

Design and Optimization of Reconfigurable Reflectarray Element
40
41
4. Development of Methods for Antenna Measurement
Antenna measurement refers to the experimental verification of the AUT
specifications and parameters. Typical parameters of antennas include
radiation pattern, directivity, polarization, gain, phase, etc. Research in
antenna measurement field include a wide range topics which comprises of
antenna measurement in non-anechoic environments, frequency versus time-
domain analysis, near-field to far-field transformation, compact antenna test
range, etc.
The most common and conventional method is the far-field antenna
measurement where the AUT is placed in the far-field range of the reference
antenna. The transmission between the AUT and the reference antenna is then
recorded at different rotations of the AUT. Due to the requirement for testing a
large antenna in a relatively small space, the near-field method was developed.
In the near-field measurement technique, the near-field of the AUT is sampled
spatially with a suitable probe antenna moving over the measurement surface.
The measured near-field distribution is then used to calculate the antenna far-
field radiation properties [53]. Another common method is the compact
antenna test range (CATR) for accurate measurements of electrically large
antennas at millimeter and submillimeter wavelengths. The CATR uses a
collimating element to transform a spherical wavefront into a plane wave. In
principle, any antenna could be successfully measured by the aforementioned
method with proper implementation. However, the options of choosing one
method over the other depend on the surrounding environment, facility cost,
and the electrical dimensions of the AUT, etc. Furthermore, each
measurement technique has certain advantages and limitations.
The research described in this section deals with certain limitations occurred
during the antenna measurement processes (see Section 1.1). In Section 4.1, a
new technique is proposed to process the antenna far-field measurements
obtained in non-anechoic sites to obtain equivalent free space radiation

Development of Methods for Antenna Measurement
42
patterns. In Section 4.2, a new method is proposed to retrieve the antenna
radiation pattern from reflection coefficient measurements avoiding AUT
movement and connecting cables. In Section 4.3, a new technique is presented
to realize a wideband hologram CATR.
4.1 Generation of Radiation Pattern from Non-Anechoic Measurements
Conventional antenna measurements are carried out in anechoic chambers.
The purpose of employing an anechoic chamber is to eliminate the reflected
field components emanating from the measurement enclosures so that the
measured radiation pattern corresponds to that in free space conditions.
Recently, signal-processing methods have been employed to further improve
the quality of the data measured in moderately good anechoic conditions [15]-
[17]. However due to practical and monetary constraints it is not always
possible to emulate a perfect anechoic environment. The failure of the
chamber to provide a purely free space environment affects the measurement
accuracy. The objective then is to study methods that may eliminate the
undesired reflections measured in non-anechoic conditions through further
processing of the measured data. This is generally completed by time gating
method, which transforms the frequency domain response into time domain
data and filter out the delayed time pulses which are caused by multi-path
interferences [54], [55]. A traditional FFT (Fast Fourier Transform)-based
method has been investigated to be very efficient for removing undesired
signals [56]. Some other techniques may also be applied [57]-[61], e.g. instead
of the Fourier transform, matrix-pencil method is utilized for obtaining the
time response of the measured frequency domain data [57], [58] and for
radiation pattern error corrections [59]. An oversampled Gabor transform is
utilized to identify and remove the reflected signals on the ground from the
measured frequency response [17]. Such aforementioned procedures would
make antenna measurements much easier and more cost-effective.
This section is organized as follows. The measurement scheme and
procedure are presented in Section 4.1.1. In Section 4.1.2 the traditional FFT-
based method to eliminate the unwanted reflection is introduced. Section 4.1.3
presents the proposed method using Chebyshev polynomial.

Development of Methods for Antenna Measurement
43
4.1.1 Description of the Measurement Scheme
All the measurements presented in this research have been obtained using a
far-field measurement system housed in an anechoic chamber of dimensions
10×7.5×8.5 m3. A simplified scheme of the whole measurement system is
shown in Figure 4.1. The probe and the AUT are separated by a distance dp,
and a metal plate is placed in a parallel separation dm from the AUT/probe to
model a non-anechoic reverberant chamber. Here, we use a single antenna for
both transmitter and receiver but instead of carrying out measurements at a
single frequency, we use a band of frequencies to carry out the measurements.
This band of frequencies at which the characteristics are to be measured,
should be quite narrow and one should ensure that the antenna characteristics
do not change over this band. The objective for performing measurements in a
finite frequency band is to transform this finite bandwidth frequency domain
data to the time domain where the various undesired reflections can be
eliminated through time gating.
The measurement campaign was carried out in the frequency domain,
measuring the S21(f) H-plane parameter of the two horn transmit-receive
system in the band of interest for each azimuth angle from −90° to 90° at
step of 1°. The FFT-based method relates the time domain and frequency
domain. The time delay (TD) is defined as the time between the arrivals of the
direct and reflected signals. Therefore, to better distinguish the main
contribution from the AUT and the diffraction from the reflector, the
minimum bandwidth (BW) should be determined as BW=1/TD. In this
research, the bandwidth of 0.6 GHz, ranging from 3.05 GHz to 3.65 GHz was
used in the measurement. The center frequency is 3.35 GHz.
Figure 4.1 A top view of the antenna measurement system.

Development of Methods for Antenna Measurement
44
4.1.2 FFT-Based Method
The traditional methods achieve the reduction of the reflected and diffracted
fields using the FFT-based method, which describes the impulse response of
the reverberant chamber from its frequency response by using the inverse
Fourier transform [56]. In the time domain, the direct contribution from the
transmitter to the receiver is detected and gated, eliminating the undesired
echoes through the use of low-pass filters. Applying the Fourier transform to
this new gated time domain response provides only the direct contribution and
thus the radiation pattern can be retrieved at the frequency of interest. Here,
the various steps of the FFT-based method are summarized as follows and the
result reconstruction is shown in Figure 4.2 (detailed procedure and results
can be seen in [IV]):
1) Measure the coherent (amplitude/phase) frequency response covering the
bandwidth from 3.05 GHz to 3.65 GHz.
2) Apply the inverse FFT to S21(f, ) to obtain the temporal response S21(t, ).
3) Once in the time domain, the direct contribution between the transmitting
and the receiving antenna is approximately retained and the unwanted
signals can be gated by truncating the waveform beyond a time based on
the shortest path from the AUT to the probe in the presence of the
reflector:
2
22 2t d d cp m (4.1)
for the current measurement setup, the parameters are dp = 7.7 m, dm = 2
m, and c is the velocity of light (3 108). Therefore, t = 28.92 ns.
4) Transforming the truncated data to the frequency domain by applying the
FFT one obtains the processed frequency domain S21’(f, ) response.
One can observe that most of the reflection and diffracted fields in the
azimuth angle range of −20°…−60° are reduced. However, one of the
problems is that the quality of the results depends on the available bandwidth
of the measurement. For this reason, we introduce a new method in the next
section.

Development of Methods for Antenna Measurement
45
Figure 4.2 Result of the reconstruction using the FFT-based method: (a) pattern; (b) phase
[IV].
4.1.3 Chebyshev Polynomial Method
It has been observed in earlier studies [62]-[64] that when scaled versions of
the Bessel functions are used to approximate any causal time domain data, the
frequency domain response can be fitted by the analytical transforms of the
scaled Bessel functions (Chebyshev polynomials of the first and second kinds
[65], [66]). The numerical value of the coefficients obtained by fitting the
frequency domain data by the various orders of Chebyshev polynomials of the
first and second kinds follow the trend of the time domain waveforms, even
though the time domain waveforms are being approximated by scaled Bessel
functions [62]-[64]. Therefore, the plot of the coefficients multiplying the
scaled Bessel functions of the first kind will be able to distinguish between the
various reflections and will help one to accomplish the separation between the
direct wave and the various reflections present in a non-anechoic
measurement.
In this new procedure, one starts with the measured data S21(f, ) as
described in Section 4.1.1. The measurements are performed for different
azimuth angles . For each azimuth angle, a set of data for different
frequencies from f1 to fM2 are measured simultaneously (marked as
X(f1)…X(fM2)). Correspondingly, a set of different coefficients for different
angles can be obtained by solving the matrix of Eq. (4.2) through the
application of the conjugate gradient method (CGM) [67], where the
number of frequency domain data, N-1 is is the number of the maximum
degree in the polynomials. in Eq. (4.2) is represented in Eq. (4.3), l2 is
the frequency scaling factor and is chosen to be slightly larger than the
maximum bandwidth of the available measurement data. Tn and Un-1 are

Development of Methods for Antenna Measurement
46
Chebyshev polynomials of the first and second kind. See [IV], [66] for detailed
interpretation of Eqs. (4.2) and (4.3).
2 2 2
2 2
0 1 2 1 1 2 1 1 2
0 2 2 1 2 2 1 2 2
0 2 1 2 1 2
0 1 2 1 1 2 1 1 2
0 2 2 1 2 2 1 2 2
0 2 1 2
( , ) ( , ) ( , )( , ) ( , ) ( , )
Re
( , ) ( , ) ( , )
( , ) ( , ) ( , )( , ) ( , ) ( , )
Im
( , ) ( , )
N
N
M M N M
N
N
M M
f l f l f lf l f l f l
f l f l f l
f l f l f lf l f l f l
f l f l
2
2 22 2
1
2
0
1
1
1 21
1 2 2 2 1
( )( )
Re
( )
( )( )
Im
( , ) ( )
M
N N
N M MM N M
X fX f
aX fa
X fa X f
f l X f
(4.2)
2
2 12 2 2
2
2 ( ) 2 2 2( , ) 1
for 2
n
n n ni i f f ff l i U Tn l l l
f l
. (4.3)
For the FFT-based method, truncation is made in the time domain to
eliminate the reflection and diffraction of the fields to be measured. In this
new approach, the truncation is made to the Chebyshev series. We truncate the
series when the scaled Bessel function of a certain order peaks at the time at
which we would like to truncate the temporal function to prevent reflections or
other secondary fields creeping in. For the detailed procedure, see [IV]. The
result of the reconstruction is shown in Figure 4.3. When using the Chebyshev
polynomial to fit the measured data and then truncating the series, the
corresponding mean squared error between the reference antenna pattern and
the reconstructed one is approximately 0.066 when the observation angle is
limited from −90° to 0° and is 0.057 when the complete set of azimuth angle is
considered from −90° to 90°. The mean squared error between the reference
and the reconstructed results using different methods are summarized in
Table 4.1. Hence, it appears that at least for this data set, the present method is
more robust. By comparing Figure 4.2(b) to Figure 4.3(b), it is seen that the
proposed method provides a more realistic phase response for the AUT.

Development of Methods for Antenna Measurement
47
Figure 4.3 Result of the reconstruction using Chebyshev Polynomials: (a) pattern; (b) phase
[IV].
Table 4.1 The norm of the mean squared error between the free space results and the data
processed using different methods [IV].
Azimuthal Bandwidth: 0.6 GHz
Angular Range FFT Chebyshev
−90°… 0° 0.186 0.066
−90°… 90° 0.148 0.057

Development of Methods for Antenna Measurement
48
4.2 Antenna Pattern Retrieval from Reflection Coefficients
The antenna pattern is measured in the far-field or near-field, or in a compact
antenna test range (as described in the background of Section 1.1). There are
certain limitations to the aforementioned methods. In any method, the
antennas are connected to the measurement equipment with cables that, when
moved or rotated, easily change their properties. Several techniques for
measuring the phase errors caused by flexing cables are discussed in [68]. At
high frequencies, even a small relative change in the geometry of dimensions
of the cable may cause a huge phase change to the transmitted signal, because
the cable can be electrically very long. Although the error compensation
techniques have been introduced [69], the measurement errors due to bending
cables may be significant especially in the planar near-field scanning at high
frequencies.
Some antennas, such as RFID (radio-frequency identification) antennas, are
typically attached directly to an RFID chip and there is no possibility for a
cable connection. Then, the antenna radar cross section (RCS) measurement
technique can be used to characterize the antenna [70]-[73]. This method
avoids the problems related to flexing cables, but it requires a potentially large
far-field antenna range. Small millimeter wave antennas are often integrated
on chip and traditional antenna measurement techniques have limitations in
measurements on a probe station. The conventional methods are based on
spherical measurement requiring complex mechanical arms for the probe
antenna movements around the AUT [74]-[82]. The near-field wire-scattering
method presented in [83] may not need the rotating cables but is capable to
solve only one pattern cut.
In this section, a new antenna radiation pattern retrieval method using
reflection coefficients results is proposed. It avoids flexing cables and AUT
movements during the measurement procedure. Section 4.2.1 presents the
equations relating the properties of the reflective load to the measured
reflection coefficient. Section 4.2.2 presents the simulation and experimental
setup for the verification. The 1D and 2D antenna patterns solved from
reflection coefficients are presented in Section 4.2.3.
4.2.1 Reflection Coefficients and Antenna Aperture Field
In this method, the reflection coefficient of an antenna is measured when the
antenna is placed close to a reflecting surface, whose reflection properties vary
spatially in a known way. The measurement is repeated with different
reflective surfaces, for example moving the reflective surface over the antenna

Development of Methods for Antenna Measurement
49
between each measurement. After an adequate amount of information is
gathered, the near-field distribution of the antenna is solved from the
measured reflection coefficients and the known reflector properties. Figure 4.4
shows the schematic layout of the pattern retrieval process.
The reflection coefficient is related to the properties of the reflective load by
using the plane wave spectrum method and can be calculated as
AUT
11,aperture *AUT AUT
, , 0 , , 0
, , 0 , , 0S
S
E x y z E x y z dxdyS
E x y z E x y z dxdy (4.4)
2 11 11,static 11,aperture
djS S e S (4.5)
where * denotes the complex conjugate. For convenience, the symbols used in
the equations and figures are summarized with their descriptions in Table 4.2.
Particularly, the reflection coefficient contains a constant term S11, static due to
the impedance mismatch between the antenna and the generator, and due to
environmental reflections. This term is assumed independent of the varying
reflective load. For a detailed explanation and derivation of the equations, see
[V], [VI].
Figure 4.4 Layout of the proposed antenna pattern retrieval method [V], [VI].

Development of Methods for Antenna Measurement
50
Table 4.2 Symbols and descriptions [VI].
Symbol Description
EAUT(x, y, z) electrical aperture field distribution at the plane z
EΓ(x, y, z) field reflected from the reflective surface at the plane z
z0 offset distance
S aperture surface
S11,aperture reflection coefficient referenced to the aperture plane of a lossless and perfectly matched antenna
S11 reflection coefficient referenced to the antenna feed
θd, α the phase delay and the attenuation constant between the antenna feed and aperture plane
S11,n the nth simulated reflection coefficient
Ainitial, θinitial initial guess of the amplitude and phase
A, B aperture dimensions of the horn antenna
4.2.2 Simulations and Experiments
The proposed method is tested experimentally and by simulations using a Ka-
band pyramidal horn antenna operating at 30 GHz as the AUT. The simulation
setup is shown in Figure 4.5. The PEC strip is placed vertically in parallel to
the antenna aperture, moved along x-direction, additionally, for 2D simulation,
after the first movement, the strip is placed horizontally and moved along y-
direction, see [V] for details. The reflection coefficients are recorded at each
discrete position of the strip. It is important to select the distance z0 and Dmove
such that the evanescent modes generated by the AUT are weak enough at the
reflective plane and the reflection from the reflective plane is strong enough to
be detected by the AUT.
Figure 4.5 Simulation setup, see [V] for the details of the pyramidal horn dimensions and
photograph of the corresponding experimental setup (not to scale).

Development of Methods for Antenna Measurement
51
4.2.3 Solving the Antenna Aperture Field
After the adequate number of reflection coefficients are gathered, the antenna
aperture field EAUT is determined by finding the minimum of the least-squares
fitting in Eq. (4.6), which is solved iteratively using the quasi-Newton method
starting from the initial guess for the aperture near-field given as Eq. (4.7).
Figure 4.6 shows the comparison of the reconstructed, simulated and
measured normalized radiation patterns at 30 GHz. Normally we choose
values with uniform amplitude and phase and normalize this electric field
distribution to unity, hence, Ainitial = 1, θinitial = 1.
AUT,
2211,aperture AUT 11,static 11,min , ,E n nn S E x y e S S (4.6)
initial
AUT when and
, , 0 2 20 elsewhere
jinitial
A BA e x yE x y z (4.7)
where θd is omitted because the phase delay term is embedded into the
unknown complex aperture field. In addition, the field can be spatially limited
according to the physical aperture of the antenna and full reflection is assumed
from the reflective surface and zero reflection elsewhere.
For 2D determination, we assume that the near-field distribution is
separable, i.e. the total field can be represented as a product of field
distribution in two orthogonal directions. Two sets of measurement are
performed in horizontal direction and vertical direction respectively.
According to the method introduced in [V], the aperture field distributions of
two orthogonal directions are solved separately. The 2D aperture field is then
calculated accordingly [VI]. Figure 4.7 shows the comparison of the contour
plot of the antenna far-field pattern at 30 GHz. The grey color and dashed-line
rectangular in Figure 4.6 and 4.7 are the valid angular regions defined from
the measurement setup [V], [VI].
These results show that the proposed method is suitable for characterizing
certain types of antennas without a need for a traditional two-way
measurement. The measurement accuracy provided already by these initial
results seems adequate for certain purposes. There may be also a possibility to
extend this method to characterize small antennas on a probe station.

Development of Methods for Antenna Measurement
52
Figure 4.6 Normalized far-field pattern at 30 GHz [V].
Figure 4.7 Normalized 2D far-field pattern at 30 GHz: (a) simulated; (b) reconstructed with
simulated reflection coefficient [VI]. The dashed-line rectangular represents the
valid angular region.
Development of Methods for Antenna Measurement
53
4.3 Realization of Wideband Hologram Compact Antenna Test Range
A CATR transforms a spherical wave into a plane wave in a very short distance
(compared to the generally known far-field limit of 2D2/ ) using a collimating
element, which can be a reflector [84], a lens [85], [86], or a hologram [90].
For a reflector, the surface accuracy is typically required to be better than 0.01
and even 0.007 for a large reflector [87], [88]. E.g., at 1 THz one hundredth
of the wavelength is 3 μm, which may be too stringent to be manufactured in
large scale. The hologram-based CATR (HCATR) was developed to produce a
plane wave for antenna measurement at mm/submm-wave frequency [89],
[90]. There are several types of hologram, e.g. a reflection-type amplitude
hologram [91], a transmission-type phase hologram [92] and a reflection-type
phase hologram [93]. As a transmission-type element, the accuracy becomes
considerably less stringent than for a reflector [26]. Manufacturing of a
hologram is easier than that of a reflector surface because of the two-
dimensional planar structure. Consequently, the HCATR is very attractive for
antenna measurement at mm/submm-wave bands. E.g., the antenna pattern
measurement of Odin-telescope at 119 GHz was reported in [18]. A large
HCATR was constructed and tested at 322 GHz [21], [22]. A 1.5-m reflector
antenna (Admirals RTO) was tested in a HCATR at 650 GHz [23], [25].
However, as a frequency sensitive element, the operating bandwidth is usually
limited to around 5%-10% [26].
In this section, we present a technique to overcome the limitation of the
narrow bandwidth. The feed location needs to be adjusted on the axis for
compensating the wavefront phase curve of the feed according to the Fresnel
approximation. Particularly, Section 4.3.1 shows the derivation process of the
wideband HCATR formulas. In Section 4.3.2 the experimental setup and
performance are presented to verify the technique.
4.3.1 Derivation of Wideband Formulas
For a transmittance hologram, the interference pattern varies with the path
difference between the feed and the plane wave field as:
2 2 2( , ) sin cc x y x y F x (4.8)

Development of Methods for Antenna Measurement
54
where point (x, y) is located in the hologram, F denotes the focal length and θc
indicates the direction of plane wave propagation. When F >> |x| and F >> |y|,
the square root can be approximated as the second order Taylor series:
2 2 2 2 2
3
( )( , ) sin2 8 cx y x yc x y F xF F
. (4.9)
For the given wavelength , if the focal ratio (F/DH) is large enough [VII], the
phase can be approximated as the first order Taylor series as:
2 22 2( , ) ( , ) ( sin )2 cx yx y c x y F xF
= (4.10)
where DH is the diameter of the hologram. When the wavelength is scaled
down by M and the feed is moved further away to the distance MF, the
equation would be:
2 2
22( , ) sin2 cx yx y M F xMF
= . (4.11)
The second term in both Eqs. (4.9) and (4.10) is the same for producing a
plane wave. The first term is independent of (x, y) with respect to the
hologram collimation. The last term implies the new direction of the plane
wave propagation. Therefore, the feeding location and plane wave direction for
a new frequency can be formulated as follows:
/
sinarcsin( )c
F F MFM
M
. (4.12)
A wideband HCATR can be realized with the same aperture only by linearly
adjusting the feeding location on the axis. Figure 4.8 illustrates the layout of
the proposed adjusting procedure.

Development of Methods for Antenna Measurement
55
Figure 4.8 Layout of the proposed wideband HCATR [VII].
4.3.2 Experimental Verification and Performance
An experimental wideband HCATR has been designed and built for the
verification of the proposed method. The hologram is quantized into the
binary code for fabrication and the size is 350 mm 350 mm (detailed
description in [VII]). An optimized weighting is utilized to the hologram to
achieve desired relative flat amplitude and phase distribution [VII], [90].
The experimental measurement setup for tests at 95 GHz and 170 GHz is
shown in Figure 4.9. For 95 GHz, the off-axis angle is θc = 39.5° and the
distance between the hologram and the quiet-zone d = 1050 mm. The
corrugated horn is placed at F = 1432 mm from the hologram along its normal
direction. For 170 GHz, the parameters are θ’c = 39.5° and F’ = 2562 mm.
More details are presented in [VII].
The performance is evaluated by the peak-to-peak (PP) deviation from the
flat amplitude and phase response in the quiet-zone. Figure 4.10 shows the
measured co-polarized field for horizontal polarization in horizontal line at 95
GHz and 170 GHz respectively. The amplitude is normalized to the maximum.
The measured result of the co-polarized quiet-zone fields are summarized in
Table 4.3 (H denotes the horizontal polarization and V denotes the vertical
polarization). For results and discussion of other polarization and cut, see
[VII].

Development of Methods for Antenna Measurement
56
Figure 4.9 The setup of the HCATR for the measurements (top), open-ended waveguide probe
(bottom left), the hologram (bottom middle), and the D-band corrugated horn as
the CATR feed (bottom right) [VII].
Figure 4.10 The measured quiet-zone field with horizontal polarization in the horizontal line
(y = 0, step = 1.0 mm at 95 GHz, and 0.8 mm at 170 GHz in the scanning x-axis):
(a) amplitude; (b) phase [VII].
Table 4.3 The measured quiet-zone quality of the wideband hologram CATR: PP deviations
from the planar field (amplitude in dB, phase in degrees) [VII].
Frequency
PP value in horizontal line PP value in vertical line
H polarization
V polarization
H polarization
V polarization
(GHz)
Amp. Pha. Amp. Pha. Amp. Pha. Amp. Pha.
85 1.6 18.2 2.4 22.8 1.4 13.2 1.1 11.6
95 1.7 10.8 1.9 16.4 1.7 12.8 1.5 8.8
170 1.9 20 2.1 22.6 2.1 11.4 1.5 9

57
5. Summary of the Publications
I. “Millimeter wave beam steering with a MEMS-based high impedance surface”
Beam steering with a MEMS-based high impedance surface has been studied
in W band. The steering mechanism is based on the principle of a phase
gradient array. Reflection phase properties of a single unit cell structure are
analyzed. Radiation pattern of a strip consisting of elements with different
impedance is analyzed numerically for two beams of normal and oblique
incidence. The steering range is achieved from -45° to 45° with respect to the
normal direction.
II. “Reflection phase characterization of the MEMS-based high impedance surface”
The reflection properties of the MEMS-based HIS illuminated from oblique
angles of incidence have been characterized numerically, and a quasi-optical
measurement setup has been built for experimental characterization. The
resonance frequency and the relative bandwidth are slightly increasing with
the increase of the angle of incidence. The comparison between the simulated
and measured results is discussed.
III. “Design and optimization of reconfigurable reflectarray element with MEMS phase shifter”
The design and optimization process of reconfigurable reflectarray element
with MEMS-based phase shifter at 120 GHz is presented. The dielectric
properties of SU-8 substrate are characterized with on-wafer measurements.
Several design parameters which affect the element efficiency are studied.
Through proper design and optimization of the array element the reasonable

Summary of the Publications
58
element efficiency can be achieved by utilizing SU-8 photoresist as its
substrate.
IV. “Generation of free space radiation patterns from non-anechoic measurements using Chebyshev polynomials”
Generally, antenna radiation patterns are measured in an anechoic condition
so that the presence of undesired reflections does not skew the final
measurements. The objective of this paper is to search for methods which can
extract meaningful approximate results from non-anechoic measurements.
The Chebyshev polynomials are used to process the data collected under non-
anechoic environment and to generate a radiation pattern equivalent to that in
free space conditions. The problem with this method is that some a priori
information is required about the environment. Measured data has been used
to illustrate the applicability of this new method and its improved performance
over the FFT-based methods.
V. “Antenna pattern retrieval from reflection coefficient measurements with reflective loads”
This paper presents a new method for antenna pattern retrieval from
reflection coefficient measurements. A reflective load with known reflective
properties is placed close to the aperture of the antenna under test. The
reflection coefficient at the antenna feed is measured with multiple different
reflective loads. The antenna pattern is then solved from the measurements
with an inversion method. This paper derives and verifies the analytical
foundations needed to implement the method, and demonstrates the method
both by simulations and experiments for a pyramidal horn antenna at 30 GHz.
VI. “2D antenna radiation pattern retrieval using reflection coefficient measurement”
This paper reviews the antenna radiation pattern retrieval method using
reflection coefficient measurement developed in [V], and extension for two-
dimensional apertures is proposed. This is achieved sweeping a PEC strip in
front of the antenna aperture in two orthogonal directions instead of
previously used one direction. The method has been demonstrated by
simulation for a pyramidal horn antenna at 30 GHz.

Summary of the Publications
59
VII. “Realization of wideband hologram compact antenna test range by linearly adjusting the feed location”
This paper describes a wideband hologram-based CATR: which can be realized
by linearly adjusting the feed location. The position needs to be adjusted for
approximately compensating the wave front curve of the feed, which is
proportional to the operating frequency. The theory can be conformed under
the paraxial condition. For the acceptable quiet-zone field quality over a wide
band, the large focal ratio is required. The idea is verified and the wideband
performance of the quiet-zone is studied with the simulated and measured
results at W band (95 GHz) and D band (170 GHz).

Summary of the Publications
60

61
6. Conclusions and Future Work
This dissertation contributes to the development of methods for antenna
measurement, and numerical and experimental characterization of quasi-
optical components, i.e. MEMS-based HIS and reflectarray element.
The reflection properties of the single unit cell structure of MEMS-based HIS
was studied, tunability of the MEMS varactors and beam steering of a large
structure at 80 GHz has been demonstrated with a simplified model [I]. The
reflection phase across the surface can be programmed to produce a phase
gradient, which allows steering the reflected beam within the range from -45º
to +45°. A quasi-optical measurement setup has been built for the
experimental characterization [II]. Future work would be addressed to
development of the fabrication process for a reliable actuation of the large
array of the MEMS varactors.
The design and optimization process of the reconfigurable reflectarray
element integrated with MEMS-based phase shifter at 120 GHz has been
studied [III]. Also, the dielectric properties of SU-8 substrate have been
characterized with on-wafer measurements. Several design parameters which
could affect the modulation efficiency have been studied. The element spacing
(size of the side ground plane) has very significant influence to the modulation
efficiency. Through proper design and optimization of the array element,
reasonable modulation efficiency could be achieved by utilizing SU-8
photoresist as its substrate.
Several new methods have been proposed to deal with certain limitations
during antenna measurements. Particularly, a new technique using the
Chebyshev polynomials has been proposed to process the antenna
measurements obtained in non-anechoic sites to obtain equivalent free space
radiation patterns in [IV]. This new technique combines the principle of a
FFT-based method with the special relationship between coefficients of the
Bessel-Chebyshev polynomials. The assumption of this technique is that the
minimum distance from the transmitter to the receiver through the reflector is

Conclusions and Future Work
62
known. If the antenna radiation pattern is complicated and has many large
sidelobes, it would be very difficult to recover all the signals. Also the
performance of the proposed method depends on how well the scaling factor is
chosen. Sample experimental result is presented to demonstrate the potential
of this approach over conventional time gating techniques for a certain class of
problems. Future research interest would be how to find an automated way to
truncate the series of the coefficients based on the measured data and not on
the a priori knowledge of the environment.
In [V] and [VI], a new antenna pattern retrieval method is proposed. In this
method, the antenna reflection coefficient is measured multiple times when a
unique reflective load with known spatial reflection properties is placed near
the antenna in each measurement. The antenna pattern is obtained from the
measurements with an inversion algorithm. The analytical equations for
equating the antenna reflection coefficient to the near-field load of the antenna
have been presented. Simulations have been used to verify the theoretical basis
and the method has been experimentally demonstrated at 30 GHz. The results
show that the method could enable sufficient accuracy with low gain antennas
or in the vicinity of main lobe with directive antennas. This method requires
optimization, and the typical time to retrieve the field depends on the selected
cost function and optimization algorithm. Therefore, future research interests
include: improve the inversion method, optimize the reflective surface, study
the influence of the initial guess to the retrieved field, and extend the current
method to a probe station to measure an integrated antenna.
In [VII], a new method for a wideband operation of the hologram-based
CATR has been presented. The wideband formulas for linearly adjusting the
feed have been discussed and verified. The performance of the wideband
operation has been demonstrated by measurements at W (95 GHz) and D (170
GHz) bands with the hologram aperture diameter of 350 mm. When the
bandwidth is increased, the direction of the plane wave propagation is varied
more. The direct beam starts to disturb the desired planar wavefront at the
higher end of the frequency band, while at the lower end the quiet-zone size is
getting smaller. Future research would be addressed to study the possible
bandwidth limit and minimum of hologram configurations required for the
proposed technique.

63
Reference
[1] C. A. Balanis, Antenna Theory: Analysis and Design, Third Edition, New York: Wiley, 2005.
[2] G. Rebeiz, RF MEMS: Theory, Design, and Technology, Hoboken, NJ: John Wiley & Sons, Inc., 2004.
[3] “ECC decision of 19 March 2004 on the frequency band 77-81 GHz to be designated for the use of automotive short range radars,” European Commission Decision no. 2004/545/EC, Retrieved June 9, 2014.
[4] A. Tamminen, J. Ala-Laurinaho, D. Gomes-Martins, J. Häkli, P. Koivisto, M. Kärkkäinen, S. Mäkelä, P. Pursula, P. Rantakari, M. Sipilä, J. Säily, R. Tuovinen, M. Varonen, K. A. I. Halonen, A. Luukanen, and A. V. Räisänen, “Reflectarray for 120-GHz beam steering application: design, simulations, and measurements,” in Proc. SPIE Passive and Active Millimeter-Wave Imaging XV, Baltimore, USA, Apr. 23, 2012, p. 836205.
[5] A. Tamminen, Developments in imaging at millimeter and submillimeter wavelengths, Doctoral dissertation, Dept. of Radio Science and Engineering, Aalto University, Espoo, Finland, 2013.
[6] A. Tamminen, S. Mäkelä, J. Ala-Laurinaho, J. Häkli, P. Koivisto, P. Rantakari, J. Säily, A. Luukanen, and A. V. Räisänen, “Reflectarray design for 120-GHz radar application: measurement results,” IEEE Trans. Antennas Propag., vol. 61, no.10, pp. 5036-5047, Oct. 2013.
[7] D. Chicherin, Studies on microelectro-mechanically tuneable high-impedance surface for millimeter wave beam steering, Doctoral dissertation, Dept. of Radio Science and Engineering, Aalto University, Espoo, Finland, 2011.
[8] J. Ala-Laurinaho, D. Chicherin, Z. Du, C. Simovski, T. Zvolensky, A. V. Räisänen, M. Sterner, Z. Baghchehsaraei, U. Shah, S. Dudorov, J. Oberhammer, A. V. Boriskin, L. Le Coq, E. Fourn, S. A. Muhammad, R. Sauleau, A. Vorobyov, F. Bodereau, G. El Haj Shhade, T. Labia, P. Mallejac, J. Åberg, M. Gustafsson, and T. Schier, “TUMESA-MEMS tuneable metamaterials for smart wireless applications,” in Proc. 7th European Microw. Integrat. Circ. Conf., Amsterdam, the Netherlands, Oct. 29-30, 2012, pp. 95-98.
[9] D. Chicherin, M. Sterner, Z. Baghchehsaraei, J. Oberhammer, S. Dudorov, Z. Du, T. Zvolensky, A. Vorobyov, M. de Miguel Gago, E. Fourn, R. Sauleau, T. Labia, G. El Haj Shhade, F. Bodereau, P. Mallejac, J. Åberg, C. Simovski, and A. V. Räisänen, “MEMS tunable metamaterials for beam steering millimeter wave applications,” in Proc. NATO Research Workshop on Advanced Materials Technologies for Micro/Nano-devices, Sensors, and Actuators: From
Reference
64
Fundamentals to Applications, St. Petersburg, Russia, June 29 – July 2, 2009, p. 45.
[10] A. V. Räisänen, J. Ala-Laurinaho, D. Chicherin, Z. Du, A. Generalov, A. Karttunen, D. Lioubtchenko, J. Mallat, A. Tamminen, and T. Zvolensky, “Antennas for electronic beam steering and focusing at millimeter wave lengths,” in Proc. Int. Conf. Electromagnetics in Advanced Applications, Cape Town, South Africa, Sep. 2-7, 2012, pp. 1235-1237.
[11] A. V. Räisänen, J. Ala-Laurinaho, D. Chicherin, Z. Du, A. Generalov, A. Karttunen, D. Lioubtchenko, J. Mallat, A. Tamminen, and T. Zvolensky, “Beam-steering antennas at millimeter wavelengths,” in Proc. 5th Global Symp. Millimeter Waves, Harbin, China, May 27-30, 2012, pp. 170-173.
[12] Z. Du, D. Chicherin, and A. V. Räisänen, “Beam steering with MEMS-based HIS on a lossy sillicon substrate at 80 GHz,” in The Millimetre Wave Days: The 6th ESA Workshop on Millimetre-Wave Technology and Applications, Espoo, Finland, May 23-25, 2011.
[13] J. Ala-Laurinaho, Z. Du, V. Viikari, and A. V. Räisänen, “Radiation pattern retrieval from impedance measurement with a reflective object in the antenna near field,” in Proc. IEEE Int. Conf. Antenna Meas. & Application (2014 IEEE CAMA), Antibes Juan-les-Pins, France, Nov. 16-19, 2014.
[14] V. Viikari, Z. Du, V. Semkin, J. Ala-Laurinaho, and A. V. Räisänen “Reflection coefficient method for characterizing antennas on probe stations,” in Proc. 9th European Conf. Antennas Propag., Lisbon, Portugal, Apr. 12-17, 2015.
[15] B. Fourestie, Z. Altman, and M. Kanda, “Anechoic chamber evaluation using the matrix pencil method,” IEEE Trans. Electromagn. Compat., vol. 41, no. 3, pp. 169-174, Aug. 1999.
[16] B. Fourestie, Z. Altman, and M. Kanda, “Efficient detection of resonances in anechoic chambers using the matrix pencil method,” IEEE Trans. Electromagn. Compat., vol. 42, no. 1, pp. 1-5, Feb. 2000.
[17] B. Fourestie and Z. Altman, “Gabor schemes for analyzing antenna measurements,” IEEE Trans. Antennas Propag., vol. 49, no. 9, pp. 1245-1253, Sep. 2001.
[18] T. Sehm, J. Ala-Laurinaho, T. Hirvonen, and A. V. Räisänen, “Antenna measurements using a hologram CATR,” Electron. Lett., vol. 35, no. 10, pp. 757-758, May 1999.
[19] J. Ala-Laurinaho, Numerical studies on a radio frequency hologram and its use in antenna measurements, Doctoral dissertation, Dept. of Electrical and Communications Engineering, Helsinki University of Technology, Espoo, Finland, 2001.
[20] J. Ala-Laurinaho, T. Hirvonen, P. Piironen, A. Lehto, J. Tuovinen, A. V. Räisänen, and U. Frisk, "Measurement of the Odin telescope at 119 GHz with a hologram-type CATR," IEEE Trans. Antennas Propag., vol. 49, no. 9, pp. 1264-1270, Sep. 2001.
[21] J. Häkli, T. Koskinen, A. Lönnqvist, J. Säily, J. Mallat, J. Ala-Laurinaho, V. Viikari, J. Tuovinen, and A. V. Räisänen, “Testing of a 1.5 m reflector antenna at 322 GHz in a CATR based on a hologram,” IEEE Trans. Antennas Propag., vol. 53, no. 10, pp. 3142-3150, Oct. 2005.

Reference
65
[22] A. Lönnqvist, T. Koskinen, J. Häkli, J. Säily, J. Ala-Laurinaho, J. Mallat, V. Viikari, J. Tuovinen, and A. V. Räisänen, “Hologram-based compact range for submillimeter-wave antenna testing,” IEEE Trans. Antennas Propag., vol. 53, no. 10, pp. 3151-3159, Oct. 2005.
[23] T. Koskinen, J. Ala-Laurinaho, J. Säily, A. Lönnqvist, J. Häkli, J. Mallat, J. Tuovinen, and A. V. Räisänen, “Experimental study on a hologram-based compact antenna test range at 650 GHz,” IEEE Microw. Theory Techn. vol. 53, no. 9, pp. 2999–3006, Sep. 2005.
[24] J. Ala-Laurinaho, J. Häkli, A. Karttunen, T. Koskinen, A. Lönnqvist, J. Mallat, E. Noponen, A. Tamminen, M. Vaaja, V. Viikari, A. V. Räisänen, and J. Lemanczyk, “Tests of a 1.5-m reflector antenna in a 650 GHz hologram CATR,” in Proc. 2nd European Conf. Antennas Propag., Edinburgh, UK, Nov. 11-16, 2007, pp. 1-6.
[25] A. Karttunen, J. Ala-Laurinaho, M. Vaaja, T. Koskinen, J. Häkli, A. Lönnqvist, J. Mallat, A. Tamminen, V. Viikari, and A. V. Räisänen, “Antenna tests with a hologram-based CATR at 650 GHz,” IEEE Trans. Antennas Propag., vol. 57, no.3, pp. 711-720, Mar. 2009.
[26] T. Hirvonen, J. Ala-Laurinaho, and A. V. Räisänen, “Performance analysis of a submillimeter wave hologram CATR,” in Proc. 27th European Microw. Conf., Jerusalem, Israel, Sep. 8-12, 1997, pp. 681-686.
[27] D. Sievenpiper, High-impedance electromagnetic surfaces, Ph.D. dissertation, Dept. of Electrical Engineering, University of California, Los Angeles, USA, 1999.
[28] D. Sievenpiper, L. Zhang , R. F. J. Broas, N. G. Alexopolous, and E. Yablonovitch, “High-impedance electromagnetic surfaces with a forbidden frequency band,” IEEE Trans. Microw. Theory Techn., vol. 47, no. 11, pp. 2059-2074, Nov. 1999.
[29] R. F. J. Broas, D. F. Sievenpiper, and E. Yablonovitch, “A high-impedance ground plane applied to a cellphone handset geometry,” IEEE Trans. Microw. Theory Techn., vol. 49, no. 7, pp. 1262-1265, July 2001.
[30] D. Sievenpiper, J. Schaffner, R. Loo, G. Tangonan, S. Ontiveros, and R. Harold, “A tunable impedance surface performing as a reconfigurable beam steering reflector,” IEEE Trans. Antennas Propag., vol. 50, no. 3, pp. 384-390, Mar. 2002.
[31] D. Sievenpiper, J. Schaffner, B. Loo, G. Tangonan, R. Harold, J. Pikulski, and R. Garcia, “Electronic beam steering using a varactor-tuned impedance surface,” in Proc. IEEE AP-S Int. Symp. Antennas Propag., Boston, USA, July 8-13, 2001, vol. 1, pp. 174-177.
[32] D. Sievenpiper and J. Schaffner, “Beam steering microwave reflector based on electrically tunable impedance surface,” Electron. Lett., vol. 38, no. 21, pp. 1237-1238, Oct. 2002.
[33] D. F. Sievenpiper, J. H. Schaffner, H. J. Song, R. Y. Loo, and G. Tangonan, “Two-dimensional beam steering using an electrically tunable impedance surface,” IEEE Trans. Antennas Propag., vol. 51, no. 10, pp. 2713-2722, Oct. 2003.
[34] S. Tretyakov, Analytical Modeling in Applied Electromagnetics, Boston: Artech House, 2003.
[35] D. Chicherin, S. Dudorov, D. Lioubtchenko, V. Ovchinnikov, S. Tretyakov, and A. V. Räisänen, “MEMS-based high-impedance surfaces for millimeter and

Reference
66
submillimeter wave applications,” Microw. Opt. Technol. Lett., vol. 48, no. 12, pp. 2570-2573, Dec. 2006.
[36] D. Chicherin, M. Sterner, J. Oberhammer, S. Dudorov, J. Åberg, and A. V. Räisänen, “Analog type millimeter wave phase shifters based on MEMS tunable high-impedance surface in rectangular metal waveguide,” in Proc. IEEE MTT-S Int. Microw. Symp., Anaheim, USA, May 23-28, 2010, pp. 61-64.
[37] M. Sterner, D. Chicherin, J. Åberg, R. Sauleau, A. Räisänen, G. Stemme, and J. Oberhammer, “Integration of microwave MEMS reconfigurable reflective surfaces in rectangular waveguide stubs,” in Proc. Asia-Pacific Microw. Conf., Yokohama, Japan, Dec. 7-10, 2010, pp. 1825-1828.
[38] D. Chicherin, M. Sterner, D. Lioubtchenko, J. Oberhammer, and A. V. Räisänen, “Analog-type millimeter-wave phase shifters based on MEMS tunable high-impedance surface and dielectric rod waveguide,” Int. J. Microw. Wireless Techn., vol. 3, no. 5, pp. 533-538, Oct. 2011.
[39] D. Chicherin, S. Dudorov, D. Lioubtchenko, V. Ovchinnikov, and A. V. Räisänen, “Characterisation and measurements of a multilayer high-impedance surface at W-band”, Proc. 1st Int. Congr. on Advanced Electromagnetic Materials in Microwave and Optics, Oct. 22-26, 2007, Rome, Italy, pp. 891-894.
[40] D. Berry, R. Malech, and W. Kennedy, “The reflectarray antenna,” IEEE Trans. Antennas Propag., vol. 11, no. 6, pp. 645-651, Nov. 1963.
[41] R. D. Javor, X. D. Wu, and K. Chang, “Design and performance of a microstrip reflectarray antenna,” IEEE Trans. Antennas Propag., vol. 43, no. 9, pp. 932-939, Sep. 1995.
[42] J. Huang and J. A. Encinar, Reflectarray Antennas, New Jersey, USA: Wiley, 2007.
[43] S. V. Hum, M. Okoniewski, and R. J. Davies, “Realizing an electronically tunable reflectarray using varactor diode-tuned elements,” IEEE Microw. Compon. Lett., vol. 15, no. 6, pp. 422-424, June 2005.
[44] M. Riel and J. Laurin, “Design of an electronically beam scanning reflectarray using aperture-coupled elements,” IEEE Trans. Antennas Propag., vol. 55, no. 6, pp. 1260-1266, May 2007.
[45] J. Perruisseau-Carrier and A. K. Skrivervik, “Monolithic MEMS-based reflectarray cell digitally reconfigurable over a 360 degree phase range,” IEEE Antennas Wireless Propg. Lett., vol. 7, pp. 138-141, Feb. 2008.
[46] H. Kamoda, T. Iwasaki, J. Tsumochi, and T. Kuki, “60-GHz electrically reconfigurable reflectarray using p-i-n diode,” in Proc. IEEE MTT-S Int. Microw. Symp., Boston, USA, June 7-12, 2009, pp. 1177-1180.
[47] S. Bildik, S. Dieter, C. Fritzsch, M. Frei, C. Fischer, W. Menzel, and R. Jakoby, “Reconfigurable liquid crystal reflectarray with extended tunable phase range,” in Proc. 41st European Microw. Conf., Manchester, UK, Oct. 10-13, 2011, pp. 404-407.
[48] K. Li, C. H. Cheng, T. Matsui, and M. Izutsu, “Coplanar patch antennas: principle, simulation and experiment,” in Proc. IEEE AP-S Int. Symp. Antennas Propag., Boston, USA, July 8-13, 2001, vol.3, pp. 402-405.

Reference
67
[49] R. Simons, Coplanar Waveguide Circuits, Components, and Systems, New York: John Wiley, 2001.
[50] F. D. Mbairi and H. Hesselbom, “High frequency design and characterization of SU-8 based conductor backed coplanar waveguide transmission lines,” in Proc. Int. Symp. Adv. Packaging Materials: Process, Properties & Interfaces, Mar. 16-18, 2005, pp. 243-248.
[51] S. N. Dudorov, D. V. Lioubtchenko, and A. V. Räisänen, “Open resonator technique for measuring dielectric properties of thin films on a substrate,” in Proc. XXVIII URSI General Assembly, 2005, paper no. A03.6.
[52] S. Arscott, F. Garet, P. Mounaix, L. Duvillaret, J. L. Coutaz, and D. Lippens, “Terahertz time-domain spectroscopy of films fabricated from SU-8,” Electron. Lett., vol. 35, no. 3, pp. 243-244, Feb. 1999.
[53] A. D. Yaghjian, “An overview of near-field antenna measurements,” IEEE Trans. Antennas Propag., vol. 34, no. 1, pp. 30-45, Jan. 1986.
[54] A. M. Predoehl and W. L. Stutzman, “Implementation and results of a time-domain gating system for a far-field range,” in Proc. 19th Annual Meeting Symp. AMTA, Boston, USA, Nov. 1997, pp. 8-12.
[55] Y. T. Hsiao, L. Y. Y. Lin. Y. C. Lu, and H. T. Chou, “Applications of time-gating method to improve the measurement accuracy of antenna radiation inside an anechoic chamber,” in Proc. IEEE AP-S Int. Symp. Antennas Propag., Columbus, USA, June 22-27, 2003, vol. 3, pp. 794-797.
[56] S. Loredo, M. R. Pino, F. Las-Heras, and T. K. Sarkar, “Echo identification and cancellation techniques for antenna measurement in non-anechoic test sites,” IEEE Antennas Propag. Mag., vol. 46, no. 1, pp. 100-107, Feb. 2004.
[57] B. Fourestie, Z. Altman, J. Wiart, and A. Azoulay, “On the use of matrix-pencil method to correlate measurements at different test sites,” IEEE Trans. Antennas Propag., vol. 47, no. 10, pp. 1569-1573, Oct. 1999.
[58] T. K. Sarkar and O. Pereira, “Using the matrix pencil method to estimate the parameters of a sum of complex exponentials,” IEEE Antennas Propag. Mag., vol. 37, no. 1, pp. 48-55, Feb. 1995.
[59] G. Leon, S. Loredo, S. Zapatero, and F. Las Heras, “Radiation pattern error corrections based on matrix pencil method,” in Proc. IEEE AP-S Int. Symp. Antennas Propag., San Diego, USA, July 5-11, 2008.
[60] S. Loredo, G. Leon, R. G. Ayestaran, and F. Las-Heras, “Reconstruction of antenna radiation patterns from phaseless measurements in nonanechoic chambers,” IEEE Antennas Wireless Propag. Lett., vol. 10, pp. 1282-1285, Nov. 2011.
[61] R. G. Ayestarán, G. León, S. Loredo, J. López-Fernández, and F. Las-Heras, “Sparse deconvolution based on regularisation for echo correction in antenna measurement,” IET Microwaves Antennas Propag., vol. 6, no. 12, pp. 1299-1305, Sep. 2012.
[62] J. Koh, T. Kim, W. Lee, and T. K. Sarkar, “Extraction of wideband response using Bessel-Chebyshev functions,” IEICE Trans. Commun., vol. E85-B, no. 10, pp. 2263-2272, Oct. 2002.

Reference
68
[63] M. Yuan, J. Koh, T. K. Sarkar, W. Lee, and M. Salazar-Palma, “A comparison of performance of three orthogonal polynomials in extraction of wide-band response using early time and low frequency data,” IEEE Trans. Antennas Propag., vol. 53, no. 2, pp. 785-792, Feb. 2005.
[64] M. Yuan, A. De, T. K. Sarkar, J. Koh, and B. Jung, “Conditions for generation of stable and accurate hybrid TD-FD MoM solutions,” IEEE Trans. Microw. Theory Techn., vol. 54, no. 6, pp. 2552-2563, June 2006.
[65] M. Abramowitz and I. A. Stegun, Handbook of Mathematical Functions, New York: Dover, 1970.
[66] J. C. Mason and D. C. Handscomb, Chebyshev Polynomials, New York: Chapman & Hall/CRC, 2003.
[67] T. K. Sarkar, Application of the Conjugate Gradient Method in Electromagnetics and Signal Processing, New York: Elsevier Science Publications, 1991.
[68] D. Slater, Near-field Antenna Measurements, Norwood, MA: Artech House, 1991.
[69] J. Säily, P. Eskelinen and A. V. Räisänen, “Pilot signal-based real-time measurement and correction of phase errors caused by microwave cable flexing in planar near-field tests,” IEEE Trans. Antennas Propag., vol. 51, no. 2, pp. 195–200, Feb. 2003.
[70] D. D. King, “The measurement and interpretation of antenna scattering,” Proc. of the IRE, vol. 37, no. 7, pp. 770-777, July 1949.
[71] W. Wiesbeck and E. Heidrich, “Wide-band multiport antenna characterization by polarimetric RCS measurements,” IEEE Trans. Antennas Propag., vol. 46, no. 3, pp. 341–350, Mar. 1998.
[72] J. Appel-Hansen, “Accurate determination of gain and radiation patterns by radar cross-section measurements,” IEEE Trans. Antennas Propag., vol. 27, no. 5, pp. 640-646, Sep. 1979.
[73] P. Pursula, M. Hirvonen, K. Jaakkola, and T. Varpula, “Antenna effective aperture measurement with backscattering modulation,” IEEE Trans. Antennas Propag., vol. 55, no. 10, pp. 2836–2843, Oct. 2007.
[74] T. Zwick, C. Baks, U. R. Pfeiffer, D. Liu, and B. P. Gaucher, “Probe based MMW antenna measurement setup,” in IEEE AP-S Int. Symp. Antennas Propag., June 20-25, 2004, vol. 1, pp. 747-750.
[75] J. A. G. Akkermans, R. Van Dijk, and M. H. A. J. Herben, “Millimeter-wave antenna measurement,” in Proc. of 37th European Microw. Conf., Munich, Germany, Oct. 9-12, 2007, pp. 83-86.
[76] K. V. Caekenberghe, K. M. Brakora, W. Hong, K. Jumani, D. Liao, M. Rangwala, Y. Z. Wee, X. Zhu, and K. Sarabandi, “A 2-40 GHz probe station based setup for on-wafer antenna measurements,” IEEE Trans. Antennas Propag., vol. 56, no. 10, pp. 3241-3247, Oct. 2008.
[77] S. Ranvier, M. Kyrö, C. Icheln, C. Luxey, R. Staraj, and P. Vainikainen, “Compact 3-D on-wafer radiation pattern measurement system for 60 GHz antennas,” Microw. Opt. Technol. Lett., vol. 51, no. 2, pp. 319-324, Feb. 2009.

Reference
69
[78] T. Ito, Y. Tsutsumi, S. Obayashi, H. Shoki, and T. Morooka, “Radiation pattern measurement system for millimeter-wave antenna fed by contact probe,” in Proc. 39th European Microw. Conf., Rome, Italy, Sep. 29 - Oct. 1, 2009, pp. 1543-1546.
[79] S. Beer and T. Zwick, “Probe based radiation pattern measurements for highly integrated millimeter-wave antennas,” in Proc. 4th European Conf. Antennas Propag., Barcelona, Spain, Apr. 12-16, 2010.
[80] Y. Fu, T. P. Vuong, L. Dussopt, and F. Ndagijimana, “Characterization of integrated antennas at millimeter-wave frequencies,” in Proc. 5th European Conf. Antennas Propag., Rome, Italy, Apr. 11-15, 2011, pp. 160-163.
[81] K. Mohammadpour-Aghdam, S. Brebel, A. Enayati, R. Faraji-Dana, G. A. E. Vandenbosch, and W. Deraedt, “RF probe influence study in millimeter-wave antenna pattern measurements,” Int. Journal of RF Microwave Computer-Aided Engineering, vol. 21, no. 4, pp. 413-420, July 2011.
[82] D. Titz, F. Ferrero, G. Jacquemod, P. Brachat, and C. Luxey, “Measurement system for mm-wave integrated and probe-fed antennas,” in Loughborough Antennas Propag. Conf., Loughborough, UK, Nov. 12-13, 2012.
[83] T. Calazans, H. D. Griffiths, A. L. Cullen, D. E. N. Davies, and R. Benjamin, “Antenna radiation pattern measurement using a near-field wire scattering technique,” IEE Proc. Microwave Antennas Propag., vol. 145, no. 3, pp. 263-267, June 1998.
[84] R. C. Johnson, H. A. Ecker, and R. A. Moore, “Compact range techniques and measurements,” IEEE Trans. Antennas Propag., vol. 17, no. 5, pp. 568-576, Sep. 1969.
[85] A. D. Olver and A. A. Saleeb, “Lens-type compact antenna range,” Electron. Lett., vol. 15, no. 14, pp. 409-410, July 1979.
[86] W. Menzel and B. Hunder, “Compact range for millimetre-wave frequencies using a dielectric lens,” Electron. Lett., vol. 20, no. 19, pp. 768-769, Sep. 1984.
[87] “IEEE Standard Test Procedures for Antennas,” ANSI/IEEE STD 149, 1979.
[88] J. D. Huff, J. H. Cook, Jr., and B. W. Smith, “Recent developments in large compact range design,” in Proc. AMTA, Columbus, USA, Oct. 1992, pp. 5-39-5-44.
[89] J. Tuovinen, A. Vasara, and A. V. Räisänen, “A new type of compact antenna test range,” in Proc. 22nd European Microw. Conf. Espoo, Finland, Sep. 5-9, 1992, pp. 503-508.
[90] T. Hirvonen, J. Ala-Laurinaho, J. Tuovinen, and A. V. Räisänen, “A compact antenna test range based on a hologram,” IEEE Trans. Antennas Propag., vol. 45, no. 8, pp. 1270-1276, Aug. 1997.
[91] T. Koskinen, V. Viikari, J. Häkli, A. Lönnqvist, J. Ala-Laurinaho, J. Mallat, and A. V. Räisänen, “A reflection-type amplitude hologram as a collimating element in compact antenna test range,” in Proc. 27th Annual AMTA Meeting Symp., Newport, USA, Nov. 2005, pp. 417-421.
[92] J. Meltaus, J. Salo, E. Noponen, M. M. Salomaa, V. Viikari, A. Lönnqvist, T. Koskinen, J. Säily, J. Häkli, J. Ala-Laurinaho, J. Mallat, and A. V. Räisänen,

Reference
70
“Millimeter-wave beam shaping using holograms,” IEEE Trans. Microw. Theory Techn., vol. 51, no. 4, pp. 1274-1280, Apr. 2003.
[93] E. Noponen, J. Häkli, T. Koskinen, A. Lönnqvist, V. Viikari, J. Ala-Laurinaho, J. Mallat, and A. V. Räisänen, “Synthesis of reflection-type phase hologram for compact antenna test range at 310 GHz,” in Proc. 4th ESA Workshop on Millimetre-Wave Technology and Applications, Espoo, Finland, Feb. 15-17, 2006, pp. 391-396.

71
Errata
Publication III
In the second paragraph of sub-section III. A, p. 2425, it should read
“…calculated from equation (5)”
Publication IV
The unit of the colorbar in Fig. 4(a) and Fig. 6 should be “dB/10”
Eq. (5) should be
2
2 1 22 2 2
2 ( ) 2 2 2( , ) 1 for 2n
n n ni i f f ff l i U T f ln l l l
Eq. (6) should be
2
12 2 2 20
2 ( ) 2 2 21nN
n n nn
f i i f f fX a i U Tl n l l l

9HSTFMG*agaejb+
ISBN 978-952-60-6049-1 (printed) ISBN 978-952-60-6050-7 (pdf) ISSN-L 1799-4934 ISSN 1799-4934 (printed) ISSN 1799-4942 (pdf) Aalto University School of Electrical Engineering Department of Radio Science and Engineering www.aalto.fi
BUSINESS + ECONOMY ART + DESIGN + ARCHITECTURE SCIENCE + TECHNOLOGY CROSSOVER DOCTORAL DISSERTATIONS
Aalto-D
D 8
/2015
The dissertation presents three new methods to deal with certain limitations occurred during the antenna measurement processes. First, a new technique using the Chebyshev polynomials has been proposed to process the antenna measurements obtained in non-anechoic sites to obtain equivalent free space radiation patterns. Second, a new antenna pattern retrieval method from reflection coefficient measurements is proposed. Third, a new technique is presented to realize a wideband hologram compact antenna test range by linearly adjusting the feed location. The dissertation also discusses characterization of quasi-optics, i.e. MEMS-based high-impedance surface (HIS) and reflectarray elements. First, the reflection properties of the unit cell structure of MEMS-based HIS is studied, and beam steering of a large structure at 80 GHz has been demonstrated with a simplified model. Second, the design and optimization process of reconfigurable reflectarray element integrated with MEMS-based phase shifter at 120 GHz is studied.
Zhou D
u D
evelopment of C
haracterization Methods for A
ntennas and Quasi-O
pitcs A
alto U
nive
rsity
Department of Radio Science and Engineering
Development of Characterization Methods for Antennas and Quasi-Opitcs
Zhou Du
DOCTORAL DISSERTATIONS