Embed Size (px)
Citation preview

For personal use only. Please do not distribute.
This chapter is in the public domain. Forest Hydrology: Processes, Management and Assessment (eds D.M. Amatya, T.M. Williams, L. Bren and C. de Jong) 219
14.1 Introduction
Long-term research at small, gauged, forested watersheds within the USDA Forest Service, Ex-perimental Forest and Range network (USDA-EFR) has contributed substantially to our current understanding of relationships between forests and streamflow (Vose et al., 2014). Many of these watershed studies were established in the early to mid-20th century and have been used to evaluate the effects of forest disturbances such as harvesting, road construction, wild and pre-scribed fire, invasive species and changes in tree species composition on hydrological responses including stormflows, peak flows, water yield, ground water table and evapotranspiration. For-est hydrologists and natural resources managers are still working to fully understand the effects of watershed disturbances on hydrology, water quality and other ecosystem services (Zegre, 2008). Much of our knowledge on this topic is derived from steep, mountainous watersheds where these studies were initially conducted. An assessment by Sun et al. (2002) has shown that
low-gradient watersheds with forested wetlands generally have lower water yields, lower runoff ratios and higher evapotranspiration than upland- dominated watersheds, adding to our know-ledge of forest hydrology, particularly on the ef-fects of topography on streamflow patterns and stormflow peaks and volumes.
While paired watershed studies (Bosch and Hewlett, 1982; Brown et al., 2005) have been in-valuable in understanding the hydrological re-sponse to disturbances, reference watersheds can provide valuable insight into hydrological processes in relatively undisturbed forest ecosys-tems. The term ‘reference’ watershed is favoured over the term ‘control’ because reference water-sheds also change over time in response to nat-ural (e.g. windthrow, insects, fire, hurricanes, climatic extremes) and human-induced disturb-ances (e.g. atmospheric pollution, invasive spe-cies, climate change). However, reference water-sheds experience disturbances that are typically minor compared with most experimental treat-ments. Several recent studies have synthesized data from small reference watersheds, including
14 Hydrological Processes of Reference Watersheds in Experimental Forests, USA
D.M. Amatya1*, J. Campbell2, P. Wohlgemuth3, K. Elder4, S. Sebestyen5, S. Johnson6, E. Keppeler7, M.B. Adams8, P. Caldwell9 and D. Misra10
1USDA Forest Service, Cordesville, South Carolina, USA; 2USDA Forest Service, Durham, New Hampshire, USA; 3USDA Forest Service, Riverside, California, USA; 4USDA Forest Service, Fort Collins, Colorado, USA; 5USDA Forest Service, Grand Rapids, Minnesota, USA; 6USDA Forest Service, Corvallis, Oregon, USA; 7USDA Forest Service, Fort Bragg, California, USA; 8USDA Forest Service, Morgantown, West Virginia, USA; 9USDA Forest Service, Otto, North Carolina, USA; 10University
of Alaska–Fairbanks, Fairbanks, Alaska, USA
*Corresponding author; e-mail: [email protected]
For personal use only. Please do not distribute.220 D.M. Amatya et al.
those in the USDA-EFR network, highlighting important insights that can be gained from long- term data (Jones et al., 2012; Argerich et al., 2013; Creed et al., 2014).
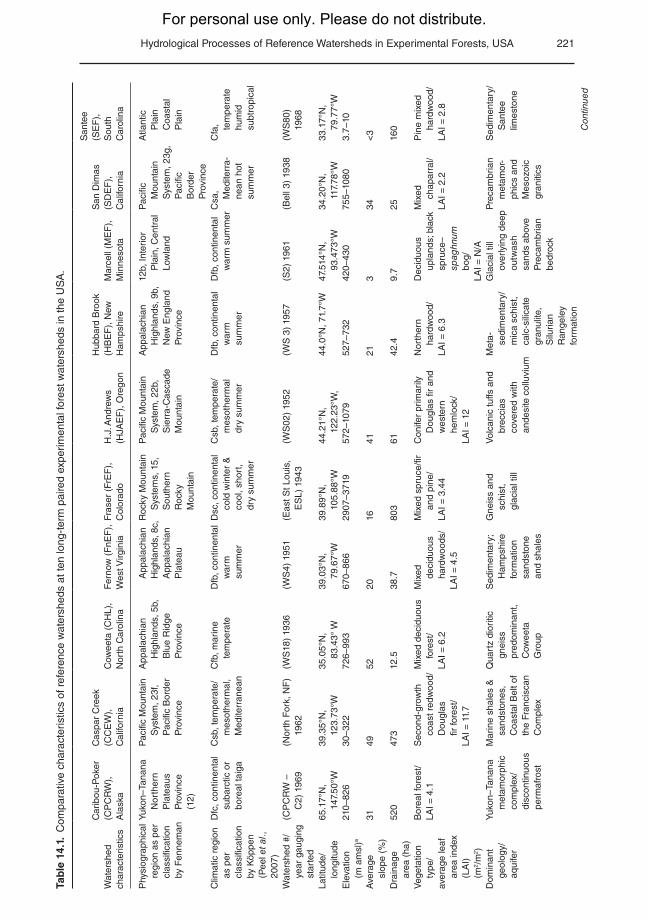
This chapter provides an overview and com-parison of factors influencing hydrological pro-cesses, especially streamflow dynamics and evapotranspiration, at ten relatively undisturbed reference watersheds in the USDA-EFR network (Fig. 14.1, Table 14.1). We demonstrate the breadth of the hydrogeological, topographic, cli-matic and ecological characteristics of reference watersheds by discussing how factors such as climate, topography, geology, soils and vegetation influence runoff generation (Fig. 9.1, Chapter 9, this volume) of these reference watersheds. We also briefly consider how site factors influence evapotranspiration, which determines water balance and regulates streamflow. This en-hances our current understanding of the hydro-logical behaviour of these watersheds enabling us to better predict responses to, and prepare for,
future management and environmental changes (Jones et al., 2009; Vose et al., 2014).
Located in vastly different ecohydrological regions, these watersheds have multiple factors influencing the streamflow (Q) regimes. There-fore we chose to assess differences in streamflow magnitudes and frequencies using flow duration curves (FDCs) and their flow percentiles (Searcy, 1959; Vogel and Fennessey, 1995). FDCs have been used to study integrated streamflow re-sponses to different types and distributions of storm runoff events (i.e. rainstorms, snowmelt) and landscape characteristics, and have been applied extensively to evaluate streamflow re-sponses to changing climate and other disturb-ances (e.g. Arora and Boer, 2001). An FDC with a steep slope throughout indicates a stream with more variable flow, whereas a flat slope is indi-cative of more stable flow with less variability. A steep slope at the upper end indicates more flashy streams with direct runoff characteriz-ing a flood regime, while a flatter slope indicates
Fig. 14.1. Map of the ten USDA Forest Service Experimental Forests included in this chapter.
For personal use only. Please do not distribute. Hydrological Processes of Reference Watersheds in Experimental Forests, USA 221
Tab
le 1
4.1.
Com
para
tive
char
acte
ristic
s of
ref
eren
ce w
ater
shed
s at
ten
long
-ter
m p
aire
d ex
perim
enta
l for
est w
ater
shed
s in
the
US
A.
Wat
ersh
ed
char
acte
ristic
s
Car
ibou
-Pok
er
(CP
CR
W),
A
lask
a
Cas
par
Cre
ek
(CC
EW
),
Cal
iforn
iaC
owee
ta (
CH
L),
Nor
th C
arol
ina
Fer
now
(F
nEF
),
Wes
t Virg
inia
Fras
er (
FrE
F),
C
olor
ado
H.J
. And
rew
s (H
JAE
F),
Ore
gon
Hub
bard
Bro
ok
(HB
EF
), N
ew
Ham
pshi
reM
arce
ll (M
EF
),
Min
neso
ta
San
Dim
as
(SD
EF
),
Cal
iforn
ia
San
tee
(S
EF
),
Sou
th
Car
olin
a
Phy
siog
raph
ical
re
gion
as
per
clas
sific
atio
n by
Fen
nem
an
Yuko
n–Ta
nana
N
orth
ern
Pla
teau
s P
rovi
nce
(1
2)
Pac
ific
Mou
ntai
n S
yste
m, 2
3f,
Pac
ific
Bor
der
Pro
vinc
e
App
alac
hian
H
ighl
ands
, 5b,
B
lue
Rid
ge
Pro
vinc
e
App
alac
hian
H
ighl
ands
, 8c,
A
ppal
achi
an
Pla
teau
Roc
ky M
ount
ain
Sys
tem
s, 1
5,
Sou
ther
n
Roc
ky
Mou
ntai
n
Pac
ific
Mou
ntai
n S
yste
m, 2
2b,
Sie
rra-
Cas
cade
M
ount
ain
App
alac
hian
H
ighl
ands
, 9b,
N
ew E
ngla
nd
Pro
vinc
e
12b,
Inte
rior
Pla
in, C
entr
al
Low
land
Pac
ific
M
ount
ain
Sys
tem
, 23g
, P
acifi
c
Bor
der
Pro
vinc
e
Atla
ntic
P
lain
C
oast
al
Pla
in
Clim
atic
reg
ion
as p
er
clas
sific
atio
n by
Köp
pen
(Pee
l et a
l.,
2007
)
Dfc
, con
tinen
tal
suba
rctic
or
bore
al ta
iga
Csb
, tem
pera
te/
mes
othe
rmal
, M
edite
rran
ean
Cfb
, mar
ine
tem
pera
teD
fb, c
ontin
enta
l w
arm
su
mm
er
Dsc
, con
tinen
tal
cold
win
ter
&
cool
, sho
rt,
dry
sum
mer
Csb
, tem
pera
te/
mes
othe
rmal
dr
y su
mm
er
Dfb
, con
tinen
tal
war
m
sum
mer
Dfb
, con
tinen
tal
war
m s
umm
erC
sa,
Med
iterr
a-ne
an h
ot
sum
mer
Cfa
, tem
pera
te
hum
id
subt
ropi
cal
Wat
ersh
ed #
/ye
ar g
augi
ng
star
ted
(CP
CR
W –
C
2) 1
969
(Nor
th F
ork,
NF
) 19
62(W
S18
) 19
36(W
S4)
195
1(E
ast S
t Lou
is,
ES
L) 1
943
(WS
02)
1952
(WS
3)
1957
(S2)
196
1(B
ell 3
) 19
38(W
S80
)
1968
Latit
ude/
long
itude
65.1
7°N
, 14
7.50
°W39
.35°
N,
123.
73°W
35.0
5°N
, 83
.43°
W39
.03°
N,
79.6
7°W
39.8
9°N
, 10
5.88
°W44
.21°
N,
122.
23°W
,44
.0°N
, 71.
7°W
47.5
14°N
, 93
.473
°W34
.20°
N,
117.
78°W
33.1
7°N
, 79
.77°
WE
leva
tion
(m
am
sl)a
210–
826
30–3
2272
6–99
367
0–86
629
07–3
719
572–
1079
527–
732
420–
430
755–
1080
3.7–
10
Ave
rage
sl
ope
(%)
3149
5220
1641
213
34<
3
Dra
inag
e
area
(ha
)52
047
312
.538
.780
361
42.4
9.7
2516
0
Veg
etat
ion
ty
pe/
aver
age
leaf
ar
ea in
dex
(LA
I)
(m2 /
m2 )
Bor
eal f
ores
t/LA
I = 4
.1S
econ
d-gr
owth
co
ast r
edw
ood/
Dou
glas
fir
fore
st/
LAI =
11.
7
Mix
ed d
ecid
uous
fo
rest
/LA
I = 6
.2
Mix
ed
deci
duou
s ha
rdw
oods
/LA
I = 4
.5
Mix
ed s
pruc
e/fir
an
d pi
ne/
LAI =
3.4
4
Con
ifer
prim
arily
D
ougl
as fi
r an
d w
este
rn
hem
lock
/LA
I = 1
2
Nor
ther
n ha
rdw
ood/
LAI =
6.3
Dec
iduo
us
upla
nds;
bla
ck
spru
ce–
spag
hnum
bo
g/LA
I = N
/A
Mix
ed
chap
arra
l/LA
I = 2
.2
Pin
e m
ixed
ha
rdw
ood/
LAI =
2.8
Dom
inan
t ge
olog
y/aq
uife
r
Yuko
n–Ta
nana
m
etam
orph
ic
com
plex
/di
scon
tinuo
us
perm
afro
st
Mar
ine
shal
es &
sa
ndst
ones
, C
oast
al B
elt o
f th
e Fr
anci
scan
C
ompl
ex
Qua
rtz
dior
itic
gnei
ss
pred
omin
ant,
Cow
eeta
G
roup
Sed
imen
tary
; H
amps
hire
fo
rmat
ion
sand
ston
e an
d sh
ales
Gne
iss
and
sc
hist
, gl
acia
l till
Vol
cani
c tu
ffs a
nd
brec
cias
co
vere
d w
ith
ande
site
col
luvi
um
Met
a-
sedi
men
tary
/m
ica
schi
st,
calc
-sili
cate
gr
anul
ite,
Silu
rian
R
ange
ley
form
atio
n
Gla
cial
till
over
lyin
g de
ep
outw
ash
sand
s ab
ove
Pre
cam
bria
n be
droc
k
Pre
cam
bria
n m
etam
or-
phic
s an
d M
esoz
oic
gran
itics
Sed
imen
tary
/S
ante
e lim
esto
ne
Con
tinue
d

For personal use only. Please do not distribute.222 D.M. Amatya et al.
Wat
ersh
ed
char
acte
ristic
s
Car
ibou
-Pok
er
(CP
CR
W),
A
lask
a
Cas
par
Cre
ek
(CC
EW
),
Cal
iforn
iaC
owee
ta (
CH
L),
Nor
th C
arol
ina
Fer
now
(F
nEF
),
Wes
t Virg
inia
Fras
er (
FrE
F),
C
olor
ado
H.J
. And
rew
s (H
JAE
F),
Ore
gon
Hub
bard
Bro
ok
(HB
EF
), N
ew
Ham
pshi
reM
arce
ll (M
EF
),
Min
neso
ta
San
Dim
as
(SD
EF
),
Cal
iforn
ia
San
tee
(S
EF
),
Sou
th
Car
olin
a
Dom
inan
t so
il ty
pe/
dept
h
Oln
es S
ilt
Loam
– T
ypic
C
ryor
then
ts;
Fair
play
Silt
Lo
am –
F
luva
que
ntic
E
ndoa
quo
lls;
Est
er S
ilt
Loam
– T
ypic
H
isto
turb
els/
0.2–
0.5
m
Van
dam
me
Ser
ies
U
ltiso
ls
(Typ
ic
Hap
lohu
mul
ts)/
1–1.
5 m
Cow
eeta
–Eva
rd–
Sau
nook
co
mpl
ex
(fin
e-lo
amy,
m
ixed
, Mes
ic
and
Hum
ic
Hap
lud
ults
)/>
1.5
m
Loam
y-sk
elet
al,
mix
ed m
esic
Ty
pic
D
ystr
udep
ts/
1 m
Leig
hcan
Ser
ies,
lo
amy-
skel
etal
, Ty
pic
D
ystr
ocye
pts
/<
1.5
m
50%
and
esite
co
lluvi
um,
(unn
amed
soi
l se
ries)
, 20%
Li
mbe
rlost
ser
ies,
lo
am to
gre
en
brec
cia/
up to
1.2
m
Lym
an–T
un-
brid
ge–B
ecke
t S
erie
s, T
ypic
H
aplo
rtho
ds/
C h
oriz
on d
epth
up
to 9
m
War
ba S
erie
s fin
e lo
amy,
m
ixed
, su
pera
ctiv
e,
frig
id h
aplic
G
loss
udal
fs
(0.5
m);
Loxl
ey
peat
Dys
ic,
frig
id T
ypic
H
aplo
sap
rists
(≤
7 m
)
Trig
o–
Exc
hequ
er
Ser
ies
loam
y,
mix
ed,
ther
mic
, sh
allo
w,
Typ
ic
Xer
orth
ents
/0.
1–0.
5 m
Wah
ee S
erie
s cl
ayey
, m
ixed
, th
erm
ic
Aer
ic
Och
-ra
quu
lts/
1.5
m
Long
-ter
m
mea
n pr
ecip
itatio
n (m
m)
412
1316
2010
b14
5875
023
0013
5078
071
513
70
Long
-ter
m
mea
n te
mpe
ratu
re
(°C
)
–3.0
10.7
12.9
b9.
31.
08.
45.
93.
414
.418
.3
Long
-ter
m
mea
n po
tent
ial
evap
otra
ns-
pira
tion
(P
ET
) (m
m)
466
(T
horn
th-
wai
te)c
660
(T
horn
th-
wai
te)c
1,01
3
(Ham
on)d
560
(pan
)e38
3
(Tho
rnth
- w
aite
)c
546
(T
horn
th-
wai
te)c
550
(T
horn
th-
wai
te)c
552
(Ham
on)d
753
(T
horn
th-
wai
te)c
967
(T
horn
th-
wai
te)c
Dry
ness
inde
x (D
I)1.
130.
500.
500.
380.
510.
240.
410.
711.
050.
71
Long
-ter
m
mea
n st
ream
flow
(m
m)
80 (
1978
–200
3)65
999
764
0
(195
1–19
90)b
337
1321
860
170
8428
0
Per
iod
of
stre
amflo
w
reco
rd
1969
–pre
sent
1962
–pre
sent
1936
–pre
sent
1951
–pre
sent
1943
–pre
sent
Nov
195
2–pr
esen
t19
57–p
rese
nt19
61–p
rese
nt19
38–1
960;
19
64–2
001;
20
13–p
rese
nt
1969
–198
1;
1989
–199
9;
2003
– pr
esen
t
Tab
le 1
4.1.
Con
tinue
d.

For personal use only. Please do not distribute. Hydrological Processes of Reference Watersheds in Experimental Forests, USA 223
Wat
ersh
ed
char
acte
ristic
s
Car
ibou
-Pok
er
(CP
CR
W),
A
lask
a
Cas
par
Cre
ek
(CC
EW
),
Cal
iforn
iaC
owee
ta (
CH
L),
Nor
th C
arol
ina
Fer
now
(F
nEF
),
Wes
t Virg
inia
Fras
er (
FrE
F),
C
olor
ado
H.J
. And
rew
s (H
JAE
F),
Ore
gon
Hub
bard
Bro
ok
(HB
EF
), N
ew
Ham
pshi
reM
arce
ll (M
EF
),
Min
neso
ta
San
Dim
as
(SD
EF
),
Cal
iforn
ia
San
tee
(S
EF
),
Sou
th
Car
olin
a
Sur
face
run
off/
flow
ge
nera
tion
Sat
urat
ion
ex
cess
flow
Infil
trat
ion-
exce
ss
over
land
flow
lim
ited
to
com
pact
ed
surf
aces
Rar
e su
rfac
e
runo
ff, d
irect
ch
anne
l and
fa
st s
hallo
w
subs
urfa
ce
flow
from
VS
Af
Min
imal
su
rfac
e
runo
ff
Rar
e, o
nly
durin
g sn
owm
elt
Min
imal
sur
face
ru
noff
– hi
gh
poro
sity
Min
imal
sur
face
ru
noff
Infil
tratio
n ex
cess
ov
er fr
ozen
&
satu
ratio
n ex
cess
flow
ov
er u
nfro
zen
soils
Rar
e hi
llslo
pe
flow
exc
ept
afte
r fir
e w
hen
infil
trat
ion
exce
ss fl
ow
Sat
urat
ion
ex
cess
flow
Sub
surf
ace
flo
w/
drai
nage
Sha
llow
su
bsur
face
flo
w
Tran
sien
t su
bsur
face
st
orm
flow
and
so
il pi
pe
pref
eren
tial f
low
Sha
llow
late
ral
flow
via
soi
ls
with
hig
h co
nduc
tivity
Late
ral
subs
urfa
ce
flow
to
chan
nel
Sha
llow
su
bsur
face
(m
acro
pore
s,
coar
se s
oils
) an
d gr
ound
-w
ater
Sha
llow
su
bsur
face
late
ral
flow
Late
ral
subs
urfa
ce
flow
Sha
llow
su
bsur
face
w
ith s
ome
seep
age
to a
n un
derly
ing
grou
ndw
ater
aq
uife
r
Gro
undw
ater
flo
w u
nkno
wn
but
pres
umab
ly
high
rat
e of
sh
allo
w la
tera
l flo
w
Sha
llow
la
tera
l su
bsur
face
flo
w w
ith
negl
igib
le
deep
se
epag
eA
vera
ge w
ater
ta
ble
dyna
mic
s/de
pth
(m)
Unk
now
n1–
8 m
>1.
5 m
exc
ept
near
str
eam
Unk
now
nU
nkno
wn
Unk
now
nV
aria
ble
wat
er
tabl
e de
pth
~0.
3 m
in th
e bo
g; 0
.5 m
in
upla
nds
Unk
now
n;
pote
ntia
lly
very
dee
p
Sha
llow
, 0.
9 m
Rip
aria
n ar
eas
for
hydr
olog
yN
one
1%Li
mite
d du
e to
st
eep
to
pogr
aphy
Lim
ited
due
to
stee
p to
pogr
aphy
Lim
ited
to
valle
ys, f
ens,
bo
gs
Lim
ited
Lim
ited
due
to
stee
p to
pogr
aphy
33%
of a
rea
is
a pe
atla
nd~
2 %
15%
are
a
Maj
or o
r ex
trem
e na
tura
l di
stur
banc
e
1967
Fai
rban
ks
Flo
odW
inds
torm
(1
995)
; la
ndsl
ide
(2
006)
Che
stnu
t blig
ht
(192
0s–1
930s
); dr
ough
t; hu
rric
anes
; he
mlo
ck w
ooly
ad
elgi
d (2
003–
pres
ent)
Che
stnu
t blig
ht;
hurr
ican
es;
win
dsto
rms;
S
uper
Sto
rm
San
dy (
2012
)
Pin
e ba
rk
beet
le
epid
emic
Non
e in
ref
eren
ceH
urric
ane
(1
938)
; ice
st
orm
(1
998)
Pea
tland
w
ildfir
e (1
864)
; po
tent
ial f
or
dere
cho,
to
rnad
os,
wild
fires
Wild
fire
Hur
rican
e H
ugo
(198
9)
Oth
er s
peci
fic
hydr
olog
ical
fe
atur
es
3% p
erm
afro
st
unde
rlain
Fog
inpu
t,
soil
pipe
sS
now
mel
t-
dom
inat
ed
hydr
olog
ical
re
gim
e
Dis
cont
inuo
us
dens
e pa
n
C h
oriz
on
Dra
inag
e fr
om
bog
dom
e an
d up
land
s; s
ome
deep
see
page
to
the
aqui
fer
Ext
rem
ely
high
le
vels
of
nitr
ate
from
ch
roni
c
air
pollu
tion
Com
pare
d w
ith
pre-
Hug
o,
flow
re
vers
al in
pa
ired
wat
ersh
eds
afte
r H
ugo
Key
pub
lica-
tion(
s) o
n fo
rest
hy
drol
ogic
al
proc
esse
s
Hau
gen
et a
l. (1
982)
; H
inzm
an
et a
l. (2
002)
Zie
mer
(19
98);
R
eid
and
Le
wis
(20
09)
Hew
lett
and
Hib
bert
(19
67);
Sw
ift e
t al.
(198
8)
Rei
nhar
t et a
l. (1
963)
; A
dam
s et
al.
(199
4)
Ale
xand
er e
t al.
(198
5);
Troe
ndle
and
K
ing
(198
5)
Rot
hach
er e
t al.
(196
7); P
ost a
nd
Jone
s (2
001)
Det
ty a
nd
McG
uire
(2
010b
); G
anno
n et
al.
(201
4)
Seb
esty
en e
t al.
(201
1); V
erry
et
al.
(201
1)
Rig
gan
et a
l. (1
985)
; M
eixn
er a
nd
Woh
lgem
uth
(200
3)
Har
der
et a
l. (2
007)
; Ja
yaka
ran
et
al.
(201
4)
Con
tinue
d

For personal use only. Please do not distribute.224 D.M. Amatya et al.
Wat
ersh
ed
char
acte
ristic
s
Car
ibou
-Pok
er
(CP
CR
W),
A
lask
a
Cas
par
Cre
ek
(CC
EW
),
Cal
iforn
iaC
owee
ta (
CH
L),
Nor
th C
arol
ina
Fer
now
(F
nEF
),
Wes
t Virg
inia
Fras
er (
FrE
F),
C
olor
ado
H.J
. And
rew
s (H
JAE
F),
Ore
gon
Hub
bard
Bro
ok
(HB
EF
), N
ew
Ham
pshi
reM
arce
ll (M
EF
),
Min
neso
ta
San
Dim
as
(SD
EF
),
Cal
iforn
ia
San
tee
(S
EF
),
Sou
th
Car
olin
a
For
est
expe
rimen
tal
wat
ersh
ed
cont
act
Jam
ie
Hol
lings
wor
thjh
ollin
gsw
orth
@al
aska
.edu
Eliz
abet
h K
eppe
ler
ekep
pele
r@fs
.fed.
us
Pet
er C
aldw
ell
pcal
dwel
l02@
fs.fe
d.us
Mar
y B
eth
Ada
ms
mba
dam
s@fs
.fed.
us
Kel
ly E
lder
keld
er@
fs.fe
d.us
She
rri J
ohns
onsh
errij
ohns
on@
fs.fe
d.us
John
Cam
pbel
ljlc
ampb
ell@
fs.fe
d.us
Ste
phen
S
ebes
tyen
sseb
esty
en@
fs.fe
d.us
Pet
e Woh
lgem
uth
pwoh
lgem
uth@
fs.fe
d.us
Dev
endr
a A
mat
yada
mat
ya@
fs.fe
d.us
Exp
erim
enta
l fo
rest
web
site
http
://w
ww
.lter
.ua
f.edu
/bn
z_cp
crw
.cfm
http
://w
ww
.fs.fe
d.us
/psw
/topi
cs/
wat
er/c
aspa
r
http
://w
ww
.srs
.fs.
usda
.gov
/co
wee
ta/
http
://w
ww
.nrs
.fs
.fed.
us/e
f/lo
catio
ns/w
v/fe
rnow
http
://w
ww
.fs.
usda
.gov
/efr
/fr
aser
http
://an
drew
sfor
est.
oreg
onst
ate.
edu
http
://w
ww
.hu
bbar
dbro
ok.
org
http
://w
ww
.nrs
.fs
.fed.
us/e
f/m
arce
ll/
http
://w
ww
.fs
.fed.
us/p
sw/
ef/s
an_d
imas
http
://w
ww
.sr
s.fs
.usd
a.go
v/ch
arle
ston
/sa
ntee
a am
sl =
abo
ve m
ean
sea
leve
l.b W
ater
yea
rs ta
ken
as s
tart
ing
in M
ay a
nd e
ndin
g in
Apr
il.c P
ET
est
imat
ed fr
om T
horn
thw
aite
(19
48)
met
hod
d PE
T e
stim
ated
from
Ham
on (
1963
) m
etho
d w
ith c
orre
ctio
ns.
e PE
T e
stim
ated
from
eva
pora
tion
pan
(Pat
ric a
nd G
osw
ami,
1968
).f V
SA
= V
aria
ble
Sou
rce
Are
a
Tab
le 1
4.1.
Con
tinue
d.

For personal use only. Please do not distribute. Hydrological Processes of Reference Watersheds in Experimental Forests, USA 225
flood modulation due to surface storage and/or highly permeable soils. If the lower end of a curve is flat, the watershed sustains baseflow during dry periods, through release from a stored water source (e.g. groundwater), whereas a steep slope indicates a tendency for streams to dry up due to seasonality in precipitation and/or evapotranspiration and relative lack of storage. Because FDCs depict these streamflow attributes, they are important for water resources plan-ning, especially for water uses that are influ-enced by extreme high and low flows. We also use the ratio of the 90th and 50th percentile daily flow (Q
90/Q50) as an index of baseflow to as-sess its pattern among the watersheds, with higher values representing relatively higher baseflow or more stable flow.
Long-term (>25 years) mean daily flows are averaged for each month to characterize seasonal variability within and among sites, which assists in identifying controlling factors that cannot otherwise be captured by FDCs. The dryness index (DI; ratio of mean annual potential evapotranspiration to precipitation) is used as an indicator of energy-limited (DI < 1) versus moisture-limited (DI > 1) watersheds (e.g. Creed et al., 2014). In the next section, we describe the setting and environmental fea-tures of each of the ten USDA-EFR reference watersheds evaluated. Key characteristics are compared in Table 14.1.
14.2 Site Description
14.2.1 Caribou-Poker Creek Research Watershed (CPCRW), reference
sub-watershed C2, Alaska
The CPCRW is located near Chatanika in in-terior Alaska (Fig. 14.1) and is representative of the northern boreal forest. The 520 ha C2 reference watershed is isolated and free of any human intervention. The vegetation in CPCRW is dominated by birch and aspen on the south-facing slopes and black spruce for-ests on the north- facing slopes. The climate is typically continental with warm summers and cold winters.
The CPCRW is unique among the water-sheds in this cross-site comparison because it
is underlain by discontinuous permafrost. The permafrost distribution within the water-shed exerts a strong influence over hydro-logical patterns (Jones and Rinehart, 2010). Studies show that as the areal extent of permafrost increases, peak discharge in-creases, baseflow decreases and response to precipitation events increases (Bolton et al., 2004). The C2 watershed was chosen as a ref-erence watershed because it is underlain by only about 3% permafrost compared with the adjacent C3 and C4 watersheds which are underlain by 53% and 19%, respectively.
Total mean precipitation in the C2 water-shed is 412 mm, with mean snowfall and rainfall being 130 mm and 280 mm, respect-ively (Bolton et al., 2004). Annual maximum snow depth averages 750 mm with a snow water equivalent of 110 mm. Of the total precipitation, nearly 20% becomes stream-flow while evapotranspiration makes up over 75% (Bolton et al., 2004). About 35% of the total precipitation falls as snow between Octo-ber and April. Snowfall peaks around January while rainfall peaks around July. The spatial distribution of rainfall amount is influenced by elevation.
The relatively flat FDC for the C2 watershed (Plates 11 and 12, Table 14.2) may be attributed to the relatively well-drained soils that allow in-filtration to deeper subsurface reservoirs. Runoff is generated only when the infiltration capacity is met. Streamflow in the watershed is generated by shallow subsurface storm runoff from permafrost-dominated areas, but steady ground-water baseflows with the highest Q
90/Q50 of all the sites (Table 14.2) are produced from perma-frost-free areas such as C2. Spring snowmelt is usually the major hydrological event of the year, although the annual peak flow usually occurs during summer rainstorm events, as the highest rainfall intensities are greater than the max-imum snowmelt rate on a daily timescale (Kane and Hinzman, 2004). It may be noted from Fig. 14.2 that the mean monthly streamflow of C2 is relatively even over the months of April through October. During winter the gauges are mostly frozen and any flow is hardly recorded, except for relatively warm temperatures. Al-though rainfall peaks around July, there is an in-crease in mean flow from July to September due to an increase in baseflow.

For personal use only. Please do not distribute.226 D.M. Amatya et al.
Table 14.2. Daily flow values for various percentage time exceedance of the flow at the ten study sites.
Watershed #/name/locationNo. of daily
records
Daily flow, Q (mm), for percentiles
0.1 1 5 10 25 50 75 90 95 Q90/Q50
C2/CPCRW/Alaska 4,058 3.5 2.3 1.6 1.2 0.78 0.51 0.32 0.22 0.17 0.43NF/CCEW/California 7,671 68.0 25.3 8.9 4.5 1.13 0.27 0.08 0.04 0.03 0.15WS18/CHL/North Carolina 27,482 22.6 11.8 7.0 5.5 3.70 2.04 1.06 0.62 0.47 0.30WS4/FnEF/West Virginia 21,430 34.6 15.4 6.8 4.4 2.00 0.78 0.14 0.02 0.00 0.026ESL/FrEF/Colorado 11,687 14.5 9.6 7.1 5.4 2.79 1.16 0.63 0.41 0.26 0.35WS02/HJAEF/Oregon 22,280 66.6 29.1 15.1 9.3 4.01 1.43 0.38 0.18 0.13 0.126WS3/HBEF/New Hampshire 20,181 51.4 24.2 9.8 5.5 2.33 0.92 0.31 0.06 0.03 0.067S2/MEF/Minnesota 19,723 14.1 5.7 2.4 1.3 0.30 0.02 0.00 0.00 0.00 0.00Bell 3/SDEF/Californa 18,518 30.8 4.7 1.0 0.4 0.12 0.01 0.00 0.00 0.00 0.00WS80/SEF/South Carolina 11,256 41.7 16.8 4.2 2.1 0.42 0.03 0.00 0.00 0.00 0.00
CPCRW = Caribou-Poker Creek Research Watershed; CCEW = Caspar Creek Experimental Watershed; CHL = Coweeta Hydrologic Laboratory; FnEF = Fernow Experimental Forest; FrEF = Fraser Experimental Forest; HJAEF = H.J. Andrews Experimental Forest; HBEF = Hubbard Brook Experimental Forest; MEF = Marcell Experimental Forest; SDEF = San Dimas Experimental Forest; SEF = Santee Experimental Forest.
Oct048
48
0
48
0
48
0
48
0
48
Q (
mm
/day
)
0
48
0
48
0
48
0
48 (A) HJAEF
(B) CCEW
(C) SDEF
(D) CHL
(E) FnEF
(F) SEF
(G) HBEF
(H) FrEF
(I) MEF
(J) CPCRW
0
Nov Dec Jan Feb Mar Apr May Jun Jul Aug Sep
Fig. 14.2. Monthly mean daily streamflow, Q, averaged over the record period for each month, arranged by climate and region. ‘+’ sign indicates standard deviation (SD) of daily flow by month. FrEF mean flow was estimated by regression of baseflow for November to May and SDs are not presented. Sample size was insufficient for flow at CPCRW for the months of November to May (HJAEF = H.J. Andrews Experimental Forest; CCEW = Caspar Creek Experimental Watershed; SDEF = San Dimas Experimental Forest; CHL = Coweeta Hydrologic Laboratory; FnEF = Fernow Experimental Forest; SEF = Santee Experimental Forest; HBEF = Hubbard Brook Experimental Forest; FrEF = Fraser Experimental Forest; MEF = Marcell Experimental Forest; CPCRW = Caribou-Poker Creek Research Watershed).

For personal use only. Please do not distribute. Hydrological Processes of Reference Watersheds in Experimental Forests, USA 227
14.2.2 Caspar Creek Experimental Watershed (CCEW), reference watershed
North Fork (NF), California
Located in a coast redwood and Douglas fir forest on the Jackson Demonstration State Forest in north-western California (Fig. 14.1), the CCEW hosts research designed to evaluate the effects of timber management on watershed processes. Initially, the entire 473 ha NF watershed served as the reference watershed, but after portions were logged in 1985, three NF sub-watersheds (16 to 39 ha) were designated as long-term ref-erence watersheds. Bedrock is marine sandstone and shale of the Franciscan Complex. Most soils are 1–2 m deep loams and clay-loams and under-lain by saprolite at depths of 3–8 m near ridgetops. Only about one-fifth of the 4.6 km/km2 drainage density supports perennial streamflow. Timber production has been the major land use, and evi-dence of 19th century logging and the impacts of this legacy persist.
Snow is hydrologically insignificant and 95% of rainfall occurs in October–April. Fog occurs on about one-third of days in June–September, reducing summer transpiration (Keppeler, 2007). The marine influence ensures that summer air temperatures rarely exceed 20°C and winter minimums seldom drop below 0°C.
Stream runoff is about half of the average annual rainfall (Reid and Lewis, 2009). Tran-spiration and canopy evaporation account for nearly equal portions of the remainder (Fig. 9.1, Chapter 9, this volume). Actual evapotrans-piration is limited by soil moisture deficits in May–September. Analysis of climate- related trends suggests that autumn rainfall and streamflow have declined, but with no change in annual totals.
The FDC for CCEW spans a wide range of streamflow compared with most of the other USDA- EFR sites (Plates 11 and 12) due to the strong sea-sonal pattern of large, episodic winter rain events that typically produce multiple, short-duration peak flows while extended summer droughts result in a long, slow recession for about half the year (Fig. 14.2). Summer streamflow is generated primarily from groundwater, and by autumn about 300 mm of precipitation is needed to mitigate moisture def-icits sufficiently to generate stormflow. Stormflow (total flow based on difference between initial discharge at start of runoff and the discharge at 3 days following the cessation of the rainfall event)
comprises about two-thirds of annual runoff (Reid and Lewis, 2009). Infiltration is rapid on uncom-pacted soils and vertical throughflow dominates near the surface. A deeper clay-rich argillic horizon can impede downward flow and generate lateral subsurface flow, although preferential flow through interconnected soil macropores limits pore- pressure increases and the extent of this perched flow. Perennial and intermittent soil pipes occur in the upper 2 m of the regolith and are frequently en-countered near channel heads. When transient groundwater tables rise to the elevation of these pipes, they rapidly transmit subsurface flow to channels, mitigating pore-pressure increases upslope (Keppeler and Brown, 1998). Saturation- excess overland (return) flow is limited, but can occur on valley bottoms during large storms.
14.2.3 Coweeta Hydrologic Laboratory (CHL), reference watershed WS18,
North Carolina
The CHL is located in western North Carolina (Fig. 14.1) and is representative of southern Ap-palachian mixed deciduous hardwoods. The 13 ha WS18 watershed was last selectively harvested in the early 1920s prior to the establishment of the CHL (Douglass and Hoover, 1988). Although the watershed has not been actively managed for more than 80 years, there have been several nat-ural disturbances that have altered forest struc-ture and species composition, including Chest-nut blight fungus (Endothia parasitica) in the 1920s–1930s, drought in the 1980s and 2000s, Hurricane Opal in 1995, and hemlock woolly adelgid (Adelges tsugae) defoliation from 2002 to the present (Boring et al., 2014).
Precipitation in WS18 averages 2010 mm/year; it is highest in the late winter months and lowest in the autumn, although a disproportion-ate amount of large events associated with trop-ical storms occurs during this season. Less than 10% of precipitation occurs as snow. The vari-ability in precipitation has been increasing over time resulting in more frequent extremely wet years and extremely dry years, while annual average air temperature has been increasing by 0.5°C/decade since 1981 (Laseter et al., 2012).
Annual precipitation in WS18 is approxi-mately equally partitioned into streamflow (49.6%) and evapotranspiration (50.4%). During the growing season, transpiration accounts for 55% of total

For personal use only. Please do not distribute.228 D.M. Amatya et al.
evapotranspiration with evaporation from canopy interception making up the balance, approximately 15% of precipitation (Ford et al., 2011). Streamflow is typically highest in March–April and lowest in September–October but never ceases, even during extreme drought. Seasonal patterns in streamflow reflect the combined effects of the seasonality in precipitation and evapotranspiration (Fig. 14.2).
Baseflows are relatively high, producing the third largest Q
90/Q50 ratio among sites (Table 14.2). Baseflows are sustained by lateral movement of water through deep unsaturated soil (Fig. 9.1, Chapter 9, this volume), driven by large hydraulic gradients induced by steep slopes (Hewlett and Hibbert, 1963). On average, approximately 5% of annual precipitation (9% of annual stream-flow) is discharged as stormflow (Swift et al., 1988). Stormflow originates primarily from small portions of the watershed located adjacent to the stream in coves and in riparian zones where the water table may be near the surface (Hewlett and Hibbert, 1967). Shallow lateral subsurface dis-charge from upslope landscape positions to streams can also contribute to stormflow where large soil macropores exist. Overland flow is extremely rare or non-existent because of the presence of well- developed forest floors and subsurface macropores.
14.2.4 Fernow Experimental Forest (FnEF), reference watershed WS4,
West Virginia
The FnEF is located in eastern West Virginia (Fig. 14.1) and is representative of the ‘unmanaged’ forests of the central Appalachian region. The 39 ha WS4 watershed is forested with an approxi-mately 100-year-old stand of mixed deciduous hardwoods. The bedrock is acidic sandstone and shale. Depth to bedrock is generally less than 1 m and the topography is steep.
Precipitation is distributed evenly through-out the year and averages 1458 mm. Although snow is common in winter, snowpack generally lasts no more than a few weeks; snow contributes approximately 14% on average of precipitation (Adams et al., 1994). Large rainfall events can occur during extra-tropical hurricanes in the summer and autumn, but about half of the lar-gest storms have occurred during the dormant season (1 November–30 April), when streams are most responsive to rainfall because evapotrans-piration losses are low (Fig. 14.2).
The stream channel is intermittent near the top of the watershed. Streamflow may cease dur-ing the late summer and early autumn (about 10% of daily flows), in response to high evapotranspira-tive demand and low precipitation. Although baseflow contributes relatively little to Q
90/Q50 (Table 14.2), it dominates stream discharge in WS4. Most discharge occurs during the dormant season (Fig. 14.2) due to greater precipitation and decreased evapotranspirative demand from de-ciduous forests. Baseflow is sustained by lateral subsurface flow to channels; DeWalle et al. (1997) characterized the mean transit time for baseflow on WS4 as 1.4–1.6 years, which suggests a domin-ance of slow movement through the soil matrix.
The water balance on WS4 was well quan-tified by Patric (1973) with runoff accounting for about 40% of precipitation, 27% of the bal-ance being lost through transpiration and about 16% to canopy evaporation. Seasonal differ-ences in losses from canopy interception due to leaf development and leaf drop were detected.
Stormflow discharge is fairly flashy (Plates 11 and 12), with the storm hydrograph respond-ing rapidly to storm precipitation inputs and then returning quickly to baseflow conditions, and streamflow generation occurs via satur-ation excess flow. Stormflow discharge typically occurs less than 15% of the time. There is little to no infiltration-excess overland flow even dur-ing the largest storms because of the high infil-tration capacity of an intact forest floor.
14.2.5 Fraser Experimental Forest (FrEF), reference watershed East
St Louis (ESL), Colorado
The FrEF is located in the Rocky Mountain cordil-lera of Colorado (Fig. 14.1) and is representative of subalpine watersheds over a large portion of the central Rockies. It spans the subalpine to alpine zone; a zone that is characterized by relatively low temperatures and moderate precipitation (Love, 1960). The area is dominated by Engelmann spruce and subalpine fir on higher- elevation and shaded slopes, lodgepole pine on lower-elevation sunny slopes and alpine tundra above the treeline. The 803 ha ESL watershed has received no signifi-cant treatment in over 90 years (Retzer, 1962).
Precipitation is dominated heavily by snow-fall (about 75%) from October through May (Alexander et al., 1985) and runoff is dominated

For personal use only. Please do not distribute. Hydrological Processes of Reference Watersheds in Experimental Forests, USA 229
by snowmelt (about 90%) from May through August (Fig. 14.2). Significant summertime convective rainfall events may also temporarily increase flow. The main stem is perennial but baseflow is low, stable and unmeasured during the winter months due to logistical difficulties of stream measurements in winter.
The runoff coefficient for annual flow is about 45% with significant wintertime sublim-ation losses from the canopy and summertime evapotranspiration. Summertime rainfall is pri-marily used on site by vegetation, with high evap-orative losses due to dry air masses and wind.
High-elevation stream reaches are inter-mittent with spring and summertime flows fed by snowmelt (Fig. 14.2). The hydrological re-gime is dominated by a typical seasonal snow-melt hydrograph with a rapid rising limb in May and June, followed by a long recession, returning to baseflow (second largest Q
90/Q50, Table 14.2) in August (Alexander et al., 1985; Troendle and King, 1985). Extensive spring networks feed the drainage systems as the annual snowmelt pulse moves through the basin (Retzer, 1962). Rain-fall events punctuate the snowmelt hydrograph, but contribute insignificant amounts to the an-nual runoff. Infiltration-excess overland flow is rare, but may occur under the snowpack during the melt season when frozen ground impedes in-filtration. Saturation-excess overland flow is ex-tremely rare as infiltration rates for the porous soils and glacial till typically exceed maximum rainfall and snowmelt rates (Retzer, 1962).
The ESL represents the highest elevation range, largest snowpack and largest watershed of this cross-site comparison. Maximum snow-melt rates are limited by incoming energy and can never reach extreme rainfall rates. Rain-on-snow flood events can alter flow statistics, but are rare in this portion of the Rockies. The rela-tively large size of the basin also reduces flashy response or high runoff per unit area observed in smaller basins.
14.2.6 H.J. Andrews Experimental Forest (HJAEF), reference watershed
WS02, Oregon
The HJAEF is located in the western Cascade Mountains of central Oregon (Fig. 14.1) and is representative of Pacific Northwest moist conifer forests. Watershed 2 (WS02) is 60 ha and the
geology is dominated by bedrock of volcanic ori-gin. Stream channels are steep and confined with unsorted sediment dominated by cobbles and boulders, with patches of silt and exposed bed-rock. Shallow hillslope soils (generally less than 1 m deep) are loam and clay loam. Stone content ranges from 35 to 80%, increasing on south- facing slopes. The steep hillslopes in WS02 are dominated by 500- to 550-year-old Douglas fir (Pseudotsuga mensiesii) forests with western hemlock (Tsuga het-erophylla) and western red cedar (Thuja plicata) (Rothacher et al., 1967). The canopy is greater than 60 m tall. The climate is continental with cold winters and cool, short, dry summers.
Annual precipitation averages 2300 mm, falling primarily as rain between November and April and with occasional snow at higher eleva-tions. Soil temperatures remain above freezing. The annual hydrograph in WS02 has a strong seasonal pattern with a high winter baseflow and frequent autumn, winter and spring stormflows in contrast to very low flows in summer (Fig. 14.3).
Approximately 57% of the precipitation is streamflow (Post and Jones, 2001). Baseflow ac-counts for only 43% of the discharge (Q
90/Q50 = 0.126) (Table 14.2) whereas quickflow comprises the remainder (Fig. 9.1, Chapter 9, this volume). McGuire et al. (2005) estimated that mean base-flow residence time for WS02, based on δO18 of water, was approximately 2.2 years. They suggested that topography and steepness may be exerting greater control on residence times than water-shed area. Although there are no detectable trends in streamflow from 1987 to 2007, in more recent time periods (1996–2007) slight decreasing trends have been observed (Argerich et al., 2013).
The relatively steep FDC for WS02 (Plates 11 and 12) has been attributed to highly perme-able soils and strong seasonal precipitation pat-terns. Fast percolation rates, typically greater than 0.12 m/h, are influenced by high stone content and large pore spaces (Rothacher et al., 1967). These characteristics also lead to sub-stantial hyporheic flows lateral to and beneath the streams (Kasahara and Wondzell, 2003).
14.2.7 Hubbard Brook Experimental Forest (HBEF), reference watershed W3,
New Hampshire
The HBEF is located in New Hampshire (Fig. 14.1) and is representative of mature northern

For personal use only. Please do not distribute.230 D.M. Amatya et al.
hardwood stands. Vegetation at W3 is composed mainly of sugar maple (Acer saccharum), Ameri-can beech (Fagus grandifolia) and yellow birch (Betula alleghaniensis). The 42 ha watershed is mostly second growth and much of the HBEF was harvested in the 1910s (Table 14.1). Additional salvage harvesting occurred at the HBEF follow-ing the Great New England Hurricane of 1938. More recently, trees incurred some damage dur-ing the North American Ice Storm of 1998, with no apparent impact on annual runoff.
The climate at the HBEF is cool and humid. On average, W3 receives 1350 mm of precipita-tion annually, which is distributed evenly through-out the year. Precipitation has increased by 25% during the record period, which is consistent with broader regional trends (Brown et al., 2010). Approximately one-third of precipitation falls as snow (Fig. 9.1, Chapter 9, this volume) and a snowpack generally persists from late December until mid-April. Soil frost forms during winter two out of every three years with an average annual maximum depth of 6 cm.
The annual hydrograph shows a strong seasonal pattern with a peak during snowmelt runoff. Despite the higher flow during spring, floods can occur at any time of year when soil water deficits are reduced (Fig. 14.2). An increas-ing trend in precipitation has resulted in increas-ing trends in the magnitude of both low and high streamflows (Campbell et al., 2011).
Approximately 64% of the precipitation that falls on the watershed becomes streamflow, with evapotranspiration comprising the remain-der. Slight, but statistically significant declines in evapotranspiration have occurred in W3 (14% over 56 years) for reasons that are unknown. This decline appears to be due to local influences since similar trends are not consistently found at a larger regional scale.
The relatively steep FCD for W3 (Plates 11 and 12) has traditionally been attributed to coarse, well-drained soils and mountainous topography that produce a flashy runoff response. Overland flow is also minimal because of the high infiltra-tion capacity of the forest floor. In recent years, a more complete understanding of complex flow generation processes at the site has emerged. Data from a network of wells in W3 have revealed an intermittent, discontinuous water table (Detty and McGuire, 2010a; Gannon et al., 2014; Gillin et al., 2015). Stormflow generation is the result
of lateral subsurface flow in the solum. Under some soil moisture conditions, small changes in groundwater can produce large changes in run-off, suggesting a threshold response that is re-lated to flowpaths and soil transmissivity (Detty and McGuire, 2010b; Gannon et al., 2014). Dur-ing low flows, only the near-stream zone is con-sistently hydrologically connected to the stream network. As the watershed wets up, more distal, previously isolated portions of the water table become hydrologically connected.
14.2.8 Marcell Experimental Forest (MEF), reference watershed S2,
Minnesota
The MEF is located along the southern fringe of the boreal biome, in northern Minnesota (Fig. 14.1). The landscape includes uplands, peatlands, lakes and streams. Unlike mountainous research water-sheds, streamflow typically is not bedrock con-trolled in the western lakes section where outwash sands, some >50 m deep, form large aquifers (Verry et al., 2011). Aquifer–peatland connectivity varies between two peatland types: bogs and fens (Bay, 1967). In watersheds with either type, streamflow may originate from precipitation and flow along near-surface and shallow surface flowpaths in upland mineral soils (Verry et al., 2011). Bog watersheds may be perched due to loamy clay tills that retard the vertical flow of water from soils to the outwash aquifer (Verry et al., 2011). In fen watersheds, most streamflow, which may exceed streamflow from bogs by orders of magnitude during low flow, originates as dis-charge from aquifers and is perennial (Bay, 1967).
The 10 ha S2 study watershed, with a bog (33% of the area), has low topographic relief (Table 14.1) with upland mineral soils that drain through peatland margins to an intermittent stream. Eleven to 33% of annual precipitation (456–981 mm) occurs as streamflow and 5–17% recharges the underlying aquifer (Nichols and Verry, 2001) (Fig. 9.1, Chapter 9, this volume). Calculated evapotranspiration (precipitation – streamflow – recharge) has been 372–605 mm/year. Nine of the ten highest daily streamflows have occurred during rainfall–runoff events, not snowmelt or rain-on-snow events. Periods of no streamflow occur during any month and there has been no flow during 38% of the

For personal use only. Please do not distribute. Hydrological Processes of Reference Watersheds in Experimental Forests, USA 231
record (Plates 11 and 12), consistent with the zero value of Q90/Q50 (Table 14.2).
Although most of the S2 area is uplands, most of the annual water budget (58%) comes from direct precipitation on the peatland (Ver-ry et al., 2011). If the water table is >5–10 cm below the peatland surface, streamflow ceases and that storage must be replenished before re-sumption. Rainfall amount during summer ex-ceeds snow water equivalents during winter and stormflows recess rapidly to no flow due to evapotranspiration. Melt from snow accumu-lation (November/December to March/April) results in several weeks of high flows (Sebestyen et al., 2011) (Fig. 14.2). Winter and spring frost in upland soils, exceeding 50 cm, prevents infiltration (Verry et al., 2011). Snow-melt waters flow overland until soils thaw in the spring, after which flow mostly occurs in the shallow subsurface through sandy loams above loamy clay horizons (Verry et al., 2011). Subsurface flow may persist for weeks until the upland deciduous forest begins transpiring. During large summer rainfall events, subsur-face flow may last for several hours, but rarely longer.
14.2.9 San Dimas Experimental Forest (SDEF), reference watershed Bell 3,
California
The 25 ha watershed at SDEF is located in south-ern California (Fig. 14.1) and is representative of the chaparral forests of the US Southwest. Chap-arral forest is a dense, drought-tolerant shrub-land with a closed canopy some 3–5 m in height. Chaparral is a fire-prone ecosystem and wildfires have burned the SDEF about every 40 years.
Regional hydrology is controlled by climate and geology: cool, wet winters followed by long summer droughts; and ongoing tectonic uplift that has produced steep topography and ex-posed fractured crystalline basement rocks that weather to thin, coarse-textured, azonal soils (Dunn et al., 1988) (Table 14.1). Precipitation falls almost exclusively as rain from winter frontal storms and rare summer thunderstorms. Nearly 90% of the annual rainfall occurs be-tween December and April with the most runoff in February (Fig. 14.2).
Streamflow accounts for only roughly 11% of the rainfall, with the remainder appor-tioned to evapotranspiration and groundwater recharge. Groundwater dynamics on the SDEF are virtually unknown, rendering the closure of any water balance exercise moot. However, ground water recharge is potentially large through the fractured substrate, reducing any calculated value of actual evapotranspiration. Soil moisture is at or below the wilting point by the end of the summer and the drought-adapt-ed plants likely get their water from fractures in the bedrock.
Stream runoff is generated by saturation excess flow in riparian zones, presumably as shallow throughflow moves laterally through the coarse soil mantle (Fig. 9.1, Chapter 9, this volume). Infiltration-excess overland flow on hillside slopes is rare and occurs only during the most intense rainstorms, reflecting the high infiltration rates of the soil and percola-tion into bedrock. However, after wildfire, with the combustion of the canopy and surface lit-ter layer as well as changes in soil properties (bulk density and water repellency), hillslope hydrology shifts to pervasive overland flow after saturation of the very thin surface wet-table layer (Rice, 1974; DeBano, 1981). Water that formerly slowly flowed by subsurface pathways now moves quickly into the stream channels, increasing runoff for comparable storms by up to four orders of magnitude over pre-fire levels (Wohlgemuth, 2016). The effects of fire on the forest hydrology can persist for several years.
14.2.10 Santee Experimental Forest (SEF), reference watershed WS80,
South Carolina
The SEF is located in eastern South Carolina (Fig. 14.1) and is representative of the subtrop-ical coastal watersheds throughout much of the US Southeast, with hot and humid summers and moderate winter seasons. The 155 ha WS80 watershed is covered with a pine/mixed hard-wood forest (Table 14.1), which has been undis-turbed by management activities since 1936, but was heavily affected by Hurricane Hugo in 1989 that damaged >80% of the forest canopy (Hook et al., 1991).
For personal use only. Please do not distribute.232 D.M. Amatya et al.
Seasonally, the winter is generally wet with low-intensity, long-duration rain events and rare snowfall. Summer is characterized by short-duration, high-intensity storm events and tropical depression storms are common. The seasonal runoff response to rain events is shown in Fig. 14.2.
Approximately 22%, on average, of annual precipitation becomes runoff (Amatya et al., 2006), resulting in about 78% evapotranspiration, assuming negligible seepage (Fig. 9.1, Chapter 9, this volume). Approximately 60% of the runoff is contributed by shallow surface or runoff/rainwater, the rest by subsurface flow (Epps et al., 2013).
Based on the FDC analysis this watershed produces flow only 56.3% of the time and hence has a zero value of Q
90/Q50 (Plates 11 and 12, Table 14.2). The principal flow generation mech-anism is driven by the shallow water table (Fig. 9.1, Chapter 9, this volume) (Harder et al., 2007; Epps et al., 2013), controlled primarily by rain-fall and evapotranspiration, and minimally by deeper groundwater underlain by Santee Lime-stone approximately 20 m below the ground surface. The formation of an argillic horizon with poorly drained clayey subsoil provides a dynamic shallow groundwater table that has a complex non-linear relationship with stream-flow (Harder et al., 2007). Saturation-excess surface and shallow subsurface runoff with rapid lateral transfers within the highly perme-able upper soil layer may occur along reaches with flat topography. Surface depressional stor-age was shown to affect the surface runoff rate (Amoah et al., 2012). Runoff and peak flow at this watershed are dependent on both rainfall amount and intensity, as well as antecedent conditions reflected by initial water table posi-tions (Epps et al., 2013).
A key observation from WS80 is the rever-sal of the flow relationship between this and the treatment watershed, compared with the earlier calibration period, for a decade beginning three years after Hurricane Hugo severely damaged vegetation on both watersheds. As a result re-duced evapotranspiration in selected hurricane- affected vegetation on the reference watershed enhanced its streamflow (Jayakaran et al., 2014). Long-term data also indicate rising air tempera-ture and increasing frequency of large storms (Dai et al., 2013).
14.3 Discussion of Hydrological Processes
14.3.1 Flow duration curves
FrEF and CPCRW host the largest reference watersheds among our study sites (Table 14.1). FrEF has the highest elevation range, deepest snowpack and the largest drainage area. These factors, combined with the snowmelt-driven hydrological regime, explain the somewhat dif-ferent behaviour in flow duration with higher flow values for FrEF than for CPCRW (Plates 11 and 12, Table 14.2). The muted high flows, with their greater influence at CPCRW potentially due to its relatively well-drained soil conditions (see Section 14.2.1 above), are most likely attributed to the large size of these watersheds. However, this does not hold true for CCEW which, al-though comparable in size to CPCRW (Table 14.1), has a steep FDC for low exceedance, perhaps due to its much larger seasonal precipitation, deep clay horizon and soil pipes that contribute to a rapid runoff response (see Section 14.2.2 above).
In comparison, SDEF has the second small-est reference watershed and forth steepest watershed examined (Table 14.1). As a result, its FDC shows very flashy storm responses followed by long, declining flows that eventually are zero for 47.5% of the record. Similarly, MEF, charac-terized by deep peat and possibly high storage capacity, and SEF with shallow sandy clay loam soils generate no surface flow for 44% of their periods of record, with Q
90/Q50 = 0 for all three sites (Table 14.2). Although SEF is the lowest gradient watershed, the high flow range that oc-curs for less than 1% of the time is greater than at most of the other sites, except for HBEF, HJAEF and CCEW. The highest flows at this site result from storm runoff from saturated clay-rich soils (Epps et al., 2013; Griffin et al., 2014).
Along the Coast Range of the western USA, HJAEF and CCEW have FDCs that are similar in shape, likely related to seasonal climatic patterns. The HJAEF has the third steepest basin slope after CHL and CCEW (Table 14.1) but the highest FDC slope for low flows occurring more than 0.2 to 30% of the time, above which the CHL has the highest low flow (Plates 11 and 12). Although WS02 at HJAEF is smaller than the watershed at CCEW (Table 14.1), it generally sustains higher
For personal use only. Please do not distribute. Hydrological Processes of Reference Watersheds in Experimental Forests, USA 233
flows, except at the lowest exceedance frequen-cies, likely because it receives 1.75 times more precipitation than the CCEW. Both of these west-ern watersheds have similar forest species and leaf area index (LAI) (Table 14.1) as well as fre-quent large storms in winter and dry summers. Weiler and McDonnell (2004) suggest additional factors including lateral soil conductivity and drainable porosity may explain variability in streamflow response, specifically at HJAEF.
CHL has the steepest basin slope (52%) of all the watersheds in this analysis and a 95th percentile flow (Q
95) of 0.47 mm/day, which is the largest of all the sites (Table 14.2). Of the three sites in the Appalachian Mountains (i.e. CHL, FnEF and HBEF), CHL also has the smallest drainage area and is more southerly than FnEF and HBEF (Table 14.1). Interestingly, this refer-ence watershed also has the highest Q90/Q50 val-ues (indicative of sustained baseflow) and lowest flow values for the higher flow ranges (Q0.1 or lower exceedance) but has equal or higher flows at and above Q25 compared with FnEF or HBEF (Table 14.2). The higher flow in the lower ex-ceedance range in the more northern HBEF site could be partially attributed to snowmelt and the higher flow in lower exceedance range at the CHL site is likely due to sustained baseflows caused by high storage of deep soils (Table 14.1).
Although on opposite coasts, the 61 ha HJAEF site yields consistently higher percentile flows (Table 14.2) compared with the 42.4 ha HBEF site at almost the same latitude, similar elevations, potential evapotranspiration, and surface and subsurface flow generation mechan-isms (Table 14.1). The exception is the extreme high end of discharges at or below 0.01% ex-ceedance when both exhibit a similar pattern (Plates 11 and 12), which is attributed to the HJAEF having higher slope and 41% higher pre-cipitation than the HBEF. In their analysis of threshold hydrological response across northern catchments, Ali et al. (2015) found some simi-larities in rainfall- and snowmelt-driven events between these two watersheds.
14.3.2 Long-term mean daily flow
Figure 14.2 (plots A–C) shows long-term mean daily flow by month for west-coast watersheds which all have strongly seasonal rainfall.
Oregon’s HJAEF (plot A) has the greatest monthly flows, with a longer winter rainy sea-son than the more southerly sites. In California, coastal CCEW (plot B) reflects the transition from the wetter north-west to the arid Mediter-ranean climate of SDEF (plot C). These three western sites show highly variable winter flow patterns due to the episodic nature of the Pacific frontal systems with increased coefficient of variation further south where large winter storms are less frequent. These patterns are also consistent with the relative variability defined by the upper and lower exceedance percentiles of the FDCs (Plates 11 and 12, Table 14.2).
Similarly, the east-coast watersheds in Fig. 14.2 (plots D–G) range from high mean flow in the winter to low flow in the summer and early autumn, with the exception of HBEF (plot G). CHL (plot D) shows a smooth annual hydrograph that peaks in late spring following the seasonal rainfall pattern. FnEF (plot E) and SEF (plot F) have similar mean annual precipitation, but the SEF produces less than half of the runoff gener-ated at FnEF, primarily due to higher potential evapotranspiration (Table 14.1). The seasonal signal for the FnEF and CHL reflects their inland locations and a more pronounced dormant sea-son relative to SEF. Both CHL and FnEF show rela-tively little streamflow variability due to relatively consistent precipitation with little variance. The relatively high streamflow variability at the SEF results from a dynamic water table regulated by coastal climate and shallow clayey argillic hori-zon. HBEF (plot G) is well north of the other east-coast basins, putting it in a location where snow plays a greater role in the hydrological regime. It is the only watershed in the study that shows a significant double peak in annual flow: a rainfall peak in November and a snowmelt or rain-on-snow peak in April.
Snowmelt and continentality have a dom-inant influence on annual water budgets in the last three study areas: FrEF (plot H), MEF (plot I) and CPCRW (plot J) (Fig. 14.2). FrEF receives most of its precipitation in the form of winter-time snow. The CPCRW (plot J) represents an ex-treme in almost every metric used (Table 14.1) including the annual precipitation and runoff. All of the snowmelt-dominated watersheds show lower relative variance in flow because the peak flows are regulated by both the amount of snow and the maximum amount of energy

For personal use only. Please do not distribute.234 D.M. Amatya et al.
available to melt snow, with the occasional ex-ception at the MEF where some peak flows occur during rain-on-snow events. In general, higher mean monthly flows are observed in basins close to coastal moisture sources or at lower latitudes, although there are exceptions (SDEF, SEF). Higher variances are also observed near coasts, where large, episodic rainfall events are more in-fluential. Snowmelt processes reduce variance (FrEF, MEF and CPCRW), while inland water-sheds also exhibit less variability in daily mean flows (FnEF and CHL).
14.3.3 Other watershed characteristics affecting hydrology
Data from these ten sites show that none of the parameters in Table 14.1 (temperature, potential evapotranspiration, drainage area, altitude, lati-tude) has a significant influence on annual stream flow, except for annual precipitation, which is found to be a strong driver (R2 = 0.85), as expected. However, annual evapotranspiration, calculated as the difference between precipitation and streamflow (i.e. not considering groundwater recharge), correlates well (R2 = 0.72) with an in-dependent estimate of potential evapotranspir-ation, and also with temperature (R2 = 0.76) and latitude (inversely, R2 = 0.53), as expected. An-other interesting finding is that sites (CPCRW, MEF, SDEF and SEF) with DI values higher than 0.71 closer to soil moisture limited have a much lower (0.12–0.22) average runoff coefficient (streamflow/precipitation) than the remaining energy- limited sites (0.44–0.64) which have a DI < 0.50 (Table 14.1). Although most of the site characteristics for the HBEF and HJAEF are simi-lar, except for precipitation which is higher at the HJAEF, the streamflow as a percentage of precipi-tation for the HJAEF is actually lower than that of the HBEF. This is possibly due to the higher evapo-transpiration of its conifer forest, with its LAI al-most twice that of the northern hardwood forest at the HBEF site. However, other factors such as geology and lithology besides the evapotranspir-ation might also be influencing losses. FrEF re-ceives similar precipitation to SDEF and MEF, but has two to four times the annual streamflow be-cause of much lower potential evapotranspir-ation as well as runoff occurring in a relatively steep basin, over a concentrated period, when a significant portion of the vegetation is dormant.
However, some seepage to a regional aquifer at the MEF and possible groundwater recharge at the SDEF are also factors in their lower flow.
14.3.4 Implications of hydrological processes
Improved understanding of runoff generation and flowpaths helps land managers identify hydrologically connected areas that contribute to streamflow and pollutant discharge. The syn-thesis of runoff patterns across sites (Plates 11 and 12, Fig. 14.2) is important for identifying relationships between streamflow and nutrients that aid in developing load duration curves used to establish water quality standards (Argerich et al., 2013). This important information is being used to assess the impacts of forest disturbance and restoration projects, and will help to better predict hydrological and chemical responses and transport. For example, monitoring procedures developed at the CCEW site are widely used to as-sess sediment and pollutant loads. This informa-tion is helpful in evaluating potential timber harvest impacts and in the development of forest management regulations and best management practices (Cafferata and Reid, 2013).
Knowledge of processes derived using long-term records from these diverse watersheds (Table 14.1) enables scientists to better under-stand their interrelationships with climate, forest vegetation and water use, and ecosystem dynam-ics (Vose et al., 2012). For example, intensively monitored plots at CHL are providing new insights into relationships between soil moisture, carbon and nitrogen cycling, and vegetation allocation processes along topographic gradients. Further-more, these records are being used to study hydrological recovery from disturbances such as the catastrophic mountain pine bark beetle in-festation at FrEF, extreme hurricanes at SEF and historic land use at CCEW.
14.4 Summary
This cross-site comparison has used long- term hydrometeorological patterns, basin hy-dromorphological parameters and other attri-butes (Table 14.1) to compare and contrast forest hydrological processes (Fig. 9.1, Chapter 9, this volume) at ten reference watersheds in

For personal use only. Please do not distribute. Hydrological Processes of Reference Watersheds in Experimental Forests, USA 235
the USDA-EFR network. The response of stream-flow to variation in annual precipitation magni-tude, form and seasonality, and evapotranspir-ation at each watershed was evaluated by using daily FDCs (Plates 11 and 12), as well as the long- term mean daily flow for each month (Fig. 14.2).
Statistical results (Plates 11 and 12, Fig. 14.2 and Table 14.2) in the context of key watershed variables (Table 14.1) show that these water-sheds have distinct hydrological processes and, therefore, can help frame our conceptual under-standing of forest runoff processes (Fig. 9.1, Chap-ter 9, this volume), with precipitation as a driving variable for both high and low flows. While some seasonal flow patterns were observed among sites along the eastern and western near-coastal areas, flowpaths of rain and snowmelt water were shown to vary greatly across and within reference watersheds, potentially affecting the timing and peak of storm runoff, as illustrated by the FDCs (Plates 11 and 12, Table 14.2) and long-term monthly mean daily flows (Fig. 14.3). A DI value of about 0.50–0.70 was found to be an approximate break range for identifying sites with high runoff or low runoff, relative to the precipitation received. The analysis also revealed that larger watersheds do not necessarily yield higher baseflows and damped high flows. In add-ition, the presence of an argillic horizon, large topographic depressions and riparian area, pref-erential flowpaths, pipeflow, steep slopes and cer-tain soil physical properties also significantly af-fect flowpaths, the magnitude and variation of runoff generation, and possibly the water bal-ance (Weiler and McDonnell, 2004; Griffin et al., 2014; Gillin et al., 2015; Klaus et al., 2015). Fur-thermore, the results also demonstrate that a bet-ter hydrological understanding of low topo-graphic relief sites such as MEF and SEF is needed because these areas are common but not well rep-resented by EFR sites, which are mostly in moun-tainous terrain.
Although this comparative study helps ad-vance our understanding of runoff generation mechanisms across these diverse watersheds, in-creased evidence in recent years supports a non- linear rainfall–runoff response both on hillslopes and low-gradient coastal landscapes, highlight-ing the need to better quantify hydrological thresholds and understand physical controls (Spence, 2010; la Torre Torres et al., 2011; Epps et al., 2013; Ali et al., 2015; Klaus et al., 2015). Research on linkages between hydrology and
soil development (e.g. Gillin et al., 2015), peat-land watershed responses to environmental and climatic change (Kolka et al., 2011), rainfall–runoff relationships in chaparral vegetation, interactive effects of vegetation and stand type on streamflow (Jayakaran et al., 2014), hydro-logical processes on tidally affected riparian forested wetlands (Czwartacki, 2013), etc. is advancing in some of these watersheds. Incorp-oration of this new information into ecohydro-logical models (Dai et al., 2010; Amatya and Jha, 2011) will improve predictions of runoff gener-ation and our ability to assess responses to fu-ture disturbances.
Long-term data from this spectrum of watersheds demonstrate the value of the USDA- EFR network for studies of a variety of hydrological processes and their interactions in different en-vironments, which is not possible at individual sites or using short-term studies. This variability across sites will also be critical in future studies for process-level, statistical and modelling re-search relating to impacts, vulnerability and risk assessments of climate and land-use change, and forest disturbance on hydrology, biogeochem-istry and water supply. These reference water-sheds also continue to be important for use in paired watershed studies to evaluate effects of disturbances such as forest harvesting, prescribed burning, devegetation, changes in forest struc-ture and species composition, fertilization and other land management practices on water yield, evapotranspiration, flowpath routing, nu-trient cycling and sediment transport. Indeed, the research is being used to chart long-term ef-fects and the data collected have been essential for cross-site syntheses (e.g. Kolka et al., 2011; Jones et al., 2012; Creed et al., 2014; Gottfried et al., 2014; Vose et al., 2014). However, additional studies are also warranted to examine consist-ency of these long-term data and results from the reference watersheds used in various hydro-logical analyses herein and elsewhere for their potential deviation, if any, due to unforeseen ex-ternal factors including climate change (Alila et al., 2009; Ali et al., 2015).
Therefore, there is a critical need for con-tinued monitoring of these long-term water-sheds, as they are well suited for documenting and detailing baseline hydrological conditions and also serve as valuable benchmarks for ad-dressing emerging forest and water issues of the 21st century.

For personal use only. Please do not distribute.236 D.M. Amatya et al.
References
Adams, M.B., Kochenderfer, J.N., Wood, F., Angradi, T.R. and Edwards, P.J. (1994) Forty Years of Hydrome-teorological Data from the Fernow Experimental Forest. General Technical Report NE-184. USDA Forest Service, Northeastern Forest Experiment Station, Radnor, Pennsylvania.
Alexander, R., Troendle, C., Kaufmann, M., Shepperd, W., Crouch, G. and Watkins, R. (1985) The Fraser Experimental Forest, Colorado: Research Program and Published Research 1937–1985. General Technical Report GTR-RM-118. USDA Forest Service, Rocky Mountain Research Station, Fort Collins, Colorado.
Ali, G., Tetzlaff, D., McDonnell, J.J., Soulsby, C., Carey, S., Laudon, H., McGuire, K., Buttle, J., Seibert, J. and Shanley, J. (2015) Comparison of threshold hydrologic response across northern catchments. Hydrological Processes 29, 3575–3591.
Alila, Y.P., Kuras, K., Schnorbus, M. and Hudson, R. (2009) Forests and floods: a new paradigm sheds light on age-old controversies. Water Resources Research 45, W08416, doi: 10.1029/2008WR007207 ( accessed 9 April 2016).
Amatya, D.M. and Jha, M.K. (2011) Evaluating SWAT model for a low gradient forested watershed in coastal South Carolina. Transactions of the ASABE 54, 2151–2163.
Amatya, D.M., Miwa, M., Harrison, C.A., Trettin, C.C. and Sun, G. (2006) Hydrology and Water Quality of Two First Order Forested Watersheds in Coastal South Carolina. ASABE Paper #06-2182. American Society of Agricultural and Biological Engineers, St Joseph, Michigan.
Amoah, J., Amatya, D.M. and Nnaji, S. (2012) Quantifying watershed depression storage: determination and application in a hydrologic model. Hydrological Processes 27, 2401–2413.
Argerich, A., Johnson, S.L., Sebestyen, S.D., Rhoades, C.C., Greathouse, E., Knoepp, J.D., Adams, M.B., Likens, G.E., Campbell, J.L. and McDowell, W.H. (2013) Trends in stream nitrogen concentrations for forested reference catchments across the USA. Environmental Research Letters 8, 014039.
Arora, V.K. and Boer, G.J. (2001) Effects of simulated climate change on the hydrology of major river basins. Journal of Geophysical Research 106, 3335–3348.
Bay, R.R. (1967) Ground water and vegetation in two peat bogs in northern Minnesota. Ecology 48, 308–310.Bolton, W.R., Hinzman, L.D. and Yoshikawa, K. (2004) Water balance dynamics of three small catchments
in a sub-Arctic boreal forest. In: Kane, D.L. and Yang, D. (eds) Northern Research Basins Water Bal-ance (Proceedings of a workshop held Victoria, BC, 15–19 March 2004). IAHS Publication No. 290. International Association of Hydrological Sciences, Wallingford, UK, pp. 213–223.
Boring, L.R., Elliott, K.J. and Swank, W.T. (2014) Successional forest dynamics 30 years following clearcut-ting. In: Swank, W.T. and Webster, J.R. (eds) Long-Term Response of a Forest Watershed Ecosystem. Clearcutting in the Southern Appalachians. Oxford University Press, New York, pp. 11–35.
Bosch, J.M. and Hewlett, J.D. (1982) A review of catchment experiments to determine the effect of vegeta-tion changes on water yield and evapotranspiration. Journal of Hydrology 55, 3–23.
Brown, A.E., Zhang, L., McMahon, T.A., Western, A.W. and Vertessy, R.A. (2005) A review of paired catch-ment studies for determining changes in water yield resulting from alterations in vegetation. Journal of Hydrology 310, 28–61.
Brown, P.J., Bradley, R.S. and Keimig, F.T. (2010) Changes in extreme climate indices for the northeastern US, 1870–2005. Journal of Climate 23, 6555–6572.
Cafferata, P.H. and Reid, L.M. (2013) Application of Long-term Watershed Research to Forest Management in California: 50 Years of learning from Caspar Creek Experimental Watersheds. California Forestry Re-port No. 5. State of California Natural Resources Agency, Department of Forestry and Fire Protection, Sacramento, California.
Campbell, J.L., Driscoll, C.T., Pourmokhtarian, A. and Hayhoe, K. (2011) Streamflow responses to past and projected future changes in climate at the Hubbard Brook Experimental Forest, New Hampshire, USA. Water Resources Research 47, W02514, doi:10.1029/2010WR009438 (accessed 9 April 2016).
Creed, I.F., Spargo, A.T., Jones, J.A., Buttle, J.M., Adams, M.B., Beall, F.D., Booth, E.G., Campbell, J.L., Clow, D., Elder, K., Green, M.B., et al. (2014) Changing forest water yields in response to climate warming: results from long-term experimental watershed sites across North America. Global Change Biology 20, 3191–3208.
Czwartacki, B.J. (2013) Time and tide: understanding the water dynamics in a tidal freshwater forested wet-land. MSc. thesis, College of Charleston, Charleston, South Carolina.
Dai, Z., Li, C., Trettin, C.C., Sun, G., Amatya, D.M. and Li, H (2010) Bi-criteria evaluation of the MIKE SHE model for a forested watershed on the South Carolina coastal plain. Hydrology and Earth System Science 14, 1033–1046.
For personal use only. Please do not distribute. Hydrological Processes of Reference Watersheds in Experimental Forests, USA 237
Dai, Z., Trettin, C.C. and Amatya, D.M. (2013) Effects of Climate Variability on Forest Hydrology and Carbon Sequestration on the Santee Experimental Forest in Coastal South Carolina. General Technical Report SRS-172. USDA Forest Service, Southern Research Station, Asheville, North Carolina.
DeBano, L.F. (1981) Water Repellent Soils: A State-of-the-Art. General Technical Report PSW-46. USDA Forest Service, Pacific Southwest Forest and Range Experiment Station, Berkeley, California.
Detty, J.M. and McGuire, K.J. (2010a) Topographic controls on shallow groundwater dynamics: implications of hydrologic connectivity between hillslopes and riparian zones in a till mantled catchment. Hydro-logical Processes 24, 2222–2236.
Detty, J.M. and McGuire, K.J. (2010b) Threshold changes in storm runoff generation at a till mantled head-water catchment. Water Resources Research 46, W07525, doi: 10.1029/2009WR008102 (accessed 9 April 2016).
DeWalle, D.R., Edwards, P.J., Swistock, B.R., Aravena, R. and Drimmie, R.J. (1997) Seasonal iso-tope hydrology of three of three Appalachian forest catchments. Hydrological Processes 11, 1895–1906.
Douglass, J.E. and Hoover, M.D. (1988) History of Coweeta. In: Swank, W.T. and Crossley, D.A. (eds) Forest Hydrology and Ecology at Coweeta. Ecological Studies Vol. 66. Springer, New York, pp. 17–31.
Dunn, P.H., Barro, S.C., Wells, W.G. II, Poth, M.A., Wohlgemuth, P.M. and Colver, C.G. (1988) The San Di-mas Experimental Forest: 50 Years of Research. General Technical Report PSW-105. USDA Forest Service, Pacific Southwest Forest and Range Experiment Station, Berkeley, California.
Epps, T., Hitchcock, D., Jayakaran, A.D., Loflin, D., Williams, T.M. and Amatya, D.M. (2013) Characterization of storm flow dynamics of headwater streams in the South Carolina lower coastal plain. Journal of the American Water Resources Association 49, 76–89.
Ford, C.R., Hubbard, R.M. and Vose, J.M. (2011) Quantifying structural and physiological controls on vari-ation in canopy transpiration among planted pine and hardwood species in the southern Appalachians. Ecohydrology 4, 183–195.
Gannon, J.P., Bailey, S.W. and McGuire, K.J. (2014) Organizing groundwater regimes and response thresholds by soils: a framework for understanding runoff generation in a headwater catchment. Water Resources Research 50, 8403–8419.
Gillin, C.P., Bailey, S.W., McGuire, K.J. and Gannon, J.P. (2015) Mapping of hydropedologic spatial patterns in a steep headwater catchment. Soil Science Society of America Journal 79, 440–453.
Gottfried, G.J., Ffolliott, P.F., Brooks, K.N., Kolka, R.K., Raish, C.B. and Neary, D.G. (2014) Contributions of studies on experimental forests to hydrology and watershed management. In: Hayes, D. (ed.) Long-Term Research on Experimental Forests and Ranges. USDA Forest Service, Washington, DC, pp. 387–403.
Griffin, M.P., Callahan, T.J., Vulava, V.M. and Williams, T.M. (2014) Storm-event flow pathways in lower coastal plain forested watersheds of the southeastern United States. Water Resources Research 50, 8365–8280.
Hamon, W.R. (1963) Computation of direct runoff amounts from storm rainfall. International Association of Scientific Hydrology Publication 63, 52–62.
Harder, S.V., Amatya, D.M., Callahan, T.J., Trettin, C.C. and Hakkila, J. (2007) A hydrologic budget of a first-order forested watershed, coastal South Carolina. Journal of the American Water Resources Association 43(3), 1–13.
Haugen, R.K., Slaughter, C.W., Howe, K.E. and Dingman, S.L. (1982) Hydrology and Climatology of the Caribou-Poker Creeks Research Watershed, Alaska. CRREL Report 82-26. US Army Corps of Engineers, Washington, DC.
Hinzman, L.D., Nobuyoshi, I., Yoshikawa, K., Bolton, W.R. and Petrone, K.C. (2002) Hydrologic studies in Caribou-Poker Creeks Research Watershed in support of long term ecological research. Eurasian Journal Forest Research 5(2), 67–71.
Hewlett, J.D. and Hibbert, A.R. (1963) Moisture and energy conditions within a sloping soil mass during drainage. Journal of Geophysical Research 68, 1081–1087.
Hewlett, J.D. and Hibbert, A.R. (1967) Factors affecting the response of small watersheds to precipitation in humid areas. In: Sopper, W.E. and Lull, H.W. (eds) Forest Hydrology. Pergamon Press, New York, pp. 275–291.
Hook, D.D., Buford, M.A. and Williams, T.M. (1991) Impact of Hurricane Hugo on the South Carolina coastal pine forest. Journal of Coastal Research (SI-8), 291–300.
Jayakaran, A., Williams, T.M., Ssegane, H.S., Amatya, D.M., Song, B. and Trettin, C. (2014) Hurricane im-pacts on a pair of coastal forested watersheds: implications of selective hurricane damage to forest structure and streamflow dynamics. Hydrology and Earth System Science 18, 1151–1164.

For personal use only. Please do not distribute.238 D.M. Amatya et al.
Jones, J.A., Achterman, G.L., Augustine, LA., Creed, I.F., Ffolliott, P.F., MacDonald, L. and Wemple, B.C. (2009) Hydrologic effects of a changing forested landscape – challenges for the hydrological sciences. Hydrological Processes 23, 2699–2704.
Jones, J.A., Creed, I.F., Hatcher, K.L., Warren, R.J., Adams, M.B., Benson, M.H., Boose, E., Brown, W.A., Campbell, J.L., Covich, A., et al. (2012) Ecosystem processes and human influences regulate stream-flow response to climate change at long-term ecological research sites. BioScience 62, 390–404.
Jones, J.B. and Rinehart, A.J. (2010) The long term response of stream flow to climatic warming in head-water streams of interior Alaska. Canadian Journal of Forest Research 40, 1210–1218.
Kane, D.L. and Hinzman, L.D. (2004) Monitoring extreme environments: arctic hydrology in transition. Water Resources Impact 6, 24–27.
Kasahara, T. and Wondzell, S.M. (2003) Geomorphic controls on hyporheic exchange flow in mountain streams. Water Resources Research 39, 1005, doi: 10.1029/2002WR001386 (accessed 10 April 2016).
Keppeler, E. (2007) Effects of Timber Harvest on Fog Drip and Streamflow, Caspar Creek Experimental Watersheds, Mendocino County, California. General Technical Report PSW GTR-194. USDA Forest Service, Pacific Southwest Research Station, Albany, California, pp. 85–93.
Keppeler, E.T. and Brown, D. (1998) Subsurface Drainage Processes and Management Impacts. General Technical Report PSW GTR-168. USDA Forest Service, Pacific Southwest Research Station, Albany, California, pp. 25–34.
Klaus, J., McDonnell, J.J., Jackson, C.R., Du, E. and Griffiths, N.A. (2015) Where does streamwater come from in low-relief forested watersheds? A dual-isotope approach. Hydrology and Earth System Science 19, 125–135.
Kolka, R.K., Sebestyen, S.D. and Bradford, J.H. (2011) An evolving research agenda of the Marcell Experimental Forest. In: Kolka, R.K., Sebestyen, S.D., Verry, E.S. and Brooks, K.N. (eds) Peatland Biogeochemistry and Watershed Hydrology at the Marcell Experimental Forest. CRC Press, Boca Raton, Florida, pp. 73–91.
Laseter, S.H., Ford, C.R., Vose, J.M. and Swift, L.W. (2012) Long-term temperature and precipitation trends at the Coweeta Hydrologic Laboratory, Otto, North Carolina, USA. Hydrology Research 43, 890–901.
La Torre Torres, I., Amatya, D.M., Callahan, T.J. and Sun, G. (2011) Seasonal rainfall–runoff relationships in a lowland forested watershed in the southeastern USA. Hydrological Processes 25, 2032–2045.
Love, L. (1960) The Fraser Experimental Forest … Its Work and Aims. Station Paper No. 8. USDA Forest Service, Rocky Forest and Range Experiment Station, Fort Collins, Colorado.
McGuire, K.J., McDonnell, J.J., Weiler, M., Kendall, C., McGlynn, B.L., Welker, J.M. and Seibert, J. (2005) The role of topography on catchment-scale water residence time. Water Resources Research 41, W05002, doi: 10.1029/2004WR003657 (accessed 10 April 2016).
Meixner, T. and Wohlgemuth, P.M. (2003) Climate variability, fire, vegetation recovery, and watershed hy-drology. In: Renard, K.G., McElroy, S.A., Gburek, W.J., Canfield, H.E. and Scott, R.L. (eds) The First Interagency Conference on Research in the Watersheds, October 27–30, 2003, Benson, Arizona. US Department of Agriculture, Agricultural Research Service, Washington, DC, pp. 651–656.
Nichols, D.S. and Verry, E.S. (2001) Stream flow and ground water recharge from small forested watersheds in north central Minnesota. Journal of Hydrology 245, 89–103.
Patric, J.H. (1973) Deforestation Effects on Soil Moisture, Streamflow, and Water Balance in the Central Appalachians. Research Paper No. NE-259. USDA Forest Service, Northeastern Forest Experiment Station, Upper Darby, Pennsylvania.
Patric, J.H. and Goswami, N. (1968) Evaporation pan studies – forest research at Parsons. West Virginia Agriculture and Forestry 1(4), 6–10.
Peel, M.C., Finlayson, B.A. and McMahon, T.A. (2007) Updated world map of the Köppen–Geiger climate classification. Hydrology and Earth System Science 11, 1633–1644.
Post, D.A. and Jones, J.A. (2001) Hydrologic regimes of forested, mountainous, headwater basins in New Hampshire, North Carolina, Oregon, and Puerto Rico. Advances in Water Resources 24, 1195–1210.
Reid, L.M. and Lewis, J. (2009) Rates, timing, and mechanisms of rainfall interception loss in a coastal red-wood forest. Journal of Hydrology 375, 459–470.
Reinhart, K.G., Eschner, A.R. and Trimble, G.R. (1963) Effect on Streamflow of Four Forest Practices in the Mountains of West Virginia. Research Paper No. NE-1. USDA Forest Service, Northeastern Forest Experiment Station, Upper Darby, Pennsylvania.
Retzer, J. (1962) Soil Survey: Fraser Alpine Area, Colorado. Soil Survey Series 1956, No. 20. USDA Forest Service, Soil Conservation Service, Colorado Agricultural Experiment Station, Washington, DC.
Rice, R.M. (1974) The hydrology of chaparral watersheds. In: Rosenthal, M. (ed.) Proceedings of the Sympo-sium on Living with the Chaparral, March 30–31, 1973, Riverside, California. Sierra Club, San Francisco, California, pp. 27–34.

For personal use only. Please do not distribute. Hydrological Processes of Reference Watersheds in Experimental Forests, USA 239
Riggan, P.J., Lockwood, R.N. and Lopez, E.N. (1985) Deposition and processing of airborne nitrogen pol-lutants in Mediterranean-type ecosystems in southern California. Environmental Science and Technology 19, 781–789.
Rothacher, J., Dyrness, C.T. and Fredriksen, R.L. (1967) Hydrologic and Related Characteristics of Three Small Watersheds in the Oregon Cascades. USDA Forest Service, Pacific Northwest Forest and Range Experiment Station, Portland, Oregon. Available at: http://andrewsforest.oregonstate.edu/pubs/pdf/pub344.pdf (accessed 14 April 2016).
Searcy, J.K. (1959) Flow-duration curves. In: Manual of Hydrology: Part 2: Low-Flow Techniques. US Geo-logical Survey Water-Supply Paper 1542-A. US Government Printing Office, Washington, DC.
Sebestyen, S.D., Dorrance, C., Olson, D.M., Verry, E.S., Kolka, R.K., Elling, A.E. and Kyllander, R. (2011) Long-term monitoring sites and trends at the Marcell Experimental Forest. In: Kolka, R.K., Sebestyen, S.D., Verry, E.S. and Brooks, K.N. (eds) Peatland Biogeochemistry and Watershed Hydrology at the Marcell Experimental Forest. CRC Press, Boca Raton, Florida, pp. 15–71.
Spence, C. (2010) A paradigm shift in hydrology: storage thresholds across scales influence catchment runoff generation. Geography Compass 47, 819–833.
Sun, G., McNulty, S.G., Amatya, D.M., Skaggs, R.W., Swift, L.W. Jr, Shepard, J.P. and Riekerk, H. (2002) A comparison of the watershed hydrology of coastal forested wetlands and the mountainous uplands in the southern US. Journal of Hydrology 263, 92–104.
Swift, L.W., Cunningham, G.B. and Douglass, J.E. (1988) Climate and hydrology. In: Swank, W.T. and Crossley, D.A. (eds) Forest Hydrology and Ecology at Coweeta. Ecological Studies Vol. 66. Springer, New York, pp. 35–55.
Thornthwaite, C.W. (1948) An approach toward a rational classification of climate. The Geographical Review 38, 55–94.
Troendle, C. and King, R. (1985) The effect of timber harvest on the Fool Creek watershed, 30 years later. Water Resources Research 21, 1915–1922.
Verry, E.S., Brooks, K.N., Nichols, D.S., Ferris, D.R. and Sebestyen, S.D. (2011) Watershed hydrology. In: Kolka, R.K., Sebestyen, S.D., Verry, E.S. and Brooks, K.N. (eds) Peatland Biogeochemistry and Water-shed Hydrology at the Marcell Experimental Forest. CRC Press, Boca Raton, Florida, pp. 193–212.
Vogel, R.M. and Fennessey, N.M. (1995) Flow duration curves II: a review of applications in water resources planning. Journal of the American Water Resources Association 31, 1029–1039.
Vose, J.M., Ford, C.R., Laseter, S.H., Dymond, S.F., Sun, G., Adams, M.B., Sebestyen, S.D., Campbell, J.L., Luce, C., Amatya, D.M., et al. (2012) Can forest watershed management mitigate climate change ef-fects on water resources? In: Webb, A.A., Bonell, M., Bren, L., Lane, P.J.N., McGuire, D., Neary, D.J., Nettles, J., Scott, D.F., Stednick, J. and Wang, Y. (eds) Revisiting Experimental Catchment Studies in Forest Hydrology (Proceedings of a Workshop held during the XXV IUGG General Assembly in Melbourne, June–July 2011). IAHS Publication No. 353. International Association of Hydrological Sciences, Wallingford, UK, pp. 12–25.
Vose, J.M., Swank, W.T., Adams, M.B., Amatya, D., Campbell, J., Johnson, S., Swanson, F.J., Kolka, R., Lugo, A., Musselman, R. and Rhoades, C. (2014) The role of experimental forests and ranges in the development of ecosystem science and biogeochemical cycling research. In: Hayes, D. (ed.) Long-Term Research on Experimental Forests and Ranges. USDA Forest Service, Washington, DC, pp. 387–403.
Weiler, M. and McDonnell, J. (2004) Virtual experiments: a new approach for improving process conceptu-alization in hillslope hydrology. Journal of Hydrology 285, 3–18.
Wohlgemuth, P.M. (2016) Long-term hydrologic research on the San Dimas Experimental Forest: lessons learned and future directions. In: Stringer, C.E., Krauss, K.W. and Latimer, J.S. (eds) Headwaters to Estuaries: Advances in Watershed Science and Management – Proceedings of the Fifth Interagency Conference on Research in the Watersheds, March 2–5, 2015, North Charleston, South Carolina. e-General Technical Report SRS-211. USDA Forest Service, Southern Research Station, Asheville, North Carolina, pp. 227–232.
Zegre, N. (2008) The history and advancement of change detection methods in forest hydrology. In: Society of American Foresters Water Resources Working Group Newsletter. Society of American Foresters, Bethesda, Maryland.
Ziemer, R.R. (1998) Stormflow response to roadbuilding and partial cutting in small streams of northern California. Water Resources Research 17, 907–917.