Embed Size (px)
Citation preview
社会的環境管理能力の形成と国際協力拠点研究会社会的環境管理能力の形成と国際協力拠点研究会
砂漠化対策のアセスメント手法と指標化砂漠化対策のアセスメント手法と指標化
地球環境戦略研究機関地球環境戦略研究機関 小林正典小林正典
平成17年7月14日平成17年7月14日広島大学国際開発研究科広島大学国際開発研究科
砂漠化:人為的要因
人口増加 経済発展
食料・エネルギー需要の増大
過耕作Over-cultivation
過放牧Over-grazing
森林伐採Deforestation
塩性水灌漑Saline Water Irrigation
汚染Contamination
植生破壊、植生回復力(Resilience)の低下、土壌肥沃度(Fertility)の低下、塩害、有機物の消失
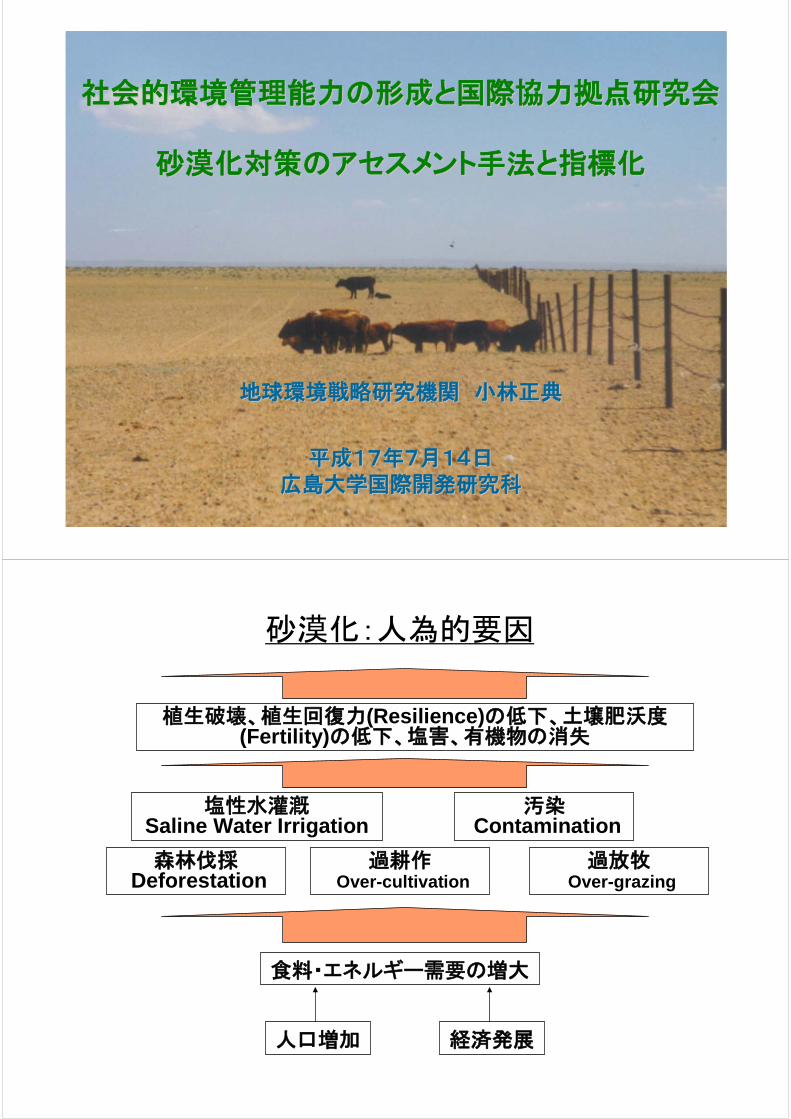
砂漠化の影響
砂漠化
農業生産性の低下 燃料材源の喪失
食糧不足・飢饉
炭素排出
森林伐採、過耕作、過放牧、塩性水灌漑、汚染
生物生息地の消滅
生態系の保水機能の低下
農村の困窮、貧困問題の悪化、健康被害、気象・気候変動の悪影響、都市・先進国への人口移動、社会の不安定化
生物多様性の喪失
防風林の消滅
化石燃料の利用拡大
水循環の不安定化
風力・黄砂の増大
温暖化促進
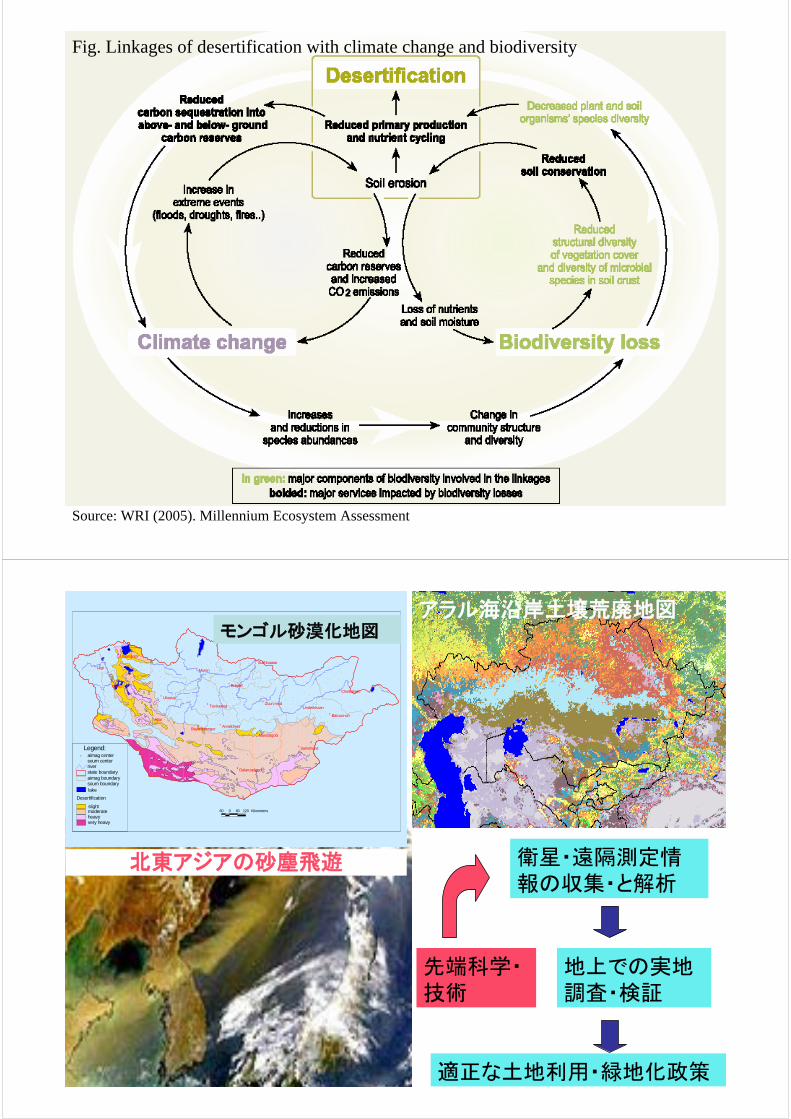
Source: WRI (2005). Millennium Ecosystem Assessment
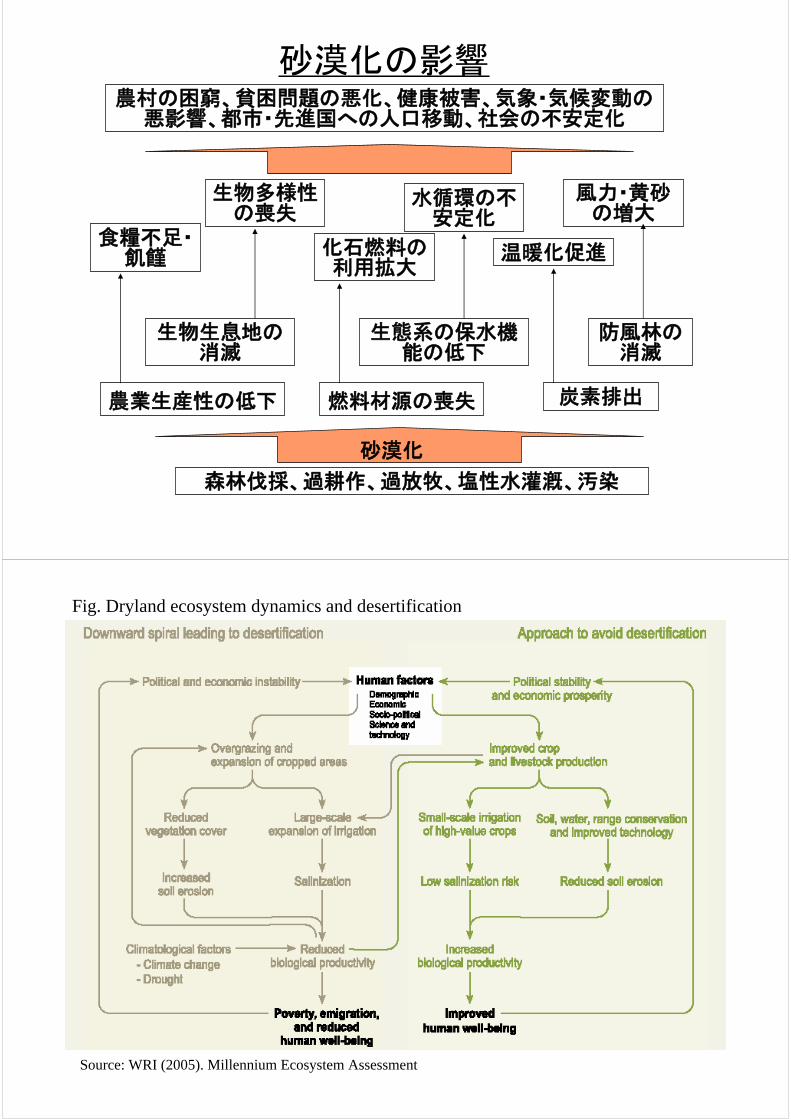
Fig. Dryland ecosystem dynamics and desertification
Source: WRI (2005). Millennium Ecosystem Assessment
Fig. Linkages of desertification with climate change and biodiversity
北東アジアの砂塵飛遊
アラル海沿岸土壌荒廃地図
衛星・遠隔測定情報の収集・と解析
地上での実地調査・検証
適正な土地利用・緑地化政策
先端科学・技術
#
##
#
#
##
#
#
#
#
###
#
#
#
#
#
##
#
#
#
#
#
#
#
#
##
#
#
#
#
#
#
#
#
#
#
# #
#
#
#
#
#
#
##
#
#
#
#
#
#
#
#
#
#
#
##
#
#
#
#
#
#
##
#
#
# ##
#
#
#
#
#
#
#
##
#
#
#
##
#
#
#
#
#
#
###
##
#
#
#
#
#
#
#
##
#
#
#
#
#
##
#
#
#
#
#
#
#
#
#
#
#
#
#
#
#
#
#
#
##
#
#
#
#
#
# #
#
#
##
#
#
#
#
# #
#
#
#
#
#
##
#
# #
#
#
#
#
#
#
#
#
#
#
#
#
#
#
#
#
#
# #
#
#
# #
#
#
#
#
#
#
#
##
#
##
#
# #
#
#
#
#
#
#
#
#
#
#
#
#
##
#
#
#
##
#
#
# #
##
#
#
#
#
#
##
#
#
# #
#
#
#
#
#
#
#
#
#
#
#
#
#
#
#
#
#
#
##
#
#
#
#
#
#
##
#
#
#
#
#
#
#
#
#
###
#
#
#
#
#
#
#
#
#
#
# #
#
#
#
##
##
#
## ##
#
#
##
#
#
#
#
#
#
#
#
#
#
#
#
#
#
#
#
#
#
#
##
#
#
#
#
##
#
#
#
#
#
#
#
#
#
#
#
#
#
#
#
#
#
#
#
#
#
Ulaangom
Khovd
Uliastai
Altai
Muren
Bayankhongor
Tsetserleg
Arvaikheer
Dalanzadgad
Mandalgobi
Sainshand
Baruun-urt
Choibalsan
UnderkhaanZuun mod
Sukhbaatar
Bulgan
Ulgii
Desertification
slightmoderateheavyvery heavy
soum boundaryaimag boundarystate boundaryriver
# soum center# aimag center
lake
Legend:
DESERTIFICATION MAP
60 0 60 120 Kilometers
モンゴル砂漠化地図
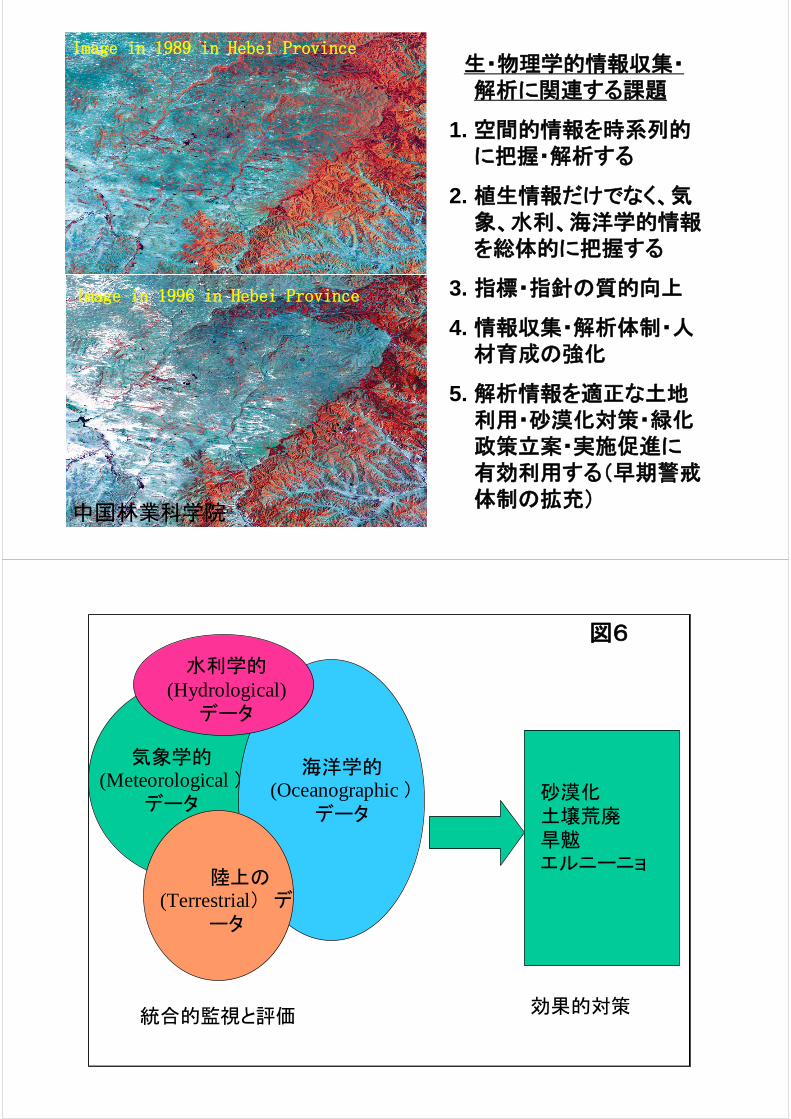
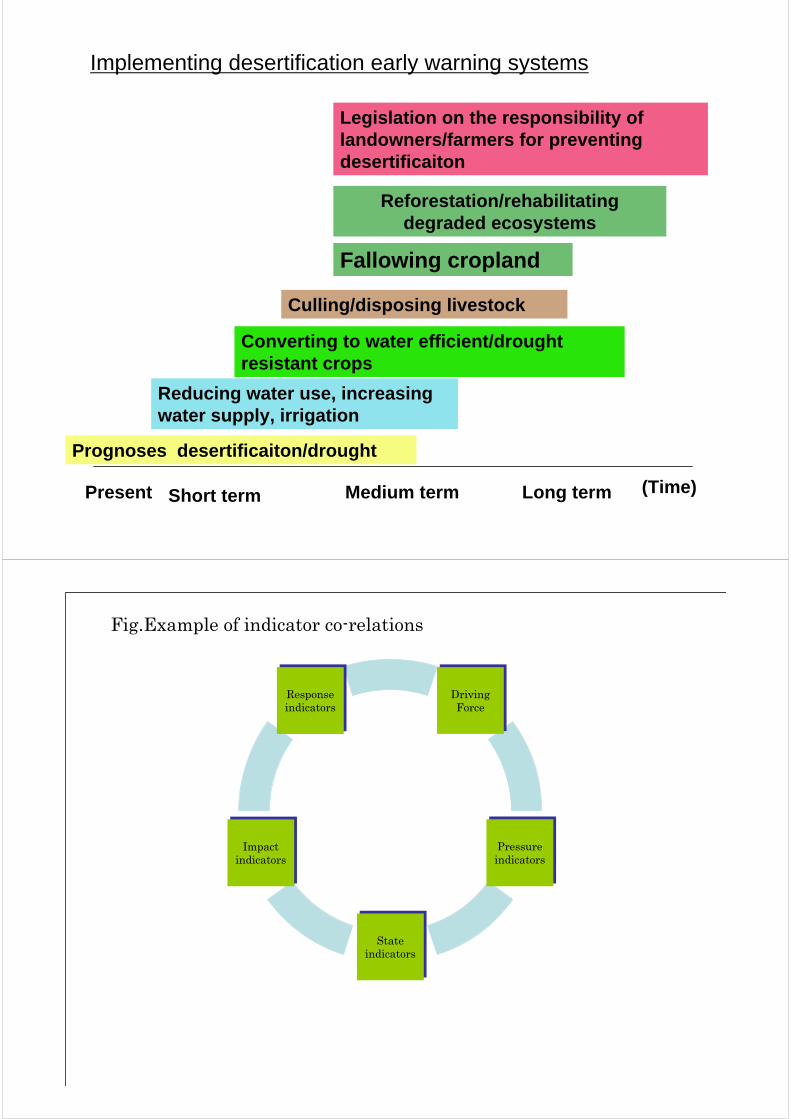
Image in 1989 in Hebei Province
Image in 1996 in Hebei Province
中国林業科学院
生・物理学的情報収集・解析に関連する課題
1. 空間的情報を時系列的に把握・解析する
2. 植生情報だけでなく、気象、水利、海洋学的情報を総体的に把握する
3. 指標・指針の質的向上
4. 情報収集・解析体制・人材育成の強化
5. 解析情報を適正な土地利用・砂漠化対策・緑化政策立案・実施促進に有効利用する(早期警戒体制の拡充)
気象学的(Meteorological )
データ
海洋学的(Oceanographic )
データ
陸上の(Terrestrial) デ
ータ
統合的監視と評価 効果的対策
砂漠化土壌荒廃旱魃エルニーニョ
水利学的(Hydrological)
データ
図6
Present Short term Medium term Long term (Time)
Implementing desertification early warning systems
Prognoses desertificaiton/drought
Reducing water use, increasing water supply, irrigation
Converting to water efficient/drought resistant crops
Culling/disposing livestock
Fallowing cropland
Legislation on the responsibility of landowners/farmers for preventing desertificaiton
Reforestation/rehabilitating degraded ecosystems
Driving Force
Driving Force
Impact indicatorsImpact
indicators
Response indicatorsResponse indicators
State indicators
State indicators
Pressure indicatorsPressure indicators
Fig.Example of indicator co-relations
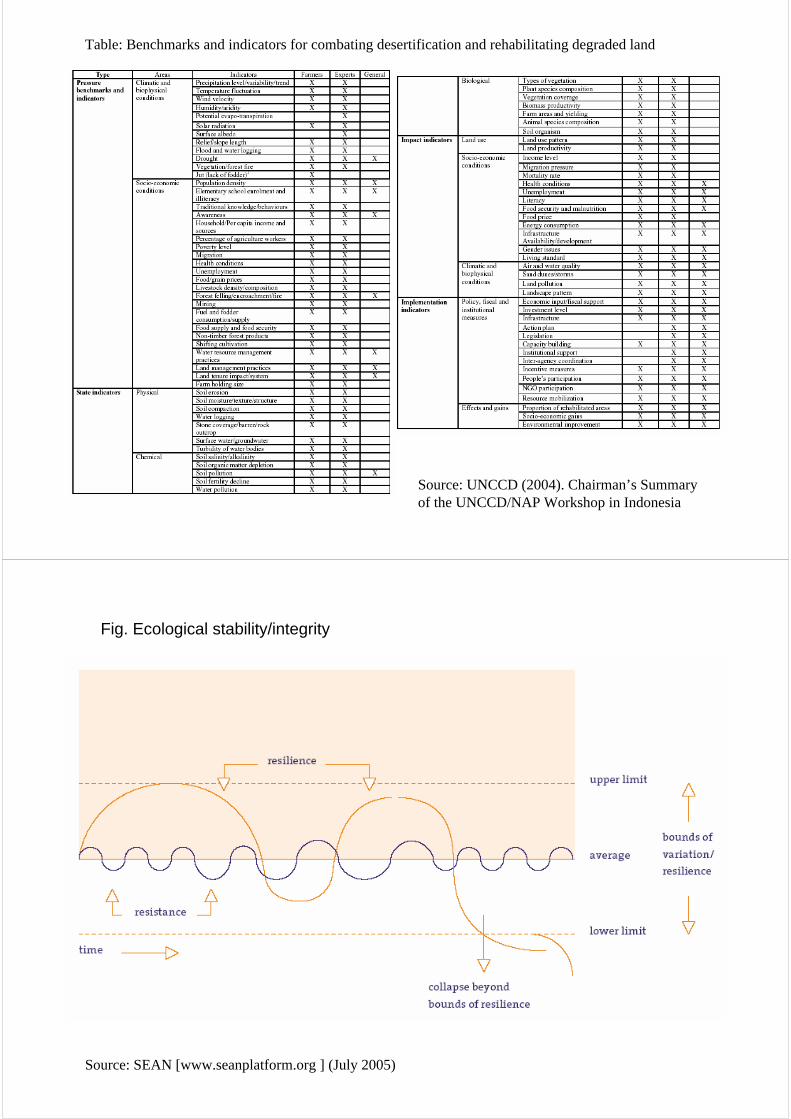
Table: Benchmarks and indicators for combating desertification and rehabilitating degraded land
Source: UNCCD (2004). Chairman’s Summary of the UNCCD/NAP Workshop in Indonesia
Fig. Ecological stability/integrity
Source: SEAN [www.seanplatform.org ] (July 2005)
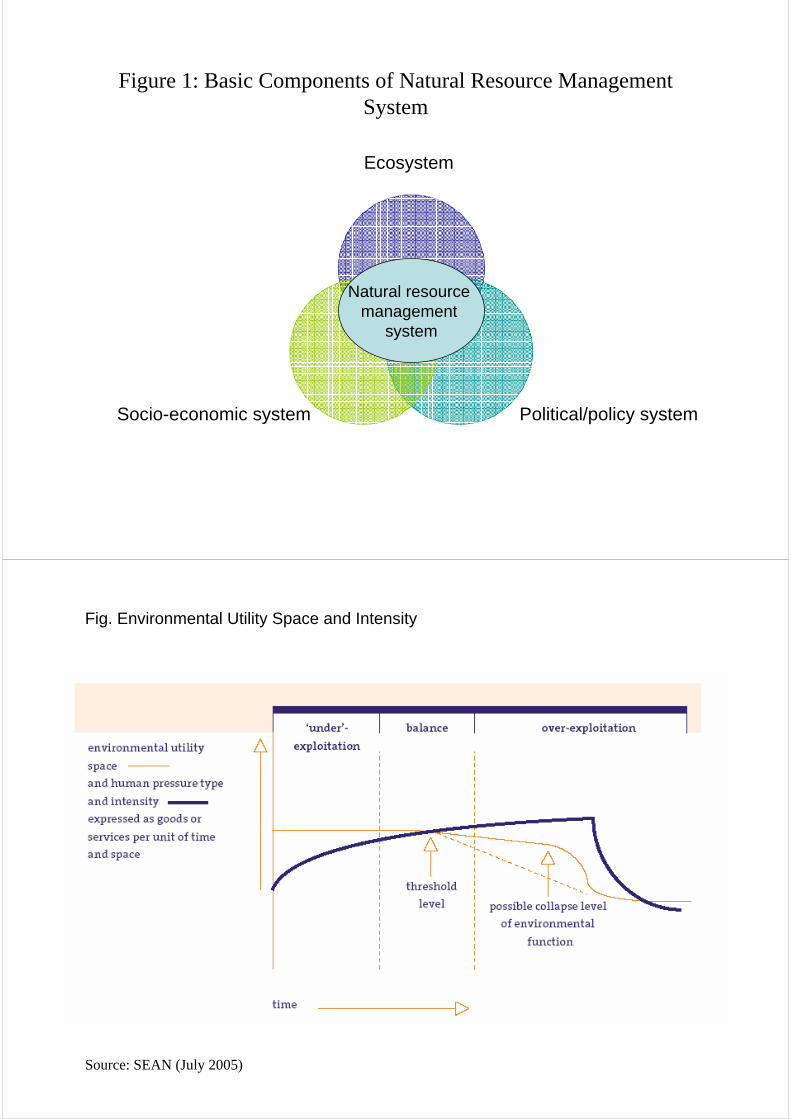
Figure 1: Basic Components of Natural Resource Management System
Ecosystem
Political/policy systemSocio-economic system
Natural resource management
system
Source: SEAN (July 2005)
Fig. Environmental Utility Space and Intensity
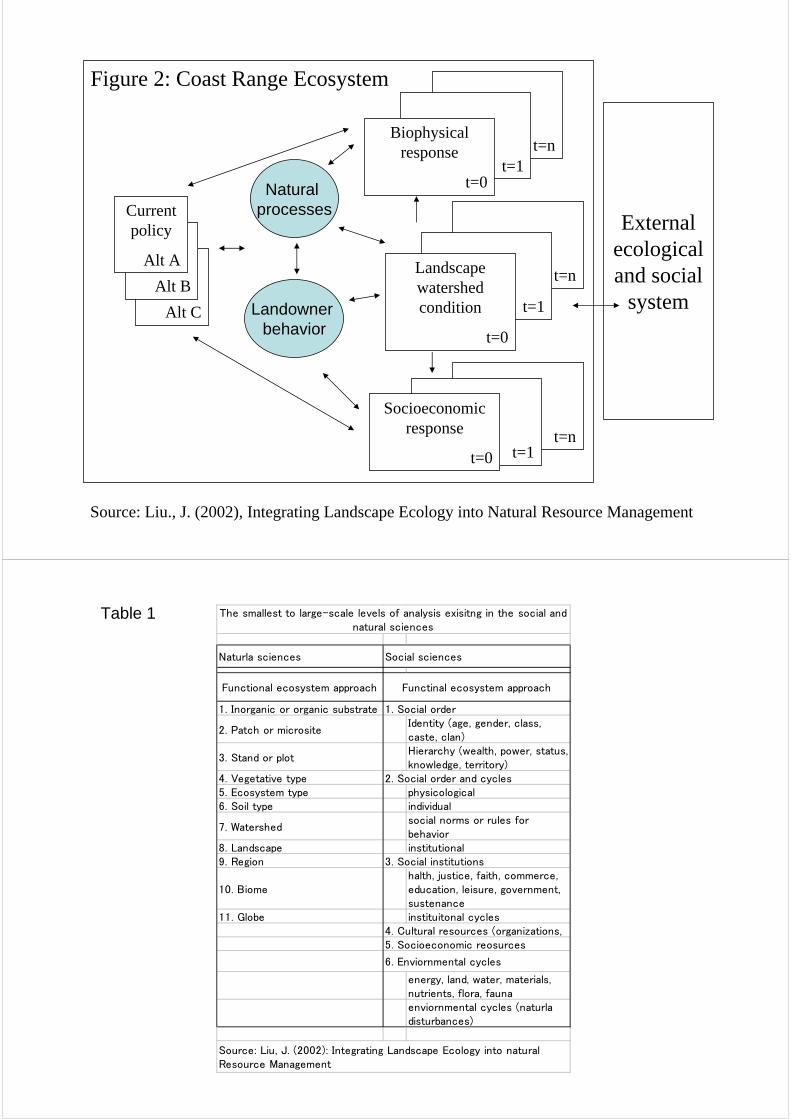
External ecological and social
system
Figure 2: Coast Range Ecosystem
Current policy
Alt C
Current policy
Alt B
Current policy
Alt A
Natural processes
Landowner behavior
t=nt=1
Biophysical response
t=0
t=n
t=1
Landscape watershed condition
t=0
t=nt=1
Socioeconomic response
t=0
Source: Liu., J. (2002), Integrating Landscape Ecology into Natural Resource Management
Naturla sciences
Functional ecosystem approach
1. Inorganic or organic substrate
2. Patch or micrositeIdentity (age, gender, class,caste, clan)
3. Stand or plotHierarchy (wealth, power, status,knowledge, territory)
4. Vegetative type5. Ecosystem type physicological6. Soil type individual
7. Watershedsocial norms or rules forbehavior
8. Landscape institutional9. Region
10. Biomehalth, justice, faith, commerce,education, leisure, government,sustenance
11. Globe instituitonal cycles
energy, land, water, materials,nutrients, flora, faunaenviornmental cycles (naturladisturbances)
The smallest to large-scale levels of analysis exisitng in the social andnatural sciences
Source: Liu, J. (2002): Integrating Landscape Ecology into naturalResource Management
5. Socioeconomic reosurces
Functinal ecosystem approach
6. Enviornmental cycles
Social sciences
1. Social order
2. Social order and cycles
3. Social institutions
4. Cultural resources (organizations,
Table 1
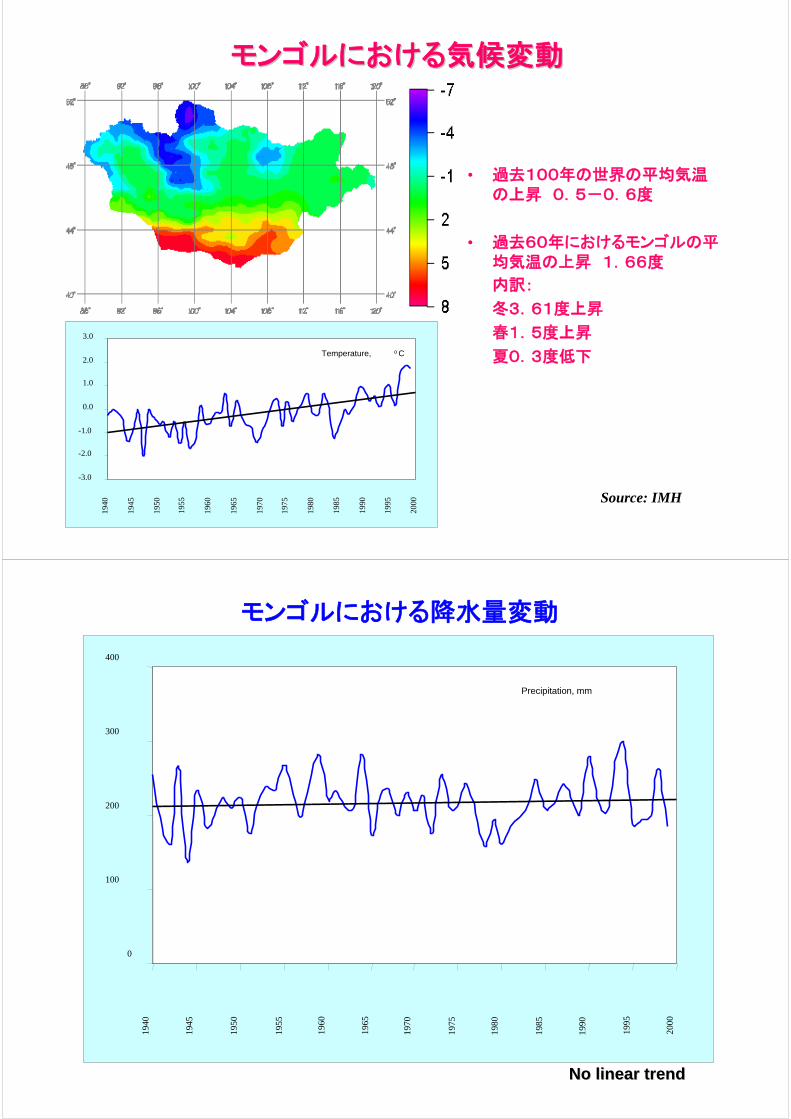
モンゴルにおける気候変動モンゴルにおける気候変動
• 過去100年の世界の平均気温の上昇 0.5-0.6度
• 過去60年におけるモンゴルの平均気温の上昇 1.66度
内訳:
冬3.61度上昇
春1.5度上昇
夏0.3度低下Temperature, o C
-3.0
-2.0
-1.0
0.0
1.0
2.0
3.0
1940
1945
1950
1955
1960
1965
1970
1975
1980
1985
1990
1995
2000 Source: IMH
Precipitation, mm
0
100
200
300
400
1940
1945
1950
1955
1960
1965
1970
1975
1980
1985
1990
1995
2000
モンゴルにおける降水量変動
No linear trendNo linear trend
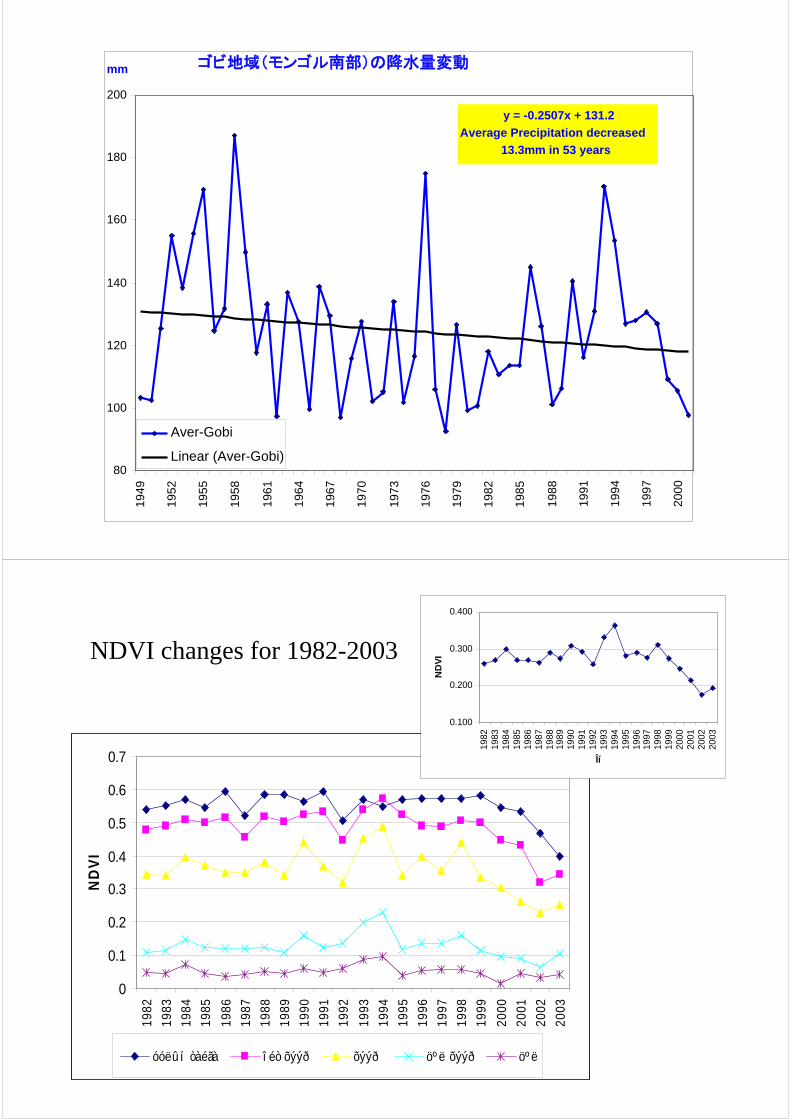
ゴビ地域(モンゴル南部)の降水量変動
y = -0.2507x + 131.2
Average Precipitation decreased
13.3mm in 53 years
80
100
120
140
160
180
200
1949
1952
1955
1958
1961
1964
1967
1970
1973
1976
1979
1982
1985
1988
1991
1994
1997
2000
mm
Aver-Gobi
Linear (Aver-Gobi)
0
0.1
0.2
0.3
0.4
0.5
0.6
0.7
1982
1983
1984
1985
1986
1987
1988
1989
1990
1991
1992
1993
1994
1995
1996
1997
1998
1999
2000
2001
2002
2003
ND
VI
óóëû í òàéãà î éò õýýð õýýð öº ë õýýð öº ë
0.100
0.200
0.300
0.400
1982
1983
1984
1985
1986
1987
1988
1989
1990
1991
1992
1993
1994
1995
1996
1997
1998
1999
2000
2001
2002
2003
Îí
ND
VINDVI changes for 1982-2003
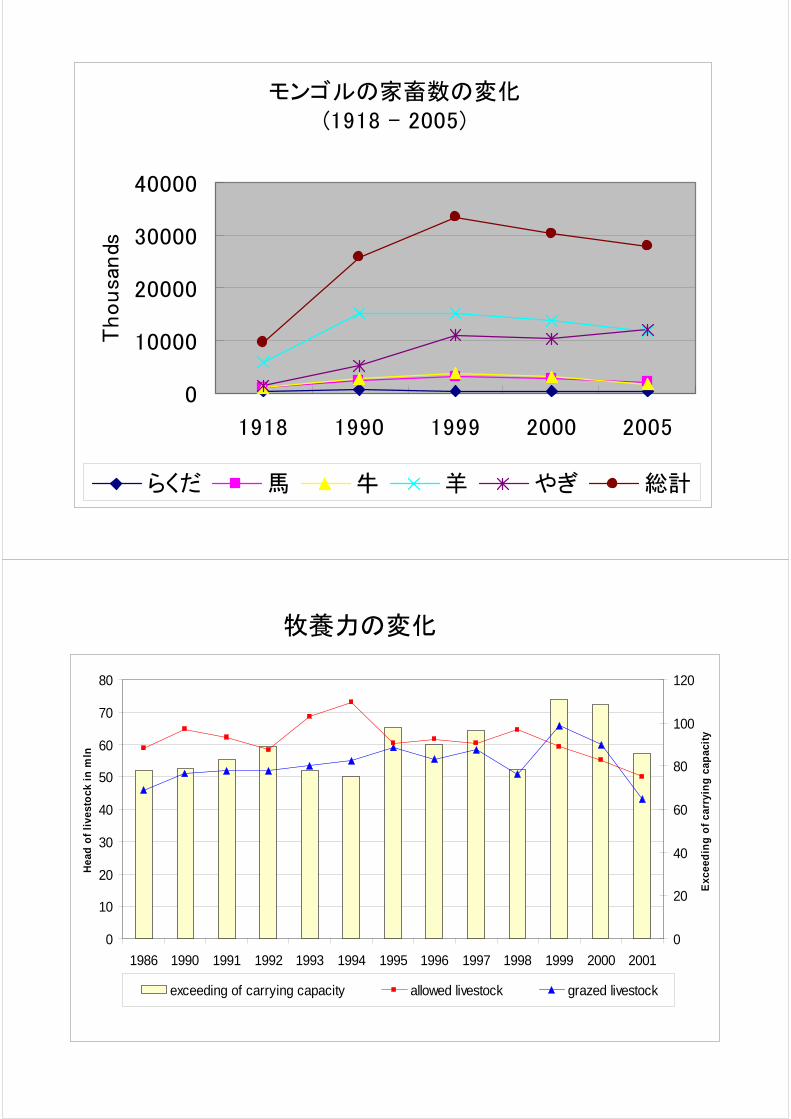
モンゴルの家畜数の変化(1918 - 2005)
0
10000
20000
30000
40000
1918 1990 1999 2000 2005
Thousa
nds
らくだ 馬 牛 羊 やぎ 総計
0
10
20
30
40
50
60
70
80
1986 1990 1991 1992 1993 1994 1995 1996 1997 1998 1999 2000 2001
Hea
d o
f li
vest
ock
in
mln
0
20
40
60
80
100
120
Exc
eed
ing
of
carr
yin
g c
apac
ity
exceeding of carrying capacity allowed livestock grazed livestock
牧養力の変化
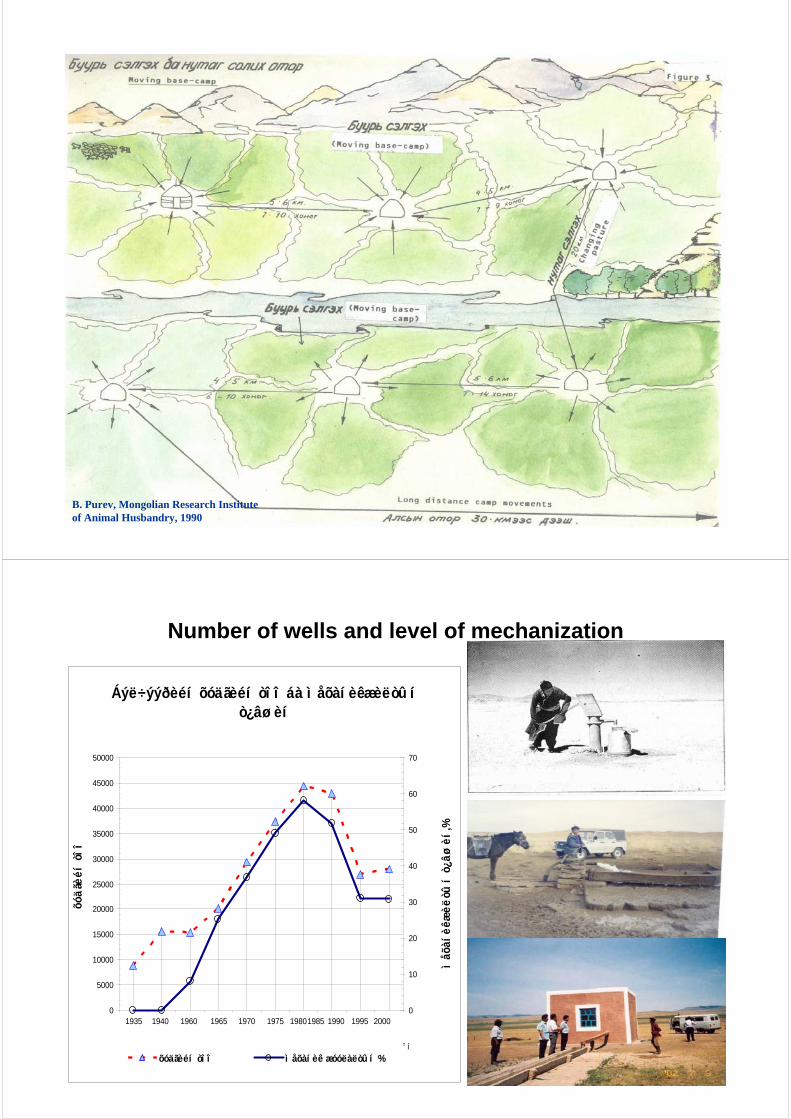
B. Purev, Mongolian Research Institute of Animal Husbandry, 1990
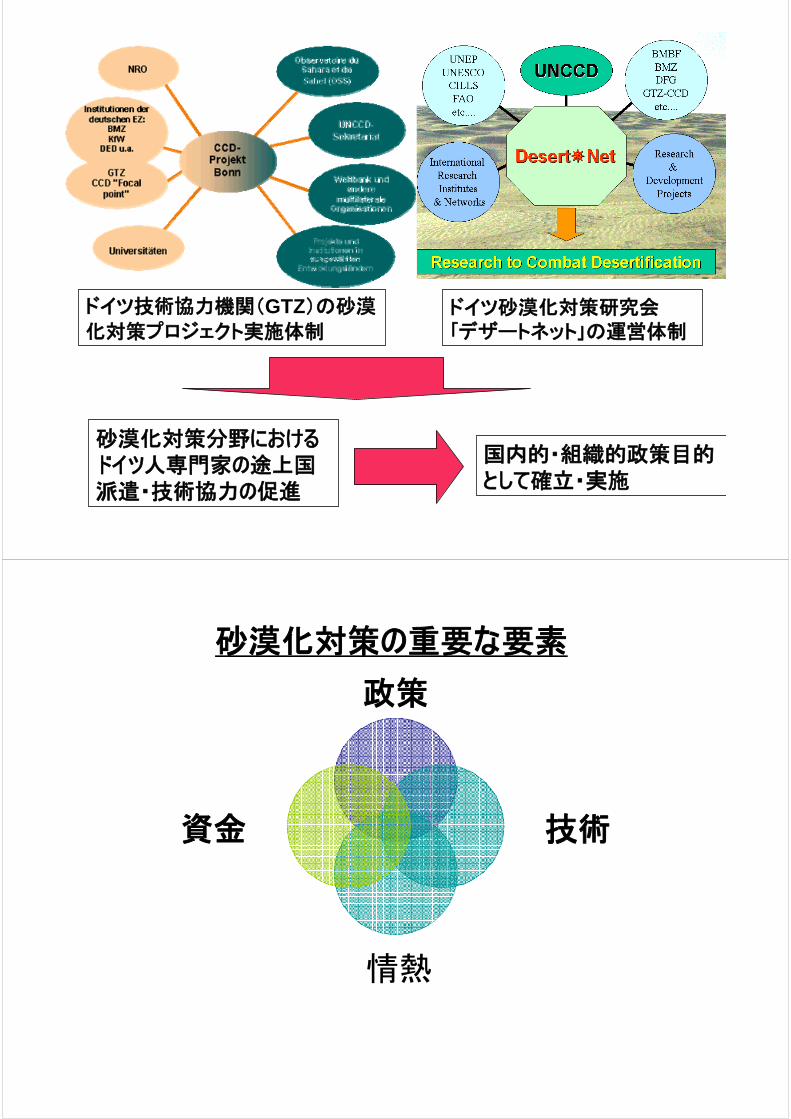
Number of wells and level of mechanization
Áýë÷ýýðèéí õóäãèéí òî î áà ì åõàí èêæèëòû í ò¿âø èí
0
5000
10000
15000
20000
25000
30000
35000
40000
45000
50000
î í
õóä
ãèé
í ò
îî
0
10
20
30
40
50
60
70
ìåõ
àíè
êæè
ëòû
í ò
¿âø
èí
,%
õóäãèéí òî î ì åõàí èê æóóëàëòû í %
1935 1940 1960 1965 1970 1975 19801985 1990 20001995
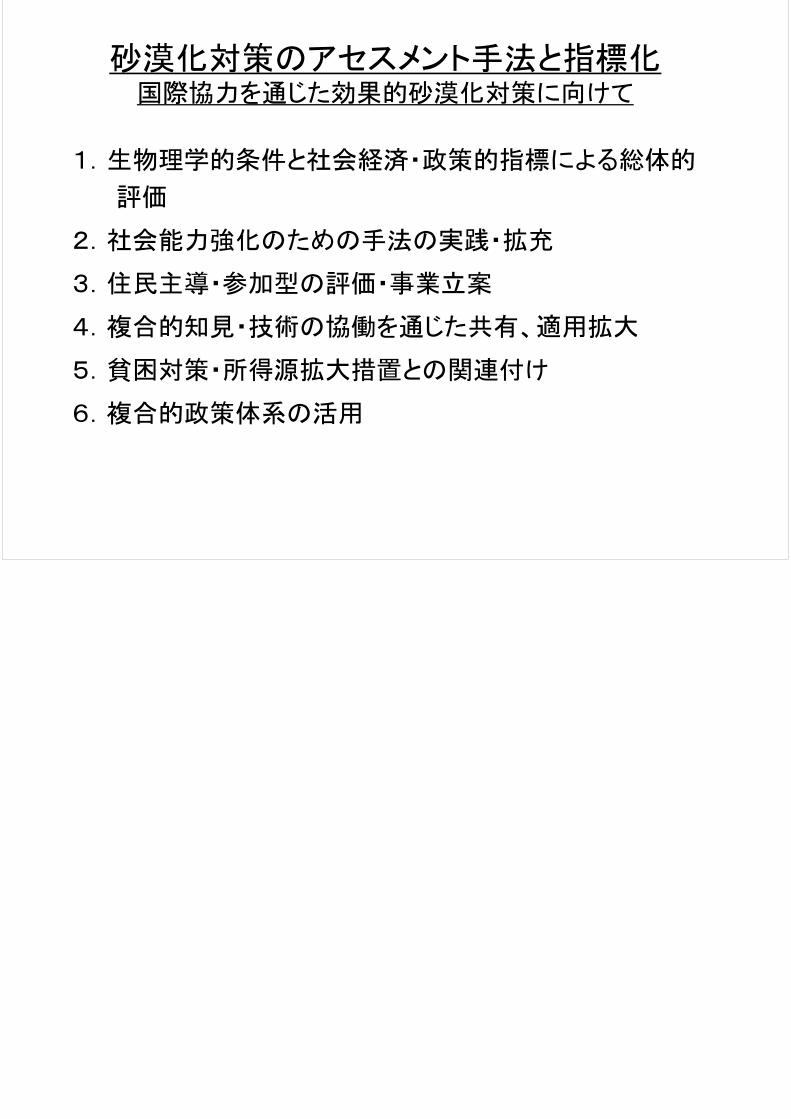
ドイツ技術協力機関(GTZ)の砂漠
化対策プロジェクト実施体制ドイツ砂漠化対策研究会「デザートネット」の運営体制
砂漠化対策分野におけるドイツ人専門家の途上国派遣・技術協力の促進
国内的・組織的政策目的として確立・実施
政策
技術
人
資金
砂漠化対策の重要な要素
情熱
砂漠化対策のアセスメント手法と指標化国際協力を通じた効果的砂漠化対策に向けて
1.生物理学的条件と社会経済・政策的指標による総体的
評価
2.社会能力強化のための手法の実践・拡充
3.住民主導・参加型の評価・事業立案
4.複合的知見・技術の協働を通じた共有、適用拡大
5.貧困対策・所得源拡大措置との関連付け
6.複合的政策体系の活用