Embed Size (px)
Citation preview
7/27/2019 1475-925X-5-28
http://slidepdf.com/reader/full/1475-925x-5-28 1/8
BioMed Central
Page 1 of 8(page number not for citation purposes)
BioMedical Engineering OnLine
Open AccesResearch
Electrical impedance tomography system: an open access circuitdesign
Manuchehr Soleimani* Address: William Lee Innovation Centre, School of Materials, The University of Manchester, Manchester M60 1QD, UK
Email: Manuchehr Soleimani* - [email protected]
* Corresponding author
Abstract
Background: This paper reports a simple 2-D system for electrical impedance tomography EIT,which works efficiently and is low cost. The system has been developed in the Sharif University of
Technology Tehran-Iran (for the author's MSc Project).
Methods: The EIT system consists of a PC in which an I/O card is installed with an external current
generator, a multiplexer, a power supply and a phantom with an array of electrodes. The
measurement system provides 12-bit accuracy and hence, suitable data acquisition software has
been prepared accordingly. The synchronous phase detection method has been implemented for
voltage measurement. Different methods of image reconstruction have been used with thisinstrument to generate electrical conductivity images.
Results: The results of simulation and real measurement of the system are presented. The
reconstruction programs were written in MATLAB and the data acquisition software in C++. The
system has been tested with both static and dynamic mode in a 2-D domain. Better results have
been produced in the dynamic mode of operation, due to the cancellation of errors.
Conclusion: In the spirit of open access publication the design details of this simple EIT systemare made available here.
Background
The imaging of electrical properties of different materialshas been the main topic of many investigations for anumber year [1-3]. In EIT, the contrasts in electrical prop-erties, i.e. the conductivity distribution inside an object, isused to generate a tomographic image [2,4]. EIT haspotential applications in both medical and industrialfields [5-7]. The advantage of such a technique over moretraditional imaging modalities (PET, CT, MRI and ect.) issuch that, it provides a non-invasive (or "non-destruc-tive") method and requires no ionizing radiation. Further-more, EIT is a relatively low cost and simple functional
technique. The most significant drawback of EIT is its
poor image resolution, which is often restricted by thenumber of electrodes used for data acquisition. Dataacquisition is typically made by applying an electrical cur-rent to the object using a set of electrodes, and measuring the developed voltage between other electrodes [2,8,9].
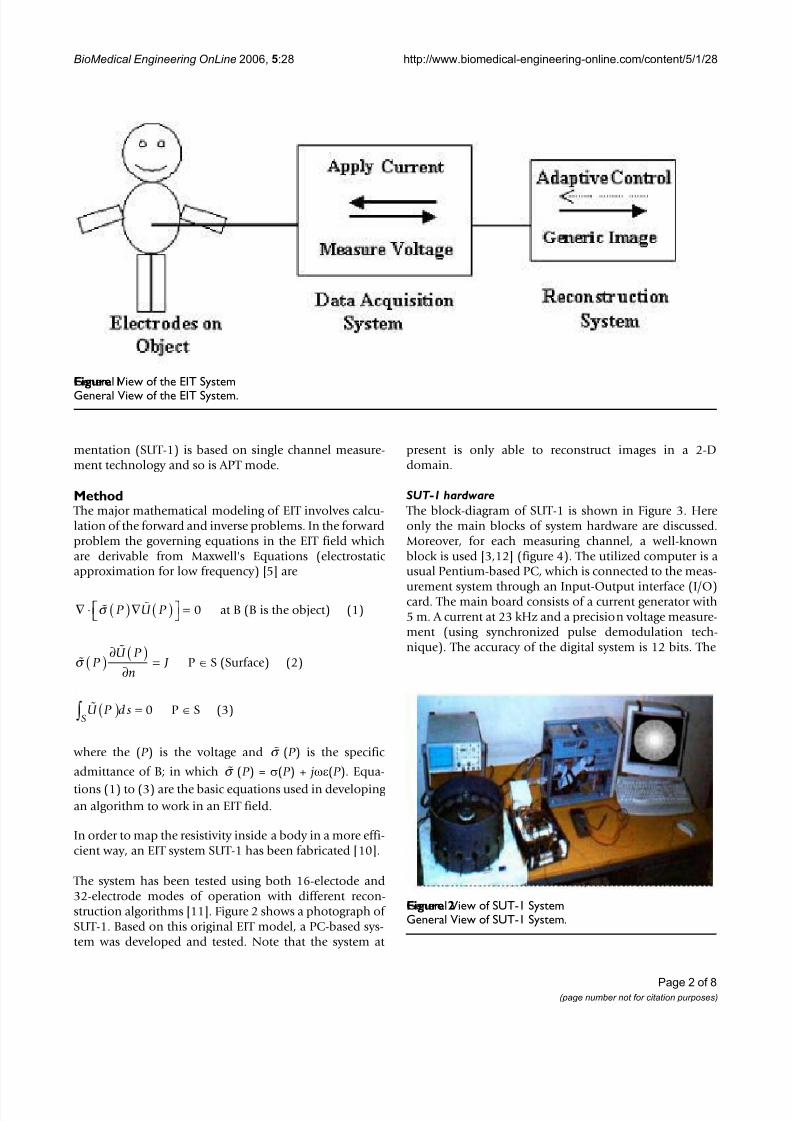
Figure 1 illustrates a general view of an EIT system. Gener-ally 2-D EIT systems could be categorized into two differ-ent sets namely: Applied Potential Tomography (APT)and Adaptive Current Tomography (ACT) [5]. Our instru-
Published: 03 May 2006
BioMedical Engineering OnLine 2006, 5:28 doi:10.1186/1475-925X-5-28
Received: 08 February 2006Accepted: 03 May 2006
This article is available from: http://www.biomedical-engineering-online.com/content/5/1/28
© 2006 Soleimani; licensee BioMed Central Ltd.This is an Open Access article distributed under the terms of the Creative Commons Attribution License (http://creativecommons.org/licenses/by/2.0),which permits unrestricted use, distribution, and reproduction in any medium, provided the original work is properly cited.
7/27/2019 1475-925X-5-28
http://slidepdf.com/reader/full/1475-925x-5-28 2/8
BioMedical Engineering OnLine 2006, 5:28 http://www.biomedical-engineering-online.com/content/5/1/28
Page 2 of 8(page number not for citation purposes)
mentation (SUT-1) is based on single channel measure-ment technology and so is APT mode.
Method The major mathematical modeling of EIT involves calcu-lation of the forward and inverse problems. In the forwardproblem the governing equations in the EIT field whichare derivable from Maxwell's Equations (electrostatic approximation for low frequency) [5] are
at B (B is the object) (1)
P ∈ S (Surface) (2)
P ∈ S (3)
where the (P ) is the voltage and (P ) is the specific
admittance of B; in which (P ) = σ(P ) + jωε(P ). Equa-
tions (1) to (3) are the basic equations used in developing an algorithm to work in an EIT field.
In order to map the resistivity inside a body in a more effi-cient way, an EIT system SUT-1 has been fabricated [10].
The system has been tested using both 16-electode and32-electrode modes of operation with different recon-struction algorithms [11]. Figure 2 shows a photograph of SUT-1. Based on this original EIT model, a PC-based sys-tem was developed and tested. Note that the system at
present is only able to reconstruct images in a 2-Ddomain.
SUT-1 hardware
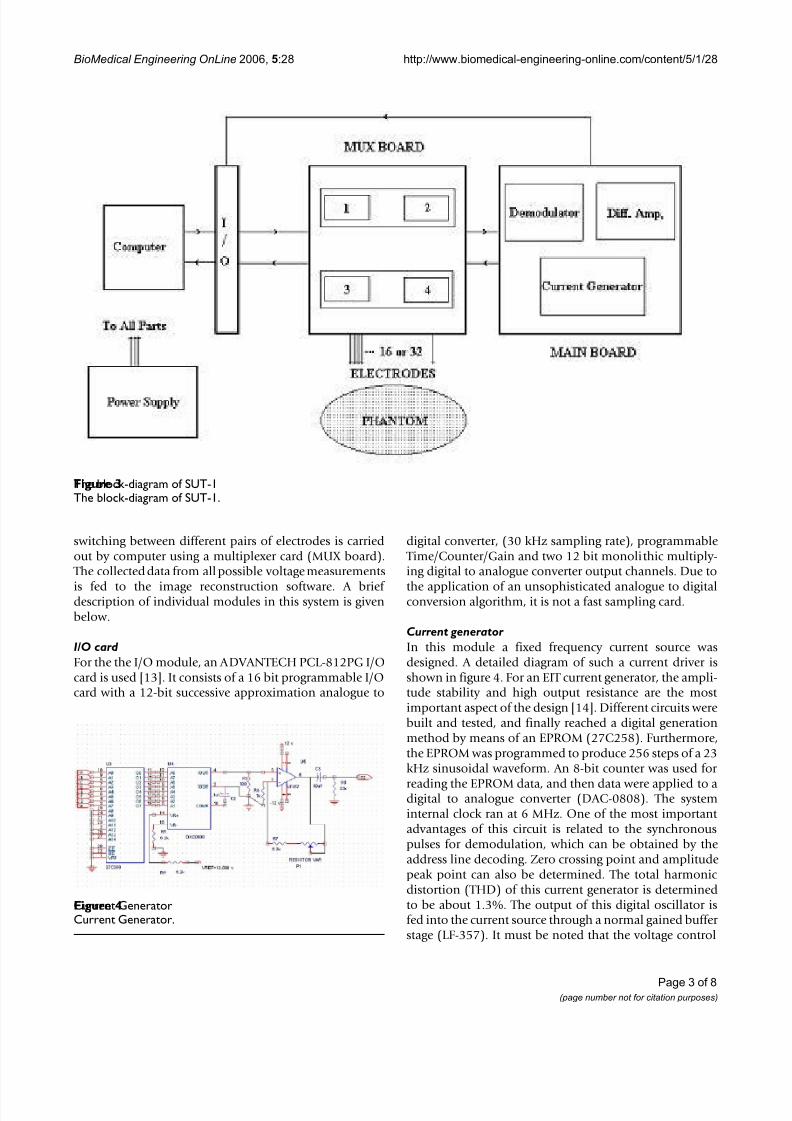
The block-diagram of SUT-1 is shown in Figure 3. Hereonly the main blocks of system hardware are discussed.Moreover, for each measuring channel, a well-knownblock is used [3,12] (figure 4). The utilized computer is ausual Pentium-based PC, which is connected to the meas-
urement system through an Input-Output interface (I/O)card. The main board consists of a current generator with5 m. A current at 23 kHz and a precision voltage measure-ment (using synchronized pulse demodulation tech-nique). The accuracy of the digital system is 12 bits. The
∇ ⋅ ( )∇ ( )
=
σ P U P 0
σ P U P
n J ( )
∂ ( )
∂ =
U P d sS
( ) =∫ 0
σ
σ
General View of SUT-1 SystemFigure 2General View of SUT-1 System.
General View of the EIT SystemFigure 1
General View of the EIT System.
7/27/2019 1475-925X-5-28
http://slidepdf.com/reader/full/1475-925x-5-28 3/8
BioMedical Engineering OnLine 2006, 5:28 http://www.biomedical-engineering-online.com/content/5/1/28
Page 3 of 8(page number not for citation purposes)
switching between different pairs of electrodes is carriedout by computer using a multiplexer card (MUX board).
The collected data from all possible voltage measurements
is fed to the image reconstruction software. A brief description of individual modules in this system is givenbelow.
I/O card
For the the I/O module, an ADVANTECH PCL-812PG I/Ocard is used [13]. It consists of a 16 bit programmable I/Ocard with a 12-bit successive approximation analogue to
digital converter, (30 kHz sampling rate), programmable Time/Counter/Gain and two 12 bit monolithic multiply-ing digital to analogue converter output channels. Due to
the application of an unsophisticated analogue to digitalconversion algorithm, it is not a fast sampling card.
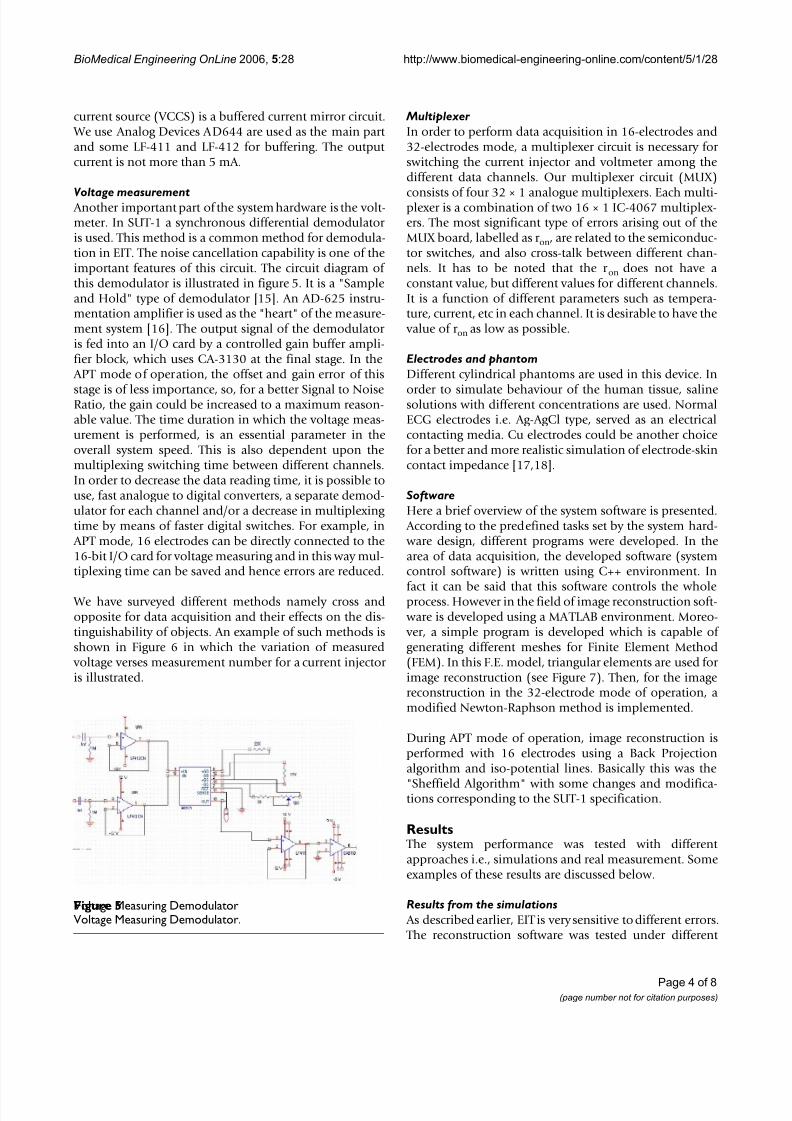
Current generator
In this module a fixed frequency current source wasdesigned. A detailed diagram of such a current driver isshown in figure 4. For an EIT current generator, the ampli-tude stability and high output resistance are the most important aspect of the design [14]. Different circuits werebuilt and tested, and finally reached a digital generationmethod by means of an EPROM (27C258). Furthermore,the EPROM was programmed to produce 256 steps of a 23kHz sinusoidal waveform. An 8-bit counter was used for
reading the EPROM data, and then data were applied to adigital to analogue converter (DAC-0808). The systeminternal clock ran at 6 MHz. One of the most important advantages of this circuit is related to the synchronouspulses for demodulation, which can be obtained by theaddress line decoding. Zero crossing point and amplitudepeak point can also be determined. The total harmonic distortion (THD) of this current generator is determinedto be about 1.3%. The output of this digital oscillator isfed into the current source through a normal gained buffer stage (LF-357). It must be noted that the voltage control
The block-diagram of SUT-1Figure 3The block-diagram of SUT-1.
Current GeneratorFigure 4Current Generator.
7/27/2019 1475-925X-5-28
http://slidepdf.com/reader/full/1475-925x-5-28 4/8
BioMedical Engineering OnLine 2006, 5:28 http://www.biomedical-engineering-online.com/content/5/1/28
Page 4 of 8(page number not for citation purposes)
current source (VCCS) is a buffered current mirror circuit. We use Analog Devices AD644 are used as the main part and some LF-411 and LF-412 for buffering. The output current is not more than 5 mA.
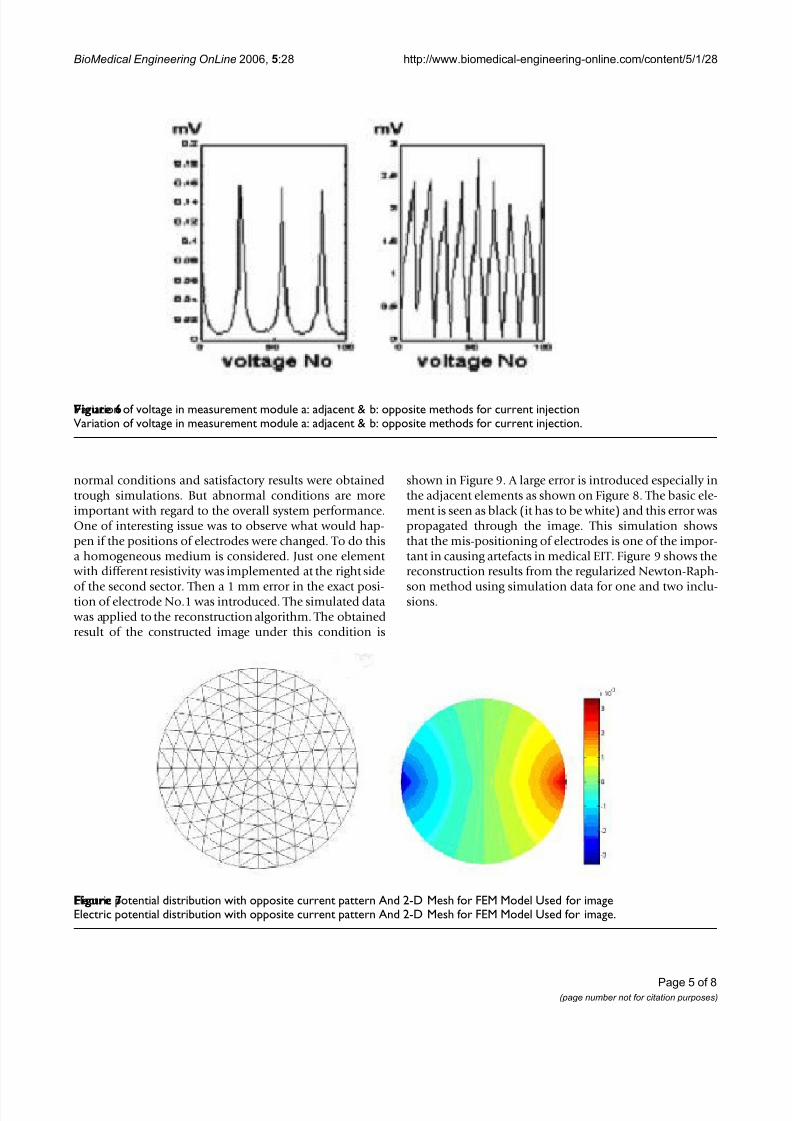
Voltage measurement Another important part of the system hardware is the volt-meter. In SUT-1 a synchronous differential demodulator is used. This method is a common method for demodula-tion in EIT. The noise cancellation capability is one of theimportant features of this circuit. The circuit diagram of this demodulator is illustrated in figure 5. It is a "Sampleand Hold" type of demodulator [15]. An AD-625 instru-mentation amplifier is used as the "heart" of the measure-ment system [16]. The output signal of the demodulator is fed into an I/O card by a controlled gain buffer ampli-fier block, which uses CA-3130 at the final stage. In the
APT mode of operation, the offset and gain error of this
stage is of less importance, so, for a better Signal to NoiseRatio, the gain could be increased to a maximum reason-able value. The time duration in which the voltage meas-urement is performed, is an essential parameter in theoverall system speed. This is also dependent upon themultiplexing switching time between different channels.In order to decrease the data reading time, it is possible touse, fast analogue to digital converters, a separate demod-ulator for each channel and/or a decrease in multiplexing time by means of faster digital switches. For example, in
APT mode, 16 electrodes can be directly connected to the16-bit I/O card for voltage measuring and in this way mul-tiplexing time can be saved and hence errors are reduced.
We have surveyed different methods namely cross andopposite for data acquisition and their effects on the dis-tinguishability of objects. An example of such methods isshown in Figure 6 in which the variation of measured
voltage verses measurement number for a current injector is illustrated.
Multiplexer
In order to perform data acquisition in 16-electrodes and32-electrodes mode, a multiplexer circuit is necessary for switching the current injector and voltmeter among thedifferent data channels. Our multiplexer circuit (MUX)
consists of four 32 × 1 analogue multiplexers. Each multi-plexer is a combination of two 16 × 1 IC-4067 multiplex-ers. The most significant type of errors arising out of theMUX board, labelled as r on, are related to the semiconduc-tor switches, and also cross-talk between different chan-nels. It has to be noted that the r on does not have aconstant value, but different values for different channels.It is a function of different parameters such as tempera-ture, current, etc in each channel. It is desirable to have the
value of r on as low as possible.
Electrodes and phantom
Different cylindrical phantoms are used in this device. In
order to simulate behaviour of the human tissue, salinesolutions with different concentrations are used. NormalECG electrodes i.e. Ag-AgCl type, served as an electricalcontacting media. Cu electrodes could be another choicefor a better and more realistic simulation of electrode-skincontact impedance [17,18].
Software
Here a brief overview of the system software is presented. According to the predefined tasks set by the system hard- ware design, different programs were developed. In thearea of data acquisition, the developed software (systemcontrol software) is written using C++ environment. In
fact it can be said that this software controls the wholeprocess. However in the field of image reconstruction soft-
ware is developed using a MATLAB environment. Moreo- ver, a simple program is developed which is capable of generating different meshes for Finite Element Method(FEM). In this F.E. model, triangular elements are used for image reconstruction (see Figure 7). Then, for the imagereconstruction in the 32-electrode mode of operation, amodified Newton-Raphson method is implemented.
During APT mode of operation, image reconstruction isperformed with 16 electrodes using a Back Projectionalgorithm and iso-potential lines. Basically this was the
"Sheffield Algorithm" with some changes and modifica-tions corresponding to the SUT-1 specification.
Results The system performance was tested with different approaches i.e., simulations and real measurement. Someexamples of these results are discussed below.
Results from the simulations
As described earlier, EIT is very sensitive to different errors. The reconstruction software was tested under different
Voltage Measuring DemodulatorFigure 5Voltage Measuring Demodulator.
7/27/2019 1475-925X-5-28
http://slidepdf.com/reader/full/1475-925x-5-28 5/8
BioMedical Engineering OnLine 2006, 5:28 http://www.biomedical-engineering-online.com/content/5/1/28
Page 5 of 8(page number not for citation purposes)
normal conditions and satisfactory results were obtainedtrough simulations. But abnormal conditions are moreimportant with regard to the overall system performance.One of interesting issue was to observe what would hap-pen if the positions of electrodes were changed. To do thisa homogeneous medium is considered. Just one element
with different resistivity was implemented at the right side
of the second sector. Then a 1 mm error in the exact posi-tion of electrode No.1 was introduced. The simulated data
was applied to the reconstruction algorithm. The obtainedresult of the constructed image under this condition is
shown in Figure 9. A large error is introduced especially inthe adjacent elements as shown on Figure 8. The basic ele-ment is seen as black (it has to be white) and this error waspropagated through the image. This simulation showsthat the mis-positioning of electrodes is one of the impor-tant in causing artefacts in medical EIT. Figure 9 shows thereconstruction results from the regularized Newton-Raph-
son method using simulation data for one and two inclu-sions.
Electric potential distribution with opposite current pattern And 2-D Mesh for FEM Model Used for imageFigure 7Electric potential distribution with opposite current pattern And 2-D Mesh for FEM Model Used for image.
Variation of voltage in measurement module a: adjacent & b: opposite methods for current injectionFigure 6Variation of voltage in measurement module a: adjacent & b: opposite methods for current injection.
7/27/2019 1475-925X-5-28
http://slidepdf.com/reader/full/1475-925x-5-28 6/8
BioMedical Engineering OnLine 2006, 5:28 http://www.biomedical-engineering-online.com/content/5/1/28
Page 6 of 8(page number not for citation purposes)
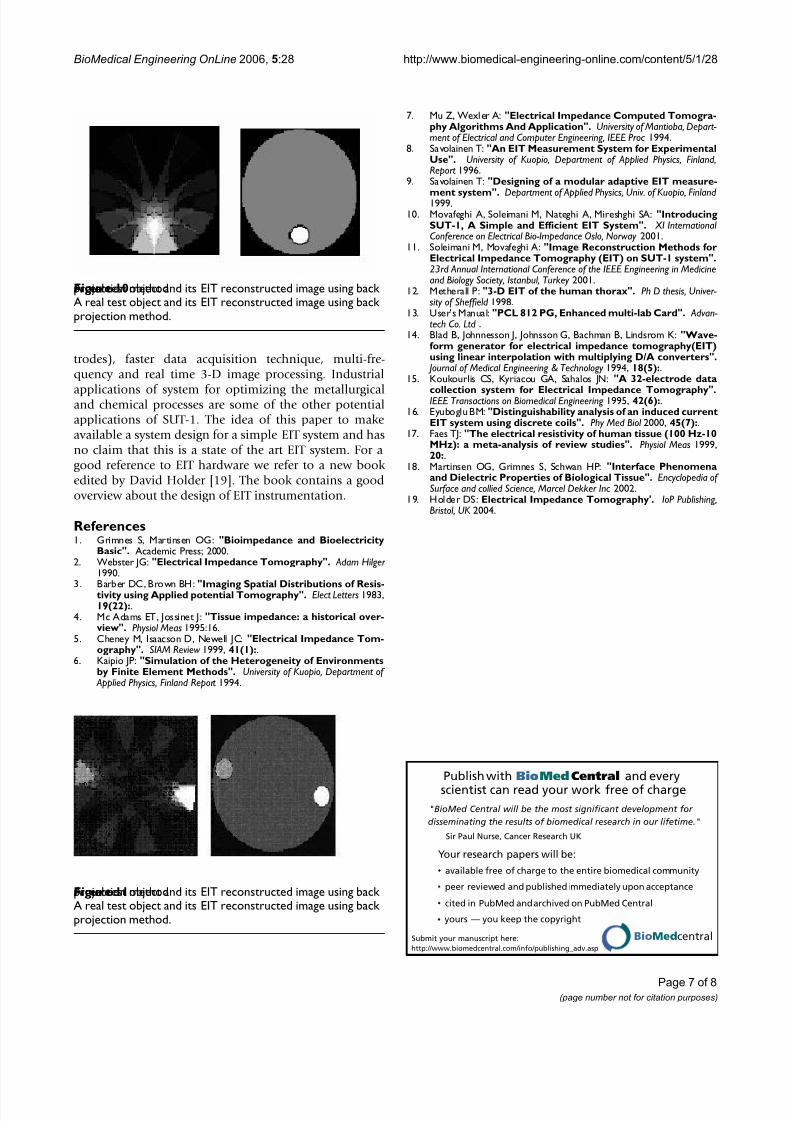
Results from the real measurements
For this part, the voltage and then reconstructed imagesare measured in 16 and 32 electrodes modes. In practicalconditions, EIT is very sensitive to noise. Electrodes areconnected via a shielded cable to the system for noisereduction. Figures 10, 11 illustrate two actual imagesusing a simple phantom in the APT mode. The phantom
was made of a PVC cylinder with a 30 cm diameter andfilled with saline. Figure 10 shows the design and experi-mental results for a phantom where an object with differ-ent resistivity (a normal milk bottle) is put at the corner,
i.e., at x = 0 cm and y = -6 cm from the geometrical centreof the tank.
Figure 10 shows the design and experimental results for aphantom with two objects. Measured data were trans-ferred to the computer, the reconstruction algorithmapplied and an image was obtained using the back projec-tion method. As seen in Figure 11, a star artifact resulted
from the back projection a well-known artifact for thismethod without using filters. Basically, it is due to limita-tion in the number of projections. If the projectionsnumber (ray-sum) is increased, the size of this artifact willdecrease.
ConclusionSUT-1 is a simple and low cost 2-D EIT system. Its accu-racy and operation are tested in different conditions. Thesystem is designed to be upgraded to function as a multi-current generator adaptive system. Also by modificationof the sampling circuit, SUT-1 will be able to detect theimaginary part of the signal can be detected. For this pur-
pose voltage sampling has to be carried out during zero-crossing instead of peak sampling. The system was testedunder in-vitro conditions. In order to perform in-vivomeasurement, the IEC-601 safety standard has to beobserved. The system needs some changes using an isola-tion component, e.g. opto-couplers in the data acquisi-tion circuit, which can provide a complete electricalisolation. It is believed that the SUT-1 can be also used for different EIT applications such as industrial process con-trol.
The different hardware parts of an engineered EIT systemnamely SUT-1 were investigated. SUT-1 also has its own
limitations in practical use. Primary studies are under way to increase the SUT-1's capabilities. This can be achievedthrough the use of better electrodes (e.g. active elec-
Simulated test reconstructions using regularized Newton-Raphson methodFigure 9Simulated test reconstructions using regularized Newton-Raphson method.
Simulated images due to Electrode positioning errorFigure 8Simulated images due to Electrode positioning error.
7/27/2019 1475-925X-5-28
http://slidepdf.com/reader/full/1475-925x-5-28 7/8
Publish with BioMed Central and everyscientist can read your work free of charge
"BioMed Central will be the most significant development for
disseminating the results of biomedical research in our lifetime."
Sir Paul Nurse, Cancer Research UK
Your research papers will be:
available free of charge to the entire biomedical community
peer reviewed and published immediately upon acceptance
cited in PubMed and archived on PubMed Central
yours — you keep the copyright
Submit your manuscript here:
http://www.biomedcentral.com/info/publishing_adv.asp
BioMedcentral
BioMedical Engineering OnLine 2006, 5:28 http://www.biomedical-engineering-online.com/content/5/1/28
Page 7 of 8(page number not for citation purposes)
trodes), faster data acquisition technique, multi-fre-quency and real time 3-D image processing. Industrial
applications of system for optimizing the metallurgicaland chemical processes are some of the other potentialapplications of SUT-1. The idea of this paper to makeavailable a system design for a simple EIT system and hasno claim that this is a state of the art EIT system. For agood reference to EIT hardware we refer to a new book edited by David Holder [19]. The book contains a goodoverview about the design of EIT instrumentation.
References1. Grimnes S, Martinsen OG: "Bioimpedance and Bioelectricity
Basic". Academic Press; 2000.2. Webster JG: "Electrical Impedance Tomography". Adam Hilger
1990.
3. Barber DC, Brown BH: "Imaging Spatial Distributions of Resis-tivity using Applied potential Tomography". Elect Letters 1983,19(22):.
4. Mc Adams ET, Jossinet J: "Tissue impedance: a historical over-view". Physiol Meas 1995:16.
5. Cheney M, Isaacson D, Newell JC: "Electrical Impedance Tom-ography". SIAM Review 1999, 41(1):.
6. Kaipio JP: "Simulation of the Heterogeneity of Environmentsby Finite Element Methods". University of Kuopio, Department of
Applied Physics, Finland Report 1994.
7. Mu Z, Wexler A: "Electrical Impedance Computed Tomogra-phy Algorithms And Application". University of Mantioba, Depart-ment of Electrical and Computer Engineering, IEEE Proc 1994.
8. Savolainen T: "An EIT Measurement System for ExperimentalUse". University of Kuopio, Department of Applied Physics, Finland,Report 1996.
9. Savolainen T: "Designing of a modular adaptive EIT measure-
ment system". Department of Applied Physics, Univ. of Kuopio, Finland 1999.10. Movafeghi A, Soleimani M, Nateghi A, Mireshghi SA: "Introducing
SUT-1, A Simple and Efficient EIT System". XI International Conference on Electrical Bio-Impedance Oslo, Norway 2001.
11. Soleimani M, Movafeghi A: "Image Reconstruction Methods for Electrical Impedance Tomography (EIT) on SUT-1 system".23rd Annual International Conference of the IEEE Engineering in Medicineand Biology Society, Istanbul, Turkey 2001.
12. Metherall P: "3-D EIT of the human thorax". Ph D thesis, Univer-sity of Sheffield 1998.
13. User's Manual: "PCL 812 PG, Enhanced multi-lab Card". Advan-tech Co. Ltd .
14. Blad B, Johnnesson J, Johnsson G, Bachman B, Lindsrom K: "Wave-form generator for electrical impedance tomography(EIT)using linear interpolation with multiplying D/A converters".
Journal of Medical Engineering & Technology 1994, 18(5):.15. Koukourlis CS, Kyriacou GA, Sahalos JN: "A 32-electrode data
collection system for Electrical Impedance Tomography".IEEE Transactions on Biomedical Engineering 1995, 42(6):.16. Eyuboglu BM: "Distinguishability analysis of an induced current
EIT system using discrete coils". Phy Med Biol 2000, 45(7):.17. Faes TJ: "The electrical resistivity of human tissue (100 Hz-10
MHz): a meta-analysis of review studies". Physiol Meas 1999,20:.
18. Martinsen OG, Grimnes S, Schwan HP: "Interface Phenomenaand Dielectric Properties of Biological Tissue". Encyclopedia of Surface and collied Science, Marcel Dekker Inc 2002.
19. Holder DS: Electrical Impedance Tomography'. IoP Publishing,Bristol, UK 2004.
A real test object and its EIT reconstructed image using backprojection methodFigure 11A real test object and its EIT reconstructed image using backprojection method.
A real test object and its EIT reconstructed image using backprojection methodFigure 10A real test object and its EIT reconstructed image using backprojection method.

7/27/2019 1475-925X-5-28
http://slidepdf.com/reader/full/1475-925x-5-28 8/8
BioMedical Engineering OnLine 2006, 5:28 http://www.biomedical-engineering-online.com/content/5/1/28
Page 8 of 8(page number not for citation purposes)


![[XLS]link.springer.com10.1186/1475... · Web viewITvar_NEW6p_UpsC1_1 TTTAGCTGTGAACTCATTAGGTACAGTAGGTTGTTCTGCTGATTTAGCTGGAACTGCTGCAGGTTTTGCT IT_Ste_0000177_6 IT_Ste_p_0000164_3 IT_Ste_0000095_5a](https://img.pdfslide.us/doc/110x75/5aa2fc217f8b9a84398dc190/xlslink-1011861475web-viewitvarnew6pupsc11-tttagctgtgaactcattaggtacagtaggttgttctgctgatttagctggaactgctgcaggttttgct.jpg)


![j.1475-5661.2010.00381.x[1]war gregory](https://img.pdfslide.us/doc/110x75/577cb2ef1a28aba7118c2f88/j1475-5661201000381x1war-gregory.jpg)