Embed Size (px)
DESCRIPTION
Ranking
Citation preview

2015
Sponsored by
Featuring six new subjects
12993_Cover_Subjects_FINAL_2 copy.pdf 1 06/03/2015 12:09


Welcome to the 2015 QS World University Rankings® by Subject ReportBy Ben Sowter
The last few years have shown us that rankings, and in particular, league tables are of widespread interest and influence. They have been described as having a hypnotic power. I have now been at the eye of the rankings storm for over a decade and it has been inspiring and frustrating, surprising and enlightening – never more so than over the past few weeks. Rankings have helped bring the quality debate in international higher education out into the light – and the exposure of that debate has led to objectively positive outcomes for universities and Higher Education systems around the world. That being said, there have also been pitfalls.
One of the most depressing aspects has been where institutions have taken the necessarily simplified view of a university that a ranking engenders and used it as a template to overlay back on their own institution. It’s not the rankings themselves, so much as unsophisticated reactions to them, which threaten to manifest a homogenising force: a world where all institutions try, and inevitably fail, to emulate Harvard or Cambridge.
There are two particular problems with that:
1. No ranking provides an adequately precise picture of what Harvard or Cambridge are like – at best they provide a rough, pixelated image – the “Minecraft version” if you will
2. The world doesn’t need 20,000 universities like Harvard or Cambridge – and even if it did – Harvard and Cambridge are not just one thing – they are different things to different viewers
It should be a core ambition of every university to be more than just one thing, to be multidimensional. The QS World University Rankings by Subject are where some of these dimensions can be more ably perceived – if the global rankings are a wide angle lens, the subject rankings are a rack of synchronous telephotos – and they reveal a far more richly detailed picture.
With an additional six subjects in 2015, we are adding additional depth to the image. Amongst these Business & Management Studies will be the most talked about, the most visited, but some of the others deliver more unexpected stories. Through Dentistry, Art & Design, Architecture and Veterinary Science a strong cohort of specialist operators will shine for the first time in a global ranking and fully eight African institutions feature in the Top 100 of our inaugural Development Studies table.
This is a vast exercise, built on eight times the number of processed variables that our global ranking relies upon. We are always learning, listening, refining and this year the response following the circulation of an initial fact file was enough for us to take pause and re-examine our work. These final tables are the results of that effort and I would like to acknowledge the support of institutions in arriving at them. For more on the latest refinements, please visit www.iu.qs.com.
If these tables are a fraction as interesting to read as they have been to compile then you’re in for a treat. Discuss. Share. Post. Tweet. Encourage these institutions to want to be multidimensional.
Ben Sowter, Head of QS Intelligence Unit
“I never want to be just one thing - I want to be multidimensional.”Katy Perry
Advert UCSG - Outline copy.pdf 1 27/02/2015 14:02

QS World University Rankings by Subject - Methodology
The QS World University
Rankings® have been in
existence since 2004, but
since 2011 the study has
been extended to encompass
a range of popular individual
subjects with 36 disciplines
ranked this year.
The majority of prospective international students begin their search knowing what they want to study before considering where, so understanding the comparative quality of institution by subject is fundamen-tal to the QS mission to support students in their decision-making. QS aims to add more depth, more detail and more subjects to this work year by year and anticipates that these tables will, in time, become more important than the overall rankings.
QS has access to three extensive datasets that enable us to drill down by subject area: our academic and employer reputation surveys, and the Scopus data we use for our citations per faculty indicator in the overall rankings. These three components have been combined to produce our subject re-sults, with weightings adapted by discipline.
Academic Reputation
Academic reputation has been the centre-piece of the QS World University Rankings® since their inception. In 2015 we drew on 85,062 respondents to compile our results.
Having provided their name, contact details, job title and the institution where they are based, respondents identify the countries, regions and faculty areas that they have most familiarity with, and up to two narrow-er subject disciplines in which they consider themselves expert. For each of the (up to five) faculty areas they identify, respondents are asked to list up to ten domestic and thirty international institutions that they consider excellent for research in the given area. They are not able to select their own institution.
The results of the academic reputation component of the new subject rankings have been produced by filtering responses according to the narrow area of expertise identified by respondents. While academics can select up to two narrow areas of exper-tise, greater emphasis is placed on respond-ents who have identified with only one.
Employer reputation
QS World University Rankings® are unique in incorporating employability as a key factor in the evaluation of international universities, and in 2015 we drew on 41,910 responses to compile the results for the overall rankings. The employer survey works on a similar basis to the academic one, only without the channelling for different faculty areas. Employers are asked to identify up to ten domestic and thirty international institutions they consider excellent for the recruitment of graduates. They are also asked to identify from which disciplines they prefer to recruit. From examining where
these two questions intersect we can infer a measure of excellence in a given discipline.
Citations per paper
Due to the impracticality of reliably gather-ing faculty numbers broken down by disci-pline, for the purposes of this exercise we have measured citations per paper rather than per faculty member. A minimum publi-cation threshold has been set for each sub-ject to avoid potential anomalies stemming from small numbers of highly cited papers. Both the minimum publications threshold and the weighting applied to the citations indicator are adapted in order to best reflect prevalent publication and citation patterns in a given discipline. All citations data is sourced from Scopus, the world’s most com-prehensive research citations database.
As of 2013, a score based on ‘h-index’ has been added to the QS World University Rankings by Subject. The h-index is a way of measuring both the productivity and impact of the published work of a scientist or scholar. The index is based on the set of the scientist’s most cited papers and the number of citations that they have received in other publications. The index can also be applied to the productivity and impact of a group of scientists, such as a department or university or country, as well as a scholarly journal. The index was suggested by Jorge E. Hirsch, a physicist at UCSD, as a tool for determining theoretical physicists’ relative quality and is sometimes called the Hirsch index or Hirsch number.
Further details, including the chronological log of the methodology refinements, can be found at www.iu.qs.com

Record Number of Disciplines Ranked to Meet Rising Demand for Subject –Specific ComparisonBy John O’Leary
The fifth edition of the QS
World University Rankings
by Subject sees a step change
in the number of disciplines
covered at a time when the
global appetite for subject-
specific comparisons has never
been stronger.
Six new rankings are included among the 36 published today. The new areas range from architecture to veterinary science, and include some of the most popular subjects in higher education: notably business and art and design. Dentistry and development studies are the remaining new arrivals.
As before, the methodology varies with the subject, reflecting differing priorities and the availability of data. In art and design, for example, citations do not represent the academic currency that they have become in the sciences. Instead, the views of academics account for 90 per cent of the scores in a ranking dominated by specialist institutions.
In veterinary science, by contrast, citations are plentiful: almost 50,000 papers were indexed for the new ranking. As a result, 30 per cent of the overall score is derived from citations and another 30 per cent on the h-index of faculty, measuring the impact of their research.
A survey by Hobsons, the education software and services company, has shown that the subject rankings are playing an increasingly important role in decision-
making by international students. Only the level of fees was more important to students than subject rankings in choosing where to study, with institutional rankings just behind in the list of major influences.
The new exercise will provide a great deal of food for thought. Five of the 30 rankings published last year have new leaders, and there are new entries in every one. Some rankings have been enlarged, reflecting the increase in data collected by the QS Intelligence Unit (QSIU).
Ben Sowter, who is responsible for all the company’s rankings as head of QSIU, said: “The growing number of academics and employers all around the world who take part in our polling has enabled us to expand the exercise considerably. We hope to cover more subjects in future because we are keenly aware that students want to know about the course they plan to take, as well as the standing of the university.”
Mr Sowter added that the strong showing by specialist institutions, many of which would not appear in overall rankings, was one of the benefits of drilling down to the subject level. The Karolinska Institute, in Stockholm, tops the new dentistry ranking, as well as appearing in the top 10 for medicine and pharmacy. Similarly, the Royal College of Art, in London, tops the new art and design table.
In addition, comprehensive universities that do not appear at the top of the QS World University Rankings are able to demonstrate their strengths in particular areas. The University of California, Davis, for example, tops the new ranking for veterinary science, as well as remaining the global leader in agriculture, while standing at 95th in QS’s institutional ranking.
American universities continue to dominate in terms of the number of subjects in which they lead, just as they do in all the global institutional rankings. A total of 15 universities top at least one of the new subject rankings, almost half of them from the United States.
However, UK universities have improved their positions overall, with six separate institutions leading in at least one subject. Oxford has achieved the best results this year, with top positions in geography and modern languages, but Cambridge, London Business School, the Royal College of Art, Sussex and University College London’s Institute of Education all register one top place.
The monopoly of US and UK universities at the top of the rankings has been broken this year by ETH Zurich, as well as the Karolinska Institute. The Swiss technological university, which is twelfth in the QS World University Rankings, has made the leap from ninth position last year to take top place in the earth and marine sciences. It is in the top 10 for another nine subjects, including architecture, biological sciences and chemistry.
Not surprisingly, Harvard and the Massachusetts Institute of Technology (MIT) continue to take the lion’s share of top places, each leading in 21 of the 36 subjects between them. Harvard has added history to the long list of subjects in which it is the world leader. MIT’s main strength continues to be in the engineering disciplines, but it also leads in architecture, chemistry, physics and linguistics.
Breaking into the upper echelons in any of the 36 subjects remains challenging for universities from developing nations,
particularly where English is not the first language. The leading US and UK institutions are strong across the board, so that even subjects such as development studies, which might be considered prime territory for universities in Africa, Asia and Latin America, see familiar names in the top positions. British universities fill six of the top ten places, although the University of Cape Town does appear in seventh place. Further down the ranking are universities from Colombia, India, Kenya and the Philippines.
Much of the attention this year is likely to be focused on the new business ranking because of its popularity among international students worldwide. Unlike the existing rankings of business schools, which tend to focus exclusively on MBA courses, the new table takes account of the much larger population of undergraduates and other postgraduate degrees, as well as MBAs.
Academic opinion accounts for 50 per cent of the scores in business, with another 30 per cent resting on employers’ views. The
London Business School comes out just ahead of Harvard, the employers’ favourite, after recording the top score in the polling of academics. INSEAD, the French business school, takes third place in another of the rankings where specialist institutions score well.
Of the other subjects added this year, dentistry is another to bring a new name to the select list of institutions that lead at least one ranking. Karolinska, which is too specialist to appear in the QS World University Rankings, is a fraction of a point ahead of the University of Hong Kong. As in veterinary science, citations and h-index, each account for 30 per cent of the scores, with more than 60,000 papers indexed as part of the exercise.
In architecture, where academic opinion accounts for 70 per cent of the scores, MIT just pips University College London’s Bartlett School of Architecture to the first top position. Again, centres of excellence such as Delft University of Technology make their mark in the top ten.
The results of all the subject rankings were discussed at a special event at the University of New South Wales, in Sydney, on March 18. The debate marked the coming of age of the subject rankings, which first appeared in 2011.
Such was the scale of the latest exercise that more than 2.5 million papers were indexed in medicine and more than 1,000 institutions were evaluated in modern languages. Almost as many were considered for the newly-added area of art and design, whereas in the much smaller areas of architecture and veterinary science the total was below 300.


Accounting & Finance
2015
2014
Instit
ution
Coun
try
Acad
emic
Emplo
yer
Citati
ons
H
Overa
ll
1 1 Harvard University US 100.0 98.4 96.3 96.1 98.8
2 6 Massachusetts Institute of Technology (MIT) US 95.2 92.3 92.6 87.4 93.3
3= 5 Stanford University US 94.4 91.0 94.0 88.5 92.8
3= 2 University of Oxford GB 90.9 100.0 85.6 87.4 92.8
5 3 London School of Economics and Political Science (LSE) GB 94.2 93.0 87.6 87.4 92.5
6 8= University of Chicago US 93.5 80.7 97.9 100.0 90.8
7 11 University of Pennsylvania US 91.5 81.7 95.8 99.3 89.8
8 4 University of Cambridge GB 89.4 99.4 74.1 76.2 89.6
9 7 London Business School GB 90.4 88.9 85.8 86.2 89.1
10 15 New York University (NYU) US 90.1 80.4 95.2 99.3 88.6
11 14 University of California, Berkeley (UCB) US 90.7 83.9 91.6 88.5 88.5
12 10 The University of New South Wales (UNSW) AU 86.3 91.6 82.3 86.2 87.5
13 12 National University of Singapore (NUS) SG 88.1 93.6 76.7 72.5 87.1
14 8= The University of Melbourne AU 85.7 91.5 81.8 85.0 87.0
15 16 Yale University US 85.6 87.4 88.1 85.0 86.3
16 21 Columbia University US 86.2 83.9 89.2 89.6 86.2
17 19 The Hong Kong University of Science and Technology (HKUST) HK 86.5 84.8 85.6 80.9 85.3
18 17 The University of Manchester GB 84.1 83.8 85.4 92.6 85.0
19= 13 The University of Sydney AU 81.4 90.6 81.4 87.4 84.8
19= University of California, Los Angeles (UCLA) US 87.9 82.6 83.2 77.9 84.8
21 INSEAD FR 85.1 88.0 72.2 72.5 83.4
22 28= Nanyang Technological University (NTU) SG 83.2 83.9 82.2 79.5 82.9
23 18 University of Hong Kong (HKU) HK 82.0 87.7 75.7 76.2 82.5
24 33 University of Michigan US 84.9 72.2 90.5 88.5 82.0
25 22 Australian National University (ANU) AU 81.8 83.5 77.4 80.9 81.8
26= 24= Princeton University US 79.9 80.9 89.5 82.4 81.4
26= 24= The University of Auckland NZ 79.8 87.5 72.8 79.5 81.4
28= 41 Northwestern University US 84.3 68.9 100.0 83.7 81.2
28= 26 The University of Queensland (UQ) AU 78.9 83.8 83.3 82.4 81.2
28= 31 Università Commerciale Luigi Bocconi IT 80.6 84.8 79.7 74.4 81.2
31 HEC Paris FR 80.4 86.2 75.5 74.4 81.1
32 20 Monash University AU 77.2 87.9 78.7 80.9 80.9
33= 36 University of Texas at Austin US 84.0 71.6 89.3 83.7 80.8
33= 38 University of Toronto CA 81.7 77.4 84.8 82.4 80.8
35= 27 The Chinese University of Hong Kong (CUHK) HK 79.3 83.4 81.9 76.2 80.5
35= 42 University of British Columbia CA 82.3 78.9 79.2 77.9 80.5
37 34= Duke University US 81.2 71.7 91.2 91.6 80.4
38= 39 Cornell University US 78.0 77.5 88.7 91.6 80.3
38= 30 Peking University CN 80.0 85.6 78.1 68.3 80.3
40 34= Copenhagen Business School DK 80.3 76.7 82.7 82.4 79.7
41 37 Erasmus University Rotterdam NL 77.8 76.8 85.0 86.2 79.1
42 28= The University of Warwick GB 79.0 80.6 77.9 74.4 78.9
43 40 Seoul National University (SNU) KR 77.1 84.4 71.5 76.2 78.6
44 23 The University of Tokyo JP 80.7 88.3 59.4 57.2 78.5
45 48= University of Edinburgh GB 77.0 78.6 80.1 76.2 77.7
46 32 Imperial College London GB 75.2 86.6 72.1 65.9 77.4
47 51-100 University of Illinois at Urbana-Champaign US 77.9 67.8 85.5 80.9 75.9
48 McGill University CA 74.6 79.1 77.1 70.5 75.8
49 50 Stockholm School of Economics SE 76.2 73.7 78.9 76.2 75.7
50 51-100 Singapore Management University SG 74.2 73.3 82.3 80.9 75.4
Agriculture & Forestry
2015
2014
Instit
ution
Coun
try
Acad
emic
Emplo
yer
Citati
ons
H
Overa
ll
1 1 University of California, Davis (UCD) US 100.0 84.3 93.7 100.0 97.2
2 3 Cornell University US 95.3 87.7 95.3 98.3 95.1
3 2 Wageningen University NL 97.7 89.5 90.5 95.5 95.0
4 6 University of California, Berkeley (UCB) US 79.5 60.9 100.0 97.6 85.4
5= 8 Purdue University US 86.7 68.4 87.4 83.0 84.3
5= 4 University of Wisconsin-Madison US 80.3 76.5 92.3 90.1 84.3
7 20 Australian National University (ANU) AU 73.9 100.0 95.9 89.8 84.1
8 5 Iowa State University US 81.8 74.3 88.6 85.7 83.2
9 7 Oregon State University US 77.7 76.1 89.3 89.5 82.2
10 41= Swedish University of Agricultural Sciences SE 87.2 24.5 89.3 88.8 81.7
11 28 University of Illinois at Urbana-Champaign US 78.6 75.2 88.3 85.7 81.6
12 37 University of British Columbia CA 73.6 61.8 95.0 96.0 81.2
13 30 Agro, ParisTech FR 85.9 99.0 78.2 63.1 81.1
14 9 Texas A&M University US 83.1 63.7 83.8 81.8 81.0
15 18 The University of Queensland (UQ) AU 71.5 87.1 90.0 90.8 80.6
16 23 University of Florida US 76.8 62.9 87.5 91.4 80.5
17 21 Michigan State University US 77.4 64.3 89.6 86.8 80.4
18 43 China Agricultural University CN 87.1 53.5 76.1 80.9 80.3
19 11= University of Reading GB 85.4 42.3 91.7 74.8 80.2
20 15= ETH Zurich (Swiss Federal Institute of Technology) CH 74.6 63.3 94.7 87.1 80.0
21 13 The University of Tokyo JP 77.4 82.2 83.6 79.6 79.6
22 10 Ohio State University US 76.4 68.4 87.2 83.8 79.2
23 24 University of Guelph CA 75.7 68.8 87.0 84.9 79.1
24 27 Universidade de São Paulo (USP) BR 81.9 63.2 75.7 81.8 78.8
25 31 University of Copenhagen DK 70.2 85.3 87.0 88.2 78.7
26 51-100 Norwegian University of Life Sciences (UMB) NO 87.3 24.5 87.4 74.8 78.5
27 14 North Carolina State University US 77.9 53.3 85.6 84.9 78.4
28= 11= University of Massachusetts, Amherst US 72.3 73.4 93.2 79.2 78.0
28= 17 University of Minnesota US 73.8 36.3 93.3 93.8 78.0
30 22 Universidade Estadual de Campinas (Unicamp) BR 79.1 70.0 79.6 77.3 77.9
31 15= Pennsylvania State University US 69.6 54.6 97.9 87.8 77.4
32 26 Colorado State University US 68.9 62.9 92.7 89.5 77.2
33 19 Massey University NZ 73.8 82.6 84.7 74.8 77.1
34 51-100 Universität Hohenheim DE 79.5 46.6 84.9 74.8 76.4
35 32 McGill University CA 63.4 72.3 95.3 90.5 76.1
36= 25 Kyoto University JP 72.7 78.5 80.4 76.8 75.6
36= 36 The University of Melbourne AU 63.2 82.8 91.4 87.1 75.6
38 45 Washington State University US 75.4 43.5 84.7 81.8 75.4
39 48 Kasetsart University TH 80.2 81.1 73.8 61.6 75.3
40 51-100 Pontificia Universidad Católica de Chile CL 72.6 77.0 84.2 71.0 75.0
41= 51-100 The University of Sydney AU 66.3 78.1 85.0 83.4 74.6
41= 51-100 The University of Western Australia (UWA) AU 68.3 63.6 87.0 83.4 74.6
41= 35 Yale University US 58.9 81.5 95.4 89.5 74.6
44 29 The University of Adelaide AU 65.4 74.2 88.4 83.0 74.4
45 51-100 Kansas State University US 71.2 58.6 86.2 76.8 74.1
46 47 University of California, Riverside (UCR) US 69.2 36.7 93.1 84.9 73.9
47 49 The University of Georgia US 63.7 57.8 89.2 88.8 73.2
48= 34 The University of Nottingham GB 68.1 52.9 90.3 77.8 73.0
48= 44 University of Ghent BE 67.1 41.6 88.7 87.5 73.0
50 51-100 Universidad de Buenos Aires AR 70.0 77.4 78.8 70.4 72.6
QS World University Rankings by Subject 2015
To view the complete rankings, visit www.TopUniversities.com

Architecture / Built Environment
2015
Instit
ution
Coun
try
Acad
emic
Emplo
yer
Citati
ons
H
Overa
ll
1 Massachusetts Institute of Technology (MIT) US 99.6 94.3 89.6 83.7 96.5
2 The Bartlett School of Architecture | UCL (University College
London)GB 100.0 87.2 91.3 83.7 96.2
3 Delft University of Technology NL 89.6 95.0 89.9 100.0 91.2
4 University of California, Berkeley (UCB) US 87.3 77.3 100.0 92.3 88.1
5 Harvard University US 88.2 99.1 85.1 74.0 87.6
6 National University of Singapore (NUS) SG 85.3 96.0 90.4 83.7 86.7
7 ETH Zurich (Swiss Federal Institute of Technology) CH 88.5 68.9 87.4 72.0 84.8
8 Tsinghua University CN 83.7 90.9 85.7 80.7 84.3
9 University of Cambridge GB 83.4 98.3 86.0 65.5 83.4
10 The University of Tokyo JP 82.4 89.8 74.2 72.0 81.3
11 Columbia University US 79.8 85.8 89.6 77.5 81.2
12 The Hong Kong Polytechnic University HK 76.3 85.9 94.8 92.3 80.7
13 University of Hong Kong (HKU) HK 80.8 72.2 87.7 79.2 80.5
14 Politecnico di Milano IT 78.2 92.7 79.2 74.0 79.3
15 The University of Melbourne AU 75.8 89.3 85.4 75.8 78.1
16 Tongji University CN 76.5 90.8 72.3 80.7 77.9
17 The University of Sydney AU 74.2 79.7 93.2 83.7 77.6
18 University of California, Los Angeles (UCLA) US 77.8 70.3 87.8 72.0 77.5
19 Seoul National University (SNU) KR 72.9 92.4 84.0 72.0 75.9
20 University of British Columbia CA 70.4 91.4 93.3 80.7 75.8
21 KTH, Royal Institute of Technology SE 73.3 75.6 89.1 75.8 75.4
22= The University of New South Wales (UNSW) AU 73.9 80.1 80.1 72.0 75.0
22= Universitat Politècnica de Catalunya ES 72.4 100.0 77.3 65.5 75.0
24 Ecole Polytechnique Fédérale de Lausanne (EPFL) CH 69.9 80.3 95.5 83.7 74.9
25 University of Illinois at Urbana-Champaign US 72.8 65.9 87.2 80.7 74.3
26 Georgia Institute of Technology (Georgia Tech) US 71.2 63.6 89.8 90.0 74.2
27 Cornell University US 73.9 72.8 79.8 67.8 73.8
28 Eindhoven University of Technology NL 69.4 70.2 95.4 82.2 73.4
29 Cardiff University GB 75.4 46.3 88.6 70.0 73.3
30 Stanford University US 67.6 91.0 90.2 72.0 72.6
31 Pontificia Universidad Católica de Chile CL 70.7 78.9 80.2 70.0 72.4
32 Kyoto University JP 72.8 78.2 70.0 63.0 72.1
33= RMIT University AU 71.3 92.8 76.9 50.6 71.9
33= Universidade de São Paulo (USP) BR 69.6 78.7 82.7 70.0 71.9
35 University of Pennsylvania US 73.4 66.3 73.7 63.0 71.7
36 University of Toronto CA 68.7 63.5 93.8 77.5 71.6
37 The University of Queensland (UQ) AU 68.0 80.2 83.5 70.0 71.0
38 Princeton University US 69.6 71.8 78.4 70.0 70.7
39 University of Salford GB 66.8 91.3 84.3 60.3 70.4
40 University of Newcastle AU 68.0 74.3 83.4 67.8 70.2
41= Monash University AU 63.5 94.2 87.1 74.0 70.0
41= Shanghai Jiao Tong University CN 64.4 81.8 90.3 77.5 70.0
41= University of Texas at Austin US 64.5 73.6 88.5 86.3 70.0
44 The University of Sheffield GB 70.8 49.5 85.1 67.8 69.8
45 The University of Auckland NZ 65.0 96.0 78.7 63.0 69.3
46 Technische Universität München DE 69.1 72.9 77.0 57.4 69.1
47 City University of Hong Kong HK 63.2 65.8 93.0 79.2 68.0
48 Oxford Brookes University GB 68.5 55.8 76.2 63.0 67.5
49= Texas A&M University US 60.2 83.7 88.3 80.7 67.4
49= University of Michigan US 64.8 60.0 87.9 72.0 67.4
Art & Design
2015
Instit
ution
Coun
try
Acad
emic
Emplo
yer
Citati
ons
H
Overa
ll
1 Royal College of Art GB 100.0 60.0 96.0
2 Parsons The New School for Design US 92.6 76.9 91.0
3 Rhode Island School of Design (RISD) US 92.5 62.5 89.5
4 Massachusetts Institute of Technology (MIT) US 88.7 94.0 89.2
5 Pratt Institute US 90.5 64.4 87.9
6 School of the Art Institute of Chicago (SAIC) US 90.7 43.0 85.9
7 California Institute of the Arts US 88.8 52.0 85.1
8 University of the Arts London GB 85.3 76.0 84.4
9 Art Center College of Design US 87.9 52.0 84.3
10= Glasgow School of Art (GSA) GB 86.6 43.0 82.2
10= Politecnico di Milano IT 82.4 79.9 82.2
12 Goldsmiths, University of London GB 82.3 74.4 81.5
13 University of Oxford GB 78.7 100.0 80.8
14 Aalto University FI 80.8 60.3 78.8
15 Yale University US 77.5 89.4 78.7
16 Carnegie Mellon University US 78.6 75.3 78.3
17 Stanford University US 76.3 94.1 78.1
18 University of California, Los Angeles (UCLA) US 76.3 88.6 77.5
19 Design Academy Eindhoven NL 78.6 59.1 76.7
20 RMIT University AU 76.3 78.1 76.5
21 Columbia University US 74.5 85.3 75.6
22= New York University (NYU) US 74.5 84.1 75.5
22= Universidad Nacional Autónoma de México (UNAM) MX 74.0 89.4 75.5
24 The Hong Kong Polytechnic University HK 74.1 86.3 75.3
25 The University of New South Wales (UNSW) AU 73.8 82.8 74.7
26 Tsinghua University CN 71.9 94.4 74.2
27 Ravensbourne GB 74.3 61.3 73.0
28 Shanghai Jiao Tong University CN 70.4 92.3 72.6
29 Pontificia Universidad Católica de Chile CL 71.8 79.2 72.5
30 School of Visual Arts (SVA) US 74.4 52.0 72.2
31 Tecnológico de Monterrey (ITESM) MX 70.4 85.4 71.9
32=École Nationale Supérieure de Création Industrielle, ENSCI
Les AteliersFR 75.0 43.0 71.8
32= Universidad de Buenos Aires AR 71.2 77.0 71.8
34 Universidade de São Paulo (USP) BR 70.5 82.9 71.7
35 Savannah College of Art and Design US 72.4 62.5 71.4
36 Cranbrook Academy of Art US 74.3 43.0 71.2
37 California College of the Arts US 74.2 43.0 71.1
38 National University of Singapore (NUS) SG 68.4 93.1 70.9
39 Royal Academy of Art, The Hague (KABK) NL 73.7 43.0 70.6
40 Loughborough University GB 69.6 75.4 70.2
41 National Taiwan University (NTU) TW 67.9 88.0 69.9
42= Auckland University of Technology NZ 68.6 78.7 69.6
42= Royal University College of Fine Arts SE 72.5 43.0 69.6
44 Academy of Fine Arts CZ 72.3 43.6 69.4
45 Emily Carr Institute of Art and Design CA 71.5 48.2 69.2
46 Nanyang Technological University (NTU) SG 67.4 84.1 69.1
47 Seoul National University (SNU) KR 66.6 88.6 68.8
48= The University of Melbourne AU 66.7 87.1 68.7
48= University of Chicago US 68.3 72.7 68.7
50 Monash University AU 66.9 83.7 68.6
To view the complete rankings, visit www.TopUniversities.com
NEWRanking NEW
Ranking

Biological Sciences
2015
2014
Instit
ution
Coun
try
Acad
emic
Emplo
yer
Citati
ons
H
Overa
ll
1 1 Harvard University US 95.7 99.4 96.6 100.0 97.4
2 2 University of Cambridge GB 95.1 100.0 96.2 90.7 94.8
3 4 University of Oxford GB 93.6 98.5 95.1 91.5 93.9
4 3 Massachusetts Institute of Technology (MIT) US 89.2 95.3 100.0 88.8 92.4
5 5 Stanford University US 89.9 91.4 92.7 88.9 90.5
6 7= California Institute of Technology (Caltech) US 100.0 73.6 95.7 68.9 88.5
7 6 University of California, Berkeley (UCB) US 89.8 90.9 93.4 80.0 88.4
8 17 National University of Singapore (NUS) SG 95.6 92.9 86.1 75.2 87.9
9 7= Yale University US 85.1 88.0 91.7 84.0 86.8
10 10 ETH Zurich (Swiss Federal Institute of Technology) CH 94.8 87.6 85.5 74.5 86.7
11 11 University of California, Los Angeles (UCLA) US 83.4 84.2 90.8 85.0 85.7
12= 19 Cornell University US 86.9 82.9 88.5 81.7 85.6
12= 12 University of California, San Francisco (UCSF) US 80.6 68.6 96.1 89.7 85.6
14 9 University of California, San Diego (UCSD) US 82.5 71.9 92.5 87.5 85.2
15 13= Imperial College London GB 83.8 88.8 88.2 80.5 84.6
16 13= Kyoto University JP 89.6 92.6 83.3 73.5 84.3
17= 20 UCL (University College London) GB 80.3 85.1 88.0 83.8 83.6
17= 28 University of Toronto CA 77.8 84.2 88.8 87.6 83.6
19 16 Princeton University US 89.0 83.8 90.8 67.4 83.5
20= 15 Columbia University US 78.1 82.9 90.6 81.3 82.5
20= 18 The University of Tokyo JP 86.4 91.1 82.3 73.0 82.5
22= 39= Johns Hopkins University US 72.9 78.0 91.0 90.3 82.3
22= 22 University of Edinburgh GB 79.6 72.7 91.3 81.3 82.3
24 24 University of Washington US 74.2 72.4 91.4 89.2 82.1
25 27 Duke University US 76.0 84.1 90.3 81.4 81.7
26 25 University of Pennsylvania US 69.9 87.0 92.2 87.6 81.6
27 23 The University of Melbourne AU 79.0 87.2 85.8 77.7 81.2
28 33 Ludwig-Maximilians-Universität München DE 73.0 79.1 91.5 84.4 81.1
29= 38 University of California, Davis (UCD) US 85.6 71.2 83.8 74.2 80.9
29= 26 University of Chicago US 79.3 68.7 90.9 78.4 80.9
31= 31= Rockefeller University US 76.2 56.8 100.0 78.1 80.7
31= 36 University of Michigan US 70.4 78.5 92.2 86.7 80.7
33 35 University of Wisconsin-Madison US 80.0 68.3 87.0 77.5 80.0
34= 46= McGill University CA 75.8 83.5 86.3 76.8 79.4
34= 39= Washington University in St. Louis US 70.0 68.9 93.0 85.0 79.4
36 49 University of Copenhagen DK 73.1 80.8 86.6 81.2 79.3
37 21 The University of Queensland (UQ) AU 77.4 81.8 84.5 75.3 79.1
38 29 Osaka University JP 74.4 87.9 85.5 75.0 78.7
39 31= University of British Columbia CA 76.7 79.8 84.5 74.7 78.5
40 51-100 Karolinska Institute SE 67.9 85.0 89.3 81.8 78.4
41 51-100 Technische Universität München DE 74.6 73.8 88.7 75.3 78.2
42 51-100 University of Helsinki FI 70.0 76.9 90.9 78.4 78.0
43 30 Australian National University (ANU) AU 84.2 86.1 81.7 58.4 77.3
44= 51-100 King's College London (KCL) GB 64.5 79.7 91.9 81.7 77.2
44= 34 Ruprecht-Karls-Universität Heidelberg DE 73.9 70.8 87.7 74.7 77.2
46 51-100 Ecole Polytechnique Fédérale de Lausanne (EPFL) CH 72.6 82.7 92.1 67.2 77.1
47 41 Uppsala University SE 76.0 70.4 85.9 71.3 76.7
48 51-100 Trinity College Dublin (TCD) IE 71.6 75.0 91.5 70.1 76.5
49 46= The University of Manchester GB 70.3 70.2 88.5 75.7 76.2
50 44 New York University (NYU) US 64.3 77.8 91.4 78.8 76.1
Business & Management Studies
2015
Instit
ution
Coun
try
Acad
emic
Emplo
yer
Citati
ons
H
Overa
ll
1 London Business School GB 100.0 97.9 88.1 86.6 96.8
2 Harvard University US 95.6 99.6 89.2 96.1 96.2
3 INSEAD FR 97.3 96.8 95.8 83.6 95.6
4 Stanford University US 91.5 92.7 90.8 93.3 92.0
5 University of Pennsylvania US 94.5 84.0 91.3 97.5 91.3
6 Massachusetts Institute of Technology (MIT) US 91.2 94.1 84.7 85.6 90.9
7 Università Commerciale Luigi Bocconi IT 87.7 93.4 89.0 91.7 89.9
8 University of Oxford GB 85.8 100.0 82.1 85.6 89.7
9 London School of Economics and Political Science (LSE) GB 90.8 93.2 83.5 79.2 89.6
10 Copenhagen Business School DK 89.8 85.2 86.1 94.0 88.5
11 National University of Singapore (NUS) SG 86.5 94.2 81.2 87.5 88.4
12 University of California, Berkeley (UCB) US 87.1 84.7 89.2 92.5 87.1
13= HEC Paris FR 86.4 89.7 91.1 75.4 86.8
13= University of Cambridge GB 79.0 99.6 83.7 90.1 86.8
15 The University of Melbourne AU 80.2 91.2 87.8 95.4 85.8
16 University of Chicago US 86.4 82.8 88.9 84.6 85.4
17 Erasmus University Rotterdam NL 85.5 79.9 90.0 96.1 85.3
18 The Hong Kong University of Science and Technology (HKUST) HK 84.6 86.1 88.5 81.5 85.1
19= New York University (NYU) US 83.5 80.6 89.5 94.7 84.4
19= The University of New South Wales (UNSW) AU 80.5 87.5 84.0 94.7 84.4
21 Columbia University US 81.6 84.7 85.8 89.2 83.7
22 University of California, Los Angeles (UCLA) US 81.8 85.4 88.5 81.5 83.5
23 University of Michigan US 82.1 76.8 87.7 96.8 82.5
24 University of Hong Kong (HKU) HK 77.9 88.9 82.3 84.6 82.3
25 Northwestern University US 85.9 74.2 86.1 82.6 82.1
26= The University of Warwick GB 81.3 78.1 85.5 93.3 82.0
26= Yale University US 77.5 88.1 88.1 80.4 82.0
28 The Chinese University of Hong Kong (CUHK) HK 77.6 84.4 84.3 84.6 81.0
29 ESADE Business School | Universitat Ramon Llull ES 83.5 81.5 78.9 67.8 80.9
30 The University of Manchester GB 77.4 79.9 83.7 95.4 80.6
31 Nanyang Technological University (NTU) SG 80.7 82.4 77.6 75.4 80.4
32 The University of Sydney AU 72.0 89.5 83.2 90.9 80.3
33 Seoul National University (SNU) KR 76.1 85.9 81.9 78.0 79.8
34 University of St Gallen (HSG) CH 73.5 83.2 85.1 85.6 78.8
35 Imperial College London GB 70.7 84.8 88.5 85.6 78.2
36= Australian National University (ANU) AU 77.0 80.7 78.9 75.4 78.1
36= McGill University CA 72.2 81.9 90.4 83.6 78.1
36= WU (Vienna University of Economics and Business) AT 77.3 76.1 83.3 82.6 78.1
39= Duke University US 76.4 72.5 91.9 88.4 78.0
39= Monash University AU 70.5 86.0 80.7 89.2 78.0
39= Stockholm School of Economics SE 75.8 77.3 86.7 82.6 78.0
39= University of Texas at Austin US 76.8 72.4 86.8 91.7 78.0
43= Peking University CN 73.4 85.1 81.1 75.4 77.9
43= University of Toronto CA 74.3 79.3 83.8 85.6 77.9
45 Korea University KR 72.7 83.1 85.9 79.2 77.8
46= City University of Hong Kong HK 74.4 75.3 84.9 93.3 77.6
46= The University of Auckland NZ 68.9 86.0 88.1 85.6 77.6
48= The University of Queensland (UQ) AU 70.9 81.7 83.9 90.9 77.4
48= Yonsei University KR 71.5 83.3 83.1 83.6 77.4
50= IMD CH 76.1 82.2 78.3 66.1 77.2
50= Singapore Management University SG 76.7 72.4 88.0 83.6 77.2
To view the complete rankings, visit www.TopUniversities.com
NEWRanking

Internationalization
In the international sphere we have liaison of�ces in La Plata, Argentina; Texas, United States of North America and Santiago de Compostela, Spain.
www.uaemex.mx
RedalycWe follow the practice of Open Access to global knowledge through Redalyc, our digital repository that stores 916 journals and more than 352,000 academic full text �les.
of academic traditionthat looks towards the future
186 Years
Culture3 theatres8 museums2 cultural centres
Faculty6,837 teaching faculty95% of the full-time professors has postgraduate studies We have faculty from 25 countries around the world
Our faculty includes 753 researchers, out of which 447 are recognized by SNI -Mexico’s National Research System-. 802 Research projects are held out in 2 institutes and 18 reasearch centres, covering areas such as susteinability, technological innovation and development, health and nutrition, agricultura and livestock, molecular biology and education.
Research
101 graduate programs: 42 master degrees (5 online), 14 doctoral degrees and 45 speciality degrees
168 undergraduate degrees (9 on line)
2nd place in the country among public universities due to the quality of our programs
AcademicPrograms
In the international sphere we have liaison of�ces in La Plata, Argentina; Texas, United States of America and Santiago de Compostela, Spain.
Internationalization
UAEM Universidad Autónomadel Estado de México
Located in the State of Mexico, which is situated in the center of the country
surrounding Mexico City

Internationalization
In the international sphere we have liaison of�ces in La Plata, Argentina; Texas, United States of North America and Santiago de Compostela, Spain.
www.uaemex.mx
RedalycWe follow the practice of Open Access to global knowledge through Redalyc, our digital repository that stores 916 journals and more than 352,000 academic full text �les.
of academic traditionthat looks towards the future
186 Years
Culture3 theatres8 museums2 cultural centres
Faculty6,837 teaching faculty95% of the full-time professors has postgraduate studies We have faculty from 25 countries around the world
Our faculty includes 753 researchers, out of which 447 are recognized by SNI -Mexico’s National Research System-. 802 Research projects are held out in 2 institutes and 18 reasearch centres, covering areas such as susteinability, technological innovation and development, health and nutrition, agricultura and livestock, molecular biology and education.
Research
101 graduate programs: 42 master degrees (5 online), 14 doctoral degrees and 45 speciality degrees
168 undergraduate degrees (9 on line)
2nd place in the country among public universities due to the quality of our programs
AcademicPrograms
In the international sphere we have liaison of�ces in La Plata, Argentina; Texas, United States of America and Santiago de Compostela, Spain.
Internationalization
UAEM Universidad Autónomadel Estado de México
Located in the State of Mexico, which is situated in the center of the country
surrounding Mexico City
Chemistry
2015
2014
Instit
ution
Coun
try
Acad
emic
Emplo
yer
Citati
ons
H
Overa
ll
1 1 Massachusetts Institute of Technology (MIT) US 100.0 95.7 93.9 97.7 97.5
2 2 University of California, Berkeley (UCB) US 98.1 88.8 98.2 100.0 96.6
3 3 University of Cambridge GB 99.2 100.0 89.5 88.9 95.4
4 4 Harvard University US 98.5 96.5 92.4 88.2 94.8
5 6 University of Oxford GB 97.7 98.5 87.8 89.6 94.3
6 5 Stanford University US 94.4 90.4 94.4 95.7 93.9
7 12 National University of Singapore (NUS) SG 95.8 94.8 90.3 91.3 93.6
8 7 ETH Zurich (Swiss Federal Institute of Technology) CH 95.0 93.1 87.6 90.4 92.2
9 9 The University of Tokyo JP 93.2 91.3 85.6 90.4 90.7
10 8 California Institute of Technology (Caltech) US 96.1 79.0 94.6 86.9 90.5
11 11 Imperial College London GB 90.2 89.1 91.1 90.6 90.2
12 10 University of California, Los Angeles (UCLA) US 89.3 79.1 100.0 92.0 89.9
13 14 Northwestern University US 92.3 70.8 93.7 99.7 89.8
14 13 Kyoto University JP 89.7 93.5 84.6 90.4 89.6
15 15 Peking University CN 87.5 87.7 85.6 90.4 87.7
16 22 Ecole Polytechnique Fédérale de Lausanne (EPFL) CH 87.0 82.1 91.9 89.4 87.5
17 23 Tsinghua University CN 83.8 86.0 86.5 96.6 87.3
18 44 Nanyang Technological University (NTU) SG 85.9 82.3 89.6 92.0 87.1
19 28= Osaka University JP 85.8 87.1 84.4 89.4 86.5
20 25 Technische Universität München DE 89.2 85.2 84.1 83.8 86.3
21 16 Seoul National University (SNU) KR 86.0 86.7 83.6 87.7 86.0
22 20 Tokyo Institute of Technology JP 90.7 85.9 80.2 81.6 85.8
23 35= University of Hong Kong (HKU) HK 86.1 88.7 88.1 79.7 85.7
24 28= University of Toronto CA 85.9 75.2 90.2 90.6 85.6
25 19 The Hong Kong University of Science and Technology (HKUST) HK 82.0 88.7 90.7 83.5 85.4
26= 17= KAIST - Korea Advanced Institute of Science and Technology KR 84.5 81.9 88.1 86.3 85.1
26= 17= Yale University US 85.7 78.9 92.7 82.3 85.1
28= 37 National Taiwan University (NTU) TW 80.7 90.2 83.8 85.5 84.2
28= 24 University of Texas at Austin US 81.1 72.5 93.7 92.6 84.2
30 51-100 McGill University CA 81.3 83.9 88.8 82.6 83.6
31 51-100 Georgia Institute of Technology (Georgia Tech) US 79.4 77.0 91.0 90.8 83.5
32 35= Princeton University US 82.3 78.0 91.4 81.6 83.1
33 21 University of Illinois at Urbana-Champaign US 82.9 68.6 92.0 88.4 83.0
34 31= Monash University AU 80.5 80.5 86.8 86.3 82.9
35 48 Cornell University US 79.7 80.6 89.3 84.1 82.7
36= 40 The University of Manchester GB 81.3 82.3 84.6 83.5 82.6
36= 30 University of North Carolina, Chapel Hill US 81.4 68.6 94.5 87.1 82.6
38 41 University of Michigan US 76.7 78.2 91.9 89.2 82.5
39 49= University of Pennsylvania US 78.0 79.9 91.3 84.7 82.4
40 51-100 Rheinisch-Westfälische Technische Hochschule Aachen DE 79.7 80.9 86.0 85.0 82.3
41= 34 Tohoku University JP 82.0 84.1 80.0 82.9 82.2
41= 47 University of California, San Diego (UCSD) US 84.3 67.3 89.9 85.0 82.2
43 31= Columbia University US 81.2 82.3 88.4 77.2 82.1
44 49= Nagoya University JP 82.0 80.5 83.6 81.3 81.9
45= 51-100 Delft University of Technology NL 75.1 91.1 91.3 76.4 81.8
45= 26 The University of Melbourne AU 80.9 85.6 86.7 74.8 81.8
47= 51-100 Texas A&M University US 76.9 70.3 93.5 89.9 81.5
47= 51-100 University of Wisconsin-Madison US 79.5 73.0 88.3 87.1 81.5
49 27 Ludwig-Maximilians-Universität München DE 83.5 73.3 85.7 81.0 81.4
50 51-100 UCL (University College London) GB 79.6 82.7 84.9 79.0 81.2
Communication & Media Studies
2015
2014
Instit
ution
Coun
try
Acad
emic
Emplo
yer
Citati
ons
H
Overa
ll
1 4 University of Southern California US 99.0 77.7 95.1 99.2 96.1
2 1 University of Wisconsin-Madison US 100.0 74.0 93.0 96.7 95.3
3 8 Stanford University US 89.3 97.1 97.3 93.0 92.4
4 5 University of Texas at Austin US 90.3 76.5 92.8 100.0 91.4
5 2 London School of Economics and Political Science (LSE) GB 88.9 100.0 92.4 89.8 90.9
6 11 Michigan State University US 86.2 68.8 97.2 100.0 89.4
7 3 University of California, Berkeley (UCB) US 88.2 93.9 88.5 89.8 89.2
8 10 University of Amsterdam NL 84.4 81.5 95.2 97.6 88.9
9 12 University of Pennsylvania US 90.8 86.1 85.5 86.3 88.4
10= 15 University of California, Los Angeles (UCLA) US 80.6 91.6 91.4 87.5 85.2
10= 7 University of Illinois at Urbana-Champaign US 88.9 69.1 85.6 83.6 85.2
12 19= University of Michigan US 79.1 81.8 88.6 89.8 83.4
13= 9 National University of Singapore (NUS) SG 82.7 97.6 82.1 77.4 83.0
13= 14 Northwestern University US 76.7 75.0 93.9 92.0 83.0
15 6 Nanyang Technological University (NTU) SG 83.1 89.0 81.8 79.1 82.6
16= 13 Columbia University US 85.6 91.2 76.7 75.6 82.4
16= 31 Ohio State University US 71.1 72.0 100.0 98.4 82.4
16= 41 University of California, Santa Barbara (UCSB) US 81.9 62.4 90.8 85.0 82.4
19 18 New York University (NYU) US 81.7 87.4 82.1 80.7 82.2
20 17 Cornell University US 70.2 84.1 95.5 95.8 81.8
21 24 University of North Carolina, Chapel Hill US 78.6 63.9 92.4 87.5 81.7
22 Goldsmiths, University of London GB 95.8 61.8 69.5 66.9 81.4
23 19= The Chinese University of Hong Kong (CUHK) HK 80.3 88.0 84.6 75.6 81.0
24 19= Monash University AU 78.6 90.7 79.0 79.1 80.0
25 27 Queensland University of Technology (QUT) AU 78.4 83.2 88.3 73.6 79.9
26= 22 The University of Melbourne AU 72.4 97.0 79.4 79.1 77.6
26= 25= The University of Queensland (UQ) AU 73.2 86.8 80.9 80.7 77.6
28= 23 City University London GB 85.4 73.5 68.9 66.9 77.2
28= 34 University of Missouri, Columbia US 80.2 60.2 81.8 73.6 77.2
30 32 Indiana University Bloomington US 70.5 70.9 85.8 87.5 77.0
31= 37 Purdue University US 70.1 74.9 87.6 83.6 76.8
31= 33 University of Florida US 75.4 61.7 84.1 80.7 76.8
31= 40 University of Westminster GB 88.1 56.5 68.7 66.9 76.8
34 43 University of California, San Diego (UCSD) US 71.8 70.4 86.2 82.2 76.6
35 51-100 University of Minnesota US 69.1 67.0 86.6 87.5 76.1
36 44 Aarhus University DK 71.2 80.3 84.2 75.6 75.6
37 16 Massachusetts Institute of Technology (MIT) US 72.0 98.8 77.2 66.9 74.7
38 38 Yale University US 68.7 91.5 79.7 75.6 74.6
39 51-100 Syracuse University US 73.0 52.6 83.0 79.1 74.2
40 42 University of Oslo NO 69.3 70.9 83.6 77.4 73.9
41 51-100 University of Illinois, Chicago (UIC) US 69.7 62.8 85.0 75.6 73.3
42 35 Yonsei University KR 65.6 87.7 90.7 66.9 73.1
43 48= Loughborough University GB 65.2 64.2 87.9 82.2 73.0
44= 36 Pennsylvania State University US 61.2 72.1 86.6 88.7 72.9
44= 51-100 University of Technology, Sydney (UTS) AU 67.4 89.9 77.2 73.6 72.9
46 51-100 University of Leeds GB 69.2 78.4 77.5 73.6 72.7
47 51-100 City University of New York US 67.7 58.2 79.1 85.0 72.5
48 51-100 University of Washington US 55.6 72.3 92.9 93.0 72.2
49= 51-100 The University of New South Wales (UNSW) AU 64.6 94.4 78.2 73.6 72.1
49= 51-100 University of Copenhagen DK 63.4 82.1 83.5 77.4 72.1
49= 51-100 University of Helsinki FI 64.3 75.0 84.9 77.4 72.1
To view the complete rankings, visit www.TopUniversities.com
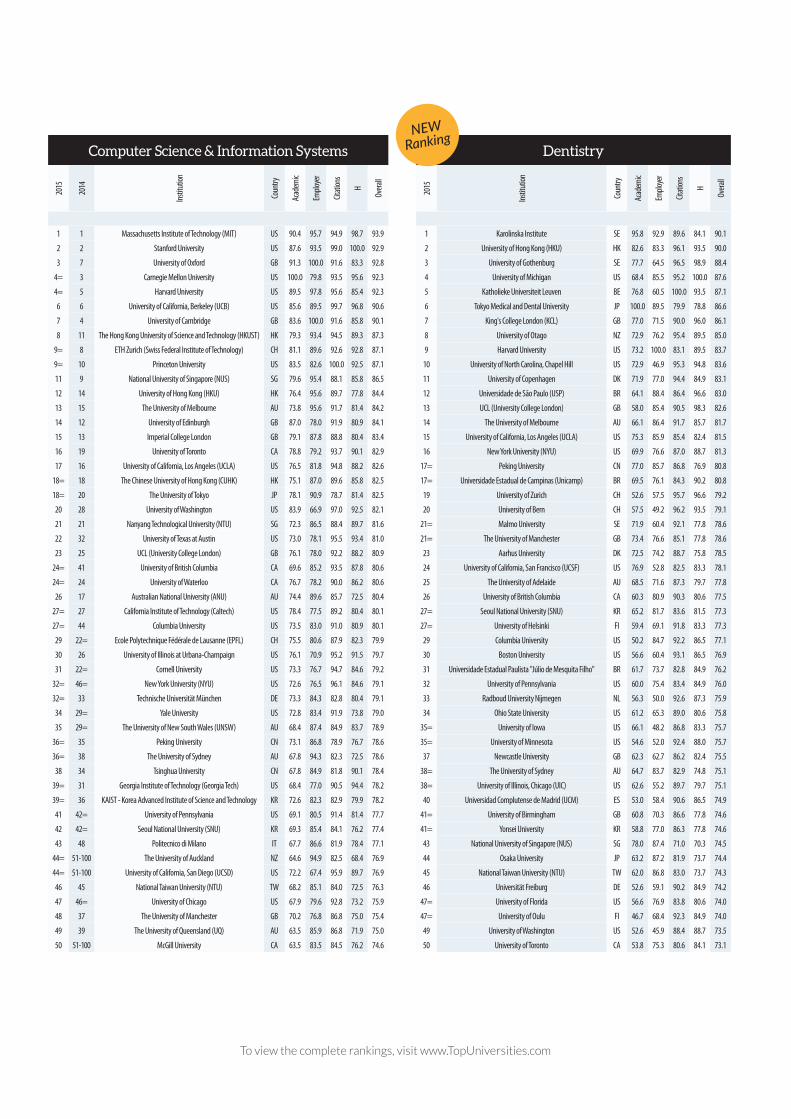
Computer Science & Information Systems
2015
2014
Instit
ution
Coun
try
Acad
emic
Emplo
yer
Citati
ons
H
Overa
ll
1 1 Massachusetts Institute of Technology (MIT) US 90.4 95.7 94.9 98.7 93.9
2 2 Stanford University US 87.6 93.5 99.0 100.0 92.9
3 7 University of Oxford GB 91.3 100.0 91.6 83.3 92.8
4= 3 Carnegie Mellon University US 100.0 79.8 93.5 95.6 92.3
4= 5 Harvard University US 89.5 97.8 95.6 85.4 92.3
6 6 University of California, Berkeley (UCB) US 85.6 89.5 99.7 96.8 90.6
7 4 University of Cambridge GB 83.6 100.0 91.6 85.8 90.1
8 11 The Hong Kong University of Science and Technology (HKUST) HK 79.3 93.4 94.5 89.3 87.3
9= 8 ETH Zurich (Swiss Federal Institute of Technology) CH 81.1 89.6 92.6 92.8 87.1
9= 10 Princeton University US 83.5 82.6 100.0 92.5 87.1
11 9 National University of Singapore (NUS) SG 79.6 95.4 88.1 85.8 86.5
12 14 University of Hong Kong (HKU) HK 76.4 95.6 89.7 77.8 84.4
13 15 The University of Melbourne AU 73.8 95.6 91.7 81.4 84.2
14 12 University of Edinburgh GB 87.0 78.0 91.9 80.9 84.1
15 13 Imperial College London GB 79.1 87.8 88.8 80.4 83.4
16 19 University of Toronto CA 78.8 79.2 93.7 90.1 82.9
17 16 University of California, Los Angeles (UCLA) US 76.5 81.8 94.8 88.2 82.6
18= 18 The Chinese University of Hong Kong (CUHK) HK 75.1 87.0 89.6 85.8 82.5
18= 20 The University of Tokyo JP 78.1 90.9 78.7 81.4 82.5
20 28 University of Washington US 83.9 66.9 97.0 92.5 82.1
21 21 Nanyang Technological University (NTU) SG 72.3 86.5 88.4 89.7 81.6
22 32 University of Texas at Austin US 73.0 78.1 95.5 93.4 81.0
23 25 UCL (University College London) GB 76.1 78.0 92.2 88.2 80.9
24= 41 University of British Columbia CA 69.6 85.2 93.5 87.8 80.6
24= 24 University of Waterloo CA 76.7 78.2 90.0 86.2 80.6
26 17 Australian National University (ANU) AU 74.4 89.6 85.7 72.5 80.4
27= 27 California Institute of Technology (Caltech) US 78.4 77.5 89.2 80.4 80.1
27= 44 Columbia University US 73.5 83.0 91.0 80.9 80.1
29 22= Ecole Polytechnique Fédérale de Lausanne (EPFL) CH 75.5 80.6 87.9 82.3 79.9
30 26 University of Illinois at Urbana-Champaign US 76.1 70.9 95.2 91.5 79.7
31 22= Cornell University US 73.3 76.7 94.7 84.6 79.2
32= 46= New York University (NYU) US 72.6 76.5 96.1 84.6 79.1
32= 33 Technische Universität München DE 73.3 84.3 82.8 80.4 79.1
34 29= Yale University US 72.8 83.4 91.9 73.8 79.0
35 29= The University of New South Wales (UNSW) AU 68.4 87.4 84.9 83.7 78.9
36= 35 Peking University CN 73.1 86.8 78.9 76.7 78.6
36= 38 The University of Sydney AU 67.8 94.3 82.3 72.5 78.6
38 34 Tsinghua University CN 67.8 84.9 81.8 90.1 78.4
39= 31 Georgia Institute of Technology (Georgia Tech) US 68.4 77.0 90.5 94.4 78.2
39= 36 KAIST - Korea Advanced Institute of Science and Technology KR 72.6 82.3 82.9 79.9 78.2
41 42= University of Pennsylvania US 69.1 80.5 91.4 81.4 77.7
42 42= Seoul National University (SNU) KR 69.3 85.4 84.1 76.2 77.4
43 48 Politecnico di Milano IT 67.7 86.6 81.9 78.4 77.1
44= 51-100 The University of Auckland NZ 64.6 94.9 82.5 68.4 76.9
44= 51-100 University of California, San Diego (UCSD) US 72.2 67.4 95.9 89.7 76.9
46 45 National Taiwan University (NTU) TW 68.2 85.1 84.0 72.5 76.3
47 46= University of Chicago US 67.9 79.6 92.8 73.2 75.9
48 37 The University of Manchester GB 70.2 76.8 86.8 75.0 75.4
49 39 The University of Queensland (UQ) AU 63.5 85.9 86.8 71.9 75.0
50 51-100 McGill University CA 63.5 83.5 84.5 76.2 74.6
Dentistry
2015
Instit
ution
Coun
try
Acad
emic
Emplo
yer
Citati
ons
H
Overa
ll
1 Karolinska Institute SE 95.8 92.9 89.6 84.1 90.1
2 University of Hong Kong (HKU) HK 82.6 83.3 96.1 93.5 90.0
3 University of Gothenburg SE 77.7 64.5 96.5 98.9 88.4
4 University of Michigan US 68.4 85.5 95.2 100.0 87.6
5 Katholieke Universiteit Leuven BE 76.8 60.5 100.0 93.5 87.1
6 Tokyo Medical and Dental University JP 100.0 89.5 79.9 78.8 86.6
7 King's College London (KCL) GB 77.0 71.5 90.0 96.0 86.1
8 University of Otago NZ 72.9 76.2 95.4 89.5 85.0
9 Harvard University US 73.2 100.0 83.1 89.5 83.7
10 University of North Carolina, Chapel Hill US 72.9 46.9 95.3 94.8 83.6
11 University of Copenhagen DK 71.9 77.0 94.4 84.9 83.1
12 Universidade de São Paulo (USP) BR 64.1 88.4 86.4 96.6 83.0
13 UCL (University College London) GB 58.0 85.4 90.5 98.3 82.6
14 The University of Melbourne AU 66.1 86.4 91.7 85.7 81.7
15 University of California, Los Angeles (UCLA) US 75.3 85.9 85.4 82.4 81.5
16 New York University (NYU) US 69.9 76.6 87.0 88.7 81.3
17= Peking University CN 77.0 85.7 86.8 76.9 80.8
17= Universidade Estadual de Campinas (Unicamp) BR 69.5 76.1 84.3 90.2 80.8
19 University of Zurich CH 52.6 57.5 95.7 96.6 79.2
20 University of Bern CH 57.5 49.2 96.2 93.5 79.1
21= Malmo University SE 71.9 60.4 92.1 77.8 78.6
21= The University of Manchester GB 73.4 76.6 85.1 77.8 78.6
23 Aarhus University DK 72.5 74.2 88.7 75.8 78.5
24 University of California, San Francisco (UCSF) US 76.9 52.8 82.5 83.3 78.1
25 The University of Adelaide AU 68.5 71.6 87.3 79.7 77.8
26 University of British Columbia CA 60.3 80.9 90.3 80.6 77.5
27= Seoul National University (SNU) KR 65.2 81.7 83.6 81.5 77.3
27= University of Helsinki FI 59.4 69.1 91.8 83.3 77.3
29 Columbia University US 50.2 84.7 92.2 86.5 77.1
30 Boston University US 56.6 60.4 93.1 86.5 76.9
31 Universidade Estadual Paulista "Júlio de Mesquita Filho" BR 61.7 73.7 82.8 84.9 76.2
32 University of Pennsylvania US 60.0 75.4 83.4 84.9 76.0
33 Radboud University Nijmegen NL 56.3 50.0 92.6 87.3 75.9
34 Ohio State University US 61.2 65.3 89.0 80.6 75.8
35= University of Iowa US 66.1 48.2 86.8 83.3 75.7
35= University of Minnesota US 54.6 52.0 92.4 88.0 75.7
37 Newcastle University GB 62.3 62.7 86.2 82.4 75.5
38= The University of Sydney AU 64.7 83.7 82.9 74.8 75.1
38= University of Illinois, Chicago (UIC) US 62.6 55.2 89.7 79.7 75.1
40 Universidad Complutense de Madrid (UCM) ES 53.0 58.4 90.6 86.5 74.9
41= University of Birmingham GB 60.8 70.3 86.6 77.8 74.6
41= Yonsei University KR 58.8 77.0 86.3 77.8 74.6
43 National University of Singapore (NUS) SG 78.0 87.4 71.0 70.3 74.5
44 Osaka University JP 63.2 87.2 81.9 73.7 74.4
45 National Taiwan University (NTU) TW 62.0 86.8 83.0 73.7 74.3
46 Universität Freiburg DE 52.6 59.1 90.2 84.9 74.2
47= University of Florida US 56.6 76.9 83.8 80.6 74.0
47= University of Oulu FI 46.7 68.4 92.3 84.9 74.0
49 University of Washington US 52.6 45.9 88.4 88.7 73.5
50 University of Toronto CA 53.8 75.3 80.6 84.1 73.1
To view the complete rankings, visit www.TopUniversities.com
NEWRanking

Development Studies
2015
Instit
ution
Coun
try
Acad
emic
Emplo
yer
Citati
ons
H
Overa
ll
1 University of Sussex GB 100.0 44.6 90.0 85.0 90.7
2 Harvard University US 87.6 100.0 93.4 83.2 89.1
3 The University of Manchester GB 85.0 84.3 94.8 98.9 88.5
4 University of Oxford GB 82.3 99.0 90.2 100.0 87.8
5 London School of Economics and Political Science (LSE) GB 83.9 92.0 90.9 95.4 87.5
6 University of California, Berkeley (UCB) US 82.1 84.4 100.0 92.8 86.6
7 University of Cape Town ZA 84.8 87.6 92.2 81.3 85.7
8 University of Cambridge GB 79.9 96.2 91.0 92.8 85.1
9 Stanford University US 77.5 92.7 95.1 81.3 82.2
10 Australian National University (ANU) AU 75.5 91.5 87.3 85.0 80.3
11 University of East Anglia (UEA) GB 77.5 37.9 94.8 81.3 76.7
12 University of California, Los Angeles (UCLA) US 73.6 83.0 91.9 69.1 76.6
13=SOAS - School of Oriental and African Studies, University
of London GB 72.1 69.8 86.8 86.7 76.3
13= University of Copenhagen DK 73.0 80.0 86.6 77.0 76.3
15 University of The Witwatersrand ZA 75.3 86.6 80.1 65.9 75.7
16 The University of Tokyo JP 72.1 88.4 81.1 72.0 75.1
17 University of Delhi IN 70.6 86.6 79.1 79.2 74.8
18 Princeton University US 75.1 90.5 73.4 62.4 74.5
19 The University of Melbourne AU 70.2 82.8 84.5 74.6 74.3
20 University of Toronto CA 68.4 54.9 90.7 85.0 72.9
21 The University of Queensland (UQ) AU 60.4 76.5 97.8 94.1 72.7
22 University of Hong Kong (HKU) HK 66.0 74.4 92.8 77.0 72.5
23 The University of Auckland NZ 69.6 89.8 77.0 65.9 72.2
24 University of Amsterdam NL 64.3 72.1 92.4 81.3 71.8
25 University of Edinburgh GB 65.3 80.5 86.0 77.0 71.7
26= Johns Hopkins University US 65.7 74.8 87.8 77.0 71.6
26= Wageningen University NL 65.7 44.8 91.8 92.8 71.6
28= King's College London (KCL) GB 65.8 78.6 83.8 69.1 70.3
28= Universidad Nacional Autónoma de México (UNAM) MX 78.2 75.9 57.1 48.3 70.3
30 The University of Sydney AU 64.4 74.4 85.1 72.0 69.6
31 Uppsala University SE 69.5 51.6 78.7 72.0 69.5
32 Universiti Malaya (UM) MY 69.0 81.8 65.2 65.9 69.2
33 Makerere University UG 73.3 59.6 62.0 53.8 67.3
34= University of Birmingham GB 55.5 71.6 89.2 88.4 67.1
34= University of Chicago US 62.5 85.7 78.0 62.4 67.1
36 Brown University US 60.3 73.4 84.9 69.1 66.6
37 University of Reading GB 57.7 44.8 92.6 88.4 66.3
38 Monash University AU 53.1 76.8 90.9 86.7 66.2
39 Katholieke Universiteit Leuven BE 58.2 51.7 94.1 79.2 66.1
40 National Taiwan University (NTU) TW 61.9 94.5 68.3 58.4 65.6
41 Universidade Federal do Rio de Janeiro BR 67.3 63.5 66.7 58.4 65.5
42 McGill University CA 63.4 53.8 79.8 65.9 65.3
43 American University in Cairo EG 67.8 59.2 64.4 53.8 64.3
44 Universidad de Los Andes Colombia CO 65.0 73.6 64.1 53.8 64.0
45 University College Dublin (UCD) IE 61.7 57.0 77.4 62.4 63.7
46 Stellenbosch University ZA 54.2 78.3 80.5 74.6 63.6
47= The University of Sheffield GB 53.3 54.5 88.9 81.3 63.0
47= University of Bath GB 56.2 52.1 83.2 77.0 63.0
47= University of Nairobi KE 64.7 33.4 72.7 65.9 63.0
50= Georg-August-Universität Göttingen DE 56.4 38.4 89.2 79.2 62.9
50= Lund University SE 58.4 51.7 82.2 69.1 62.9
Earth & Marine Sciences
2015
2014
Instit
ution
Coun
try
Acad
emic
Emplo
yer
Citati
ons
H
Overa
ll
1 9 ETH Zurich (Swiss Federal Institute of Technology) CH 100.0 86.8 93.5 94.1 95.6
2 3 University of California, Berkeley (UCB) US 90.8 93.6 92.9 95.5 92.8
3 1 Harvard University US 88.7 99.0 92.4 96.7 92.7
4 7 University of Oxford GB 90.1 96.4 94.6 92.1 92.4
5 5 Massachusetts Institute of Technology (MIT) US 93.1 95.2 90.8 90.2 92.0
6 2 University of Cambridge GB 92.4 95.8 90.2 90.7 91.8
7 4 California Institute of Technology (Caltech) US 88.6 75.3 90.3 100.0 90.5
8 6 Columbia University US 84.7 75.4 97.9 96.4 90.0
9 8 Stanford University US 87.0 93.6 91.4 91.0 89.8
10 21= University of Washington US 85.4 62.7 95.2 97.3 88.6
11 10 University of California, Los Angeles (UCLA) US 84.3 86.0 93.3 88.1 87.7
12 12 Australian National University (ANU) AU 87.9 81.2 90.0 86.3 87.4
13 11 University of California, San Diego (UCSD) US 86.2 63.0 91.4 91.0 86.4
14 16 University of Colorado at Boulder US 78.4 68.1 92.9 99.2 86.2
15= 21= University of Bristol GB 85.0 66.4 94.0 86.3 85.7
15= 15 University of Edinburgh GB 83.6 78.4 90.9 86.9 85.7
15= 33 Utrecht University NL 83.6 82.3 90.5 85.6 85.7
18 13 The University of Tokyo JP 84.4 78.1 85.8 90.2 85.6
19 14 Princeton University US 74.7 80.6 98.1 91.3 85.3
20 36 University of Leeds GB 83.0 65.9 92.8 86.6 84.6
21 24 Yale University US 78.2 85.2 93.6 85.0 84.5
22 32 University of Toronto CA 76.0 78.4 94.4 89.9 84.3
23 17 Imperial College London GB 83.7 89.0 85.7 80.6 84.0
24 27= University of British Columbia CA 76.2 81.7 93.1 86.0 83.4
25 23 University of Texas at Austin US 75.0 75.7 92.2 90.2 83.2
26 34= University of Hong Kong (HKU) HK 73.4 84.0 93.7 85.3 82.5
27 25= Durham University GB 75.7 75.2 91.3 86.9 82.4
28 30 University of Southampton GB 83.0 70.0 85.0 81.0 81.7
29 19= University of Arizona US 76.6 46.9 92.7 92.1 81.5
30 18 University of Chicago US 69.1 70.5 100.0 86.0 81.2
31 19= University of Michigan US 73.2 77.8 88.4 87.2 81.0
32 27= UCL (University College London) GB 78.7 72.1 86.9 81.7 80.8
33 51-100 Delft University of Technology NL 79.5 100.0 77.9 77.2 80.6
34 37 The University of Melbourne AU 77.8 81.7 87.2 76.8 80.3
35 43 Colorado School of Mines US 88.7 76.1 80.5 67.2 80.0
36 25= Pennsylvania State University US 71.6 57.3 90.5 90.7 79.7
37= 51-100 Texas A&M University US 72.4 82.8 84.5 84.6 79.5
37= 50 Universität Bremen DE 80.2 49.6 88.6 81.4 79.5
37= 51-100 Université Joseph Fourier - Grenoble 1 FR 78.5 55.8 87.7 82.5 79.5
40 31 Cornell University US 65.6 91.5 94.0 82.1 79.4
41 51-100 University of California, Davis (UCD) US 67.4 81.9 90.4 84.3 78.8
42 101-150
University of Bergen NO 74.4 70.9 87.9 79.4 78.7
43 44 Peking University CN 65.4 88.3 86.2 86.6 78.2
44= 34= Kyoto University JP 74.3 90.5 80.6 76.8 78.1
44= 39 The University of Western Australia (UWA) AU 74.7 85.0 82.7 76.3 78.1
44= 51-100 University of Minnesota US 65.5 73.7 93.9 84.3 78.1
44= 51-100 University of Wisconsin-Madison US 65.4 78.4 89.9 86.3 78.1
48 51-100 McGill University CA 71.9 86.5 85.3 76.3 77.8
49= 27= National Taiwan University (NTU) TW 71.6 82.2 83.1 78.1 77.2
49= 40= Tokyo Institute of Technology JP 67.4 76.0 89.8 80.6 77.2
50= 51-100 Université de Montréal CA 54.9 63.8 35.2 70.4 55.0
To view the complete rankings, visit www.TopUniversities.com
NEWRanking

Economics & Econometrics
2015
2014
Instit
ution
Coun
try
Acad
emic
Emplo
yer
Citati
ons
H
Overa
ll
1 2 Massachusetts Institute of Technology (MIT) US 100.0 93.4 97.7 94.0 97.0
2 1 Harvard University US 92.6 98.9 98.6 100.0 96.5
3 4 Stanford University US 87.1 92.5 96.4 94.0 91.4
4 3 London School of Economics and Political Science (LSE) GB 88.0 95.3 91.9 90.6 90.8
5 5= University of Chicago US 87.2 81.7 100.0 97.3 90.7
6 7 Princeton University US 90.0 82.5 98.6 91.0 90.4
7 5= University of California, Berkeley (UCB) US 86.4 84.7 97.8 95.7 90.2
8 12 University of Oxford GB 84.1 100.0 89.5 86.4 88.8
9 10 University of Cambridge GB 82.4 99.8 91.7 86.8 88.6
10 8 Yale University US 84.1 86.8 95.0 89.4 87.9
11 11 Columbia University US 79.5 85.8 94.9 91.8 86.3
12 9 University of Pennsylvania US 78.4 84.0 94.4 91.0 85.2
13 13 New York University (NYU) US 77.9 79.7 95.0 91.4 84.4
14 14 University of California, Los Angeles (UCLA) US 78.5 82.0 94.8 86.4 84.0
15 15 Northwestern University US 80.5 69.7 97.1 89.0 83.4
16 17 UCL (University College London) GB 76.4 82.2 91.6 79.7 81.3
17 20 Università Commerciale Luigi Bocconi IT 71.1 87.8 92.1 80.2 80.5
18 29 University of California, San Diego (UCSD) US 74.3 65.8 99.8 85.9 80.0
19 26= University of Michigan US 71.5 75.4 94.3 84.5 79.4
20 25 Duke University US 70.5 74.0 94.3 85.9 79.0
21 16 National University of Singapore (NUS) SG 77.4 90.8 82.7 64.7 78.6
22 22 Cornell University US 70.5 79.4 87.6 79.7 77.5
23 40 Universitat Pompeu Fabra ES 78.5 63.2 91.7 75.3 77.4
24 23 The University of Melbourne AU 70.9 88.6 82.9 73.1 77.3
25 26= University of Toronto CA 70.3 77.6 89.1 77.9 77.0
26= 18 Australian National University (ANU) AU 75.1 80.8 82.8 70.9 76.9
26= 31 London Business School GB 65.1 92.4 89.7 72.4 76.9
26= 36 University of British Columbia CA 69.7 78.0 90.4 76.6 76.9
29 21 The University of Warwick GB 73.6 80.9 84.4 71.6 76.8
30 30 The Hong Kong University of Science and Technology (HKUST) HK 72.4 82.9 87.6 62.7 75.6
31 32 Stockholm School of Economics SE 69.8 76.0 88.5 70.9 75.0
32 47 Boston University US 68.8 70.2 91.1 74.6 74.7
33= 39 Brown University US 67.4 68.3 92.7 75.9 74.3
33= 33 Peking University CN 67.5 86.2 84.7 65.7 74.3
35 19 The University of Tokyo JP 75.6 88.0 76.5 54.1 74.0
36 28 University of Hong Kong (HKU) HK 69.3 85.2 82.9 62.7 73.9
37 50 Tilburg University NL 71.2 61.2 86.6 75.9 73.2
38= 24 Monash University AU 67.2 82.6 80.5 67.5 73.0
38= 46 Universidad Carlos III de Madrid ES 70.5 69.2 85.4 69.2 73.0
40 38 Erasmus University Rotterdam NL 66.9 80.1 83.3 67.5 72.9
41= 51-100 University of Amsterdam NL 64.2 72.8 86.3 75.9 72.7
41= 51-100 University of Minnesota US 66.4 60.2 90.7 79.7 72.7
43 35 Seoul National University (SNU) KR 72.2 85.3 79.4 54.1 72.6
44 41 ETH Zurich (Swiss Federal Institute of Technology) CH 61.4 82.7 85.8 70.9 72.4
45= 51-100 California Institute of Technology (Caltech) US 68.5 73.1 84.8 66.6 72.3
45= 45 The University of New South Wales (UNSW) AU 64.8 86.6 80.6 64.7 72.3
45= 51-100 Université Catholique de Louvain (UCL) BE 68.2 72.9 83.8 68.4 72.3
48 48 The University of Sydney AU 56.9 86.8 85.5 73.9 72.0
49 34 The Chinese University of Hong Kong (CUHK) HK 66.5 80.0 84.3 61.6 71.8
50= 51-100 Carnegie Mellon University US 60.0 70.1 92.4 74.6 71.4
50= 51-100 Rheinische Friedrich-Wilhelms-Universität Bonn DE 66.8 60.6 88.0 74.6 71.4
Education
2015
2014
Instit
ution
Coun
try
Acad
emic
Emplo
yer
Citati
ons
H
Overa
ll
1 1 UCL Institute of Education | University College London GB 100.0 90.2 94.2 96.3 97.1
2 3 Harvard University US 86.5 100.0 96.8 97.9 92.2
3 5 Stanford University US 83.1 91.2 100.0 100.0 90.7
4 4 University of Cambridge GB 84.5 97.7 90.2 85.4 87.1
5 2 The University of Melbourne AU 85.6 87.9 89.4 84.6 86.4
6 16 University of Hong Kong (HKU) HK 84.9 84.7 89.4 85.4 85.9
7 7 University of Oxford GB 83.8 98.1 88.7 81.0 85.7
8 13 University of California, Los Angeles (UCLA) US 76.6 86.4 97.1 96.3 85.6
9 8 The University of Sydney AU 82.2 87.5 89.3 87.8 85.3
10 14 Nanyang Technological University (NTU) SG 82.4 78.7 91.4 89.2 85.2
11 12 University of California, Berkeley (UCB) US 80.1 80.3 93.2 89.2 84.6
12= 11 Columbia University US 79.0 84.0 90.6 90.0 84.0
12= 20 University of Michigan US 73.7 78.0 96.7 100.0 84.0
14 15 University of Wisconsin-Madison US 80.4 73.5 89.2 87.8 83.0
15 51-100 The Hong Kong Institute of Education HK 82.1 76.4 87.5 81.9 82.6
16 6 Monash University AU 77.0 85.6 89.3 87.8 82.5
17 9 University of Toronto CA 75.1 78.7 89.5 90.0 81.3
18 24 University of British Columbia CA 73.6 83.2 91.6 87.8 81.0
19 21 Michigan State University US 74.8 67.5 91.4 92.0 80.8
20 25 The Chinese University of Hong Kong (CUHK) HK 79.1 78.2 87.2 79.0 80.6
21 10 The University of Queensland (UQ) AU 76.8 74.1 88.8 83.7 80.3
22= 42 National Taiwan Normal University TW 76.8 74.5 86.1 79.0 78.9
22= 17 University of Illinois at Urbana-Champaign US 73.8 71.5 88.9 85.4 78.9
24= 22 Boston College US 71.8 73.4 93.6 82.8 78.5
24= 49 Vanderbilt University US 76.5 37.4 92.7 90.0 78.5
26 34 The University of Auckland NZ 74.6 84.4 84.7 78.0 78.3
27= 40= McGill University CA 69.9 82.6 92.7 81.0 78.0
27= 51-100 University of Birmingham GB 72.3 76.5 89.1 81.9 78.0
29 28= University of Texas at Austin US 65.1 76.6 95.1 90.7 77.4
30 39 University of Washington US 68.1 58.8 94.9 90.7 77.1
31 18 University of Edinburgh GB 72.0 70.6 89.6 80.0 77.0
32= 23 Deakin University AU 73.6 69.1 86.1 80.0 76.9
32= 31 Pennsylvania State University US 70.8 57.3 89.5 89.2 76.9
34 40= University of Leeds GB 68.7 64.2 95.2 84.6 76.7
35 45 Indiana University Bloomington US 64.6 77.2 93.1 89.2 76.5
36 19 King's College London (KCL) GB 67.3 77.3 94.1 81.0 76.4
37 46= The University of Georgia US 67.7 64.9 90.8 88.5 76.2
38= 51-100 Johns Hopkins University US 68.6 71.4 91.5 81.9 76.1
38= 33 The University of Western Australia (UWA) AU 72.8 72.7 87.7 74.6 76.1
40 27 University of Bristol GB 72.0 65.6 88.4 79.0 76.0
41 26 The University of New South Wales (UNSW) AU 68.2 78.9 88.6 80.0 75.7
42= 43= Beijing Normal University CN 80.8 78.1 73.8 63.2 75.6
42= 51-100 University of Alberta CA 67.3 75.1 89.4 82.8 75.6
44 51-100 University of Helsinki FI 70.1 69.7 88.2 79.0 75.5
45 50 University of Pennsylvania US 62.0 71.2 95.2 90.0 75.2
46 51-100 Queensland University of Technology (QUT) AU 68.0 66.0 88.5 83.7 75.0
47 51-100 Pontificia Universidad Católica de Chile CL 78.5 80.6 74.6 63.2 74.9
48 28= The University of Nottingham GB 67.0 61.9 92.3 82.8 74.7
49 35= Australian National University (ANU) AU 66.6 96.3 83.8 74.6 74.6
50= 51-100 Arizona State University US 63.4 68.0 88.7 91.3 74.5
50= 51-100 University of Twente NL 73.0 41.6 90.0 79.0 74.5
To view the complete rankings, visit www.TopUniversities.com

Engineering - Chemical
2015
2014
Instit
ution
Coun
try
Acad
emic
Emplo
yer
Citati
ons
H
Overa
ll
1 1 Massachusetts Institute of Technology (MIT) US 96.1 97.9 97.2 99.3 97.3
2 2 University of California, Berkeley (UCB) US 89.9 90.8 100.0 99.0 93.1
3 3 Stanford University US 86.8 95.0 97.8 100.0 92.9
4 4 University of Cambridge GB 87.5 100.0 89.9 88.9 91.8
5 5 National University of Singapore (NUS) SG 85.2 95.9 89.8 93.3 90.3
6 6 Imperial College London GB 88.7 91.1 85.9 91.6 89.4
7 10 California Institute of Technology (Caltech) US 87.1 85.7 96.9 90.7 88.7
8= 7 The University of Tokyo JP 84.4 91.8 88.1 91.2 88.2
8= 13= University of Oxford GB 80.2 99.6 90.7 84.1 88.2
10 8= Kyoto University JP 88.9 85.4 87.2 92.5 88.1
11= 11 ETH Zurich (Swiss Federal Institute of Technology) CH 86.7 86.3 87.3 89.8 87.1
11= 18 University of Minnesota US 100.0 70.7 86.8 85.8 87.1
13 13= University of Texas at Austin US 84.8 85.4 94.2 87.4 86.8
14 8= Delft University of Technology NL 81.9 93.3 83.8 82.4 85.7
15 19 University of Wisconsin-Madison US 92.6 71.2 89.7 89.8 85.3
16 15 Princeton University US 87.4 79.4 89.1 84.1 84.8
17 21 KAIST - Korea Advanced Institute of Science and Technology KR 78.3 86.9 88.5 93.3 84.7
18 16 The University of Melbourne AU 80.7 91.3 84.6 79.9 84.3
19 17 Seoul National University (SNU) KR 76.9 90.8 83.2 91.6 84.2
20 12 Tsinghua University CN 81.2 82.6 83.0 96.1 84.1
21 25 Nanyang Technological University (NTU) SG 75.4 86.3 88.9 95.0 83.6
22 22= Monash University AU 73.4 93.1 85.9 87.9 83.4
23 20 The University of Queensland (UQ) AU 76.9 82.2 89.8 89.8 82.4
24 22= The University of Manchester GB 82.2 79.0 84.3 84.7 81.9
25 33= Yale University US 78.0 83.5 87.1 81.8 81.6
26 24 Northwestern University US 70.3 79.1 95.2 98.3 80.9
27 26 The Hong Kong University of Science and Technology (HKUST) HK 74.9 87.5 84.2 77.8 80.5
28 46= The University of New South Wales (UNSW) AU 70.3 90.3 85.2 82.4 80.4
29= 29= Georgia Institute of Technology (Georgia Tech) US 71.3 82.4 89.0 90.7 80.2
29= 41= Tokyo Institute of Technology JP 77.2 84.2 80.8 79.9 80.2
31 33= University of California, Los Angeles (UCLA) US 66.7 84.2 96.6 90.3 80.0
32= 29= University of Pennsylvania US 71.7 82.9 90.6 84.1 79.8
32= 46= University of Toronto CA 75.4 74.9 91.0 89.8 79.8
34 36 Rheinisch-Westfälische Technische Hochschule Aachen DE 73.9 82.4 83.6 83.6 79.4
35 27 National Taiwan University (NTU) TW 71.6 84.6 81.8 85.8 79.2
36 38 Purdue University US 75.1 79.3 83.9 84.7 79.1
37 44 University of Michigan US 69.1 80.3 90.4 91.6 79.0
38 37 UCL (University College London) GB 79.6 76.0 81.7 79.2 78.8
39 31= Osaka University JP 68.7 82.9 85.9 88.9 78.6
40 39= Cornell University US 69.0 79.1 93.4 87.9 78.5
41 41= Technical University of Denmark DK 79.6 70.6 84.3 81.8 77.9
42 51-100 McGill University CA 75.1 78.5 82.6 77.8 77.7
43 31= Pohang University of Science and Technology (POSTECH) KR 66.3 82.5 91.2 81.2 77.1
44 51-100 Columbia University US 65.0 81.9 92.0 83.0 76.8
45 39= National Tsing Hua University TW 68.6 80.2 87.7 78.5 76.4
46 28 Tohoku University JP 67.1 82.7 81.8 82.4 76.3
47 45 Ecole Polytechnique Fédérale de Lausanne (EPFL) CH 62.1 79.2 93.2 90.7 76.2
48 50 Korea University KR 61.2 87.3 83.3 85.8 76.0
49 51-100 Sungkyunkwan University KR 57.8 91.7 86.0 81.2 75.7
50= 48= KIT, Karlsruher Institut für Technologie DE 69.8 75.9 82.4 83.6 75.6
50= 48= Technische Universität München DE 64.8 82.3 85.6 81.2 75.6
Engineering - Civil & Structural
2015
2014
Instit
ution
Coun
try
Acad
emic
Emplo
yer
Citati
ons
H
Overa
ll
1 1 Massachusetts Institute of Technology (MIT) US 100.0 95.9 87.2 77.7 93.5
2 14 Delft University of Technology NL 95.7 95.0 80.7 91.0 92.5
3 7 National University of Singapore (NUS) SG 90.1 97.9 88.2 88.4 91.9
4 9 Imperial College London GB 95.7 85.7 89.8 89.8 90.9
5 4= University of Cambridge GB 91.7 99.7 85.5 75.9 90.8
6 3 University of California, Berkeley (UCB) US 99.8 82.7 88.8 84.2 90.7
7 20 Tsinghua University CN 85.7 95.1 85.3 92.3 89.5
8 11 Stanford University US 93.7 92.8 84.2 75.9 89.3
9 10 University of Hong Kong (HKU) HK 82.4 96.6 90.9 84.2 88.2
10 4= The University of Tokyo JP 92.5 90.9 78.3 77.7 87.7
11 15= The Hong Kong Polytechnic University HK 78.8 89.8 92.6 100.0 87.4
12 13 ETH Zurich (Swiss Federal Institute of Technology) CH 91.7 85.8 85.2 79.4 87.1
13 17 Politecnico di Milano IT 86.8 92.0 83.5 81.1 87.0
14 18 The University of New South Wales (UNSW) AU 83.6 90.7 85.4 87.1 86.5
15 6 University of Texas at Austin US 92.6 79.0 83.1 84.2 85.8
16 2 University of Illinois at Urbana-Champaign US 97.8 68.0 85.9 88.4 85.7
17 12 The Hong Kong University of Science and Technology (HKUST) HK 83.7 94.2 82.8 75.9 85.5
18 21= Nanyang Technological University (NTU) SG 81.3 86.9 85.3 85.7 84.2
19 15= The University of Sydney AU 81.5 89.9 87.0 75.9 84.0
20 8 Kyoto University JP 86.9 85.7 73.9 77.7 83.2
21 24= Ecole Polytechnique Fédérale de Lausanne (EPFL) CH 83.5 78.5 88.8 85.7 83.1
22 32 KAIST - Korea Advanced Institute of Science and Technology KR 81.9 81.8 86.9 84.2 83.0
23 39 University of Oxford GB 79.4 100.0 72.8 67.6 82.8
24= 24= Georgia Institute of Technology (Georgia Tech) US 86.0 72.2 86.1 89.8 82.4
24= 38 Seoul National University (SNU) KR 77.6 88.3 84.5 81.1 82.4
26 50= University of British Columbia CA 78.3 79.8 88.4 87.1 81.6
27 30 Monash University AU 71.7 95.0 86.5 75.9 81.5
28 35 National Taiwan University (NTU) TW 79.9 78.9 85.9 84.2 81.1
29= 28 National Technical University of Athens GR 72.2 80.5 90.9 89.8 80.1
29= 23 Purdue University US 86.3 62.8 88.5 89.8 80.1
29= 51-100 Shanghai Jiao Tong University CN 70.7 83.2 90.6 88.4 80.1
32 21= Tongji University CN 80.9 79.0 73.0 85.7 79.9
33= 41 Politecnico di Torino IT 74.1 79.6 89.9 84.2 79.6
33= 33 University of Toronto CA 80.7 78.7 85.9 72.0 79.6
35= 31 City University of Hong Kong HK 64.4 79.0 100.0 99.0 79.3
35= 36 Universitat Politècnica de Catalunya ES 79.1 78.0 80.7 81.1 79.3
37 46 KTH, Royal Institute of Technology SE 70.9 76.5 94.5 89.8 79.0
38 26 Texas A&M University US 78.9 70.8 83.0 89.8 78.7
39= 51-100 The University of Manchester GB 73.4 77.3 86.2 87.1 78.5
39= 44 The University of Melbourne AU 73.4 92.0 75.8 67.6 78.5
41 29 Tokyo Institute of Technology JP 81.8 84.2 73.6 62.7 78.4
42 51-100 University of Michigan US 79.3 73.4 84.6 75.9 77.8
43 51-100 The University of Auckland NZ 65.0 96.5 79.5 72.0 77.7
44= 51-100 University of California, Los Angeles (UCLA) US 77.9 81.4 75.0 67.6 77.0
44= 19 University of Canterbury NZ 73.1 87.3 76.5 67.6 77.0
46 51-100 Technische Universität München DE 76.8 82.1 75.1 67.6 76.8
47 51-100 Universidade de São Paulo (USP) BR 71.2 82.7 79.3 75.9 76.6
48 51-100 The University of Sheffield GB 70.3 70.3 91.1 88.4 76.1
49 48 Technical University of Denmark DK 72.9 68.1 91.6 84.2 76.0
50 27 University of California, San Diego (UCSD) US 80.4 65.3 81.9 79.4 75.9
To view the complete rankings, visit www.TopUniversities.com

Engineering - Electrical & Electronic
2015
2014
Instit
ution
Coun
try
Acad
emic
Emplo
yer
Citati
ons
H
Overa
ll
1 1 Massachusetts Institute of Technology (MIT) US 100.0 99.3 91.0 100.0 98.4
2 2 Stanford University US 96.3 95.6 93.4 92.7 95.1
3 3 University of California, Berkeley (UCB) US 95.4 91.5 92.0 96.9 93.9
4 9 Harvard University US 92.4 98.2 92.0 81.2 92.4
5 5 ETH Zurich (Swiss Federal Institute of Technology) CH 90.0 95.5 88.9 89.1 91.4
6 6 National University of Singapore (NUS) SG 87.0 96.2 90.5 91.9 91.0
7= 10 Nanyang Technological University (NTU) SG 89.2 94.0 86.9 91.9 90.7
7= 4 University of Cambridge GB 89.9 100.0 84.5 80.1 90.7
9 8 Imperial College London GB 88.5 91.4 88.3 85.6 88.9
10 7 University of Oxford GB 83.7 99.9 89.7 76.0 88.3
11 15 California Institute of Technology (Caltech) US 90.2 85.4 86.6 87.4 87.8
12 12= University of California, Los Angeles (UCLA) US 86.2 82.8 91.0 91.5 86.7
13 16 Georgia Institute of Technology (Georgia Tech) US 84.1 84.8 87.2 96.2 86.6
14 17 Princeton University US 86.9 81.6 92.1 87.4 86.2
15 20 National Taiwan University (NTU) TW 86.6 85.4 82.9 86.1 85.6
16 31 KTH, Royal Institute of Technology SE 85.8 86.0 83.1 86.1 85.5
17 12= Tsinghua University CN 83.7 86.8 79.7 91.9 85.3
18 14 The University of Tokyo JP 88.0 90.6 73.2 76.6 84.9
19 11 The Hong Kong University of Science and Technology (HKUST) HK 78.2 90.0 89.1 86.1 84.6
20= 21 University of Illinois at Urbana-Champaign US 86.2 78.4 87.7 87.0 84.2
20= 22 University of Texas at Austin US 78.2 84.6 90.8 92.7 84.2
22= 24 KAIST - Korea Advanced Institute of Science and Technology KR 80.9 85.6 82.8 89.6 83.9
22= 27 University of Hong Kong (HKU) HK 79.5 90.8 87.7 77.8 83.9
24 26 University of Michigan US 81.3 84.3 85.2 88.3 83.8
25 38= The Chinese University of Hong Kong (CUHK) HK 83.0 87.2 84.9 75.4 83.4
26 18 Ecole Polytechnique Fédérale de Lausanne (EPFL) CH 83.1 83.3 84.6 81.7 83.2
27= 32 Carnegie Mellon University US 81.3 84.4 87.5 80.1 83.0
27= 23 University of Toronto CA 80.5 81.6 88.5 87.0 83.0
29 30 Technische Universität München DE 79.6 91.4 79.5 78.4 82.9
30 25 Tokyo Institute of Technology JP 81.3 85.6 79.3 84.7 82.8
31 19 Seoul National University (SNU) KR 77.9 88.7 83.1 80.6 82.3
32 51-100 Columbia University US 77.4 81.0 93.0 84.7 81.9
33 28 The University of Melbourne AU 74.7 91.2 85.9 74.1 81.2
34 47 University of California, San Diego (UCSD) US 85.7 70.5 87.2 83.7 81.1
35 29 Australian National University (ANU) AU 84.6 83.9 80.5 65.8 81.0
36 38= Politecnico di Torino IT 77.3 87.6 80.8 76.6 80.8
37 51-100 City University of Hong Kong HK 76.3 77.0 91.5 88.7 80.7
38 33 The University of New South Wales (UNSW) AU 72.7 87.1 88.5 80.6 80.6
39 41 Politecnico di Milano IT 71.6 93.3 79.6 77.8 80.2
40 34= Shanghai Jiao Tong University CN 70.7 86.4 81.5 90.0 79.9
41= 51-100 Aalborg University DK 75.7 73.2 92.1 91.9 79.8
41= 51-100 National Tsing Hua University TW 75.6 84.3 81.2 80.6 79.8
43 45= Purdue University US 76.6 82.8 81.3 79.5 79.6
44= 43= Cornell University US 77.9 77.1 86.5 78.4 79.0
44= 51-100 Technische Universität Berlin DE 72.7 84.9 83.0 80.1 79.0
46 49= University of Southern California US 80.2 70.5 88.0 83.2 78.9
47= 43= The University of Sydney AU 72.0 87.5 85.2 73.4 78.8
47= 51-100 Universidade Estadual de Campinas (Unicamp) BR 80.4 77.1 85.3 71.3 78.8
49 36 Peking University CN 74.8 83.3 78.7 80.1 78.7
50 37 Delft University of Technology NL 69.4 81.6 82.7 88.3 77.9
Engineering - Mechanical, Aeronautical & Manufacturing
2015
2014
Instit
ution
Coun
try
Acad
emic
Emplo
yer
Citati
ons
H
Overa
ll
1 1 Massachusetts Institute of Technology (MIT) US 98.9 98.7 95.3 98.3 98.2
2 2 Stanford University US 94.0 93.3 100.0 100.0 95.6
3 3 University of Cambridge GB 89.8 100.0 95.1 95.8 94.6
4 4 University of California, Berkeley (UCB) US 91.6 88.4 99.2 96.2 92.5
5 5 University of Michigan US 100.0 82.7 88.2 95.4 92.4
6 6= Imperial College London GB 90.1 92.2 93.4 94.6 91.9
7 11 Georgia Institute of Technology (Georgia Tech) US 96.4 84.0 89.7 94.6 91.4
8 6= National University of Singapore (NUS) SG 84.3 95.7 93.3 92.6 90.3
9 9 University of Oxford GB 82.8 99.3 91.3 84.7 89.3
10 8 Harvard University US 78.7 97.3 98.5 85.3 88.2
11 13 California Institute of Technology (Caltech) US 89.6 87.1 87.5 85.3 87.9
12 18 Rheinisch-Westfälische Technische Hochschule Aachen DE 88.8 90.4 84.9 82.3 87.7
13 14 Purdue University US 91.3 85.5 83.9 83.6 87.3
14 10 The University of Tokyo JP 86.5 89.9 83.8 84.7 86.8
15 26= ETH Zurich (Swiss Federal Institute of Technology) CH 83.3 89.1 90.1 85.3 86.4
16 15 Tsinghua University CN 81.8 87.6 82.1 90.8 84.9
17= 19 Delft University of Technology NL 82.0 87.6 84.1 87.4 84.8
17= 12 Nanyang Technological University (NTU) SG 78.1 89.6 90.5 87.4 84.8
19 30= Technische Universität München DE 83.9 87.4 84.7 77.6 84.1
20 24 University of Illinois at Urbana-Champaign US 83.3 78.9 89.1 89.4 83.8
21 28= University of California, Los Angeles (UCLA) US 79.3 80.8 98.2 86.9 83.7
22 30= Politecnico di Milano IT 76.0 95.3 83.3 79.7 83.4
23 17 The University of Melbourne AU 75.4 95.9 88.1 74.4 83.3
24 16 Northwestern University US 82.0 76.3 95.7 88.0 83.2
25 22 KTH, Royal Institute of Technology SE 82.2 81.4 85.8 83.0 82.6
26 21 KAIST - Korea Advanced Institute of Science and Technology KR 76.0 83.0 89.6 89.0 82.1
27 39 Cranfield University GB 84.5 81.3 81.6 75.2 81.7
28 28= Cornell University US 78.4 76.7 96.2 83.6 81.3
29 41 Monash University AU 68.2 95.8 90.3 77.6 81.2
30 25 Seoul National University (SNU) KR 71.9 85.6 89.0 89.0 81.1
31 20 The Hong Kong University of Science and Technology (HKUST) HK 74.6 87.5 89.3 76.8 81.0
32 33 Shanghai Jiao Tong University CN 75.0 83.8 82.3 88.0 80.7
33 26= The University of Sydney AU 71.7 90.9 88.8 75.2 80.6
34= 23 Princeton University US 76.8 78.2 92.4 81.7 80.3
34= 36 Tokyo Institute of Technology JP 79.3 86.8 78.3 71.8 80.3
34= 51-100 University of Toronto CA 75.9 79.9 89.3 83.6 80.3
37 37= The University of New South Wales (UNSW) AU 73.7 88.9 84.0 75.2 80.0
38 37= Pennsylvania State University US 76.8 74.2 89.8 89.4 79.9
39 48= McGill University CA 77.3 80.7 84.2 79.7 79.7
40 30= Kyoto University JP 72.1 88.1 81.8 78.3 79.3
41 44 The University of Manchester GB 74.7 79.8 87.0 78.3 78.6
42= 51-100 Texas A&M University US 74.5 77.1 82.9 86.9 78.4
42= 48= Universität Stuttgart DE 75.9 74.4 88.6 83.0 78.4
44 51-100 Technische Universität Darmstadt DE 77.0 77.1 84.2 78.3 78.3
45 51-100 Virginia Polytechnic Institute (Virginia Tech) US 78.3 71.4 82.8 86.4 78.1
46= 51-100 KIT, Karlsruher Institut für Technologie DE 74.6 77.9 84.4 81.1 78.0
46= 40 Peking University CN 62.6 87.2 92.9 85.9 78.0
46= 34= University of Hong Kong (HKU) HK 70.3 84.9 87.6 75.2 78.0
49= 47 Ecole Polytechnique Fédérale de Lausanne (EPFL) CH 66.3 80.2 93.0 84.2 77.2
49= 51-100 Technische Universität Berlin DE 71.9 83.3 82.5 73.6 77.2
To view the complete rankings, visit www.TopUniversities.com
Ireland’s Global University
...the high protecting power of allknowledge and science, of fact andprinciple, of inquiry and discovery,of experiment and speculation;
What’s your idea of a university?
In 1873 John Henry Newman published The Idea of a University, a series of lectures and essays in which he proposed how a university should foster knowledgeand learning.
Today, University College Dublin, the university builton Newman’s founding principles, seeks to fulfi l his vision as a place of excellence in education.
UCD is the university of fi rst choice for Irish undergraduates and, with over 6,000 students coming to UCD from 120 countries, it’s also the fi rst choice for international students.
Newman’s idea of a university sought ‘true enlargement of mind’ and ‘a university mission to benefi t the wider world’. Globally connected and always networking, UCD stays true to this ethos.
www.ucd.ie
65101468 UCD QS Rankings_A4 v3.indd 1 24/02/2015 16:50
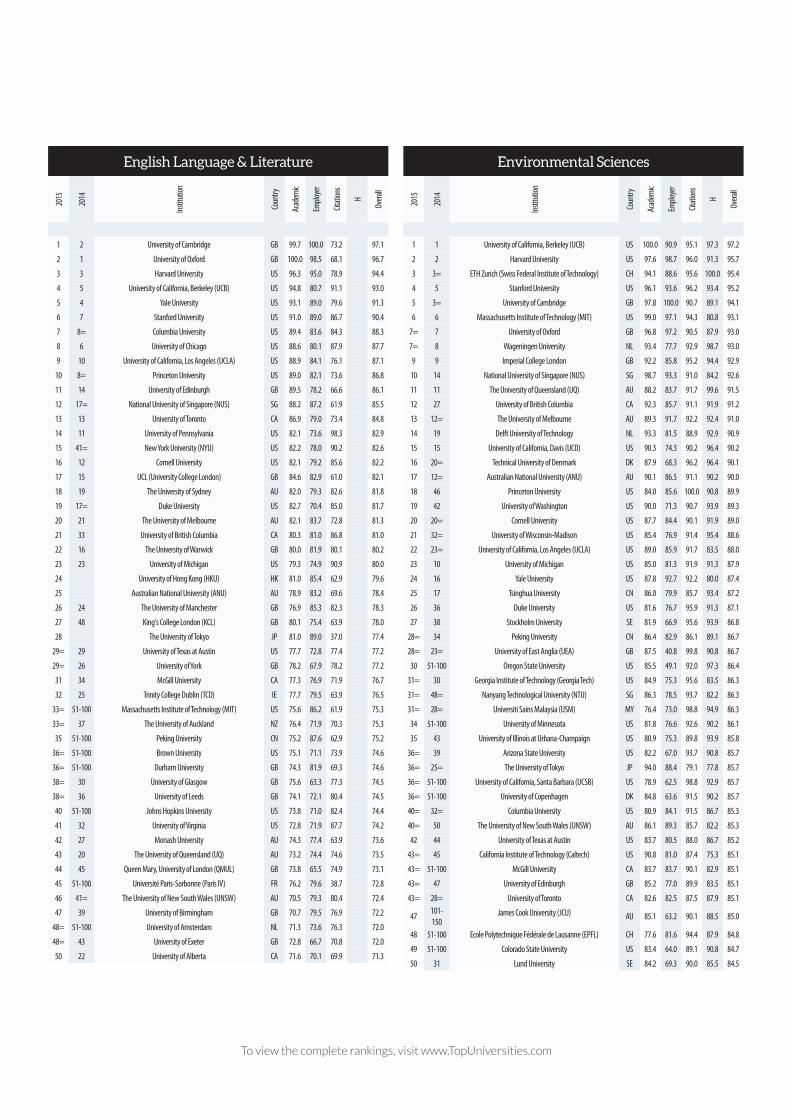
English Language & Literature
2015
2014
Instit
ution
Coun
try
Acad
emic
Emplo
yer
Citati
ons
H
Overa
ll
1 2 University of Cambridge GB 99.7 100.0 73.2 97.1
2 1 University of Oxford GB 100.0 98.5 68.1 96.7
3 3 Harvard University US 96.3 95.0 78.9 94.4
4 5 University of California, Berkeley (UCB) US 94.8 80.7 91.1 93.0
5 4 Yale University US 93.1 89.0 79.6 91.3
6 7 Stanford University US 91.0 89.0 86.7 90.4
7 8= Columbia University US 89.4 83.6 84.3 88.3
8 6 University of Chicago US 88.6 80.1 87.9 87.7
9 10 University of California, Los Angeles (UCLA) US 88.9 84.1 76.1 87.1
10 8= Princeton University US 89.0 82.1 73.6 86.8
11 14 University of Edinburgh GB 89.5 78.2 66.6 86.1
12 17= National University of Singapore (NUS) SG 88.2 87.2 61.9 85.5
13 13 University of Toronto CA 86.9 79.0 73.4 84.8
14 11 University of Pennsylvania US 82.1 73.6 98.3 82.9
15 41= New York University (NYU) US 82.2 78.0 90.2 82.6
16 12 Cornell University US 82.1 79.2 85.6 82.2
17 15 UCL (University College London) GB 84.6 82.9 61.0 82.1
18 19 The University of Sydney AU 82.0 79.3 82.6 81.8
19 17= Duke University US 82.7 70.4 85.0 81.7
20 21 The University of Melbourne AU 82.1 83.7 72.8 81.3
21 33 University of British Columbia CA 80.3 81.0 86.8 81.0
22 16 The University of Warwick GB 80.0 81.9 80.1 80.2
23 23 University of Michigan US 79.3 74.9 90.9 80.0
24 University of Hong Kong (HKU) HK 81.0 85.4 62.9 79.6
25 Australian National University (ANU) AU 78.9 83.2 69.6 78.4
26 24 The University of Manchester GB 76.9 85.3 82.3 78.3
27 48 King's College London (KCL) GB 80.1 75.4 63.9 78.0
28 The University of Tokyo JP 81.0 89.0 37.0 77.4
29= 29 University of Texas at Austin US 77.7 72.8 77.4 77.2
29= 26 University of York GB 78.2 67.9 78.2 77.2
31 34 McGill University CA 77.3 76.9 71.9 76.7
32 25 Trinity College Dublin (TCD) IE 77.7 79.5 63.9 76.5
33= 51-100 Massachusetts Institute of Technology (MIT) US 75.6 86.2 61.9 75.3
33= 37 The University of Auckland NZ 76.4 71.9 70.3 75.3
35 51-100 Peking University CN 75.2 87.6 62.9 75.2
36= 51-100 Brown University US 75.1 71.1 73.9 74.6
36= 51-100 Durham University GB 74.3 81.9 69.3 74.6
38= 30 University of Glasgow GB 75.6 63.3 77.3 74.5
38= 36 University of Leeds GB 74.1 72.1 80.4 74.5
40 51-100 Johns Hopkins University US 73.8 71.0 82.4 74.4
41 32 University of Virginia US 72.8 71.9 87.7 74.2
42 27 Monash University AU 74.3 77.4 63.9 73.6
43 20 The University of Queensland (UQ) AU 73.2 74.4 74.6 73.5
44 45 Queen Mary, University of London (QMUL) GB 73.8 65.5 74.9 73.1
45 51-100 Université Paris-Sorbonne (Paris IV) FR 76.2 79.6 38.7 72.8
46 41= The University of New South Wales (UNSW) AU 70.5 79.3 80.4 72.4
47 39 University of Birmingham GB 70.7 79.5 76.9 72.2
48= 51-100 University of Amsterdam NL 71.3 73.6 76.3 72.0
48= 43 University of Exeter GB 72.8 66.7 70.8 72.0
50 22 University of Alberta CA 71.6 70.1 69.9 71.3
Environmental Sciences
2015
2014
Instit
ution
Coun
try
Acad
emic
Emplo
yer
Citati
ons
H
Overa
ll
1 1 University of California, Berkeley (UCB) US 100.0 90.9 95.1 97.3 97.2
2 2 Harvard University US 97.6 98.7 96.0 91.3 95.7
3 3= ETH Zurich (Swiss Federal Institute of Technology) CH 94.1 88.6 95.6 100.0 95.4
4 5 Stanford University US 96.1 93.6 96.2 93.4 95.2
5 3= University of Cambridge GB 97.8 100.0 90.7 89.1 94.1
6 6 Massachusetts Institute of Technology (MIT) US 99.0 97.1 94.3 80.8 93.1
7= 7 University of Oxford GB 96.8 97.2 90.5 87.9 93.0
7= 8 Wageningen University NL 93.4 77.7 92.9 98.7 93.0
9 9 Imperial College London GB 92.2 85.8 95.2 94.4 92.9
10 14 National University of Singapore (NUS) SG 98.7 93.3 91.0 84.2 92.6
11 11 The University of Queensland (UQ) AU 88.2 83.7 91.7 99.6 91.5
12 27 University of British Columbia CA 92.3 85.7 91.1 91.9 91.2
13 12= The University of Melbourne AU 89.3 91.7 92.2 92.4 91.0
14 19 Delft University of Technology NL 93.3 81.5 88.9 92.9 90.9
15 15 University of California, Davis (UCD) US 90.3 74.3 90.2 96.4 90.2
16 20= Technical University of Denmark DK 87.9 68.3 96.2 96.4 90.1
17 12= Australian National University (ANU) AU 90.1 86.5 91.1 90.2 90.0
18 46 Princeton University US 84.0 85.6 100.0 90.8 89.9
19 42 University of Washington US 90.0 71.3 90.7 93.9 89.3
20 20= Cornell University US 87.7 84.4 90.1 91.9 89.0
21 32= University of Wisconsin-Madison US 85.4 76.9 91.4 95.4 88.6
22 23= University of California, Los Angeles (UCLA) US 89.0 85.9 91.7 83.5 88.0
23 10 University of Michigan US 85.0 81.3 91.9 91.3 87.9
24 16 Yale University US 87.8 92.7 92.2 80.0 87.4
25 17 Tsinghua University CN 86.0 79.9 85.7 93.4 87.2
26 36 Duke University US 81.6 76.7 95.9 91.3 87.1
27 38 Stockholm University SE 81.9 66.9 95.6 93.9 86.8
28= 34 Peking University CN 86.4 82.9 86.1 89.1 86.7
28= 23= University of East Anglia (UEA) GB 87.5 40.8 99.8 90.8 86.7
30 51-100 Oregon State University US 85.5 49.1 92.0 97.3 86.4
31= 30 Georgia Institute of Technology (Georgia Tech) US 84.9 75.3 95.6 83.5 86.3
31= 48= Nanyang Technological University (NTU) SG 86.3 78.5 93.7 82.2 86.3
31= 28= Universiti Sains Malaysia (USM) MY 76.4 73.0 98.8 94.9 86.3
34 51-100 University of Minnesota US 81.8 76.6 92.6 90.2 86.1
35 43 University of Illinois at Urbana-Champaign US 80.9 75.3 89.8 93.9 85.8
36= 39 Arizona State University US 82.2 67.0 93.7 90.8 85.7
36= 25= The University of Tokyo JP 94.0 88.4 79.1 77.8 85.7
36= 51-100 University of California, Santa Barbara (UCSB) US 78.9 62.5 98.8 92.9 85.7
36= 51-100 University of Copenhagen DK 84.8 63.6 91.5 90.2 85.7
40= 32= Columbia University US 80.9 84.1 91.5 86.7 85.3
40= 50 The University of New South Wales (UNSW) AU 86.1 89.3 85.7 82.2 85.3
42 44 University of Texas at Austin US 83.7 80.5 88.0 86.7 85.2
43= 45 California Institute of Technology (Caltech) US 90.8 81.0 87.4 75.3 85.1
43= 51-100 McGill University CA 83.7 83.7 90.1 82.9 85.1
43= 47 University of Edinburgh GB 85.2 77.0 89.9 83.5 85.1
43= 28= University of Toronto CA 82.6 82.5 87.5 87.9 85.1
47 101-150
James Cook University (JCU) AU 85.1 63.2 90.1 88.5 85.0
48 51-100 Ecole Polytechnique Fédérale de Lausanne (EPFL) CH 77.6 81.6 94.4 87.9 84.8
49 51-100 Colorado State University US 83.4 64.0 89.1 90.8 84.7
50 31 Lund University SE 84.2 69.3 90.0 85.5 84.5
To view the complete rankings, visit www.TopUniversities.com
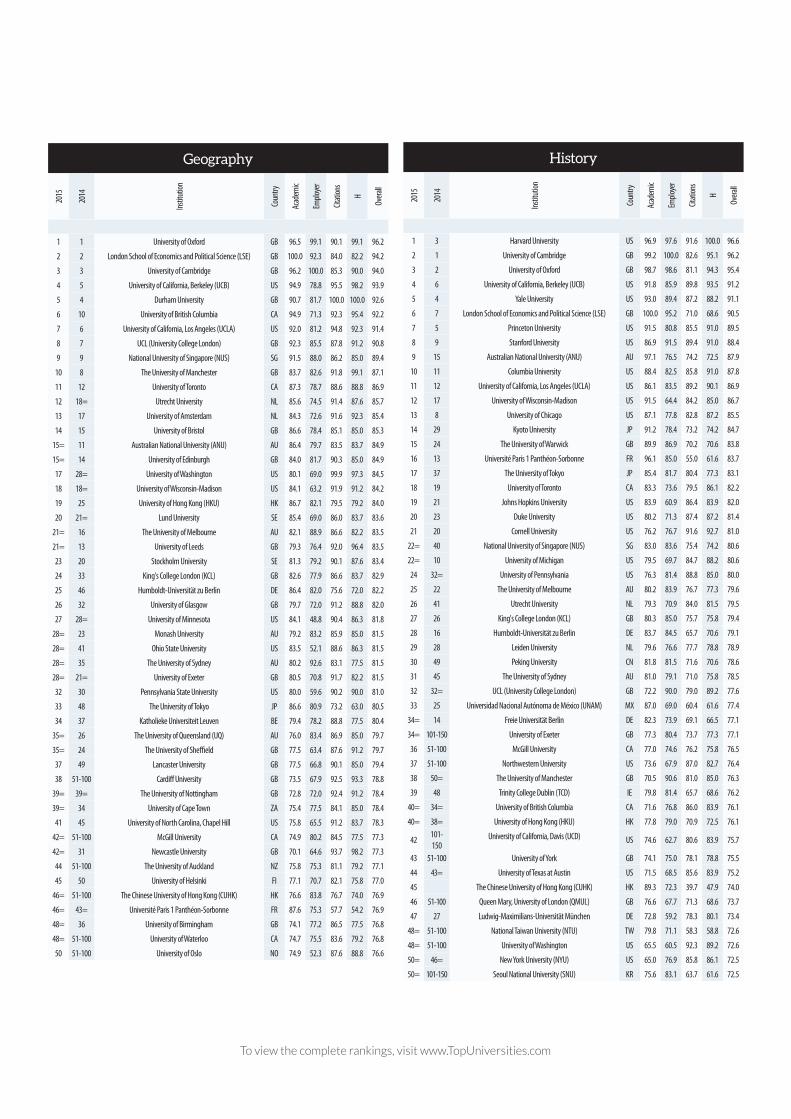
Geography
2015
2014
Instit
ution
Coun
try
Acad
emic
Emplo
yer
Citati
ons
H
Overa
ll
1 1 University of Oxford GB 96.5 99.1 90.1 99.1 96.2
2 2 London School of Economics and Political Science (LSE) GB 100.0 92.3 84.0 82.2 94.2
3 3 University of Cambridge GB 96.2 100.0 85.3 90.0 94.0
4 5 University of California, Berkeley (UCB) US 94.9 78.8 95.5 98.2 93.9
5 4 Durham University GB 90.7 81.7 100.0 100.0 92.6
6 10 University of British Columbia CA 94.9 71.3 92.3 95.4 92.2
7 6 University of California, Los Angeles (UCLA) US 92.0 81.2 94.8 92.3 91.4
8 7 UCL (University College London) GB 92.3 85.5 87.8 91.2 90.8
9 9 National University of Singapore (NUS) SG 91.5 88.0 86.2 85.0 89.4
10 8 The University of Manchester GB 83.7 82.6 91.8 99.1 87.1
11 12 University of Toronto CA 87.3 78.7 88.6 88.8 86.9
12 18= Utrecht University NL 85.6 74.5 91.4 87.6 85.7
13 17 University of Amsterdam NL 84.3 72.6 91.6 92.3 85.4
14 15 University of Bristol GB 86.6 78.4 85.1 85.0 85.3
15= 11 Australian National University (ANU) AU 86.4 79.7 83.5 83.7 84.9
15= 14 University of Edinburgh GB 84.0 81.7 90.3 85.0 84.9
17 28= University of Washington US 80.1 69.0 99.9 97.3 84.5
18 18= University of Wisconsin-Madison US 84.1 63.2 91.9 91.2 84.2
19 25 University of Hong Kong (HKU) HK 86.7 82.1 79.5 79.2 84.0
20 21= Lund University SE 85.4 69.0 86.0 83.7 83.6
21= 16 The University of Melbourne AU 82.1 88.9 86.6 82.2 83.5
21= 13 University of Leeds GB 79.3 76.4 92.0 96.4 83.5
23 20 Stockholm University SE 81.3 79.2 90.1 87.6 83.4
24 33 King's College London (KCL) GB 82.6 77.9 86.6 83.7 82.9
25 46 Humboldt-Universität zu Berlin DE 86.4 82.0 75.6 72.0 82.2
26 32 University of Glasgow GB 79.7 72.0 91.2 88.8 82.0
27 28= University of Minnesota US 84.1 48.8 90.4 86.3 81.8
28= 23 Monash University AU 79.2 83.2 85.9 85.0 81.5
28= 41 Ohio State University US 83.5 52.1 88.6 86.3 81.5
28= 35 The University of Sydney AU 80.2 92.6 83.1 77.5 81.5
28= 21= University of Exeter GB 80.5 70.8 91.7 82.2 81.5
32 30 Pennsylvania State University US 80.0 59.6 90.2 90.0 81.0
33 48 The University of Tokyo JP 86.6 80.9 73.2 63.0 80.5
34 37 Katholieke Universiteit Leuven BE 79.4 78.2 88.8 77.5 80.4
35= 26 The University of Queensland (UQ) AU 76.0 83.4 86.9 85.0 79.7
35= 24 The University of Sheffield GB 77.5 63.4 87.6 91.2 79.7
37 49 Lancaster University GB 77.5 66.8 90.1 85.0 79.4
38 51-100 Cardiff University GB 73.5 67.9 92.5 93.3 78.8
39= 39= The University of Nottingham GB 72.8 72.0 92.4 91.2 78.4
39= 34 University of Cape Town ZA 75.4 77.5 84.1 85.0 78.4
41 45 University of North Carolina, Chapel Hill US 75.8 65.5 91.2 83.7 78.3
42= 51-100 McGill University CA 74.9 80.2 84.5 77.5 77.3
42= 31 Newcastle University GB 70.1 64.6 93.7 98.2 77.3
44 51-100 The University of Auckland NZ 75.8 75.3 81.1 79.2 77.1
45 50 University of Helsinki FI 77.1 70.7 82.1 75.8 77.0
46= 51-100 The Chinese University of Hong Kong (CUHK) HK 76.6 83.8 76.7 74.0 76.9
46= 43= Université Paris 1 Panthéon-Sorbonne FR 87.6 75.3 57.7 54.2 76.9
48= 36 University of Birmingham GB 74.1 77.2 86.5 77.5 76.8
48= 51-100 University of Waterloo CA 74.7 75.5 83.6 79.2 76.8
50 51-100 University of Oslo NO 74.9 52.3 87.6 88.8 76.6
History
2015
2014
Instit
ution
Coun
try
Acad
emic
Emplo
yer
Citati
ons
H
Overa
ll
1 3 Harvard University US 96.9 97.6 91.6 100.0 96.6
2 1 University of Cambridge GB 99.2 100.0 82.6 95.1 96.2
3 2 University of Oxford GB 98.7 98.6 81.1 94.3 95.4
4 6 University of California, Berkeley (UCB) US 91.8 85.9 89.8 93.5 91.2
5 4 Yale University US 93.0 89.4 87.2 88.2 91.1
6 7 London School of Economics and Political Science (LSE) GB 100.0 95.2 71.0 68.6 90.5
7 5 Princeton University US 91.5 80.8 85.5 91.0 89.5
8 9 Stanford University US 86.9 91.5 89.4 91.0 88.4
9 15 Australian National University (ANU) AU 97.1 76.5 74.2 72.5 87.9
10 11 Columbia University US 88.4 82.5 85.8 91.0 87.8
11 12 University of California, Los Angeles (UCLA) US 86.1 83.5 89.2 90.1 86.9
12 17 University of Wisconsin-Madison US 91.5 64.4 84.2 85.0 86.7
13 8 University of Chicago US 87.1 77.8 82.8 87.2 85.5
14 29 Kyoto University JP 91.2 78.4 73.2 74.2 84.7
15 24 The University of Warwick GB 89.9 86.9 70.2 70.6 83.8
16 13 Université Paris 1 Panthéon-Sorbonne FR 96.1 85.0 55.0 61.6 83.7
17 37 The University of Tokyo JP 85.4 81.7 80.4 77.3 83.1
18 19 University of Toronto CA 83.3 73.6 79.5 86.1 82.2
19 21 Johns Hopkins University US 83.9 60.9 86.4 83.9 82.0
20 23 Duke University US 80.2 71.3 87.4 87.2 81.4
21 20 Cornell University US 76.2 76.7 91.6 92.7 81.0
22= 40 National University of Singapore (NUS) SG 83.0 83.6 75.4 74.2 80.6
22= 10 University of Michigan US 79.5 69.7 84.7 88.2 80.6
24 32= University of Pennsylvania US 76.3 81.4 88.8 85.0 80.0
25 22 The University of Melbourne AU 80.2 83.9 76.7 77.3 79.6
26 41 Utrecht University NL 79.3 70.9 84.0 81.5 79.5
27 26 King's College London (KCL) GB 80.3 85.0 75.7 75.8 79.4
28 16 Humboldt-Universität zu Berlin DE 83.7 84.5 65.7 70.6 79.1
29 28 Leiden University NL 79.6 76.6 77.7 78.8 78.9
30 49 Peking University CN 81.8 81.5 71.6 70.6 78.6
31 45 The University of Sydney AU 81.0 79.1 71.0 75.8 78.5
32 32= UCL (University College London) GB 72.2 90.0 79.0 89.2 77.6
33 25 Universidad Nacional Autónoma de México (UNAM) MX 87.0 69.0 60.4 61.6 77.4
34= 14 Freie Universität Berlin DE 82.3 73.9 69.1 66.5 77.1
34= 101-150 University of Exeter GB 77.3 80.4 73.7 77.3 77.1
36 51-100 McGill University CA 77.0 74.6 76.2 75.8 76.5
37 51-100 Northwestern University US 73.6 67.9 87.0 82.7 76.4
38 50= The University of Manchester GB 70.5 90.6 81.0 85.0 76.3
39 48 Trinity College Dublin (TCD) IE 79.8 81.4 65.7 68.6 76.2
40= 34= University of British Columbia CA 71.6 76.8 86.0 83.9 76.1
40= 38= University of Hong Kong (HKU) HK 77.8 79.0 70.9 72.5 76.1
42 101-150
University of California, Davis (UCD) US 74.6 62.7 80.6 83.9 75.7
43 51-100 University of York GB 74.1 75.0 78.1 78.8 75.5
44 43= University of Texas at Austin US 71.5 68.5 85.6 83.9 75.2
45 The Chinese University of Hong Kong (CUHK) HK 89.3 72.3 39.7 47.9 74.0
46 51-100 Queen Mary, University of London (QMUL) GB 76.6 67.7 71.3 68.6 73.7
47 27 Ludwig-Maximilians-Universität München DE 72.8 59.2 78.3 80.1 73.4
48= 51-100 National Taiwan University (NTU) TW 79.8 71.1 58.3 58.8 72.6
48= 51-100 University of Washington US 65.5 60.5 92.3 89.2 72.6
50= 46= New York University (NYU) US 65.0 76.9 85.8 86.1 72.5
50= 101-150 Seoul National University (SNU) KR 75.6 83.1 63.7 61.6 72.5
To view the complete rankings, visit www.TopUniversities.com

Law
2015
2014
Instit
ution
Coun
try
Acad
emic
Emplo
yer
Citati
ons
H
Overa
ll
1 1 Harvard University US 100.0 99.5 99.9 100.0 99.8
2 3 University of Cambridge GB 98.0 99.3 91.3 88.8 96.7
3 2 University of Oxford GB 98.7 100.0 86.7 82.1 96.0
4 4 Yale University US 96.3 89.2 98.7 92.3 93.7
5 5 New York University (NYU) US 98.1 78.9 97.5 97.5 92.2
6 6 Stanford University US 89.9 92.0 97.2 88.8 90.7
7 7 London School of Economics and Political Science (LSE) GB 91.6 93.3 87.7 81.1 90.3
8 8 The University of Melbourne AU 90.7 94.8 85.2 75.5 89.4
9 10 University of California, Berkeley (UCB) US 89.6 81.6 93.7 92.9 87.9
10 11 Columbia University US 89.8 82.2 92.4 84.8 86.9
11 12 UCL (University College London) GB 89.1 82.5 88.8 84.8 86.5
12 9 University of Chicago US 86.7 81.9 97.8 90.9 86.4
13 13 The University of Sydney AU 85.9 94.8 77.7 68.2 85.5
14 19 National University of Singapore (NUS) SG 86.3 90.3 79.2 69.8 84.7
15 14 The University of New South Wales (UNSW) AU 84.2 89.3 81.3 74.2 84.1
16 15 Australian National University (ANU) AU 84.1 87.0 83.3 71.4 83.0
17 20 King's College London (KCL) GB 82.7 80.6 82.4 75.5 81.0
18 51-100 Peking University CN 80.8 87.7 80.9 66.5 80.7
19 18 University of Hong Kong (HKU) HK 79.8 90.7 74.5 64.6 80.5
20 22 The University of Tokyo JP 84.3 88.2 65.3 55.3 80.2
21 21 University of Toronto CA 82.2 77.8 82.8 76.7 80.1
22 16 Monash University AU 75.0 90.5 78.6 75.5 79.9
23 23 Leiden University NL 83.6 75.2 82.4 75.5 79.8
24 17 Georgetown University US 81.4 67.0 96.9 90.9 79.3
25 27 Université Paris 1 Panthéon-Sorbonne FR 86.0 87.5 57.6 45.1 78.9
26 33 McGill University CA 79.2 83.0 80.4 68.2 78.8
27 32 University of Edinburgh GB 81.6 76.3 78.5 71.4 78.3
28 31 University of Michigan US 76.3 73.1 90.7 85.7 77.5
29 24= University of Pennsylvania US 67.7 82.7 95.8 91.6 77.2
30 26 Katholieke Universiteit Leuven BE 78.0 75.4 84.2 74.2 77.0
31 30 Cornell University US 70.3 77.3 100.0 90.3 76.9
32 35 University of California, Los Angeles (UCLA) US 70.3 81.7 92.0 83.9 76.8
33= 28= The University of Auckland NZ 73.8 89.1 78.5 60.4 76.6
33= 36 University of British Columbia CA 73.6 78.6 90.3 77.9 76.6
35 34 The University of Nottingham GB 75.3 78.3 83.4 72.8 76.2
36 24= Ruprecht-Karls-Universität Heidelberg DE 82.6 77.0 69.0 52.4 75.7
37 43 Pontificia Universidad Católica de Chile CL 74.4 81.6 73.9 60.4 74.4
38 51-100 Universidad Nacional Autónoma de México (UNAM) MX 81.0 71.2 61.6 62.6 74.3
39= 42 Duke University US 69.7 70.6 94.6 89.5 74.2
39= 44 Tsinghua University CN 74.7 84.3 74.1 52.4 74.2
41 51-100 Seoul National University (SNU) KR 72.5 83.6 77.8 58.0 73.9
42 51-100 The Chinese University of Hong Kong (CUHK) HK 71.2 83.4 75.5 60.4 73.5
43= 28= Ludwig-Maximilians-Universität München DE 80.5 69.6 71.4 58.0 73.4
43= 51-100 National Taiwan University (NTU) TW 75.7 78.2 75.9 55.3 73.4
45= 51-100 Queen Mary, University of London (QMUL) GB 77.4 66.8 78.6 66.5 72.6
45= 49 Victoria University of Wellington NZ 75.3 75.5 71.7 58.0 72.6
47 39 University of Virginia US 72.0 62.2 94.4 87.3 72.5
48 Kyoto University JP 75.7 82.0 56.5 45.1 72.0
49 51-100 The University of Queensland (UQ) AU 61.6 88.7 79.7 66.5 71.4
50 48 Utrecht University NL 69.9 68.9 87.4 75.5 71.3
Linguistics
2015
2014
Instit
ution
Coun
try
Acad
emic
Emplo
yer
Citati
ons
H
Overa
ll
1 1 Massachusetts Institute of Technology (MIT) US 100.0 89.4 100.0 94.1 98.6
2 2 University of California, Los Angeles (UCLA) US 91.8 79.3 89.5 89.9 90.3
3 3 University of Edinburgh GB 85.2 82.4 91.1 89.9 85.5
4= 7 Harvard University US 82.7 97.7 95.6 94.1 85.4
4= 6 University of Cambridge GB 84.0 99.9 79.6 85.0 85.4
6 4 University of Oxford GB 83.3 100.0 82.0 86.7 85.1
7 5 Stanford University US 82.4 92.6 99.3 94.1 84.9
8 16 National University of Singapore (NUS) SG 83.6 90.0 83.6 81.3 84.1
9 18 University of Hong Kong (HKU) HK 84.3 85.5 80.6 77.0 83.9
10 8 University of Massachusetts, Amherst US 86.1 54.3 91.9 91.4 83.5
11 10 University of California, Berkeley (UCB) US 81.9 81.4 94.7 89.9 82.9
12 13 University of Pennsylvania US 80.7 78.9 95.0 91.4 81.8
13 9 Lancaster University GB 82.3 72.7 86.3 77.0 81.3
14 22 Peking University CN 82.4 82.1 79.1 58.4 81.0
15 12 The University of Melbourne AU 79.0 89.5 83.3 81.3 80.4
16 11 Australian National University (ANU) AU 79.1 87.5 82.9 72.0 79.8
17 14 UCL (University College London) GB 76.4 87.2 88.3 95.4 79.0
18 24 City University of Hong Kong HK 80.2 70.8 78.1 74.6 78.9
19 20 The University of Tokyo JP 77.2 89.4 84.4 74.6 78.7
20 15 Ohio State University US 79.2 56.7 95.7 91.4 78.4
21 48 The Chinese University of Hong Kong (CUHK) HK 77.3 82.6 78.3 74.6 77.7
22 25 University of Amsterdam NL 76.7 77.2 82.9 85.0 77.5
23 19 University of Chicago US 76.5 75.6 84.1 81.3 77.0
24 42 Nanyang Technological University (NTU) SG 76.2 75.4 76.9 69.1 75.8
25= 28 McGill University CA 74.5 75.3 89.4 81.3 75.7
25= 39 University of British Columbia CA 74.4 77.4 87.8 81.3 75.7
27 34= University of Maryland, College Park US 77.0 42.3 92.2 100.0 75.4
28 21 The University of Sydney AU 72.9 88.3 82.8 79.2 75.3
29 26= Leiden University NL 77.1 65.0 74.2 65.9 75.2
30 44= New York University (NYU) US 73.0 77.4 89.0 89.9 75.1
31= 38 University of California, San Diego (UCSD) US 73.2 72.5 93.4 89.9 75.0
31= 32 University of Toronto CA 73.8 71.4 88.2 88.4 75.0
33 36 The University of Auckland NZ 73.1 89.1 80.1 65.9 74.7
34 26= University of California, Santa Barbara (UCSB) US 75.2 54.7 87.4 81.3 74.1
35= Lomonosov Moscow State University RU 77.4 90.2 33.5 20.8 73.7
35= 23 The Hong Kong Polytechnic University HK 73.7 76.5 75.1 65.9 73.7
37= 51-100 University of Michigan US 71.5 73.4 90.0 83.2 73.2
37= 51-100 University of Southern California US 72.6 68.8 83.7 81.3 73.2
39= 33 The University of Manchester GB 70.2 81.4 86.3 86.7 73.0
39= 51-100 University of California, Santa Cruz (UCSC) US 73.9 56.9 86.9 77.0 73.0
41 50= Seoul National University (SNU) KR 73.4 84.0 56.8 53.8 72.7
42 30 University of Texas at Austin US 70.4 66.8 92.8 95.4 72.4
43 51-100 Cornell University US 70.0 77.0 90.1 79.2 72.2
44 101-150
National Taiwan University (NTU) TW 72.1 85.1 62.3 53.8 72.0
45 34= University of Illinois at Urbana-Champaign US 70.4 62.7 89.4 94.1 71.8
46 41 Radboud University Nijmegen NL 70.7 60.8 88.2 92.8 71.7
47 51-100 National Tsing Hua University TW 72.1 68.5 73.0 62.4 71.3
48 17 Monash University AU 69.6 92.7 71.0 53.8 71.2
49 51-100 Georgetown University US 69.5 68.7 87.6 79.2 70.8
50 37 The University of Queensland (UQ) AU 67.9 84.6 80.4 72.0 70.4
To view the complete rankings, visit www.TopUniversities.com

Newcastle University research is having an impact across the world. Our academics are sharply focused on responding to the major challenges facing society today. Our research is world-leading in areas as diverse as health, policy, culture and the environment.
Discover more about our research at: ncl.ac.uk/impact and see why we are in the top 1% of the world’s best universities, according to the QS World Rankings.
GlobalImpact
ExcellencePurposewith a
04686 AB Newcastle Uni QS Press Ad A4+3.indd 1 24/02/2015 17:00
Mathematics
2015
2014
Instit
ution
Coun
try
Acad
emic
Emplo
yer
Citati
ons
H
Overa
ll
1 1 Harvard University US 97.8 98.5 99.7 94.1 97.6
2 4= University of Cambridge GB 99.3 100.0 93.2 92.6 96.9
3 3 University of Oxford GB 97.1 99.8 94.2 95.5 96.7
4 2 Massachusetts Institute of Technology (MIT) US 100.0 94.5 91.9 95.5 96.4
5 6= Stanford University US 95.6 93.6 97.3 98.1 96.0
6 4= University of California, Berkeley (UCB) US 98.0 88.4 95.8 93.3 94.7
7 6= Princeton University US 96.5 83.3 94.6 98.1 93.8
8 8 University of California, Los Angeles (UCLA) US 90.9 80.7 99.3 100.0 92.4
9 9 ETH Zurich (Swiss Federal Institute of Technology) CH 92.2 91.2 90.8 89.5 91.2
10 12 University of Chicago US 87.3 89.9 99.3 85.3 89.8
11 11 Imperial College London GB 90.4 90.3 89.4 86.2 89.3
12 13 National University of Singapore (NUS) SG 86.1 89.8 90.3 89.5 88.4
13 10 New York University (NYU) US 93.8 85.8 88.8 78.5 88.1
14 19 University of Michigan US 84.9 81.8 95.4 89.5 87.3
15 14 California Institute of Technology (Caltech) US 91.0 75.5 93.3 83.5 86.9
16 15 University of Toronto CA 84.1 84.1 89.5 89.5 86.3
17 21 Ecole Polytechnique ParisTech FR 89.4 83.1 85.4 78.5 85.2
18 23 The University of Tokyo JP 89.1 87.3 78.6 78.5 84.5
19 18 Columbia University US 81.2 89.1 88.7 81.6 84.4
20= 45= University of Hong Kong (HKU) HK 79.9 91.6 91.1 78.5 84.2
20= 24 University of Waterloo CA 82.1 84.0 86.4 86.2 84.2
22 17 University of Texas at Austin US 80.1 78.6 91.6 88.7 83.8
23 22 Yale University US 85.7 85.5 85.8 75.2 83.6
24 16 Carnegie Mellon University US 82.7 76.7 92.0 82.5 83.3
25 27 Georgia Institute of Technology (Georgia Tech) US 82.2 74.8 88.0 88.7 83.2
26= 36= Ecole Polytechnique Fédérale de Lausanne (EPFL) CH 84.9 81.3 85.1 77.4 82.7
26= 28 University of British Columbia CA 77.2 81.7 90.4 87.0 82.7
28 33 University of California, San Diego (UCSD) US 74.2 70.5 97.4 93.3 81.9
29= 40= City University of Hong Kong HK 72.3 77.3 93.1 94.1 81.8
29= 31= University of Edinburgh GB 74.4 81.0 95.7 83.5 81.8
31 20 Australian National University (ANU) AU 80.7 85.6 83.8 77.4 81.6
32 48 Nanyang Technological University (NTU) SG 74.8 82.9 87.5 87.0 81.4
33 45= The Hong Kong University of Science and Technology (HKUST) HK 76.4 88.6 90.7 74.0 81.2
34= 38 Cornell University US 82.4 79.1 85.1 76.3 81.1
34= 31= The University of Sydney AU 77.0 90.9 84.1 76.3 81.1
36 29 Kyoto University JP 85.0 76.8 80.5 77.4 80.9
37= 51-100 The University of Melbourne AU 78.4 91.7 83.9 71.6 80.8
37= 51-100 University of Wisconsin-Madison US 75.3 73.2 89.9 90.3 80.8
39 51-100 Northwestern University US 70.3 81.4 100.0 81.6 80.7
40 40= Rheinische Friedrich-Wilhelms-Universität Bonn DE 88.2 61.8 88.2 76.3 80.5
41 51-100 University of Pennsylvania US 72.5 88.4 89.5 78.5 80.3
42= 49 Lomonosov Moscow State University RU 90.0 91.7 61.6 67.6 80.2
42= 26 The Chinese University of Hong Kong (CUHK) HK 78.9 78.4 87.6 77.4 80.2
44= 45= Ecole Normale Supérieure, Paris (ENS Paris) FR 88.7 68.9 83.6 69.0 79.8
44= 25 The University of Warwick GB 85.3 77.7 81.9 69.0 79.8
46= 30 Peking University CN 78.9 77.9 80.7 81.6 79.6
46= 43 University of Illinois at Urbana-Champaign US 75.0 73.1 90.3 84.4 79.6
48 40= Brown University US 79.2 74.7 88.5 75.2 79.4
49= 51-100 Seoul National University (SNU) KR 80.4 83.3 80.1 71.6 79.2
49= 51-100 Technische Universität Berlin DE 82.4 82.4 78.3 70.3 79.2
Medicine
2015
2014
Instit
ution
Coun
try
Acad
emic
Emplo
yer
Citati
ons
H
Overa
ll
1 1 Harvard University US 100.0 100.0 96.4 100.0 99.1
2 2 University of Oxford GB 95.2 98.3 96.5 94.0 95.5
3 3 University of Cambridge GB 96.2 97.9 95.8 89.6 94.6
4 6 Johns Hopkins University US 91.3 75.1 95.5 98.3 92.5
5 4 Stanford University US 90.7 92.6 93.2 90.2 91.4
6 9 University of California, San Francisco (UCSF) US 89.9 69.7 96.5 96.8 91.3
7 5 University of California, Los Angeles (UCLA) US 88.2 87.3 94.0 92.9 90.7
8 7 Yale University US 88.7 89.3 92.8 89.5 90.0
9 16 Karolinska Institute SE 91.0 80.0 90.8 88.8 89.3
10 8 UCL (University College London) GB 84.6 88.3 92.2 94.0 89.2
11= 10 Imperial College London GB 86.7 86.4 93.1 87.4 88.4
11= 11 University of Pennsylvania US 82.8 79.6 94.4 94.7 88.4
13= 15 Duke University US 79.2 80.9 96.9 96.7 88.2
13= 14 University of Toronto CA 82.3 80.3 93.0 96.0 88.2
15 13 Columbia University US 81.3 83.1 95.1 92.7 87.8
16 18 Massachusetts Institute of Technology (MIT) US 84.2 93.7 97.2 78.3 86.9
17 17 The University of Sydney AU 84.5 88.2 89.1 85.3 86.2
18 12 The University of Melbourne AU 84.0 88.7 87.2 82.8 85.0
19 23 University of Washington US 76.7 72.0 93.5 93.8 84.7
20 20 The University of Tokyo JP 88.4 93.8 83.6 75.5 84.5
21 21= National University of Singapore (NUS) SG 87.9 94.1 85.1 72.9 84.1
22= 26 McGill University CA 79.2 78.3 91.4 85.7 83.8
22= 28 University of California, San Diego (UCSD) US 74.9 74.6 94.6 91.1 83.8
24 19 King's College London (KCL) GB 78.4 80.6 90.4 86.6 83.7
25 24= Washington University in St. Louis US 75.4 69.4 94.6 90.3 83.3
26 39 University of British Columbia CA 76.7 80.9 90.8 87.1 83.2
27 21= University of Michigan US 73.4 74.6 92.7 92.1 83.0
28 24= University of Hong Kong (HKU) HK 84.8 86.8 85.6 74.2 82.6
29 32 New York University (NYU) US 74.8 78.5 90.9 86.9 82.2
30 36= Cornell University US 75.8 79.7 91.0 84.4 82.1
31 29= University of Edinburgh GB 75.2 75.4 92.6 84.4 81.9
32 51-100 London School of Hygiene & Tropical Medicine GB 73.4 70.7 96.4 83.6 81.4
33= 27 Erasmus University Rotterdam NL 74.2 61.0 93.6 88.1 81.2
33= 50 McMaster University CA 72.3 61.1 97.1 87.7 81.2
35 51-100 Baylor College of Medicine US 76.8 62.7 92.3 84.2 81.1
36 33 Monash University AU 79.7 80.2 85.1 78.0 80.7
37= 46= University of Chicago US 73.7 68.7 92.3 84.7 80.6
37= 34 University of Copenhagen DK 69.8 80.4 90.7 87.7 80.6
39= 38 Mayo Medical School US 82.8 50.8 95.0 73.7 80.4
39= 31 Ruprecht-Karls-Universität Heidelberg DE 75.8 72.7 88.3 83.1 80.4
41 43 National Taiwan University (NTU) TW 81.9 88.6 83.1 71.1 80.2
42 46= University of Pittsburgh US 74.0 46.2 91.9 90.3 79.8
43= 51-100 Northwestern University US 68.9 75.2 91.6 86.7 79.7
43= 29= The University of New South Wales (UNSW) AU 76.0 87.1 84.7 77.6 79.7
45 41 University of Zurich CH 71.6 69.5 91.9 84.3 79.6
46= 35 Kyoto University JP 79.8 85.4 83.0 73.2 79.5
46= 44= University of Amsterdam NL 70.7 68.5 91.3 86.3 79.5
48 51-100 Seoul National University (SNU) KR 78.2 81.5 83.4 76.6 79.4
49 42 The University of Queensland (UQ) AU 75.3 81.4 85.6 78.4 79.3
50 36= Leiden University NL 68.3 74.6 91.7 84.5 78.8
To view the complete rankings, visit www.TopUniversities.com

Materials Science
2015
2014
Instit
ution
Coun
try
Acad
emic
Emplo
yer
Citati
ons
H
Overa
ll
1 1 Massachusetts Institute of Technology (MIT) US 100.0 92.1 93.4 99.1 97.3
2 2= Stanford University US 91.4 94.1 95.1 98.5 94.4
3 5 University of California, Berkeley (UCB) US 93.1 88.0 92.8 92.0 92.2
4 2= University of Cambridge GB 95.6 100.0 88.6 86.4 92.0
5 6= Northwestern University US 92.6 72.8 91.7 94.9 91.0
6= 4 Imperial College London GB 95.1 77.1 88.9 90.9 90.7
6= 6= National University of Singapore (NUS) SG 87.1 90.2 91.3 96.2 90.7
8 8 Nanyang Technological University (NTU) SG 83.8 80.2 89.1 100.0 88.8
9 9 University of Oxford GB 90.2 98.4 84.8 80.2 87.2
10 15 Georgia Institute of Technology (Georgia Tech) US 88.5 60.4 88.2 94.2 87.0
11 10 Tsinghua University CN 88.9 85.2 78.9 91.7 86.7
12 12 Harvard University US 77.0 99.5 92.7 90.5 86.6
13 27 University of Illinois at Urbana-Champaign US 88.8 65.7 87.8 87.7 86.0
14 17= The University of Tokyo JP 88.6 89.4 78.2 87.7 85.9
15 13 ETH Zurich (Swiss Federal Institute of Technology) CH 87.5 80.1 85.9 85.1 85.8
16 21= University of California, Los Angeles (UCLA) US 77.4 85.2 96.0 86.9 85.2
17 23= Ecole Polytechnique Fédérale de Lausanne (EPFL) CH 88.9 73.2 85.7 82.8 85.0
18 23= California Institute of Technology (Caltech) US 89.4 61.0 86.8 81.8 84.0
19 16 KAIST - Korea Advanced Institute of Science and Technology KR 80.2 80.4 83.3 88.1 83.0
20 34 University of California, Santa Barbara (UCSB) US 79.1 57.3 96.2 84.2 82.5
21= 31= Seoul National University (SNU) KR 80.0 84.3 82.3 84.2 82.1
21= 19 The University of Manchester GB 83.8 79.6 83.3 79.2 82.1
21= 20 Tokyo Institute of Technology JP 87.7 79.4 76.2 80.2 82.1
24= 14 Carnegie Mellon University US 84.9 75.0 88.2 73.4 81.9
24= 26 Kyoto University JP 82.6 83.3 78.1 84.2 81.9
26 17= The University of New South Wales (UNSW) AU 77.4 85.9 86.0 82.3 81.6
27 30 University of Michigan US 79.5 78.7 84.7 82.8 81.5
28 21= Pennsylvania State University US 80.9 68.3 84.4 84.2 81.3
29 25 Rheinisch-Westfälische Technische Hochschule Aachen DE 92.6 67.3 76.3 72.1 80.9
30 28 Peking University CN 70.9 87.2 85.3 88.9 80.6
31= 35= Cornell University US 75.6 78.1 88.9 80.8 80.5
31= 11 Tohoku University JP 89.8 69.6 73.0 77.6 80.5
31= 51-100 University of Texas at Austin US 68.1 71.9 93.5 90.9 80.5
34 33 University of Pennsylvania US 69.9 79.5 93.1 84.6 80.3
35 31= Shanghai Jiao Tong University CN 78.5 83.0 77.6 84.2 80.2
36 37= Pohang University of Science and Technology (POSTECH) KR 72.9 74.2 86.4 85.5 79.6
37 40 Delft University of Technology NL 85.4 65.4 79.2 74.6 79.2
38 45 University of Toronto CA 73.8 75.4 83.5 82.3 78.5
39 48= KTH, Royal Institute of Technology SE 83.4 56.3 78.1 78.1 78.0
40 43 Katholieke Universiteit Leuven BE 77.0 72.6 81.8 76.4 77.6
41= 44 National Taiwan University (NTU) TW 69.8 86.1 80.8 83.2 77.5
41= 51-100 Technical University of Denmark DK 71.0 55.7 88.0 86.0 77.5
43 37= Monash University AU 71.8 92.9 84.9 72.8 77.4
44 29 The Hong Kong University of Science and Technology (HKUST) HK 72.2 80.1 85.5 75.2 77.1
45 46= KIT, Karlsruher Institut für Technologie DE 75.8 67.0 79.5 79.7 76.8
46 35= Osaka University JP 74.7 79.3 73.0 81.3 76.4
47= 51-100 McGill University CA 79.4 73.8 78.2 70.1 76.2
47= 48= Purdue University US 72.5 63.7 82.2 81.3 76.2
49 42 Princeton University US 65.8 85.0 89.3 74.6 75.8
50 39 The University of Sheffield GB 80.5 68.2 79.0 67.2 75.6
Modern Languages
2015
2014
Instit
ution
Coun
try
Acad
emic
Emplo
yer
Citati
ons
H
Overa
ll
1 1 University of Oxford GB 100.0 100.0 100.0
2 2 University of Cambridge GB 99.8 98.8 99.5
3 3 Harvard University US 99.1 94.6 97.8
4 4 University of California, Berkeley (UCB) US 94.3 84.6 91.4
5 22 Peking University CN 92.2 84.7 90.0
6 13 The University of Tokyo JP 92.3 83.7 89.7
7 5= Yale University US 91.7 83.9 89.4
8 5= Stanford University US 90.4 84.8 88.7
9 16 Université Paris-Sorbonne (Paris IV) FR 90.7 81.0 87.8
10 9 University of California, Los Angeles (UCLA) US 91.3 78.5 87.5
11 10 National University of Singapore (NUS) SG 87.6 84.1 86.6
12 19 Columbia University US 90.0 77.8 86.3
13 7 Princeton University US 89.2 79.2 86.2
14 20 Humboldt-Universität zu Berlin DE 90.2 76.0 85.9
15 17 University of Hong Kong (HKU) HK 86.4 84.0 85.7
16 47 Seoul National University (SNU) KR 87.5 81.3 85.6
17= 34 Kyoto University JP 90.0 74.9 85.5
17= 8 UCL (University College London) GB 87.0 81.9 85.5
19 18 Massachusetts Institute of Technology (MIT) US 83.8 87.4 84.9
20 101-150
Sungkyunkwan University KR 83.9 86.6 84.7
21 14= University of Toronto CA 87.7 75.9 84.2
22= 49= New York University (NYU) US 86.3 79.0 84.1
22= 27 University of Chicago US 88.2 74.5 84.1
24 14= Australian National University (ANU) AU 85.3 80.5 83.9
25 33 The University of Manchester GB 83.3 85.0 83.8
26 12 University of Edinburgh GB 85.9 78.0 83.5
27= 51-100 Korea University KR 85.6 76.1 82.8
27= 30 Ludwig-Maximilians-Universität München DE 87.6 71.5 82.8
27= 40 Yonsei University KR 84.1 79.9 82.8
30= 21 Ruprecht-Karls-Universität Heidelberg DE 84.5 78.6 82.7
30= 11 The Chinese University of Hong Kong (CUHK) HK 86.2 74.5 82.7
32 31 Freie Universität Berlin DE 89.0 66.3 82.2
33 24 The University of Warwick GB 81.4 83.6 82.1
34 35 McGill University CA 83.5 78.6 82.0
35 51-100 Tsinghua University CN 81.9 81.4 81.8
36 51-100 Fudan University CN 83.4 76.9 81.5
37= 25 Cornell University US 84.7 73.2 81.3
37= 26 Universidad de Buenos Aires AR 83.3 76.5 81.3
39 51-100 National Taiwan University (NTU) TW 85.5 70.5 81.0
40 49= King's College London (KCL) GB 80.0 82.6 80.8
41 38 University of Michigan US 86.1 67.8 80.6
42 28 Duke University US 85.6 68.7 80.5
43 43 University of Amsterdam NL 84.3 69.3 79.8
44 23 The University of Melbourne AU 81.0 76.6 79.7
45 46 The University of Sydney AU 80.2 77.7 79.5
46= 29 Hankuk University of Foreign Studies KR 82.3 71.9 79.2
46= 51-100 Università di Bologna (UNIBO) IT 83.8 68.4 79.2
48 51-100 Lomonosov Moscow State University RU 81.2 73.7 79.0
49= 39 Brown University US 82.0 71.2 78.8
49= 42 Trinity College Dublin (TCD) IE 79.7 76.6 78.8
49= 51-100 University of British Columbia CA 83.0 69.0 78.8
49= 36 Waseda University JP 83.7 67.3 78.8
To view the complete rankings, visit www.TopUniversities.com

UKRAINE
ITALYTURKEY
SPAIN
FRAN
CE
GERMANY
NO
RW
AY
ESTONIA
LATVIA
LITHUANIA
ROMANIA
BULGARIA
AUSTRIA
SWITZERLAND
GREECE
SERBIA
DEN
MAR
K
NETH
ERLA
DS
POLA
ND
UNITED KINGDOM
IRELAND
TOP-700 of QS World University Rankings and TOP-70 of QS University
Rankings in Emerging Europe & Central Asia 2014/15
The most dynamic and one of the best universities in Ukraine (according to Ukraine’s Top-200,
U-Multirank, Webometrics, SCImago, UI Greenmetric etc)
3 stars for meeting the world-class standards
and 5 stars for teaching, e-learning, inclusiveness and social responsibility
FOCUSING ON ENGINEERING AND TECHNOLOGIES, MEDICINE AND SOCIAL SCIENCES SUMY STATE UNIVERSITY STRIVES TO BUILD THE EUROPEAN-CLASS UNIVERSITY IN UKRAINE WHICH PROVIDES REGIONAL, NATIONAL AND GLOBAL MARKETS WITH HIGH QUALITY SERVICES IN RESEARCH, TEACHING AND KNOWLEDGE TRANSFER
REGIONAL ENGAGEMENT. NATIONAL RESPONSIBILITY. GLOBAL IMPACT
CROSSING THE PATTERNS
SUMY STATEUNIVERSITY
http://sumdu.edu.ua/int
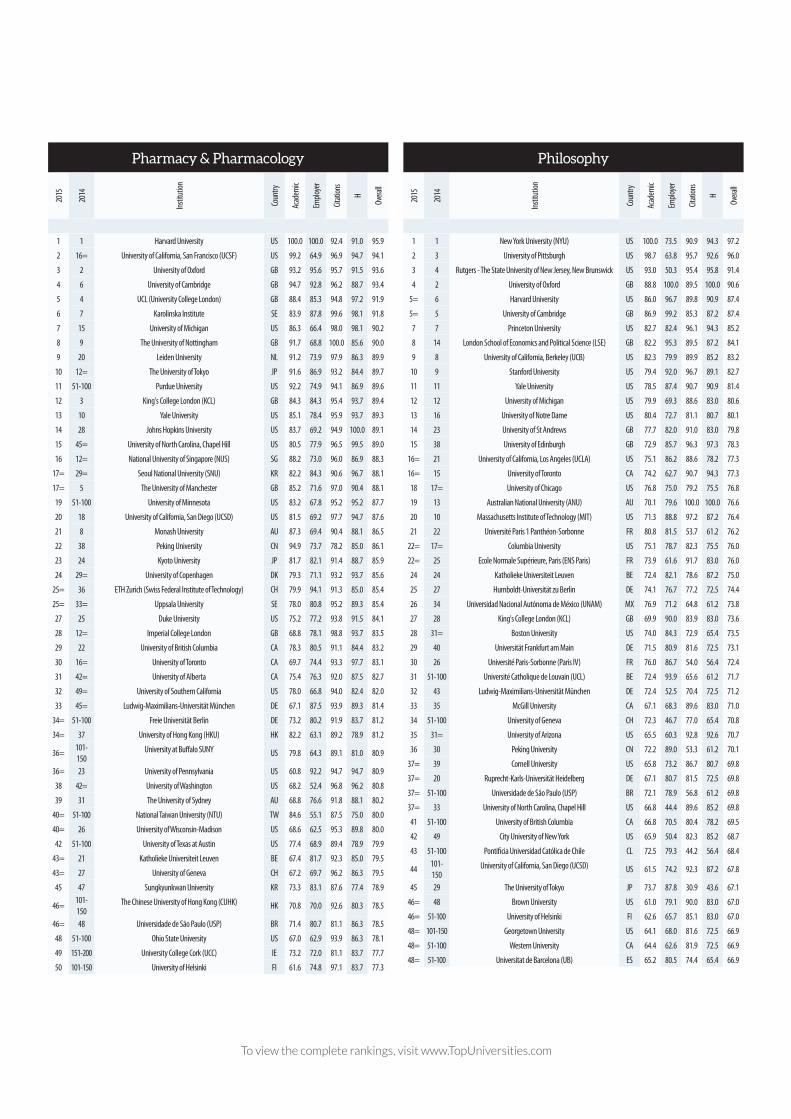
Pharmacy & Pharmacology
2015
2014
Instit
ution
Coun
try
Acad
emic
Emplo
yer
Citati
ons
H
Overa
ll
1 1 Harvard University US 100.0 100.0 92.4 91.0 95.9
2 16= University of California, San Francisco (UCSF) US 99.2 64.9 96.9 94.7 94.1
3 2 University of Oxford GB 93.2 95.6 95.7 91.5 93.6
4 6 University of Cambridge GB 94.7 92.8 96.2 88.7 93.4
5 4 UCL (University College London) GB 88.4 85.3 94.8 97.2 91.9
6 7 Karolinska Institute SE 83.9 87.8 99.6 98.1 91.8
7 15 University of Michigan US 86.3 66.4 98.0 98.1 90.2
8 9 The University of Nottingham GB 91.7 68.8 100.0 85.6 90.0
9 20 Leiden University NL 91.2 73.9 97.9 86.3 89.9
10 12= The University of Tokyo JP 91.6 86.9 93.2 84.4 89.7
11 51-100 Purdue University US 92.2 74.9 94.1 86.9 89.6
12 3 King's College London (KCL) GB 84.3 84.3 95.4 93.7 89.4
13 10 Yale University US 85.1 78.4 95.9 93.7 89.3
14 28 Johns Hopkins University US 83.7 69.2 94.9 100.0 89.1
15 45= University of North Carolina, Chapel Hill US 80.5 77.9 96.5 99.5 89.0
16 12= National University of Singapore (NUS) SG 88.2 73.0 96.0 86.9 88.3
17= 29= Seoul National University (SNU) KR 82.2 84.3 90.6 96.7 88.1
17= 5 The University of Manchester GB 85.2 71.6 97.0 90.4 88.1
19 51-100 University of Minnesota US 83.2 67.8 95.2 95.2 87.7
20 18 University of California, San Diego (UCSD) US 81.5 69.2 97.7 94.7 87.6
21 8 Monash University AU 87.3 69.4 90.4 88.1 86.5
22 38 Peking University CN 94.9 73.7 78.2 85.0 86.1
23 24 Kyoto University JP 81.7 82.1 91.4 88.7 85.9
24 29= University of Copenhagen DK 79.3 71.1 93.2 93.7 85.6
25= 36 ETH Zurich (Swiss Federal Institute of Technology) CH 79.9 94.1 91.3 85.0 85.4
25= 33= Uppsala University SE 78.0 80.8 95.2 89.3 85.4
27 25 Duke University US 75.2 77.2 93.8 91.5 84.1
28 12= Imperial College London GB 68.8 78.1 98.8 93.7 83.5
29 22 University of British Columbia CA 78.3 80.5 91.1 84.4 83.2
30 16= University of Toronto CA 69.7 74.4 93.3 97.7 83.1
31 42= University of Alberta CA 75.4 76.3 92.0 87.5 82.7
32 49= University of Southern California US 78.0 66.8 94.0 82.4 82.0
33 45= Ludwig-Maximilians-Universität München DE 67.1 87.5 93.9 89.3 81.4
34= 51-100 Freie Universität Berlin DE 73.2 80.2 91.9 83.7 81.2
34= 37 University of Hong Kong (HKU) HK 82.2 63.1 89.2 78.9 81.2
36=101-150
University at Buffalo SUNY US 79.8 64.3 89.1 81.0 80.9
36= 23 University of Pennsylvania US 60.8 92.2 94.7 94.7 80.9
38 42= University of Washington US 68.2 52.4 96.8 96.2 80.8
39 31 The University of Sydney AU 68.8 76.6 91.8 88.1 80.2
40= 51-100 National Taiwan University (NTU) TW 84.6 55.1 87.5 75.0 80.0
40= 26 University of Wisconsin-Madison US 68.6 62.5 95.3 89.8 80.0
42 51-100 University of Texas at Austin US 77.4 68.9 89.4 78.9 79.9
43= 21 Katholieke Universiteit Leuven BE 67.4 81.7 92.3 85.0 79.5
43= 27 University of Geneva CH 67.2 69.7 96.2 86.3 79.5
45 47 Sungkyunkwan University KR 73.3 83.1 87.6 77.4 78.9
46=101-150
The Chinese University of Hong Kong (CUHK) HK 70.8 70.0 92.6 80.3 78.5
46= 48 Universidade de São Paulo (USP) BR 71.4 80.7 81.1 86.3 78.5
48 51-100 Ohio State University US 67.0 62.9 93.9 86.3 78.1
49 151-200 University College Cork (UCC) IE 73.2 72.0 81.1 83.7 77.7
50 101-150 University of Helsinki FI 61.6 74.8 97.1 83.7 77.3
Philosophy
2015
2014
Instit
ution
Coun
try
Acad
emic
Emplo
yer
Citati
ons
H
Overa
ll
1 1 New York University (NYU) US 100.0 73.5 90.9 94.3 97.2
2 3 University of Pittsburgh US 98.7 63.8 95.7 92.6 96.0
3 4 Rutgers - The State University of New Jersey, New Brunswick US 93.0 50.3 95.4 95.8 91.4
4 2 University of Oxford GB 88.8 100.0 89.5 100.0 90.6
5= 6 Harvard University US 86.0 96.7 89.8 90.9 87.4
5= 5 University of Cambridge GB 86.9 99.2 85.3 87.2 87.4
7 7 Princeton University US 82.7 82.4 96.1 94.3 85.2
8 14 London School of Economics and Political Science (LSE) GB 82.2 95.3 89.5 87.2 84.1
9 8 University of California, Berkeley (UCB) US 82.3 79.9 89.9 85.2 83.2
10 9 Stanford University US 79.4 92.0 96.7 89.1 82.7
11 11 Yale University US 78.5 87.4 90.7 90.9 81.4
12 12 University of Michigan US 79.9 69.3 88.6 83.0 80.6
13 16 University of Notre Dame US 80.4 72.7 81.1 80.7 80.1
14 23 University of St Andrews GB 77.7 82.0 91.0 83.0 79.8
15 38 University of Edinburgh GB 72.9 85.7 96.3 97.3 78.3
16= 21 University of California, Los Angeles (UCLA) US 75.1 86.2 88.6 78.2 77.3
16= 15 University of Toronto CA 74.2 62.7 90.7 94.3 77.3
18 17= University of Chicago US 76.8 75.0 79.2 75.5 76.8
19 13 Australian National University (ANU) AU 70.1 79.6 100.0 100.0 76.6
20 10 Massachusetts Institute of Technology (MIT) US 71.3 88.8 97.2 87.2 76.4
21 22 Université Paris 1 Panthéon-Sorbonne FR 80.8 81.5 53.7 61.2 76.2
22= 17= Columbia University US 75.1 78.7 82.3 75.5 76.0
22= 25 Ecole Normale Supérieure, Paris (ENS Paris) FR 73.9 61.6 91.7 83.0 76.0
24 24 Katholieke Universiteit Leuven BE 72.4 82.1 78.6 87.2 75.0
25 27 Humboldt-Universität zu Berlin DE 74.1 76.7 77.2 72.5 74.4
26 34 Universidad Nacional Autónoma de México (UNAM) MX 76.9 71.2 64.8 61.2 73.8
27 28 King's College London (KCL) GB 69.9 90.0 83.9 83.0 73.6
28 31= Boston University US 74.0 84.3 72.9 65.4 73.5
29 40 Universität Frankfurt am Main DE 71.5 80.9 81.6 72.5 73.1
30 26 Université Paris-Sorbonne (Paris IV) FR 76.0 86.7 54.0 56.4 72.4
31 51-100 Université Catholique de Louvain (UCL) BE 72.4 93.9 65.6 61.2 71.7
32 43 Ludwig-Maximilians-Universität München DE 72.4 52.5 70.4 72.5 71.2
33 35 McGill University CA 67.1 68.3 89.6 83.0 71.0
34 51-100 University of Geneva CH 72.3 46.7 77.0 65.4 70.8
35 31= University of Arizona US 65.5 60.3 92.8 92.6 70.7
36 30 Peking University CN 72.2 89.0 53.3 61.2 70.1
37= 39 Cornell University US 65.8 73.2 86.7 80.7 69.8
37= 20 Ruprecht-Karls-Universität Heidelberg DE 67.1 80.7 81.5 72.5 69.8
37= 51-100 Universidade de São Paulo (USP) BR 72.1 78.9 56.8 61.2 69.8
37= 33 University of North Carolina, Chapel Hill US 66.8 44.4 89.6 85.2 69.8
41 51-100 University of British Columbia CA 66.8 70.5 80.4 78.2 69.5
42 49 City University of New York US 65.9 50.4 82.3 85.2 68.7
43 51-100 Pontificia Universidad Católica de Chile CL 72.5 79.3 44.2 56.4 68.4
44 101-150
University of California, San Diego (UCSD) US 61.5 74.2 92.3 87.2 67.8
45 29 The University of Tokyo JP 73.7 87.8 30.9 43.6 67.1
46= 48 Brown University US 61.0 79.1 90.0 83.0 67.0
46= 51-100 University of Helsinki FI 62.6 65.7 85.1 83.0 67.0
48= 101-150 Georgetown University US 64.1 68.0 81.6 72.5 66.9
48= 51-100 Western University CA 64.4 62.6 81.9 72.5 66.9
48= 51-100 Universitat de Barcelona (UB) ES 65.2 80.5 74.4 65.4 66.9
To view the complete rankings, visit www.TopUniversities.com
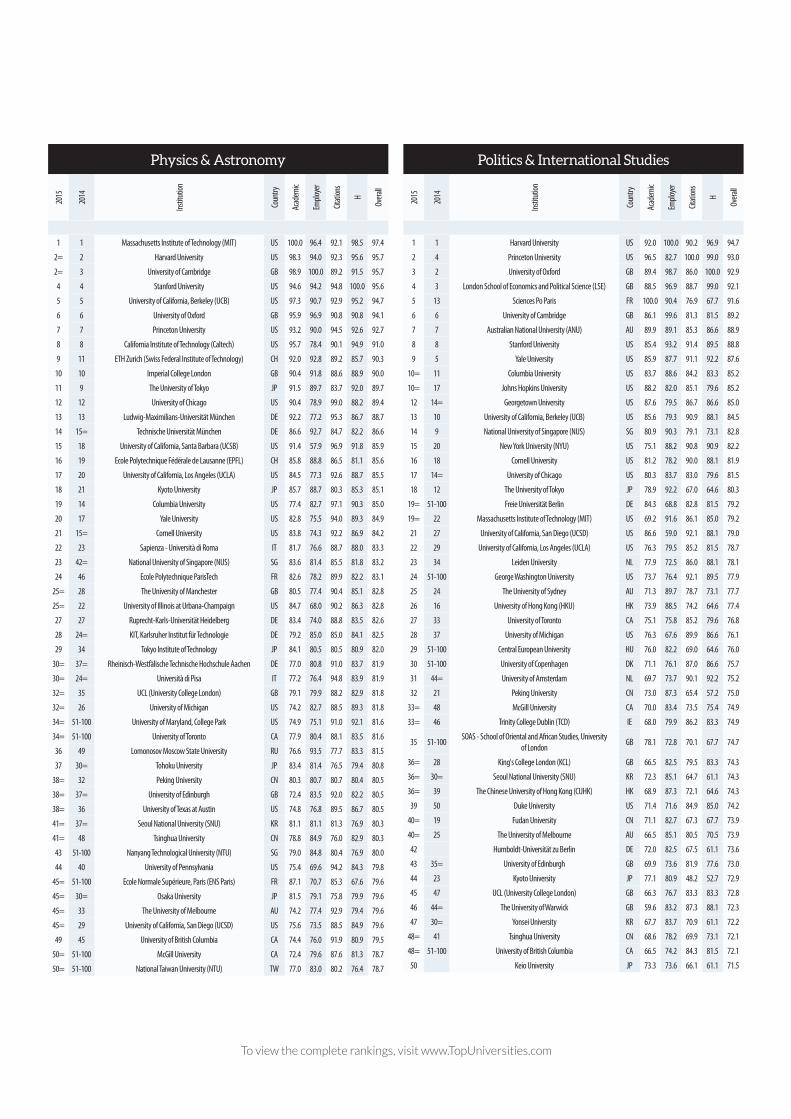
Physics & Astronomy
2015
2014
Instit
ution
Coun
try
Acad
emic
Emplo
yer
Citati
ons
H
Overa
ll
1 1 Massachusetts Institute of Technology (MIT) US 100.0 96.4 92.1 98.5 97.4
2= 2 Harvard University US 98.3 94.0 92.3 95.6 95.7
2= 3 University of Cambridge GB 98.9 100.0 89.2 91.5 95.7
4 4 Stanford University US 94.6 94.2 94.8 100.0 95.6
5 5 University of California, Berkeley (UCB) US 97.3 90.7 92.9 95.2 94.7
6 6 University of Oxford GB 95.9 96.9 90.8 90.8 94.1
7 7 Princeton University US 93.2 90.0 94.5 92.6 92.7
8 8 California Institute of Technology (Caltech) US 95.7 78.4 90.1 94.9 91.0
9 11 ETH Zurich (Swiss Federal Institute of Technology) CH 92.0 92.8 89.2 85.7 90.3
10 10 Imperial College London GB 90.4 91.8 88.6 88.9 90.0
11 9 The University of Tokyo JP 91.5 89.7 83.7 92.0 89.7
12 12 University of Chicago US 90.4 78.9 99.0 88.2 89.4
13 13 Ludwig-Maximilians-Universität München DE 92.2 77.2 95.3 86.7 88.7
14 15= Technische Universität München DE 86.6 92.7 84.7 82.2 86.6
15 18 University of California, Santa Barbara (UCSB) US 91.4 57.9 96.9 91.8 85.9
16 19 Ecole Polytechnique Fédérale de Lausanne (EPFL) CH 85.8 88.8 86.5 81.1 85.6
17 20 University of California, Los Angeles (UCLA) US 84.5 77.3 92.6 88.7 85.5
18 21 Kyoto University JP 85.7 88.7 80.3 85.3 85.1
19 14 Columbia University US 77.4 82.7 97.1 90.3 85.0
20 17 Yale University US 82.8 75.5 94.0 89.3 84.9
21 15= Cornell University US 83.8 74.3 92.2 86.9 84.2
22 23 Sapienza - Università di Roma IT 81.7 76.6 88.7 88.0 83.3
23 42= National University of Singapore (NUS) SG 83.6 81.4 85.5 81.8 83.2
24 46 Ecole Polytechnique ParisTech FR 82.6 78.2 89.9 82.2 83.1
25= 28 The University of Manchester GB 80.5 77.4 90.4 85.1 82.8
25= 22 University of Illinois at Urbana-Champaign US 84.7 68.0 90.2 86.3 82.8
27 27 Ruprecht-Karls-Universität Heidelberg DE 83.4 74.0 88.8 83.5 82.6
28 24= KIT, Karlsruher Institut für Technologie DE 79.2 85.0 85.0 84.1 82.5
29 34 Tokyo Institute of Technology JP 84.1 80.5 80.5 80.9 82.0
30= 37= Rheinisch-Westfälische Technische Hochschule Aachen DE 77.0 80.8 91.0 83.7 81.9
30= 24= Università di Pisa IT 77.2 76.4 94.8 83.9 81.9
32= 35 UCL (University College London) GB 79.1 79.9 88.2 82.9 81.8
32= 26 University of Michigan US 74.2 82.7 88.5 89.3 81.8
34= 51-100 University of Maryland, College Park US 74.9 75.1 91.0 92.1 81.6
34= 51-100 University of Toronto CA 77.9 80.4 88.1 83.5 81.6
36 49 Lomonosov Moscow State University RU 76.6 93.5 77.7 83.3 81.5
37 30= Tohoku University JP 83.4 81.4 76.5 79.4 80.8
38= 32 Peking University CN 80.3 80.7 80.7 80.4 80.5
38= 37= University of Edinburgh GB 72.4 83.5 92.0 82.2 80.5
38= 36 University of Texas at Austin US 74.8 76.8 89.5 86.7 80.5
41= 37= Seoul National University (SNU) KR 81.1 81.1 81.3 76.9 80.3
41= 48 Tsinghua University CN 78.8 84.9 76.0 82.9 80.3
43 51-100 Nanyang Technological University (NTU) SG 79.0 84.8 80.4 76.9 80.0
44 40 University of Pennsylvania US 75.4 69.6 94.2 84.3 79.8
45= 51-100 Ecole Normale Supérieure, Paris (ENS Paris) FR 87.1 70.7 85.3 67.6 79.6
45= 30= Osaka University JP 81.5 79.1 75.8 79.9 79.6
45= 33 The University of Melbourne AU 74.2 77.4 92.9 79.4 79.6
45= 29 University of California, San Diego (UCSD) US 75.6 73.5 88.5 84.9 79.6
49 45 University of British Columbia CA 74.4 76.0 91.9 80.9 79.5
50= 51-100 McGill University CA 72.4 79.6 87.6 81.3 78.7
50= 51-100 National Taiwan University (NTU) TW 77.0 83.0 80.2 76.4 78.7
Politics & International Studies
2015
2014
Instit
ution
Coun
try
Acad
emic
Emplo
yer
Citati
ons
H
Overa
ll
1 1 Harvard University US 92.0 100.0 90.2 96.9 94.7
2 4 Princeton University US 96.5 82.7 100.0 99.0 93.0
3 2 University of Oxford GB 89.4 98.7 86.0 100.0 92.9
4 3 London School of Economics and Political Science (LSE) GB 88.5 96.9 88.7 99.0 92.1
5 13 Sciences Po Paris FR 100.0 90.4 76.9 67.7 91.6
6 6 University of Cambridge GB 86.1 99.6 81.3 81.5 89.2
7 7 Australian National University (ANU) AU 89.9 89.1 85.3 86.6 88.9
8 8 Stanford University US 85.4 93.2 91.4 89.5 88.8
9 5 Yale University US 85.9 87.7 91.1 92.2 87.6
10= 11 Columbia University US 83.7 88.6 84.2 83.3 85.2
10= 17 Johns Hopkins University US 88.2 82.0 85.1 79.6 85.2
12 14= Georgetown University US 87.6 79.5 86.7 86.6 85.0
13 10 University of California, Berkeley (UCB) US 85.6 79.3 90.9 88.1 84.5
14 9 National University of Singapore (NUS) SG 80.9 90.3 79.1 73.1 82.8
15 20 New York University (NYU) US 75.1 88.2 90.8 90.9 82.2
16 18 Cornell University US 81.2 78.2 90.0 88.1 81.9
17 14= University of Chicago US 80.3 83.7 83.0 79.6 81.5
18 12 The University of Tokyo JP 78.9 92.2 67.0 64.6 80.3
19= 51-100 Freie Universität Berlin DE 84.3 68.8 82.8 81.5 79.2
19= 22 Massachusetts Institute of Technology (MIT) US 69.2 91.6 86.1 85.0 79.2
21 27 University of California, San Diego (UCSD) US 86.6 59.0 92.1 88.1 79.0
22 29 University of California, Los Angeles (UCLA) US 76.3 79.5 85.2 81.5 78.7
23 34 Leiden University NL 77.9 72.5 86.0 88.1 78.1
24 51-100 George Washington University US 73.7 76.4 92.1 89.5 77.9
25 24 The University of Sydney AU 71.3 89.7 78.7 73.1 77.7
26 16 University of Hong Kong (HKU) HK 73.9 88.5 74.2 64.6 77.4
27 33 University of Toronto CA 75.1 75.8 85.2 79.6 76.8
28 37 University of Michigan US 76.3 67.6 89.9 86.6 76.1
29 51-100 Central European University HU 76.0 82.2 69.0 64.6 76.0
30 51-100 University of Copenhagen DK 71.1 76.1 87.0 86.6 75.7
31 44= University of Amsterdam NL 69.7 73.7 90.1 92.2 75.2
32 21 Peking University CN 73.0 87.3 65.4 57.2 75.0
33= 48 McGill University CA 70.0 83.4 73.5 75.4 74.9
33= 46 Trinity College Dublin (TCD) IE 68.0 79.9 86.2 83.3 74.9
35 51-100 SOAS - School of Oriental and African Studies, University
of London GB 78.1 72.8 70.1 67.7 74.7
36= 28 King's College London (KCL) GB 66.5 82.5 79.5 83.3 74.3
36= 30= Seoul National University (SNU) KR 72.3 85.1 64.7 61.1 74.3
36= 39 The Chinese University of Hong Kong (CUHK) HK 68.9 87.3 72.1 64.6 74.3
39 50 Duke University US 71.4 71.6 84.9 85.0 74.2
40= 19 Fudan University CN 71.1 82.7 67.3 67.7 73.9
40= 25 The University of Melbourne AU 66.5 85.1 80.5 70.5 73.9
42 Humboldt-Universität zu Berlin DE 72.0 82.5 67.5 61.1 73.6
43 35= University of Edinburgh GB 69.9 73.6 81.9 77.6 73.0
44 23 Kyoto University JP 77.1 80.9 48.2 52.7 72.9
45 47 UCL (University College London) GB 66.3 76.7 83.3 83.3 72.8
46 44= The University of Warwick GB 59.6 83.2 87.3 88.1 72.3
47 30= Yonsei University KR 67.7 83.7 70.9 61.1 72.2
48= 41 Tsinghua University CN 68.6 78.2 69.9 73.1 72.1
48= 51-100 University of British Columbia CA 66.5 74.2 84.3 81.5 72.1
50 Keio University JP 73.3 73.6 66.1 61.1 71.5
To view the complete rankings, visit www.TopUniversities.com

C
M
Y
CM
MY
CY
CMY
K
Innovation & Entrepreneurship Advert [FINAL].pdf 1 4/23/15 11:59 AM

C
M
Y
CM
MY
CY
CMY
K
Innovation & Entrepreneurship Advert [FINAL].pdf 1 4/23/15 11:59 AM
Psychology
2015
2014
Instit
ution
Coun
try
Acad
emic
Emplo
yer
Citati
ons
H
Overa
ll
1 1 Harvard University US 100.0 96.6 95.3 98.0 98.0
2 2 University of Cambridge GB 96.6 97.2 94.1 86.2 94.1
3 4 Stanford University US 95.5 81.7 97.3 96.2 93.2
4 3 University of Oxford GB 94.8 97.4 92.3 85.3 92.9
5= 6 University of California, Los Angeles (UCLA) US 91.2 75.1 97.0 100.0 90.9
5= 5 Yale University US 90.7 80.7 96.0 96.2 90.9
7= 10= University of California, Berkeley (UCB) US 91.7 77.1 95.7 89.5 89.1
7= 7 University of Michigan US 93.9 63.4 96.1 98.3 89.1
9 9 UCL (University College London) GB 89.8 77.1 93.3 95.1 89.0
10 12 Princeton University US 91.5 75.6 100.0 79.9 87.7
11= 8 New York University (NYU) US 89.7 76.4 91.2 87.7 86.9
11= 16 University of Amsterdam NL 86.8 71.4 95.0 94.4 86.9
13 13 University of Pennsylvania US 85.7 76.5 93.3 91.6 86.6
14 10= The University of Melbourne AU 84.0 97.2 88.2 78.7 86.4
15 15 The University of New South Wales (UNSW) AU 85.3 93.7 87.4 79.3 86.2
16 17 Columbia University US 82.2 76.1 92.7 93.2 85.3
17 21 University of Chicago US 85.6 73.6 95.5 84.3 84.9
18= 14 The University of Queensland (UQ) AU 83.8 89.9 85.2 79.3 84.4
18= 18 University of Toronto CA 83.4 74.8 89.4 90.8 84.4
20 Massachusetts Institute of Technology (MIT) US 84.7 81.7 94.4 74.3 84.0
21 27 University of British Columbia CA 80.6 74.9 94.1 89.5 83.9
22 28 King's College London (KCL) GB 76.7 75.1 96.1 92.4 83.4
23 20 McGill University CA 84.2 75.0 89.2 81.1 82.7
24= 24 The University of Sydney AU 79.4 100.0 81.5 72.2 82.5
24= 23 University of Illinois at Urbana-Champaign US 86.3 61.8 91.4 86.7 82.5
26 30 Australian National University (ANU) AU 81.7 92.3 83.9 67.5 81.4
27 31 The University of Western Australia (UWA) AU 80.5 77.4 89.4 74.3 80.4
28 34 The University of Auckland NZ 77.4 98.0 82.6 65.8 80.2
29 46 University of Minnesota US 81.9 52.0 91.8 91.2 79.8
30 32= University of Ghent BE 74.1 73.1 93.0 84.3 79.7
31 19 University of Otago NZ 76.3 87.7 88.7 69.2 79.6
32 47 University of Texas at Austin US 75.0 65.2 93.4 88.6 79.4
33 43 University of Wisconsin-Madison US 76.4 63.1 92.4 87.7 79.2
34 25= University of Hong Kong (HKU) HK 76.3 90.8 82.0 69.9 79.1
35 32= Duke University US 72.2 64.9 96.0 89.0 78.9
36 40 Cardiff University GB 78.5 68.0 91.0 78.1 78.8
37 29 University of Edinburgh GB 75.4 71.3 91.2 78.7 78.4
38 51-100 Northwestern University US 73.3 58.6 95.4 90.3 78.2
39 51-100 Vrije Universiteit Amsterdam NL 72.0 64.0 95.9 86.2 78.0
40 22 London School of Economics and Political Science (LSE) GB 86.2 91.6 69.6 55.9 77.9
41= 25= National University of Singapore (NUS) SG 76.2 93.6 78.5 63.1 77.5
41= 36 The University of Manchester GB 68.9 80.5 89.3 79.9 77.5
43 41 The Chinese University of Hong Kong (CUHK) HK 74.2 85.3 83.8 68.4 77.2
44 45 Nanyang Technological University (NTU) SG 79.3 77.1 80.9 67.5 76.8
45 51-100 Brown University US 72.2 69.2 89.0 81.1 76.7
46=101-150
Ohio State University US 79.7 50.2 90.3 83.2 76.6
46= 44 University of California, San Diego (UCSD) US 68.4 59.5 94.9 91.6 76.6
48= 51-100 Erasmus University Rotterdam NL 70.7 69.8 92.0 79.3 76.5
48= 38= Monash University AU 66.9 96.3 81.5 70.7 76.5
50 51-100 Radboud University Nijmegen NL 71.6 59.2 91.5 88.1 76.4
Sociology
2015
2014
Instit
ution
Coun
try
Acad
emic
Emplo
yer
Citati
ons
H
Overa
ll
1 1 Harvard University US 99.0 100.0 96.7 100.0 99.1
2 2= University of California, Berkeley (UCB) US 97.3 90.9 95.4 96.9 96.5
3 4 University of Wisconsin-Madison US 100.0 83.5 91.2 84.2 95.5
4 6 University of Oxford GB 94.6 98.8 92.3 92.9 94.7
5 5 London School of Economics and Political Science (LSE) GB 96.2 93.9 89.9 86.3 94.2
6 2= University of California, Los Angeles (UCLA) US 95.8 86.5 93.4 90.1 93.9
7 7 Stanford University US 90.5 94.6 97.1 97.4 92.3
8 8 University of Chicago US 93.5 84.6 92.6 84.2 91.2
9 12 University of Cambridge GB 92.8 96.0 83.9 77.7 90.4
10 10 Princeton University US 88.4 85.9 96.7 92.4 89.2
11 9 Columbia University US 88.2 79.8 92.0 90.7 87.9
12= 11 University of Michigan US 86.8 83.2 92.5 93.5 87.7
12= 13 Yale University US 86.4 83.6 96.1 94.0 87.7
14= 14= The University of Manchester GB 84.7 79.7 93.9 90.1 85.5
14= 18 University of Amsterdam NL 87.4 67.7 90.3 87.0 85.5
16 14= Australian National University (ANU) AU 85.8 93.2 84.7 76.8 85.1
17 17 National University of Singapore (NUS) SG 88.6 77.4 84.6 72.7 84.9
18 21 University of Toronto CA 82.5 79.1 87.6 84.2 82.7
19 16 University of Edinburgh GB 85.5 71.3 87.2 73.8 82.4
20 20 University of North Carolina, Chapel Hill US 81.7 60.5 96.5 94.0 82.2
21 30= Monash University AU 82.2 85.9 80.1 70.5 80.7
22 19 New York University (NYU) US 76.6 88.8 90.6 88.3 80.3
23 23 The University of Warwick GB 79.9 79.1 83.4 73.8 79.1
24 The University of Tokyo JP 85.5 89.8 64.9 45.6 78.9
25 22 The University of Queensland (UQ) AU 79.6 74.6 85.9 75.8 78.8
26 39 The Chinese University of Hong Kong (CUHK) HK 79.7 85.7 84.1 66.7 78.6
27 26 Lancaster University GB 76.5 74.5 94.2 82.7 78.1
28 25 Cornell University US 76.4 64.4 93.1 88.9 77.9
29 51-100 The University of Sydney AU 77.8 78.4 83.0 74.8 77.7
30= 34 Freie Universität Berlin DE 79.9 68.8 84.1 68.0 77.2
30= 32 Humboldt-Universität zu Berlin DE 84.2 63.1 74.1 55.2 77.2
32 30= Seoul National University (SNU) KR 78.5 93.3 74.3 60.7 77.1
33= 35 Massachusetts Institute of Technology (MIT) US 71.3 91.5 96.7 87.0 76.9
33= 49= Peking University CN 81.0 80.4 77.9 55.2 76.9
35 49= Stockholm University SE 80.7 35.0 93.6 80.3 76.7
36 24 University of Essex GB 80.2 33.4 94.7 82.0 76.5
37 41= University of Hong Kong (HKU) HK 78.1 80.3 80.9 62.3 76.1
38 51-100 University of Copenhagen DK 75.7 81.5 84.7 69.3 75.8
39 46 University of British Columbia CA 71.4 89.1 90.7 82.0 75.7
40 27 Utrecht University NL 75.3 59.8 90.1 82.7 75.6
41 29 Duke University US 70.8 84.1 92.2 86.3 75.5
42 51-100 Universidad Nacional Autónoma de México (UNAM) MX 81.4 82.2 60.7 42.7 74.6
43 37 University of Pennsylvania US 70.5 77.7 92.0 85.0 74.5
44 28 The University of Melbourne AU 71.6 88.7 83.8 74.8 74.4
45 Goldsmiths, University of London GB 82.1 34.1 73.2 63.8 74.1
46 Université Paris-Sorbonne (Paris IV) FR 80.4 78.4 59.5 45.6 73.9
47 43 Johns Hopkins University US 74.0 68.9 84.9 71.6 73.7
48 44= University of Texas at Austin US 67.5 82.8 93.1 89.5 73.6
49 51-100 The University of Auckland NZ 70.0 94.9 85.6 71.6 73.5
50 40 Northwestern University US 68.6 60.1 100.0 94.5 73.2
To view the complete rankings, visit www.TopUniversities.com
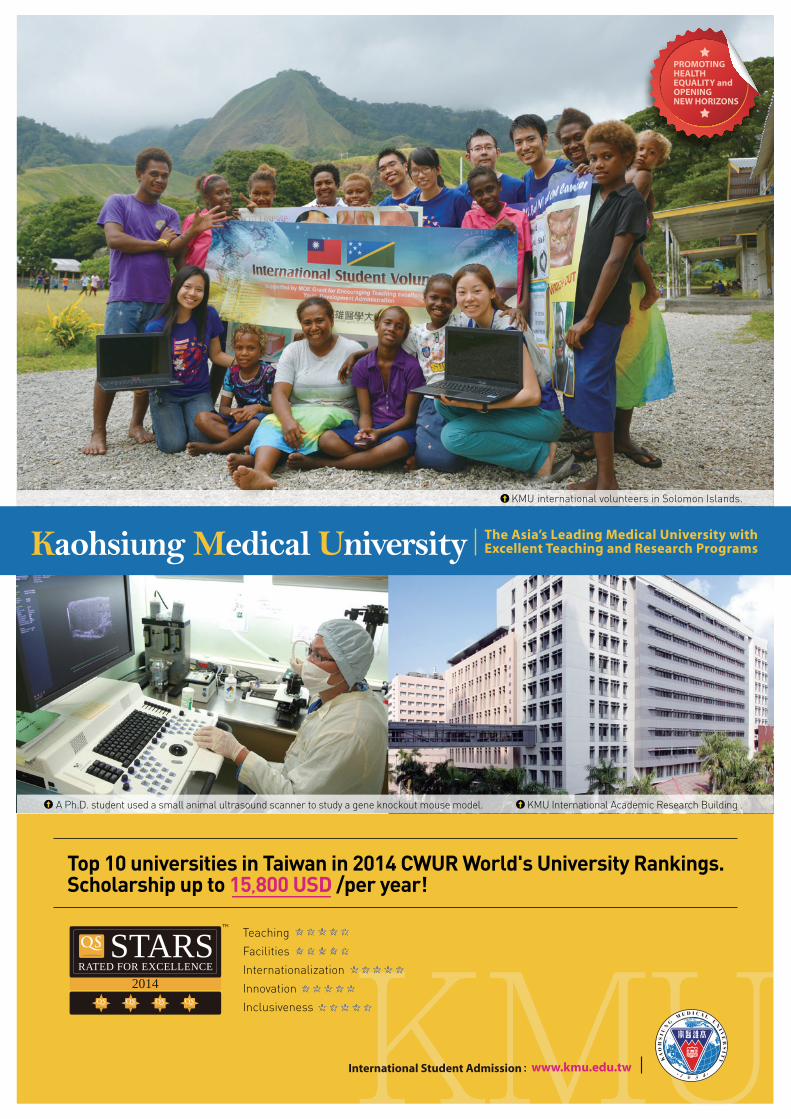

Statistics & Operational Research
2015
2014
Instit
ution
Coun
try
Acad
emic
Emplo
yer
Citati
ons
H
Overa
ll
1 1 Stanford University US 93.1 94.9 96.3 97.4 94.8
2 4 Harvard University US 91.8 100.0 93.6 100.0 94.6
3 3 University of California, Berkeley (UCB) US 90.7 90.2 97.4 100.0 93.9
4 5 Georgia Institute of Technology (Georgia Tech) US 100.0 73.0 88.5 91.7 93.3
5= 10 Imperial College London GB 96.3 89.6 91.6 81.5 91.7
5= 6 University of Cambridge GB 88.8 97.8 93.0 94.6 91.7
7 2 Massachusetts Institute of Technology (MIT) US 91.6 95.5 90.2 90.2 91.4
8 11 ETH Zurich (Swiss Federal Institute of Technology) CH 91.4 82.1 90.0 90.2 90.0
9 9 University of Oxford GB 88.4 99.5 90.2 86.9 89.6
10 13 Carnegie Mellon University US 92.1 72.8 88.8 90.2 89.1
11 7 National University of Singapore (NUS) SG 85.3 91.9 87.3 94.6 88.2
12 12 University of Michigan US 78.6 82.9 97.3 100.0 87.1
13 17 Cornell University US 89.6 76.7 85.5 86.9 87.0
14 14 The University of Tokyo JP 87.9 91.0 83.5 83.4 86.4
15 23 University of Washington US 84.2 73.2 89.5 91.7 85.7
16 21 Princeton University US 80.2 87.2 94.2 88.6 85.4
17 8 University of California, Los Angeles (UCLA) US 80.0 77.9 100.0 86.9 85.2
18 16 Columbia University US 80.6 82.7 85.2 90.2 83.7
19 27 University of Toronto CA 71.2 91.0 94.5 98.7 83.3
20 15 The Hong Kong University of Science and Technology (HKUST) HK 83.6 90.3 85.4 75.5 83.0
21 38 University of Chicago US 80.0 88.9 86.2 77.6 81.7
22 19 University of Hong Kong (HKU) HK 75.0 94.2 90.3 79.6 80.9
23 24 The University of Melbourne AU 76.0 90.2 83.9 85.2 80.8
24 29 University of Wisconsin-Madison US 80.3 83.8 84.8 75.5 80.6
25 18 Duke University US 74.1 81.3 86.4 90.2 80.5
26 32 Purdue University US 83.0 79.7 83.4 70.9 80.3
27= 20 Tsinghua University CN 76.8 76.5 85.5 81.5 79.5
27= 22 University of Pennsylvania US 68.9 83.0 91.8 91.7 79.5
29 44 Université Catholique de Louvain (UCL) BE 75.5 75.7 84.8 85.2 79.3
30 33 Texas A&M University US 76.0 65.0 82.9 88.6 78.8
31 30 Nanyang Technological University (NTU) SG 73.9 91.5 83.5 79.6 78.7
32 41 University of Texas at Austin US 70.6 86.4 87.7 83.4 78.2
33 40 Université de Montréal CA 68.3 83.2 89.5 86.9 77.8
34 51-100 Johns Hopkins University US 72.8 68.5 88.9 83.4 77.7
35= 51-100 Eindhoven University of Technology NL 80.6 46.7 82.8 77.6 77.1
35= 51-100 McGill University CA 69.1 92.1 85.0 81.5 77.1
35= 26 University of British Columbia CA 67.2 88.7 89.7 83.4 77.1
38 25 Katholieke Universiteit Leuven BE 67.7 69.7 89.4 91.7 77.0
39 35 University of North Carolina, Chapel Hill US 71.7 66.4 84.9 86.9 76.9
40 49 University of Minnesota US 70.8 63.8 86.6 88.6 76.8
41= 51-100 Tokyo Institute of Technology JP 82.5 68.8 75.3 65.9 76.4
41= 36 Université Pierre et Marie Curie (UPMC) FR 69.6 72.2 86.6 85.2 76.4
43= 28 The University of Warwick GB 76.1 75.9 79.7 73.2 76.2
43= 47 UCL (University College London) GB 69.8 68.4 88.8 83.4 76.2
45 39 The Hong Kong Polytechnic University HK 64.8 73.9 88.2 91.7 75.8
46 46 Seoul National University (SNU) KR 73.1 89.2 77.5 73.2 75.6
47 51-100 Pennsylvania State University US 67.5 67.1 86.1 86.9 75.1
48= 34 Australian National University (ANU) AU 76.8 82.6 78.4 63.1 75.0
48= 31 Shanghai Jiao Tong University CN 68.8 78.8 86.1 77.6 75.0
50 51-100 University of California, Davis (UCD) US 67.3 76.1 86.0 81.5 74.8
Veterinary Science
2015
Instit
ution
Coun
try
Acad
emic
Emplo
yer
Citati
ons
H
Overa
ll
1 University of California, Davis (UCD) US 92.7 94.9 96.7 98.7 95.9
2 Cornell University US 94.9 66.0 99.4 100.0 94.9
3 Royal Veterinary College , University of London GB 100.0 35.1 96.4 95.9 91.2
4 University of Guelph CA 79.1 93.2 95.3 97.3 90.8
5 Utrecht University NL 90.1 48.3 95.3 94.4 88.8
6 Texas A&M University US 89.1 58.8 94.8 92.1 88.7
7 University of Glasgow GB 83.6 52.5 99.2 91.3 87.5
8 University of Cambridge GB 78.6 92.2 96.3 85.2 87.3
9= University of Edinburgh GB 81.4 86.7 93.4 85.2 86.7
9= University of Liverpool GB 78.1 49.2 99.3 95.2 86.7
11= The University of Sydney AU 78.9 81.5 95.8 86.1 86.4
11= University of Bristol GB 78.9 62.4 98.6 89.7 86.4
13= Colorado State University US 79.8 51.7 97.4 92.9 86.2
13= University of Minnesota US 70.7 85.5 97.6 90.5 86.2
15 Massey University NZ 82.0 100.0 91.5 80.0 86.1
16 Wageningen University NL 77.0 86.8 94.3 85.2 85.6
17= University of Copenhagen DK 80.3 67.6 93.3 88.8 85.5
17= University of Florida US 70.9 89.8 93.5 90.5 85.5
19 University of Pennsylvania US 66.4 66.7 100.0 94.4 84.9
20 North Carolina State University US 69.1 69.5 97.3 92.1 84.5
21 Michigan State University US 72.9 52.0 97.0 92.1 83.8
22 The University of Queensland (UQ) AU 66.0 81.4 96.3 88.8 83.5
23 Universitat Autónoma de Barcelona ES 76.0 53.9 96.2 87.9 83.4
24 University of Wisconsin-Madison US 64.0 91.1 95.8 87.0 83.2
25= Ludwig-Maximilians-Universität München DE 63.2 74.6 96.0 91.3 82.6
25= Ohio State University US 64.4 57.8 98.8 92.9 82.6
27 University of Ghent BE 71.5 49.4 91.9 93.7 82.1
28 The University of Melbourne AU 70.7 85.6 93.2 80.0 81.7
29 University of Missouri, Columbia US 57.6 88.5 97.2 87.0 81.4
30 Purdue University US 68.4 58.8 94.6 86.1 80.6
31 The University of Georgia US 67.3 34.9 94.9 93.7 80.3
32 University of Zurich CH 68.4 49.4 92.5 89.7 80.1
33 University of Veterinary Medicine Vienna AT 88.9 35.1 86.1 80.0 80.0
34 Tufts University US 66.8 39.8 98.3 87.0 79.6
35 Iowa State University US 73.5 35.1 92.2 86.1 79.1
36 Universidade de São Paulo (USP) BR 80.6 92.0 75.0 76.6 78.9
37 Washington State University US 74.9 47.3 91.8 77.8 78.1
38 Murdoch University AU 68.8 84.9 87.7 75.3 78.0
39 Norwegian School of Veterinary Science NO 75.4 35.1 92.6 80.0 77.9
40 University College Dublin (UCD) IE 64.3 68.0 93.0 78.9 77.7
41 Seoul National University (SNU) KR 67.6 58.7 89.9 81.1 77.5
42 Université de Montréal CA 62.9 52.6 92.9 84.2 77.3
43= Swedish University of Agricultural Sciences SE 72.0 0.0 94.4 89.7 76.8
43= University of Illinois at Urbana-Champaign US 60.0 61.4 91.3 84.2 76.8
45= The University of Nottingham GB 64.5 63.6 92.5 75.3 76.1
45= Universidade Estadual Paulista "Júlio de Mesquita Filho" BR 69.4 88.4 73.6 81.1 76.1
47 University of Saskatchewan CA 62.2 49.4 90.3 84.2 76.0
48 Kansas State University US 65.2 38.8 91.5 83.2 75.9
49 Virginia Polytechnic Institute (Virginia Tech) US 47.7 54.9 99.9 85.2 75.3
50 Universidad Complutense de Madrid (UCM) ES 63.0 53.3 91.9 77.8 75.1
To view the complete rankings, visit www.TopUniversities.com
NEWRanking
Academic Excellence Around the Globe
By Martin Ince
The fifth edition of the QS
Word University Rankings
by Subject takes this project
into new terrain by adding
six fresh subjects, bringing to
a total of 36 the number of
disciplines in which we rank
the world’s universities. Our
subject rankings have always
covered the most important
subjects, the vast majority of
university recruitment, the
bulk of the world’s academic
research and the majority of
its higher education budgets.
But they are now reaching
into new areas and covering
new institutions, including
specialist providers which
would be unlikely to appear
in our main World University
Rankings.
The new subjects for 2015 are architecture, art and design, business, dentistry, development studies and veterinary science. Their rankings make use of the same four criteria used in the rest of the QS subject analysis. They are academic and employer opinion, based on unique global QS surveys; citations over five years of academic papers in the relevant subject area; and finally the H-Index for an institution’s total output of research papers in that subject. The H-Index is an ingenious measure that rewards both the quality and quantity of the research published by a person or an institution. If a university has 25 chemistry papers with 25 or more citations each, its H-Index for chemistry is 25.
Remember as you read these tables that many of them cover a range of related subjects. We merge astronomy into physics, econometrics into economics, and finance into accountancy, while mechanical engineering also encompasses aeronautical and manufacturing engineering.
Two of the new subjects we have introduced, veterinary science and dentistry, belong in the biomedical arena. This is the biggest subject area for research funding and, of course, produces professionals whom we are all going to need at some point in our lives. We rank five subjects in this area including psychology, dentistry, veterinary science, pharmacology and pharmacy, and medicine itself.
Our new analysis of dentistry is unusual for finding just three US universities in the top 10, with the first three spots taken by two Swedish institutions (the Karolinska Institute and Gothenburg University) and the University of Hong Kong. Indeed, the 50 institutions we list here include only 15 from the United States. Our other new subject
in this field, veterinary science, has a more expected appearance, with the University of California at Davis in top position. The same applies to psychology, with a top 10 drawn entirely from the US and the UK. In pharmacy and pharmacology, the Karolinska plus Leiden in the Netherlands and Tokyo are also in the top 10. But for medicine overall, the mighty Harvard Medical School has a clear lead over Oxford in second place.
Among the natural sciences we group everything from the environment to maths. ETH Zurich is top for the Earth sciences and third for environmental science, making it a world leader in green thinking. In the big-budget world of physics and astronomy, however, it is the US and the UK that take the lead. ETH at ninth is the top institution we list from beyond these two. The same applies to mathematics.
The five engineering and technology subjects we rate constitute the smallest of our topic clusters. The Massachusetts Institute of Technology is world number one in all five: chemical, civil, electrical and mechanical engineering, and computer science. One interesting feature of these rankings is that Asia’s undoubted emergence as a world power in high technology is not reflected here, although there are a number of top-ten appearances for universities in Singapore and Hong Kong. In addition, Tsinghua University is a top-20 institution in all four engineering subjects and is 38th for computer science.
Among the social sciences we count a range of subjects including core disciplines such as economics, education and sociology. A newcomer here is business, one of the world’s most attractive subjects for students – and among its most lucrative for universities. While QS has for many
years been the global authority on the MBA degree, this present ranking covers the whole field including undergraduate study and research degrees. The top institutions turn out to be free-standing business schools such as the London Business School in first place, or major universities with big-name business schools, such starting with Harvard in second.
A little more diversity is apparent in our ranking for education, the founding subject for many universities and still for some the biggest in terms of student numbers. The UCL Institute of Education, which became part of University College London last year, is top in the world for the second year running, but there are top-20 institutions in Australia, Hong Kong, Singapore and Canada as well as the US and the UK.
The new subject area of development studies, a growing concern for nations of both North and South around the world, also shows a welcome breadth of excellence around the world. There are three South African institutions in the top 50 starting with Cape Town at seven, the only African institution in the top 10 for any subject, plus other top-50 entries from India, Mexico, Malaysia, Uganda, Egypt, Kenya and Colombia.
However, it is notable that in most of the social sciences, very little interrupts the dominance of the English-speaking world. In education, economics and sociology we find just one institution per subject in the top 20 that does not work primarily in English. The exception is business, where the top 10 includes Insead and HEC in France, Bocconi in Italy, the Copenhagen Business School in Denmark, and Erasmus University in the Netherlands.
The arts and humanities is the final cluster that we analyse. While the subjects concerned do not involve big-budget research, they do include many that are of vital importance, including politics, languages, law, history, and two new entrants for this year, architecture, and art and design. This area contains more subjects than any other, a total of nine.
The top institutions in our two new areas in this field, art and design and architecture, might be expected to overlap heavily. But in fact, specialist providers dominate in art and design, while mainstream universities are more prevalent in architecture. So the top ten for art includes specialist institution in London, Chicago and Rhode Island, plus two each in New York and Los Angeles, alongside three mainstream universities. But for architecture, even the top 20 includes no specialist institutions. Instead it is made up
of universities in an impressive 12 nations, from Switzerland to China. By contrast, the top institutions in the traditional leading arts and humanities subjects tend to be highly Anglo-American, with Harvard, Oxford, Cambridge, Princeton, Yale and LSE featuring prominently in both.
In the round, these subject analyses confirm that there is a definite elite group of world-class universities, each with a strong presence in a broad range of subjects. They tend to be in the US, the UK, continental Europe, Canada and Australia. But there are also strong showings in specific subjects from Asian nations and from other regions of the world.
Indeed, the information we provide here might paradoxically save the ambitious student from needing to cross the world to study. The 200 universities we list for business, for example, are in 29 nations, and the 400 we rank for physics are in 47, including Romania, Slovenia and Thailand alongside more obvious choices such as Canada or Germany. Neither listing has any African representation, but with this exception, our ranking shows that academic excellence is widely distributed around the globe. So you might not have to go as far as you think to study your subject of choice in a world-class setting.
QS Stars: Capturing the Nuanced Mission of Universities through a Sophisticated Rating System
QS Stars is a rating system which allows students to get a wider picture of an institution’s qualities, looking at everything from the employability of graduates, to sports facilities and community engagement. It is designed to reflect the nuanced mission of universities, and the needs of students who may be interested in things other than those to which traditional rankings are necessarily limited. The QS Stars audit evaluates an institution against over 50 different indicators, and awards universities between one and five + stars over eight wider fields, as well as an overall rating.
What criteria does QS Stars use when rating universities, and why?
The following criteria, the basis for QS Stars ratings, were selected as the key pillars of what makes a world class university, taking into account a number of factors that are often overlooked in university rankings and other assessments.
Research
Indicators considered here include assessments of research quality amongst academics, productivity (i.e. number of papers published), citations (i.e. how recognized and referred to those papers are by other academics) and awards (e.g. Nobel Prizes or Fields Medals).
Teaching
A key role of a university is the nurture of tomorrow’s finest minds, inspiring the next generation of potential research academics. Typical indicators in teaching quality assessments are collation of student feedback through national student surveys, further study rate and student faculty ratio.
Employability
Graduate employability encompasses more than academic strength, focusing on ‘work-readiness’–the ability to work effectively in a multi-cultural team, to deliver presentations, to manage people and projects. Common indicators in this area are surveys of employers, graduate employment rates and careers service support.
Internationalization
Here, effective indicators could be the proportion of international students and staff, the numbers of exchange students arriving and departing, the number of nationalities represented in the student body, the number and strength of international partnerships with other universities and the presence of religious facilities.
Facilities
University infrastructure is an indicator which enables students to know what to expect from their university experience. Indicators such as sporting, IT, library and medical facilities, as well as the number of students societies are considered within this criterion.
Online/Distance learning
This category looks at various indicators such as student services and technology, track record, student faculty engagement, student interaction, commitment to online and reputation of the university.
Social Responsibility
Engagement measures how seriously a university takes its obligations to society
by investing in the local community as well as in charity work and disaster relief. It also analyses the regional human capital development and environmentally awareness.
Innovation
Innovation, the output of the universities activities and findings to economy, society and culture, has become increasingly relevant for universities.
Arts & Culture
Effective indicators are the number of concerts and exhibitions organized by the institution, the number of credits and cultural awards and cultural investment.
Inclusiveness
This area looks at the accessibility of the university to students, particularly at scholarships and bursaries, disability access, gender balance and low-income outreach.
Specialist Criteria
Excellence in a narrow field is as valid a claim to world-class status as competence in the round. These criteria are designed to extend credit where it’s due. This category looks at accreditations and discipline rankings.
To view the QS Stars rated universities: www.topuniversities.com/qs-stars

Call for Submissions now open at reimagine-education.com
Call for Submissions now open at reimagine-education.comreimagine-education.com
Reimagine Education Awards 2015
Conference & Awards Ceremony: Philadelphia 7-9 December
The global awards for innovative higher education pedagogies enhancing learning and employability
A n international panel of distinguished judges will select the best projects for the following Awards:
e-Learning, Hybrid Learning, Presence Learning, Nurturing Employability plus new awards for most innovative enterprises.Prize fund $50,000Register your interest as a participant in the competition or as a conference delegate at reimagine-education.comThe 2014 inaugural competition attracted 427 submissions from 54 countries.
For sponsorship opportunities contact Jason Newman [email protected]
@ReimagineHEdu

Over 2.5 million tests taken last year
Home Of� ce approved English language test for UK visas, including Tiers 1, 2 and 4 of the points-based system and also for spouse or partner applications.
More peoplego more places with IELTS• IELTS is offered at more than
1,000 locations around the world
• IELTS scores are accepted by over 9,000 organisations globally – including over 3,000 institutionsand programmes in the US
• Test questions are developed by specialists in Australia, Canada, New Zealand, the UK and the US making it a truly international test
www.ielts.org
CD4185_IELTS_QS_World Rankings Ad_A4_March_2015_AW_f.indd 1 03/03/2015 13:06