Embed Size (px)
Citation preview

14/04/11
Relaxing Credit Constraints:
The Impact of Public Loans
on the Performance of Brazilian Firms
IDEAS International
Assembly 2011
* Corresponding Author [email protected]
Filipe Lage de Sousa* and Gianmarco Ottaviano

MotivationEmerging markets are enlarging their participation in world GDP and trade, especially BRICS.
Some of them have financial institutions to provide long term loans.
BRICS are not exception to this rule (all have at least one)
Brazilian Government provide those long term loans through its Brazilian Development Bank (BNDES).
BNDES mandatory goal is to burst Brazilian economy without neglecting social aspects.
Therefore, it is important to evaluate whether their financial support has been able to improve firms’ competitiveness, which will be measured by productivity.

Why productivity?
“Productivity isn’t everything, but in the long run it is
almost everything. ..... Compared with the problem of slow
productivity growth, all other long-term economic
concerns - foreign competition, the industrial base, lagging
technology, deteriorating infrastructure and so on - are
minor issues”
(Krugman, 1992)

Asumption:
In order to implement one project, firms decide on whether using:
1. Old (Low) Technology – lower fixed cost, but higher marginal cost
2. New (High) Technology – higher fixed cost, but lower marginal cost
According to our model, credit constraints might affect those two fixed costs asymmetrically.
1. If it is more towards new technology, productivity increases.
2. If it is towards old technology, productivity reduces.
3. If it affects them symmetrically, productivity remains constant
Theoretical Foundation

BNDES finances different types of firms, from micro to multinationals.
In 2009, its disbursements reached US$ 78 billion (representing 13,3% of aggregate investment).
We investigate two types of loans:
1. FINEM (direct – over US$ 5 millions);
2. Automatic BNDES (indirect – below this threshold);
Both cover: creation of new plants; enlargement of existing ones; restructuring and modernization of processes; and
innovation and technological development
Why BNDES?

• From 1995 to 2007, 9,828 firms were granted one of these loans;
• These two loans represents around 40% of BNDES resources.
Some figures
Using different data sources,
some firms are discarded:
• Too small (no information in main data source where we measured productivity);
• If two firms merge, the loan will be registered to the new company, which didn’t exist before when there is the information;
• There is a time-lag for a firm to take part in the survey.
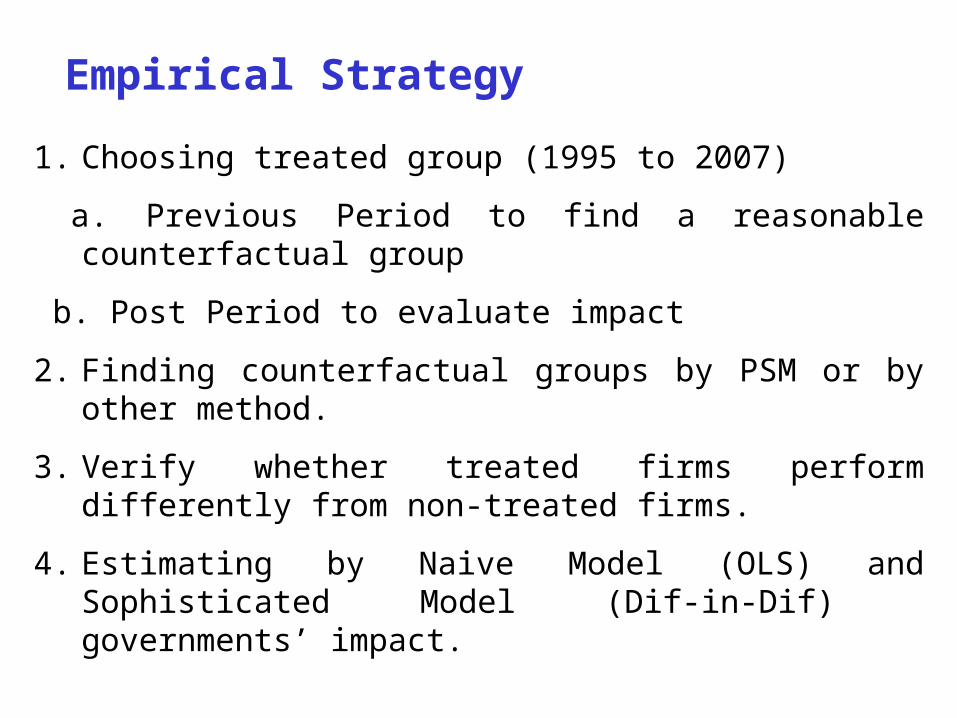
Empirical Strategy
1. Choosing treated group (1995 to 2007)
a. Previous Period to find a reasonable counterfactual group
b. Post Period to evaluate impact
2. Finding counterfactual groups by PSM or by other method.
3. Verify whether treated firms perform differently from non-treated firms.
4. Estimating by Naive Model (OLS) and Sophisticated Model (Dif-in-Dif) governments’ impact.

Treated Firms
How many Treated Firms received first loan in 1998
How often? Indirect Loans Direct and Indirect
Just Once 69 75
More than Once 43 66
Total 112 141
Year Selected = 1998.

Treated x Non Treated
Non Treated Firms Treated Firms
Variables All Sur&Inv 1st 2007 1st 98 Ind 1st 98 Just 98 Ind Just 98
Labour Productivity 26,6 26,8 27,0 35,5 29,7 31,8 27,4
TFP (All 1996 = 100) 99,3 101,8 89,1 97,7 100,7 104,7 102,5
Capital Stock 31,6 19,6 34,9 84,4 29,0 53,9 24,1
% Qualified Workers 5,8% 6,8% 5,7% 9,2% 8,1% 9,2% 8,4%
Number of Employees 175 196 255 620 332 468 285
Market Share 0,09% 0,11% 0,12% 0,33% 0,11% 0,31% 0,09%
Profitability 5,9% 6,7% 7,9% 5,7% 5,9% 6,4% 6,1%
Fin Costs / Total Costs 3,9% 3,6% 3,2% 4,7% 4,5% 5,0% 4,9%
Fin Costs / Net Revenue 3,9% 3,0% 2,2% 2,8% 2,8% 3,1% 3,1%
Investments 1,17 0,86 1,24 5,45 1,58 4,79 1,13
Revenue Growth 22,1% 20,6% 16,9% 17,5% 13,7% 13,8% 11,9%
Labour Productivity Growth 30,3% 26,0% 14,3% 31,7% 27,6% 34,6% 33,8%
Employment Growth 0,1% 4,3% 1,8% 8,8% 10,3% 6,2% 6,3%
High and Med-High (OCDE) 22% 26% 18% 32% 32% 35% 32%
Number of Firms 21.380 6.344 128 141 112 75 69

Treated (1st 98) x Non-Treated
0,0
0,5
1,0
1,5
2,0
2,5
3,0
1996 1997 1998 1999 2000 2001 2002 2003 2004 2005 2006
Years
Pro
du
citi
vity
Pre
miu
m
Labor - Group A Labor - Group B Labor - Group C TFP - Group A TFP - Group B TFP - Group C

Refined Control Group: Propensity Score Matching (PSM)
1st 98 Ind 1st 98 Just 98 Ind Just 98
Paired 118 99 65 61
Non-Paired 23 13 10 8
After pairing, we tested whether average from treated and non-treated firms are similar and even productivity (which was not in the PSM) showed similar means.

Treated (1st 98) x Control Group
Graph 2: Comparing 118 Paired Firms (Treated / Non-treated)
0,60
0,70
0,80
0,90
1,00
1,10
1,20
1997 1998 1999 2000 2001 2002 2003 2004 2005 2006
Year
Pro
du
ctiv
ity
Pre
miu
m
Labour Productivity TFP

Main Results from Econometrics
Control Groups or Counterfactual Groups
a) Firms which have survived and invested (6 thousand firms)b) Firms first granted in 2007c) Paired Firms using PSM
Regardless which control group is considered, results are the same.
1. Naive Model (OLS)• Labour Productivity - Positive• Total Factor Productivity - Negative
• Sophisticated Model (Difference-in-Differences)a) Non Significant Results

Main Conclusions
BNDES Loans might be able to relax credit constraintsHowever, it seems that it is not impacting productivity
Reasons:
1. Projects selected might not be the most prominent
2. Loans may be reducing implementation costs for both old and new technology projects symmetrically, therefore not impacting average firms’ productivity
Increase number of manufacturing firms in Brazil from 20 thousand to more than 40 thousand during 1996 to 2006.
Filipe Lage de Sousa [email protected]