Embed Size (px)
Citation preview

See Clearly. Act Decisively.
13th Annual ISM Services Conference Phoenix, AZ
Buying the Law
Dr. Silvia Hodges Fordham Law School TyMetrix Legal Analytics December 7, 2012
Were billing rates in 2011 higher or lower than in 2007?
2

How does spending more with a law firm affect a client’s rates?
3

What actually drives rates?

FACT IS: Over the past 10 years, the hourly fee for a major US law firm lawyer rose by more than 65%, faster than any other economic indicator Spending more with a particular firm often yielded higher rates, not more favorable rates Of the five main drivers of rate increase, geography is a bigger influence than experience
TyMetrix Legal Analytics Real Rate Report™
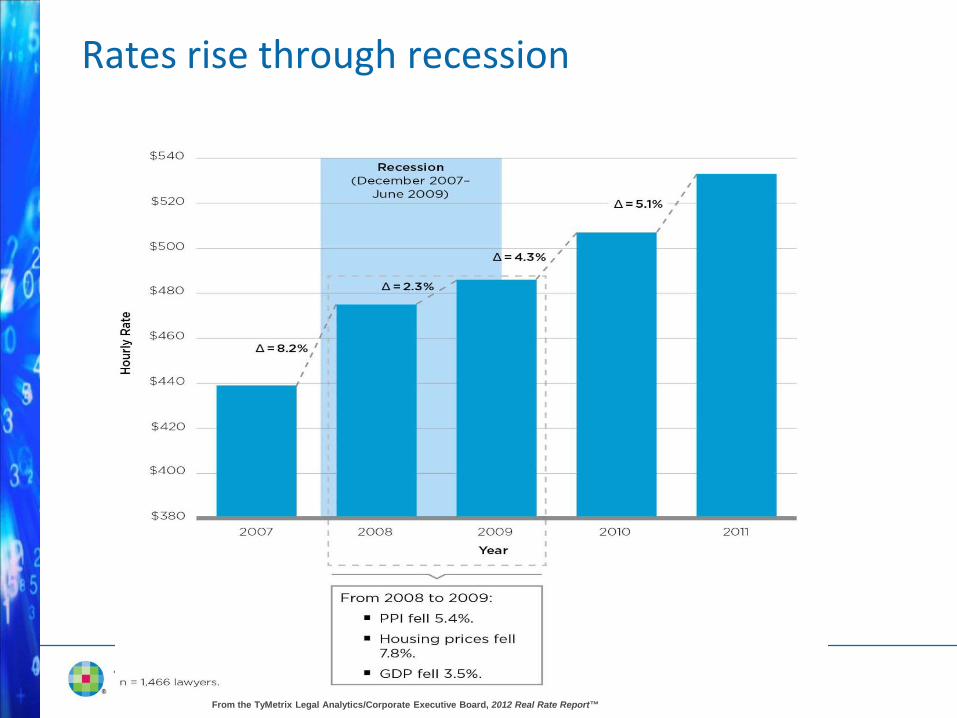
Rates rise through recession
From the TyMetrix Legal Analytics/Corporate Executive Board, 2012 Real Rate Report™

Rates rise by role

2007
Firm Size Category Partner Associate Paralega
l Others
0 - 10 59% 29% 9% 2% 11 - 100 41% 42% 15% 2%
101 - 500 37% 37% 16% 11% 501 - 1000 26% 49% 12% 12%
1001 + 33% 52% 11% 4% Unknown 42% 38% 15% 4%
2011
Firm Size Category Partner Associate Paralega
l Others
0 - 10 54% 37% 9% 0% 11 - 100 45% 38% 15% 2%
101 - 500 46% 38% 12% 4% 501 - 1000 35% 52% 9% 4%
1001 + 45% 45% 8% 3% Unknown 46% 38% 14% 3%
Law Firms are allocating work up

Bespoke
Evergreen
Commodity
$400 - $1,000 per hour
$175 - $350 per hour
$25 to $100 per hour
A segmented market

Demand in the market remains flat: Highly competitive marketplace
0.980
0.985
0.990
0.995
1.000
1.005
1.010
1.015
1.020
1/20
06
3/20
06
5/20
06
7/20
06
9/20
06
11/2
006
1/20
07
3/20
07
5/20
07
7/20
07
9/20
07
11/2
007
1/20
08
3/20
08
5/20
08
7/20
08
9/20
08
11/2
008
1/20
09
3/20
09
5/20
09
7/20
09
9/20
09
11/2
009
1/20
10
3/20
10
5/20
10
7/20
10
9/20
10
11/2
010
1/20
11
3/20
11
5/20
11
7/20
11
9/20
11
11/2
011
LegalVIEW™ Demand Index

1980s 1990s
2000s
2010s
DuPont Legal Model
Convergence trend
Offshore services centers AFAs ACC Value Challenge
Strategic Procurement
Reverse auctions
Chief Procurement Officers
Procuring of engineering & architectural services
Procuring of marketing services
Procuring of accounting services
Procuring of legal services
Real Rate ReportTM
+ Legal Operations Professionals

Purchasing studies
How mid-sized companies in Europe select and review their legal services providers (for LexisNexis) 2006
How U.S. companies select International Outside Counsel (for ALM) 2007
How medium-size companies buy legal services/ Winning business from medium-sized businesses (PhD/for Ark Group) 2009
Insight from Germany’s top corporates on improving service and value delivery in the legal profession (for NISUS) 2010
The influence of procurement on the purchasing of legal services (with ISM & APS) 2012
(1) Choice of legal service provider tier (“objective”) Type, scope, scale, and importance of the matter for the
client? Market position? Value proposition? Benefit sought? (2) Choice of individual lawyer within tier (“subjective”) Personality, chemistry, relationship, trust & WOM (word of mouth)

“In the case of [our company’s] bankruptcy [we want a]: Top firm! For debt collection: Not. There are many levels. You need to chose the expertise you need” (MC7).


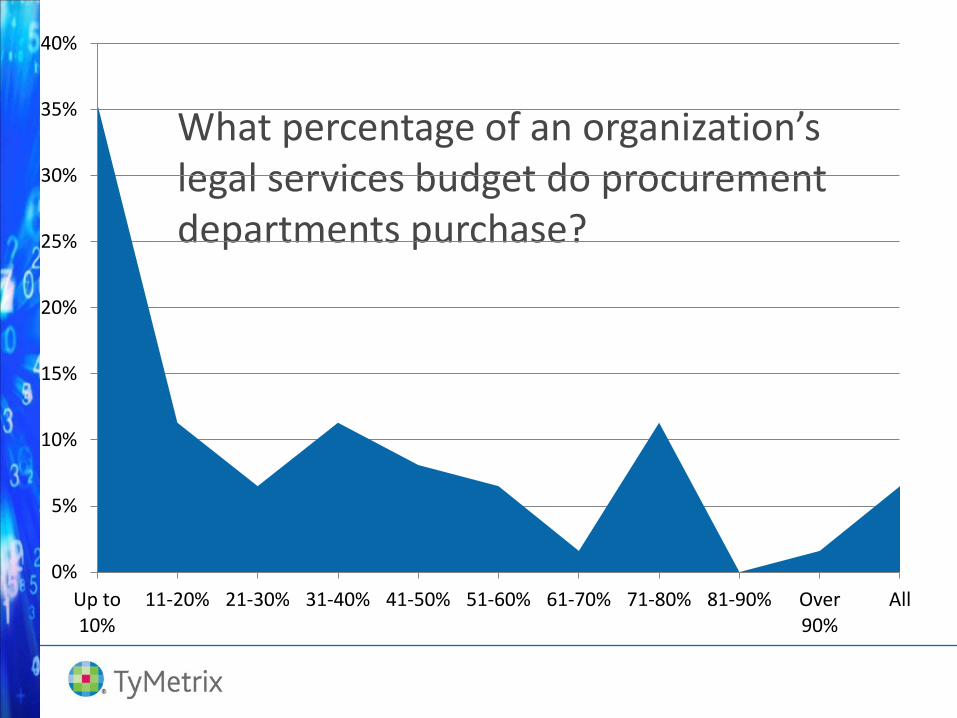
What percentage of an organization’s legal services budget do procurement departments purchase?
0%
5%
10%
15%
20%
25%
30%
35%
40%
Up to 10%
11-20% 21-30% 31-40% 41-50% 51-60% 61-70% 71-80% 81-90% Over 90%
All
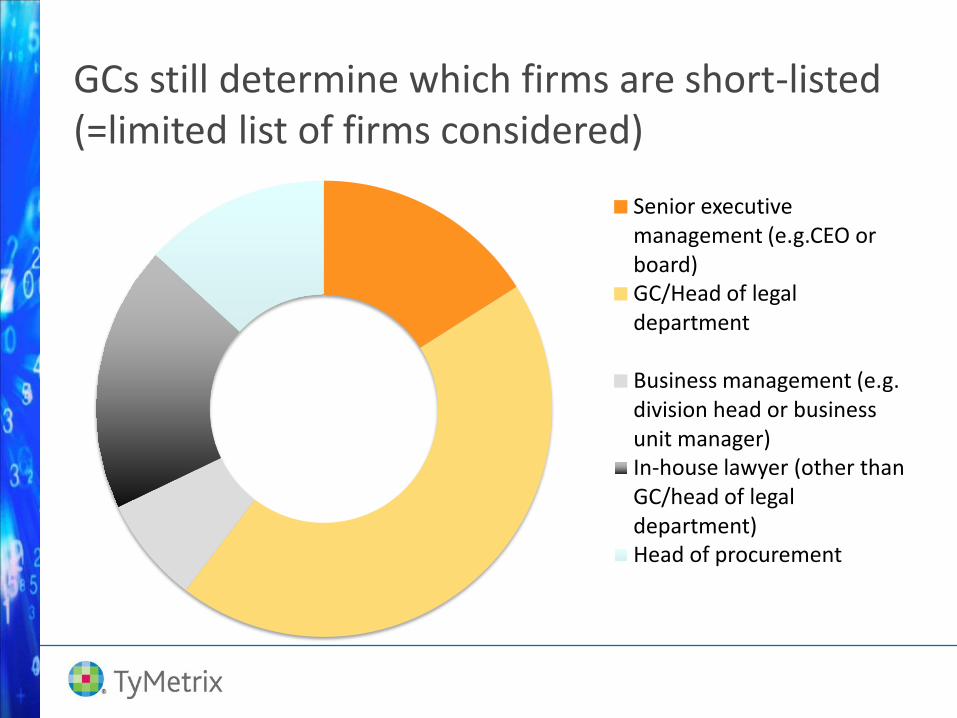
GCs still determine which firms are short-listed (=limited list of firms considered)
Senior executive management (e.g.CEO or board) GC/Head of legal department
Business management (e.g. division head or business unit manager) In-house lawyer (other than GC/head of legal department) Head of procurement

GCs still make the final decision
Senior executive management (e.g.CEO or board)
GC/Head of legal department
Head of procurement

Procurement and in-house lawyers collaborate
We are a service provider to the in-house legal department
We are colleagues - our mandate comes directly from executive management
We collaborate (e.g., cross-functional teams)

What value does procurement add?
Cost reduction: “We study the cost drivers of the 3 big cost drivers: discovery, depositions, and filing of motions.”
Negotiation: “Procurement people look at it [sourcing] differently, they ask different questions [than in-house lawyers would]. Typically, they ask tougher questions [than lawyers] and negotiate tougher.”
Improve efficiency: “It [procurement] is there to make the process better.”

A low price isn’t that much more important for procurement than for in-house lawyers
More important Same Less important
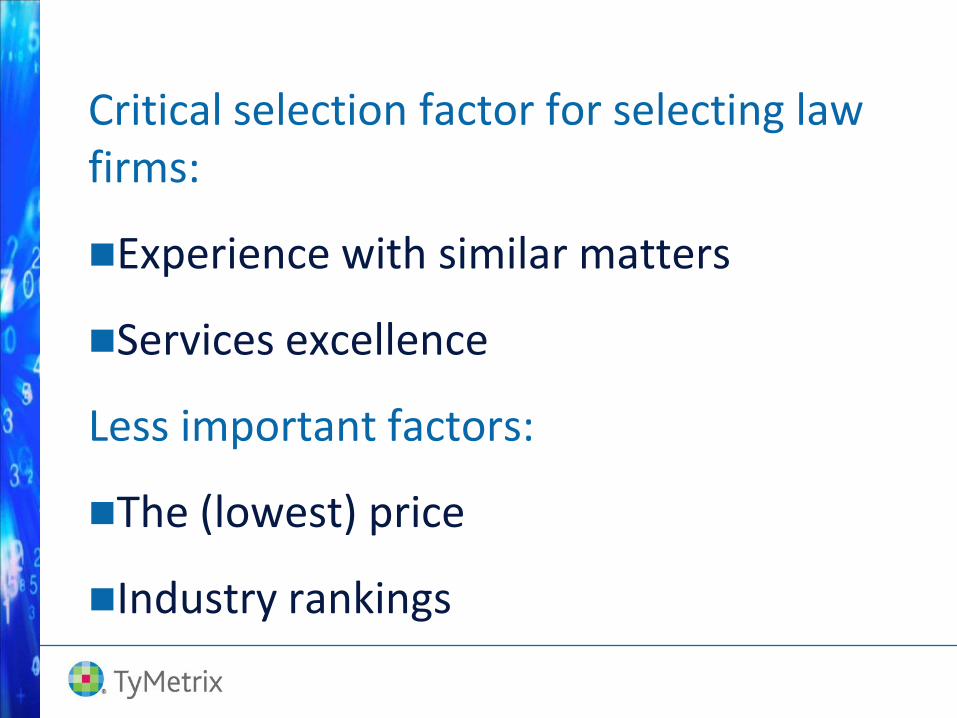
Critical selection factor for selecting law firms:
Experience with similar matters
Services excellence
Less important factors:
The (lowest) price
Industry rankings

“I look for subject matter expertise. I want them to show me that they can handle this type of contract, and that they guarantee me a quick turn-around.”
“Firms need to be open to budget. There’s still a big disconnect between [what] the firm [sells] and what the law department expects. Firms need to get good at it. Much better, in fact. Right now, most firms are not good.”
“We want lawyers to be cost conscious.”
“We do a lot of cost controlling, look at fee structures, have caps for different types of activities.”


What helps you source legal services:
Proper History. Gather five years of rates on all your key firms and fee earners
Proper Data. Gather data points on firms and fee earners that are essential to effective comparisons and negotiations: evaluations of rate information, outcome, staffing of matters
Proper Perspective. Gather and measure historic cost of like matters
Proper Benchmarks. Compare your rates and fee arrangements to industry benchmarks

What your legal departments measure: Legal spend month over month
Amount of Invoices Flagged vs. Submitted by Vendor
Matter spend by duration
Legal spend breakdown by practice area
Open to close ratio–month over month
Top cases by spend
Top vendors by spend
Law department budget to actual
Billed rate by role–year over year
Practice area blended rate–year
over year
Total spend by vendor
Rate review & comparison
Top firms by evaluation
Ratio of low to high severity cases
% of matters with budget
% of matters with assessment
% of matters with status updates
% of matters handled via AFAs
Firm staffing profile
Partner hours by litigation phase
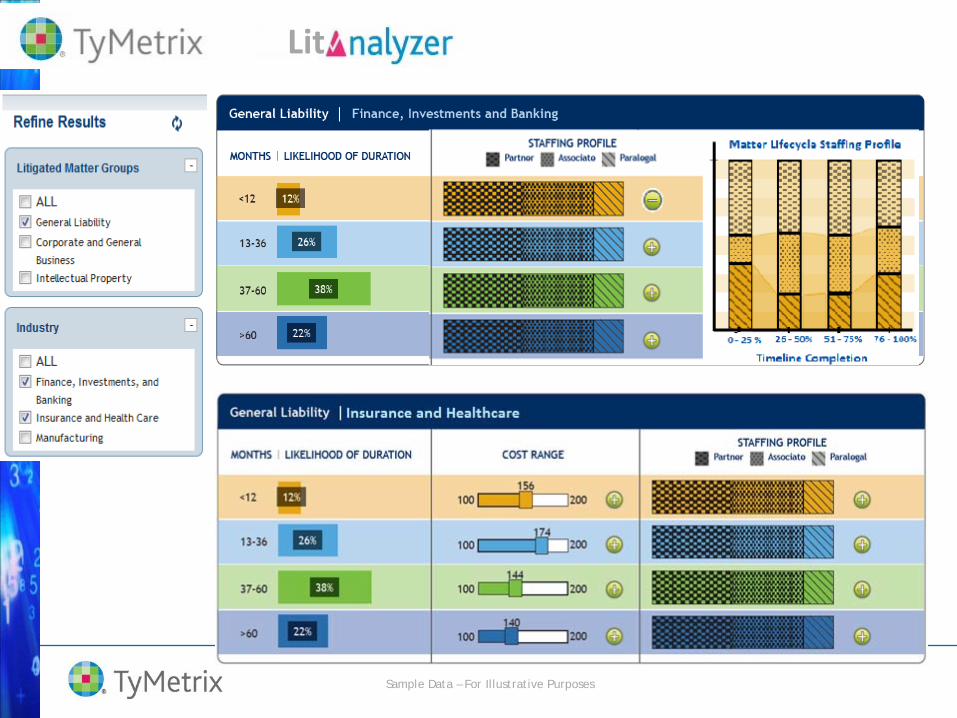
Lit
Sample Data – For Illustrative Purposes

31
Denver
100-Lawyer Firm
5 Years’ Experience
Associate
Employment Law
New York
1,000-Lawyer Firm
2 Years’ Experience
Associate
Employment Law
Minneapolis
300-Lawyer Firm
20 Years’ Experience
Partner
Litigation
From the TyMetrix/Corporate Executive Board 2012 Real Rate Report©
Who is the most/least expensive?

Estimate a lawyer’s rate: Real Rate Report™ Regression model
From the CT TyMetrix/Corporate Executive Board 2012 Real Rate Report©
$151
$161
$34 per 10 years $95 +$99
(Finance)
-$15 (Litigation)
n = 15,353 Lawyers
Tier 1 Market Experience Partner
Status Practice
Area
Base
+ + +/-
Source: 2012 Real Rate Report™
32
$15 Per
100 Lawyers
Law Firm Size + +

33
Denver
100-Lawyer Firm
5 Years’ Experience
Associate
Employment Law
New York
1,000-Lawyer Firm
2 Years’ Experience
Associate
Employment Law
Minneapolis
300-Lawyer Firm
20 Years’ Experience
Partner
Litigation
From the TyMetrix/Corporate Executive Board 2012 Real Rate Report©
Who is the most/least expensive?

34
Base $151
Denver +$ 0
100-Lawyer Firm +$ 15
5 Years’ Experience + $ 17
Associate + $ 0
Employment Law + $ 0
TOTAL $183/hour
Base $151
New York +$161
1,000-Lawyer Firm +$150
2 Years’ Experience +$ 7
Associate +$ 0
Employment Law +$ 0
TOTAL $469/hour
Base $151
Minneapolis +$ 0
300-Lawyer Firm +$ 45
20 Years’ Experience +$ 68
Partner +$ 95
Litigation -$ 15
TOTAL $344/hour
From the TyMetrix/Corporate Executive Board 2012 Real Rate Report©
She is!
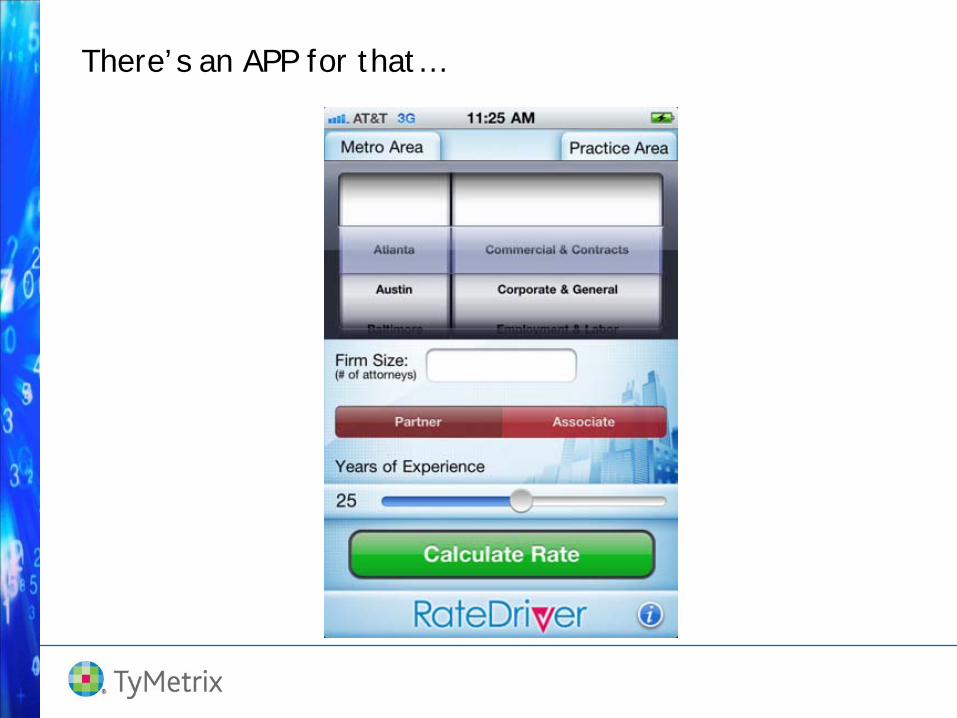
There’s an APP for that…
35
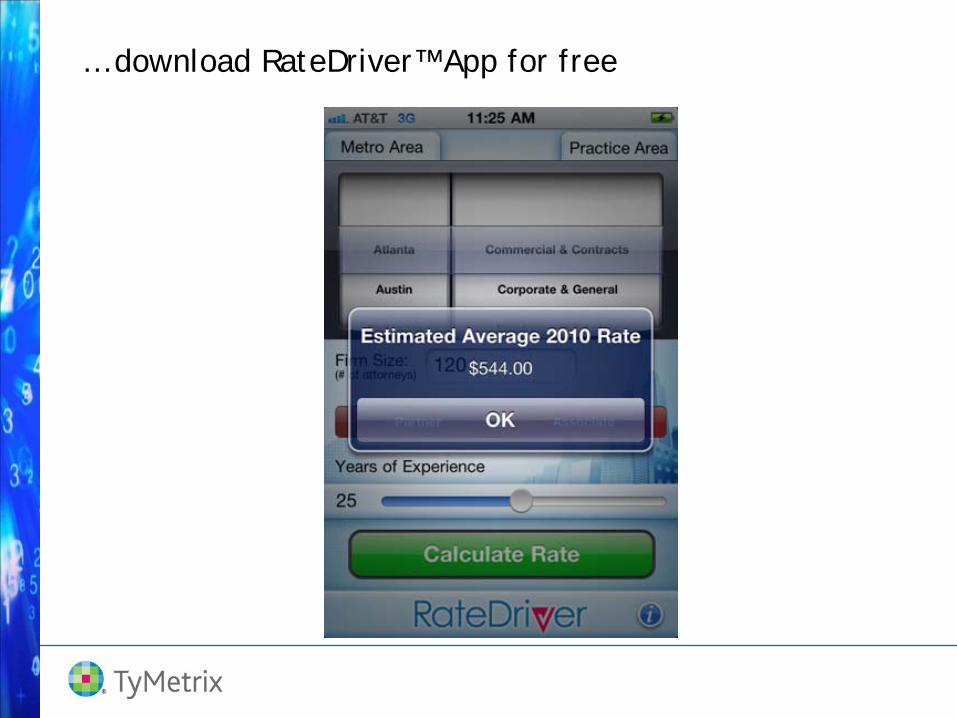
… download RateDriver™ App for free
36

(1) Choice of legal service provider tier (“objective”) Type, scope, scale, and importance of the matter for the
client? Market position? Value proposition? Benefit sought? (2) Choice of individual lawyer within tier (“subjective”) Personality, chemistry, relationship, trust & WOM (word of mouth)
(1) Choice of legal service provider tier (“objective”) Can you/your firm do the work? We do our due diligence on you. (2) Choice of firm within tier (“metrics-driven”) Does working with you make good business sense? We look at your numbers, our numbers, your competitors’
numbers, compare and benchmark.
“If you come to my office or call my phone, I'm billing time.
If you stop me at parties to whine and moan,
I’m billing time. If I think of you when
I am all alone, I'm billing time. If you're late
for appointments, I will be waiting
and billing time …” (The Bar & Grill Singers)

Dr. Silvia Hodges (646) 831-5461 [email protected] Twitter: @silviahodges LinkedIn: Silvia Hodges Blog: silviahodges.com