Embed Size (px)
Citation preview

13.1 Van Horne and Wachowicz, Fundamentals of Financial Management, 13th edition. © Pearson Education Limited 2009. Created by Gregory Kuhlemeyer.
Chapter 13
Capital Budgeting Techniques
Capital Budgeting Techniques
13.4 Van Horne and Wachowicz, Fundamentals of Financial Management, 13th edition. © Pearson Education Limited 2009. Created by Gregory Kuhlemeyer.
Project Evaluation: Alternative MethodsProject Evaluation: Alternative Methods
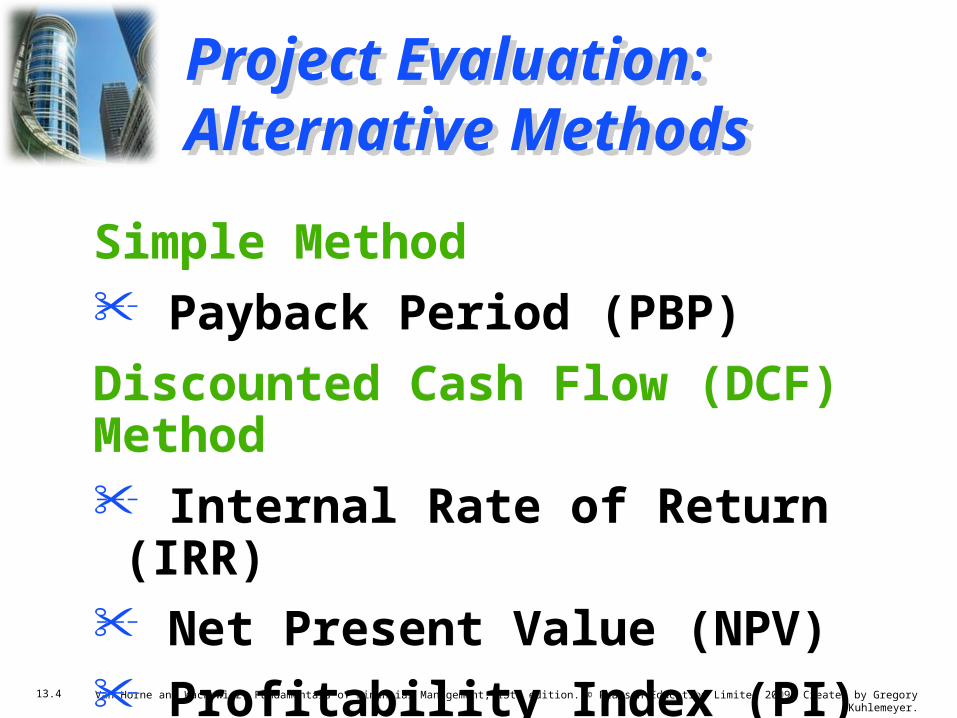
Simple Method • Payback Period (PBP)
Discounted Cash Flow (DCF) Method• Internal Rate of Return (IRR)• Net Present Value (NPV)• Profitability Index (PI)
• Refer to the additional PowerPoint slides and the Excel spreadsheet “VW13E-13b.xlsx” for computer-based solutions.
Simple Method • Payback Period (PBP)
Discounted Cash Flow (DCF) Method• Internal Rate of Return (IRR)• Net Present Value (NPV)• Profitability Index (PI)
• Refer to the additional PowerPoint slides and the Excel spreadsheet “VW13E-13b.xlsx” for computer-based solutions.

13.5 Van Horne and Wachowicz, Fundamentals of Financial Management, 13th edition. © Pearson Education Limited 2009. Created by Gregory Kuhlemeyer.
Proposed Project DataProposed Project Data
Julie Miller is evaluating a new project for her firm, Basket Wonders (BW).
She has determined that the after-tax cash flows for the project will be
$10,000; $12,000; $15,000; $10,000; and $7,000, respectively, for each of
the Years 1 through 5. The initial cash outlay will be $40,000.
Julie Miller is evaluating a new project for her firm, Basket Wonders (BW).
She has determined that the after-tax cash flows for the project will be
$10,000; $12,000; $15,000; $10,000; and $7,000, respectively, for each of
the Years 1 through 5. The initial cash outlay will be $40,000.

13.6 Van Horne and Wachowicz, Fundamentals of Financial Management, 13th edition. © Pearson Education Limited 2009. Created by Gregory Kuhlemeyer.
Payback Period (PBP)Payback Period (PBP)
PBP is the period of time required for the cumulative
expected cash flows from an investment project to equal the
initial cash outflow.
PBP is the period of time required for the cumulative
expected cash flows from an investment project to equal the
initial cash outflow.
0 1 2 3 4 5
–40 K 10 K 12 K 15 K 10 K 7 K

13.7 Van Horne and Wachowicz, Fundamentals of Financial Management, 13th edition. © Pearson Education Limited 2009. Created by Gregory Kuhlemeyer.
Payback PeriodYear Cash Flows Cumulative
Inflows0 (40,000) --------1 10,000 10,0002 12,000 22,0003 15,000 37,0004 10,000 47,0005 7,000 54,000
13.8 Van Horne and Wachowicz, Fundamentals of Financial Management, 13th edition. © Pearson Education Limited 2009. Created by Gregory Kuhlemeyer.
Payback Period Solution(#1)
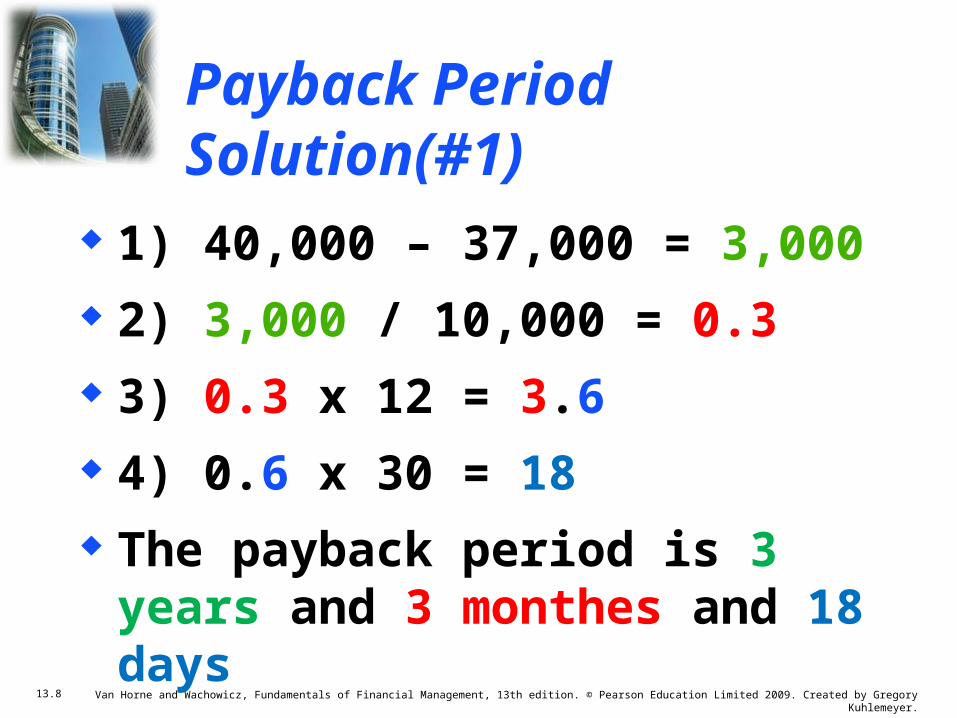
1) 40,000 – 37,000 = 3,000 2) 3,000 / 10,000 = 0.3 3) 0.3 x 12 = 3.6 4) 0.6 x 30 = 18 The payback period is 3 years
and 3 monthes and 18 days

13.9 Van Horne and Wachowicz, Fundamentals of Financial Management, 13th edition. © Pearson Education Limited 2009. Created by Gregory Kuhlemeyer.
(c)10 K 22 K 37 K 47 K 54 K
Payback Solution (#2) Another MethodPayback Solution (#2) Another Method
PBP = a + ( b – c ) / d= 3 + (40 – 37) /
10 = 3 + (3) / 10= 3.3 Years
PBP = a + ( b – c ) / d= 3 + (40 – 37) /
10 = 3 + (3) / 10= 3.3 Years
0 1 2 3 4 5
–40 K 10 K 12 K 15 K 10 K 7 K
CumulativeInflows
(a)
(-b) (d)

13.10 Van Horne and Wachowicz, Fundamentals of Financial Management, 13th edition. © Pearson Education Limited 2009. Created by Gregory Kuhlemeyer.
Payback Solution (#3)Payback Solution (#3)
PBP = 3 + ( 3K ) / 10K= 3.3 Years
Note: Take absolute value of last negative cumulative cash flow value.
PBP = 3 + ( 3K ) / 10K= 3.3 Years
Note: Take absolute value of last negative cumulative cash flow value.
CumulativeCash Flows
–40 K 10 K 12 K 15 K 10 K 7 K
0 1 2 3 4 5
–40 K –30 K –18 K –3 K 7 K 14 K

13.11 Van Horne and Wachowicz, Fundamentals of Financial Management, 13th edition. © Pearson Education Limited 2009. Created by Gregory Kuhlemeyer.
PBP Acceptance CriterionPBP Acceptance Criterion
Yes! The firm will receive back the initial cash outlay in less than 3.5 years. [3.3 Years < 3.5 Year Max.]
Yes! The firm will receive back the initial cash outlay in less than 3.5 years. [3.3 Years < 3.5 Year Max.]
The management of Basket Wonders has set a maximum PBP of 3.5 years for projects of this type.
Should this project be accepted?

13.12 Van Horne and Wachowicz, Fundamentals of Financial Management, 13th edition. © Pearson Education Limited 2009. Created by Gregory Kuhlemeyer.
Payback Period (Equal Cash Inflow)
If we assume for the same example the cash outflow is $40,000 and the inflow will be $15,000 each year, what is the payback period?

13.13 Van Horne and Wachowicz, Fundamentals of Financial Management, 13th edition. © Pearson Education Limited 2009. Created by Gregory Kuhlemeyer.
Payback Period (PBP)(Solution)
Payback period = Cash outflow/ Annual Cash inflow
$40,000 / 15,000 = 2.67 0.67 x 12 = 8.04 0.04 x 30 = 1.2 The (PBP) is 2 years and 8 month

13.14 Van Horne and Wachowicz, Fundamentals of Financial Management, 13th edition. © Pearson Education Limited 2009. Created by Gregory Kuhlemeyer.
PBP Strengths and WeaknessesPBP Strengths and Weaknesses
Strengths:• Easy to use and
understand
• Can be used as a measure of liquidity
• Easier to forecast ST than LT flows
Strengths:• Easy to use and
understand
• Can be used as a measure of liquidity
• Easier to forecast ST than LT flows
Weaknesses:• Does not account
for TVM
• Does not consider cash flows beyond the PBP
• Cutoff period is subjective

13.15 Van Horne and Wachowicz, Fundamentals of Financial Management, 13th edition. © Pearson Education Limited 2009. Created by Gregory Kuhlemeyer.
Internal Rate of Return (IRR)Internal Rate of Return (IRR)
IRR is the discount rate that equates the present value of the future net cash
flows from an investment project with the project’s initial cash outflow (ICO).
CF1 CF2 CFn (1 + IRR)1 (1 + IRR)2 (1 + IRR)n
+ . . . ++ICO =

13.16 Van Horne and Wachowicz, Fundamentals of Financial Management, 13th edition. © Pearson Education Limited 2009. Created by Gregory Kuhlemeyer.
$15,000 $10,000 $7,000
IRR Solution IRR Solution
$10,000 $12,000
(1+IRR)1 (1+IRR)2
Find the interest rate (IRR) that causes the discounted cash flows
to equal $40,000.
+ +
++$40,000 =
(1+IRR)3 (1+IRR)4 (1+IRR)5

13.17 Van Horne and Wachowicz, Fundamentals of Financial Management, 13th edition. © Pearson Education Limited 2009. Created by Gregory Kuhlemeyer.
IRR Solution (Try 10%)IRR Solution (Try 10%)
$40,000 = $10,000(PVIF10%,1) + $12,000(PVIF10%,2) +$15,000(PVIF10%,3) + $10,000(PVIF10%,4) + $ 7,000(PVIF10%,5)
$40,000 = $10,000(0.909) + $12,000(0.826) + $15,000(0.751) + $10,000(0.683) +
$ 7,000(0.621)
$40,000 = $9,090 + $9,912 + $11,265 + $6,830 + $4,347
=$41,444[Rate is too low!!]

13.18 Van Horne and Wachowicz, Fundamentals of Financial Management, 13th edition. © Pearson Education Limited 2009. Created by Gregory Kuhlemeyer.
IRR Solution (Try 10% )
Year Net Cash Flows
PVIF 10% Present Value
1 10,000 0.909 9,090
2 12,000 0.826 9,912
3 15,000 0.751 11,265
4 10,000 0.683 6,830
5 7,000 0.621 4,347
Total Present Value
41,444

13.19 Van Horne and Wachowicz, Fundamentals of Financial Management, 13th edition. © Pearson Education Limited 2009. Created by Gregory Kuhlemeyer.
IRR Solution (Try 15%)IRR Solution (Try 15%)
$40,000 = $10,000(PVIF15%,1) + $12,000(PVIF15%,2) + $15,000(PVIF15%,3) + $10,000(PVIF15%,4) + $ 7,000(PVIF15%,5)
$40,000 = $10,000(0.870) + $12,000(0.756) + $15,000(0.658) + $10,000(0.572) +
$ 7,000(0.497)
$40,000 = $8,700 + $9,072 + $9,870 + $5,720 + $3,479
=$36,841[Rate is too high!!]

13.20 Van Horne and Wachowicz, Fundamentals of Financial Management, 13th edition. © Pearson Education Limited 2009. Created by Gregory Kuhlemeyer.
IRR Solution (Try 15%)
Year Net Cash Flows
PVIF 15% Present Value
1 10,000 0.870 8,700
2 12,000 0.756 9,072
3 15,000 0.658 9,870
4 10,000 0.572 5,720
5 7,000 0.497 3,479
Total Present Value
36,841

13.21 Van Horne and Wachowicz, Fundamentals of Financial Management, 13th edition. © Pearson Education Limited 2009. Created by Gregory Kuhlemeyer.
0.10$41,444
0.05 IRR $40,000 $4,603
0.15$36,841
X $1,4440.05 $4,603
IRR Solution (Interpolate)IRR Solution (Interpolate)
$1,444X
=

13.22 Van Horne and Wachowicz, Fundamentals of Financial Management, 13th edition. © Pearson Education Limited 2009. Created by Gregory Kuhlemeyer.
0.10$41,444
0.05 IRR $40,000 $4,603
0.15$36,841
X $1,4440.05 $4,603
IRR Solution (Interpolate)IRR Solution (Interpolate)
$1,444X
=

13.23 Van Horne and Wachowicz, Fundamentals of Financial Management, 13th edition. © Pearson Education Limited 2009. Created by Gregory Kuhlemeyer.
0.10$41,444
0.05 IRR $40,000 $4,603
0.15$36,841
($1,444)(0.05) $4,603
IRR Solution (Interpolate)IRR Solution (Interpolate)
$1,444X
X = X = 0.0157
IRR = 0.10 + 0.0157 = 0.1157 or 11.57%

13.24 Van Horne and Wachowicz, Fundamentals of Financial Management, 13th edition. © Pearson Education Limited 2009. Created by Gregory Kuhlemeyer.
IRR Acceptance CriterionIRR Acceptance Criterion
No! The firm will receive 11.57% for each dollar invested in this project at a cost of 13%. [ IRR < required Rate ]
No! The firm will receive 11.57% for each dollar invested in this project at a cost of 13%. [ IRR < required Rate ]
The management of Basket Wonders has determined that the required rate
is 13% for projects of this type.
Should this project be accepted?

13.28 Van Horne and Wachowicz, Fundamentals of Financial Management, 13th edition. © Pearson Education Limited 2009. Created by Gregory Kuhlemeyer.
IRR Strengths and WeaknessesIRR Strengths and Weaknesses
Strengths:• Accounts for
TVM
• Considers all cash
flows
• Less subjectivity
Strengths:• Accounts for
TVM
• Considers all cash
flows
• Less subjectivity
Weaknesses: • Assumes all cash
flows reinvested at the IRR
• Difficulties with project rankings
and Multiple IRRs

13.29 Van Horne and Wachowicz, Fundamentals of Financial Management, 13th edition. © Pearson Education Limited 2009. Created by Gregory Kuhlemeyer.
Net Present Value (NPV)Net Present Value (NPV)
NPV is the present value of an investment project’s net cash
flows minus the project’s initial cash outflow (ICO).
CF1 CF2 CFn (1+k)1 (1+k)2 (1+k)n
+ . . . ++ - ICONPV =

13.30 Van Horne and Wachowicz, Fundamentals of Financial Management, 13th edition. © Pearson Education Limited 2009. Created by Gregory Kuhlemeyer.
Basket Wonders has determined that the appropriate discount rate (k) for this
project is 13%.
$10,000 $7,000
NPV Solution NPV Solution
$10,000 $12,000 $15,000 (1.13)1 (1.13)2 (1.13)3
+ +
+ - $40,000(1.13)4 (1.13)5
NPV = +

13.31 Van Horne and Wachowicz, Fundamentals of Financial Management, 13th edition. © Pearson Education Limited 2009. Created by Gregory Kuhlemeyer.
NPV SolutionNPV Solution
NPV = $10,000(PVIF13%,1) + $12,000(PVIF13%,2) + $15,000(PVIF13%,3) + $10,000(PVIF13%,4) +
$ 7,000(PVIF13%,5) – $40,000
NPV = $10,000(0.885) + $12,000(0.783) + $15,000(0.693) + $10,000(0.613) + $ 7,000(0.543) – $40,000
NPV = $8,850 + $9,396 + $10,395 + $6,130 + $3,801 – $40,000
= - $1,428

13.32 Van Horne and Wachowicz, Fundamentals of Financial Management, 13th edition. © Pearson Education Limited 2009. Created by Gregory Kuhlemeyer.
NPV Solution (Another Method)
Year Cash Flows PVIF 13% Present Value
1 10,000 0.885 8,850
2 12,000 0.783 9,396
3 15,000 0.693 10,396
4 10,000 0.613 6,130
5 7,000 0.543 3,801
Total PV 38,573
Cash outflow 40,000
Net PV (1,427)
13.33 Van Horne and Wachowicz, Fundamentals of Financial Management, 13th edition. © Pearson Education Limited 2009. Created by Gregory Kuhlemeyer.
NPV Acceptance CriterionNPV Acceptance Criterion
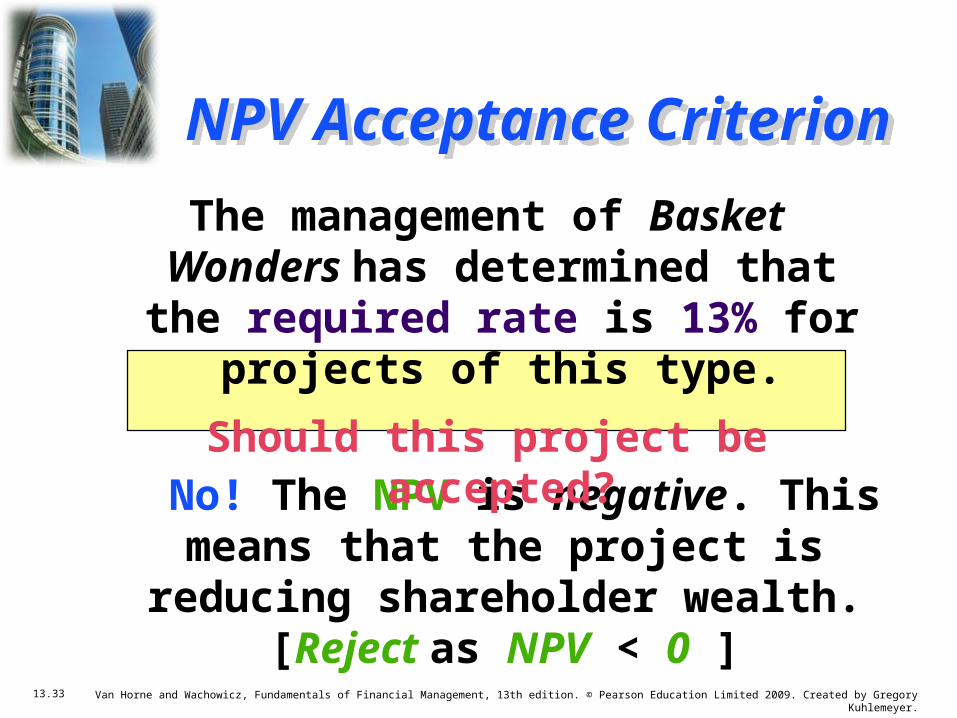
No! The NPV is negative. This means that the project is reducing shareholder
wealth. [Reject as NPV < 0 ]
No! The NPV is negative. This means that the project is reducing shareholder
wealth. [Reject as NPV < 0 ]
The management of Basket Wonders has determined that the required
rate is 13% for projects of this type.
Should this project be accepted?

13.37 Van Horne and Wachowicz, Fundamentals of Financial Management, 13th edition. © Pearson Education Limited 2009. Created by Gregory Kuhlemeyer.
NPV Strengths and WeaknessesNPV Strengths and Weaknesses
Strengths:• Cash flows
assumed to be reinvested at
the required rate.
• Accounts for TVM.
• Considers all cash flows.
Strengths:• Cash flows
assumed to be reinvested at
the required rate.
• Accounts for TVM.
• Considers all cash flows.
Weaknesses:• May not include
managerial options
embedded in the project. See Chapter 14.

13.40 Van Horne and Wachowicz, Fundamentals of Financial Management, 13th edition. © Pearson Education Limited 2009. Created by Gregory Kuhlemeyer.
Profitability Index (PI)Profitability Index (PI)
PI is the ratio of the present value of a project’s future net cash flows to the project’s initial cash outflow.
CF1 CF2 CFn (1+k)1 (1+k)2 (1+k)n
+ . . . ++ ICOPI =Method #1:

13.41 Van Horne and Wachowicz, Fundamentals of Financial Management, 13th edition. © Pearson Education Limited 2009. Created by Gregory Kuhlemeyer.
PI Acceptance Criterion PI Acceptance Criterion
No! The PI is less than 1.00. This means that the project is not profitable.
[Reject as PI < 1.00 ]
No! The PI is less than 1.00. This means that the project is not profitable.
[Reject as PI < 1.00 ]
PI = $38,573 / $40,000
= .9643 (Method #1, previous slide)
Should this project be accepted?

13.42 Van Horne and Wachowicz, Fundamentals of Financial Management, 13th edition. © Pearson Education Limited 2009. Created by Gregory Kuhlemeyer.
PI Strengths and WeaknessesPI Strengths and Weaknesses
Strengths:• Same as NPV
• Allows comparison
of different scale projects
Strengths:• Same as NPV
• Allows comparison
of different scale projects
Weaknesses:• Same as NPV
• Provides only relative
profitability
• Potential Ranking Problems

13.43 Van Horne and Wachowicz, Fundamentals of Financial Management, 13th edition. © Pearson Education Limited 2009. Created by Gregory Kuhlemeyer.
Evaluation Summary
Method Project Comparison Decision
PBP 3.3 3.5 Accept
IRR 11.47% 13% Reject
NPV -$1,424 $0 Reject
PI .96 1.00 Reject
Basket Wonders Independent Project

13.45 Van Horne and Wachowicz, Fundamentals of Financial Management, 13th edition. © Pearson Education Limited 2009. Created by Gregory Kuhlemeyer.
Independent Project
• Independent – A project whose acceptance (or rejection) does not prevent the acceptance of other projects under consideration.
• For this project, assume that it is independent of any other potential projects that Basket Wonders may undertake.

13.46 Van Horne and Wachowicz, Fundamentals of Financial Management, 13th edition. © Pearson Education Limited 2009. Created by Gregory Kuhlemeyer.
Other Project Relationships
• Mutually Exclusive – A project whose acceptance precludes the acceptance of one or more alternative projects.
• Dependent – A project whose acceptance depends on the acceptance of one or more other projects.

13.47 Van Horne and Wachowicz, Fundamentals of Financial Management, 13th edition. © Pearson Education Limited 2009. Created by Gregory Kuhlemeyer.
Potential Problems Under Mutual ExclusivityPotential Problems Under Mutual Exclusivity
A. Scale of Investment
B. Cash-flow Pattern
C. Project Life
A. Scale of Investment
B. Cash-flow Pattern
C. Project Life
Ranking of project proposals may create contradictory results.

13.48 Van Horne and Wachowicz, Fundamentals of Financial Management, 13th edition. © Pearson Education Limited 2009. Created by Gregory Kuhlemeyer.
A. Scale DifferencesA. Scale Differences
Compare a small (S) and a large (L) project.
NET CASH FLOWSProject S Project LEND OF YEAR
0 -$100 -$100,000
1 0 0
2 $400 $156,250

13.49 Van Horne and Wachowicz, Fundamentals of Financial Management, 13th edition. © Pearson Education Limited 2009. Created by Gregory Kuhlemeyer.
A. Scale DifferencesA. Scale Differences
Calculate the PBP, IRR, NPV@10%, and PI@10%.
Which project is preferred? Why?
Project IRR NPV PI S 100% $ 231 3.31
L 25% $29,132 1.29
S 100% $ 231 3.31
L 25% $29,132 1.29

13.50 Van Horne and Wachowicz, Fundamentals of Financial Management, 13th edition. © Pearson Education Limited 2009. Created by Gregory Kuhlemeyer.
A. Scale DifferencesA. Scale Differences0 (100)$ (100,000)$ 1 -$ -$ 2 400$ 156,250$
Discount rate: 10%IRR: 100.00% 25.00%
NPV: 230.58$ 29,132.23$ PI: 3.31 1.29
BEST!!
Greatest NPV
Rate NPV - Small NPV Large0% $300.00 $56,250.002% $284.47 $50,182.624% $269.82 $44,461.916% $256.00 $39,061.948% $242.94 $33,959.19
10% $230.58 $29,132.2312% $218.88 $24,561.5414% $207.79 $20,229.3016% $197.27 $16,119.2018% $187.27 $12,216.3220% $177.78 $8,506.9422% $168.74 $4,978.5024% $160.15 $1,619.41
Year CF - Small CF - Large
$0.00
$10,000.00
$20,000.00
$30,000.00
$40,000.00
$50,000.00
$60,000.00
$0.00
$50.00
$100.00
$150.00
$200.00
$250.00
$300.00
$350.00
0% 2% 4% 6% 8% 10% 12% 14% 16% 18% 20% 22% 24%
Axis Title
Graph the NPV Profiles for 'Small' and 'Large' projects
NPV - Small
NPV Large
Refer to VW13E-13b.xlsx on the ‘Scale’ tab.
Remember to refer to Excel spreadsheet ‘VW13E-13b.xlsx’ and the ‘Scale’ tab.

13.51 Van Horne and Wachowicz, Fundamentals of Financial Management, 13th edition. © Pearson Education Limited 2009. Created by Gregory Kuhlemeyer.
B. Cash Flow PatternB. Cash Flow Pattern
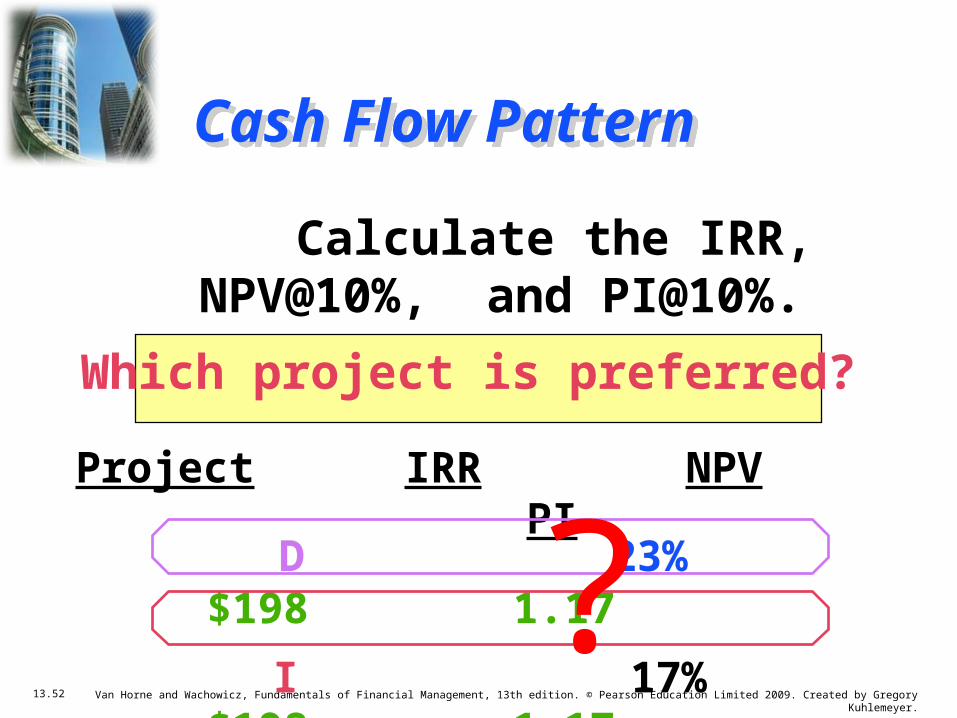
Let us compare a decreasing cash-flow (D) project and an increasing cash-flow (I) project.
NET CASH FLOWSProject D Project IEND OF YEAR
0 -$1,200 -$1,200 1 1,000 100
2 500 600
3 100 1,080
13.52 Van Horne and Wachowicz, Fundamentals of Financial Management, 13th edition. © Pearson Education Limited 2009. Created by Gregory Kuhlemeyer.
D 23% $198 1.17
I 17% $198 1.17
D 23% $198 1.17
I 17% $198 1.17
Cash Flow PatternCash Flow Pattern
Calculate the IRR, NPV@10%, and PI@10%.
Which project is preferred?
Project IRR NPV PI

13.53 Van Horne and Wachowicz, Fundamentals of Financial Management, 13th edition. © Pearson Education Limited 2009. Created by Gregory Kuhlemeyer.
Examine NPV ProfilesExamine NPV Profiles
Discount Rate (%)0 5 10 15 20 25-2
00
0
200
400
600
IRR
NPV@10%
Plot NPV for eachproject at various
discount rates.
Net
Pre
sen
t V
alu
e ($
)
Project I
Project D

13.54 Van Horne and Wachowicz, Fundamentals of Financial Management, 13th edition. © Pearson Education Limited 2009. Created by Gregory Kuhlemeyer.
Fisher’s Rate of IntersectionFisher’s Rate of Intersection
Discount Rate ($)0 5 10 15 20 25-2
00
0
200
400
600
Net
Pre
sen
t V
alu
e ($
)
At k<10%, I is best! Fisher’s Rate ofIntersection
At k>10%, D is best!

13.56 Van Horne and Wachowicz, Fundamentals of Financial Management, 13th edition. © Pearson Education Limited 2009. Created by Gregory Kuhlemeyer.
C. Project Life DifferencesC. Project Life Differences
Let us compare a long life (X) project and a short life (Y) project.
NET CASH FLOWSProject X Project YEND OF YEAR
0 -$1,000 -$1,000 1 0 2,000
2 0 0
3 3,375 0

13.57 Van Horne and Wachowicz, Fundamentals of Financial Management, 13th edition. © Pearson Education Limited 2009. Created by Gregory Kuhlemeyer.
X 50% $1,536 2.54
Y 100% $ 818 1.82
X 50% $1,536 2.54
Y 100% $ 818 1.82
Project Life DifferencesProject Life Differences
Calculate the PBP, IRR, NPV@10%, and PI@10%.
Which project is preferred? Why?
Project IRR NPV PI

13.62 Van Horne and Wachowicz, Fundamentals of Financial Management, 13th edition. © Pearson Education Limited 2009. Created by Gregory Kuhlemeyer.
Capital Rationing
Capital Rationing occurs when a constraint (or budget ceiling) is placed on the total size of capital expenditures
during a particular period.
Example: Julie Miller must determine what investment opportunities to undertake for Basket Wonders (BW). She is limited to a maximum expenditure of $32,500 only for this capital budgeting period.

13.63 Van Horne and Wachowicz, Fundamentals of Financial Management, 13th edition. © Pearson Education Limited 2009. Created by Gregory Kuhlemeyer.
Available Projects for BW
Project ICO IRR NPV PI
A $ 500 18% $ 50 1.10 B 5,000 25 6,500 2.30 C 5,000 37 5,500 2.10 D 7,500 20 5,000 1.67 E 12,500 26 500 1.04 F 15,000 28 21,000 2.40 G 17,500 19 7,500 1.43 H 25,000 15 6,000 1.24

13.64 Van Horne and Wachowicz, Fundamentals of Financial Management, 13th edition. © Pearson Education Limited 2009. Created by Gregory Kuhlemeyer.
Choosing by IRRs for BW
Project ICO IRR NPV PIC $ 5,000 37% $ 5,500
2.10 F 15,000 28 21,000 2.40 E 12,500 26 500 1.04 B 5,000 25 6,500 2.30
Projects C, F, and E have the three largest IRRs.
The resulting increase in shareholder wealth is $27,000 with a $32,500 outlay.

13.65 Van Horne and Wachowicz, Fundamentals of Financial Management, 13th edition. © Pearson Education Limited 2009. Created by Gregory Kuhlemeyer.
Choosing by NPVs for BW
Project ICO IRR NPV PI
F $15,000 28% $21,000 2.40 G 17,500 19 7,500 1.43 B 5,000 25 6,500 2.30
Projects F and G have the two largest NPVs.
The resulting increase in shareholder wealth is $28,500 with a $32,500 outlay.

13.66 Van Horne and Wachowicz, Fundamentals of Financial Management, 13th edition. © Pearson Education Limited 2009. Created by Gregory Kuhlemeyer.
Choosing by PIs for BW
Project ICO IRR NPV PI
F $15,000 28% $21,000 2.40B 5,000 25 6,500 2.30 C 5,000 37 5,500 2.10 D 7,500 20 5,000 1.67 G 17,500 19 7,500 1.43
Projects F, B, C, and D have the four largest PIs.
The resulting increase in shareholder wealth is $38,000 with a $32,500 outlay.

13.67 Van Horne and Wachowicz, Fundamentals of Financial Management, 13th edition. © Pearson Education Limited 2009. Created by Gregory Kuhlemeyer.
Summary of Comparison
Method Projects Accepted Value Added
PI F, B, C, and D $38,000
NPV F and G $28,500
IRR C, F, and E $27,000
PI generates the greatest increase in shareholder wealth when a limited capital
budget exists for a single period.

13.68 Van Horne and Wachowicz, Fundamentals of Financial Management, 13th edition. © Pearson Education Limited 2009. Created by Gregory Kuhlemeyer.
Single-Point Estimate and Sensitivity AnalysisSingle-Point Estimate and Sensitivity Analysis
• Allows us to change from “single-point” (i.e., revenue, installation cost, salvage, etc.) estimates to a “what if” analysis
• Utilize a “base-case” to compare the impact of individual variable changes
• E.g., Change forecasted sales units to see impact on the project’s NPV
• Allows us to change from “single-point” (i.e., revenue, installation cost, salvage, etc.) estimates to a “what if” analysis
• Utilize a “base-case” to compare the impact of individual variable changes
• E.g., Change forecasted sales units to see impact on the project’s NPV
Sensitivity Analysis: A type of “what-if” uncertainty analysis in which variables or assumptions are changed from a base case in order to determine their impact on a project’s measured results (such as NPV or IRR).

13.69 Van Horne and Wachowicz, Fundamentals of Financial Management, 13th edition. © Pearson Education Limited 2009. Created by Gregory Kuhlemeyer.
Post-Completion Audit
Post-completion Audit
A formal comparison of the actual costs and benefits of a project with original estimates.
• Identify any project weaknesses
• Develop a possible set of corrective actions
• Provide appropriate feedback
Result: Making better future decisions!