Embed Size (px)
Citation preview
MRM Manual
July 2013
Funded by
Implemented by

MRM Manual, M4C, July 2013 1
Table of Contents
List of Abbreviations ............................................................................................................ 2 Glossary .............................................................................................................................. 3 1 Project Background ...................................................................................................... 6 2 M4C MRM System ....................................................................................................... 7
2.1 What is a Monitoring and Result Measurement (MRM) system? ........................... 7 2.2 Purpose of the MRM system for M4C .................................................................... 7 2.3 Link to DCED Standard ......................................................................................... 9 2.4 MRM Processes .................................................................................................... 9 2.5 How MRM Supports Project Management ............................................................10
3 M4C Logframe and Results Chains .............................................................................11 3.1 M4C Logframe ......................................................................................................11 3.2 Articulate the logic of interventions: Results Chains .............................................13 3.3 Hierarchy of Change.............................................................................................13 3.4 Sector Results Chain ............................................................................................14 3.5 Intervention Results chain ....................................................................................18
4 Defining Indicators of Change .....................................................................................22 4.1 Indicators at Activity level .....................................................................................22 4.2 Indicators at Output level ......................................................................................23 4.3 Indicators at Outcome Level .................................................................................24 4.4 Indicators at Impact level ......................................................................................25 4.5 Context and Unintended Impacts..........................................................................25
5 Assessing Change .......................................................................................................27 5.1 Establishing Baselines ..........................................................................................28 5.2 Making Projection in Results Chains ....................................................................29 5.3 Measuring Changes in Indicators .........................................................................30 5.4 Defining and Measuring Attributable Change .......................................................33 5.5 Measurement Plans to Collect Data .....................................................................36 5.6 Cross-Sectors.......................................................................................................38 5.7 Enabling Environment ..........................................................................................38 5.8 Logistics and Quality Control ................................................................................38 5.9 Special Studies .....................................................................................................39 5.10 Indirect Impact on Mainland Service Provider and Enterprises .............................39
6 Analyzing and Using Information .................................................................................41 6.1 Principles for Analyzing Information ......................................................................41 6.2 Process of Analysis ..............................................................................................43 6.3 Using Information in Decision-Making ..................................................................45
7 Aggregating Impact .....................................................................................................46 8 Tracking Costs ............................................................................................................47 9 Reporting and Documentation .....................................................................................47 10 Tasks and Responsibilities .......................................................................................54
MRM Manual, M4C, July 2013 2
List of Abbreviations
CLP Char Livelihood Programme
DCED Donor committee for Enterprise Development
DRR Disaster Risk reduction
FGD Focused Group Discussions
ICT Information and Communication Technology
Logframe Logical Framework
M4C Making Markets Work for Jamuna, Padma, and Teesta Chars
M4P Making Markets Work for the Poor
MRM Monitoring and Results Measurement
PIU Project Implementation Unit
SMEs Small and Medium Enterprises
SDC Swiss Agency for Development and Cooperation
WEE Women’s Economic Empowerment
MRM Manual, M4C, July 2013 3
Glossary Activity: Actions taken to produce specific outputs from inputs such as funds, technical assistance, and other resources. Assumptions: Hypotheses about factors that could affect the progress or success of an intervention. Achieving results depends on whether the assumptions made prove to be true. Incorrect assumptions at any stage can become an obstacle to the validity of the expected results or achieving them Attribution: Demonstrating a causal link between observed results and project activities, taking into account the effects of other interventions and possible confounding factors. Attributing results to project activities requires the creation of a ‘counterfactual Baseline: The status of services and results indicators, such as knowledge, attitudes, norms, behaviors, and conditions prior to the intervention. Benchmark: A reference point or standard against which progress or achievements can be assessed. A benchmark refers to the performance that has been achieved in the recent past by other comparable organizations, or what can be reasonably inferred to have been achieved in similar circumstances. Business enabling environment: The norms and customs, laws, regulations, policies, international trade agreements and public infrastructure that either facilitate or hinder the movement of a product or service along its value chain. Capacity: The knowledge, organization, and resources needed to perform a function. Crowding in: Enterprises at levels other than the target level copying behaviors that those affected by program activities have adopted or entering a sector or value chain as a result of improved incentives and environment created (at least partly) by the program. This term also applies to government agencies or civil society organizations, who are not directly involved in the program, copying behaviors of those who are directly involved in the program, or who change their behavior as a result of improved incentives or environment created (at least partly) by the program.
Copying: Other target enterprises copying behaviors that those affected directly by program activities have adopted. Counterfactual: A situational analysis of what would have happened without the project, or if the project had taken a different (but specified) form. Data: Specific quantitative and qualitative information or facts that are collected Direct Impact: Changes generated by M4C that can be linked in a straight line to M4C activities without considering crowding in, copying in or new entrants Displacement: The amount of negative effect on those enterprises harmed by M4C

MRM Manual, M4C, July 2013 4
Effects: Changes in knowledge, attitudes, and practices, as well as in systems. Effectiveness: The extent to which a program or project has achieved its expected outcomes under normal conditions in a field setting. Efficiency: A measure of how well inputs (resources such as funds, expertise, and time) are converted into outputs. This term is also used more specifically in economic evaluation to mean the cost value of producing a given product or service. Estimated Impact: The outreach and change in an indicator attributable to an intervention, estimated based on the findings of information collection activities. Estimated impact replaces predicted impact in a impact logic after data collection and analysis. Feasibility: The quality of being doable with the means at hand and circumstances as they are. Indicator: A quantitative or qualitative variable that provides simple and reliable means to measure achievement, monitor performance, or to reflect changes connected to an intervention Indirect Impact: Change generated by M4C that can be linked to M4C activities through crowding in, copying and/or new entrants. Intervention: A specific activity (or set of activities) intended to bring about change in some aspect of the status of the target population Logframe: Short for “Logical Framework” a table that summarizes a project’s strategy for achieving its goal, using the levels of outputs, outcomes and goal. Monitoring: Routine tracking and reporting of priority information about a project and its intended outputs, outcomes, and impacts. Outcome: The changes that a project aims to effect on target beneficiaries or populations Participatory approach: Involves poor producers and other market system actors in identifying opportunities and constraints, and developing action plans Projection: The information used to calculate predicted or estimated impact that is based on experience, professional opinion, or internal or external sources/studies, and that will be validated through M4C’s data collection. Quantitative data: Data presented in numerical form, such as survey data and epidemiological data Relationship Matrix: Relationship Matrix (RM) is a tool to monitor changes in relationships between market actors. RM has four columns. The monitoring indicators (or parameters) that define the relationship are shown in the first column and the changes in each of these variables are recorded in rows across the following three columns (Baseline, Current Situation and Future).
MRM Manual, M4C, July 2013 5
Results: The output, outcome, or impact of an intervention. Results sustainability: The likelihood that project results will last over the long-term. Target group: Group of people who are the primary intended beneficiaries of an intervention Triangulation: The analysis and use of data from three or more sources obtained by different methods. Findings can be corroborated, and the weakness or bias of any of the methods or data sources can be compensated for by the strengths of another, thereby increasing the validity and reliability of the result.
MRM Manual, M4C, July 2013 6
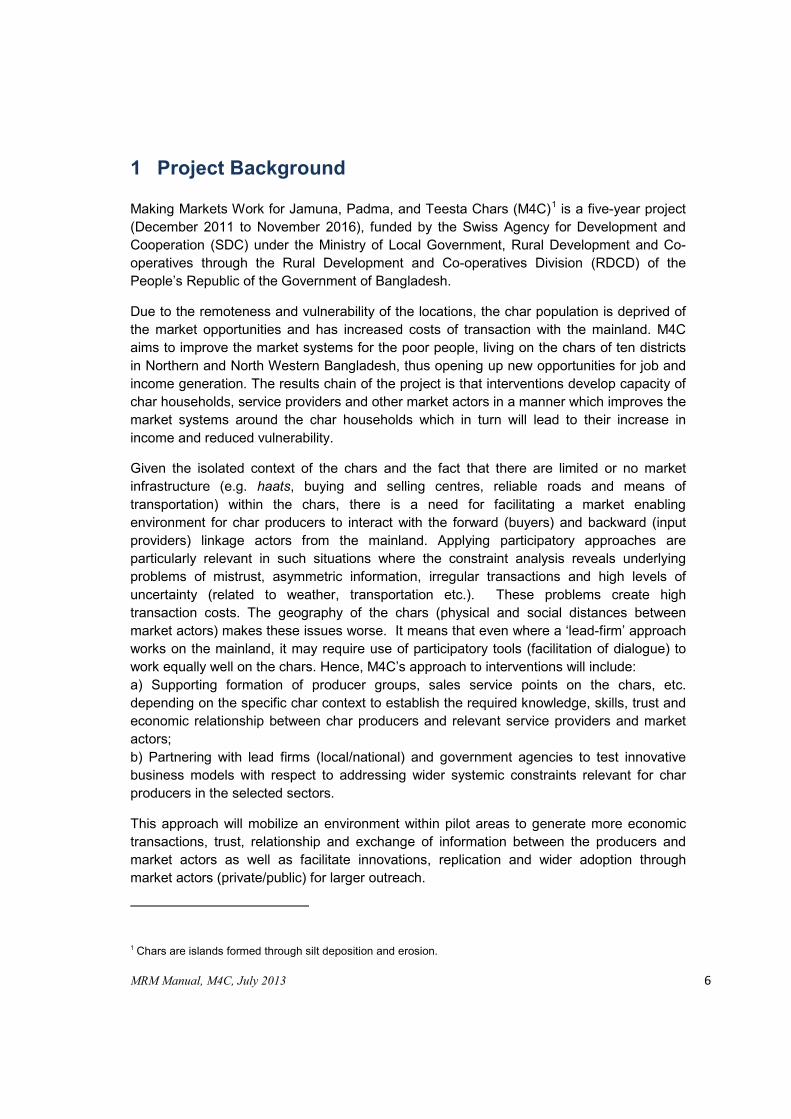
1 Project Background Making Markets Work for Jamuna, Padma, and Teesta Chars (M4C)1
1 Chars are islands formed through silt deposition and erosion.
is a five-year project (December 2011 to November 2016), funded by the Swiss Agency for Development and Cooperation (SDC) under the Ministry of Local Government, Rural Development and Co-operatives through the Rural Development and Co-operatives Division (RDCD) of the People’s Republic of the Government of Bangladesh.
Due to the remoteness and vulnerability of the locations, the char population is deprived of the market opportunities and has increased costs of transaction with the mainland. M4C aims to improve the market systems for the poor people, living on the chars of ten districts in Northern and North Western Bangladesh, thus opening up new opportunities for job and income generation. The results chain of the project is that interventions develop capacity of char households, service providers and other market actors in a manner which improves the market systems around the char households which in turn will lead to their increase in income and reduced vulnerability.
Given the isolated context of the chars and the fact that there are limited or no market infrastructure (e.g. haats, buying and selling centres, reliable roads and means of transportation) within the chars, there is a need for facilitating a market enabling environment for char producers to interact with the forward (buyers) and backward (input providers) linkage actors from the mainland. Applying participatory approaches are particularly relevant in such situations where the constraint analysis reveals underlying problems of mistrust, asymmetric information, irregular transactions and high levels of uncertainty (related to weather, transportation etc.). These problems create high transaction costs. The geography of the chars (physical and social distances between market actors) makes these issues worse. It means that even where a ‘lead-firm’ approach works on the mainland, it may require use of participatory tools (facilitation of dialogue) to work equally well on the chars. Hence, M4C’s approach to interventions will include: a) Supporting formation of producer groups, sales service points on the chars, etc. depending on the specific char context to establish the required knowledge, skills, trust and economic relationship between char producers and relevant service providers and market actors; b) Partnering with lead firms (local/national) and government agencies to test innovative business models with respect to addressing wider systemic constraints relevant for char producers in the selected sectors.
This approach will mobilize an environment within pilot areas to generate more economic transactions, trust, relationship and exchange of information between the producers and market actors as well as facilitate innovations, replication and wider adoption through market actors (private/public) for larger outreach.

MRM Manual, M4C, July 2013 7
2 M4C MRM System 2.1 What is a Monitoring and Result Measurement (MRM) system? A Monitoring and Results Measurement (MRM) System is widely recognized as a crucial basis for project management, steering and learning. As a project management tool it helps project management and staff members to make better decisions for effective implementation of interventions. At the same time, it ensures regular and systematic monitoring of project activities and measurement of project results.
In addition, the MRM system helps to keep records and prepare essential reports on project performance on a regular basis and supports the delivery of information (both qualitative and quantitative) regarding the progress, successes and failures in interventions, sectors and the overall project, which can be communicated with different stakeholders including partners, donors and the wider development community amongst others.
2.2 Purpose of the MRM system for M4C M4C’s MRM system helps assure the quality of interventions, sector strategies and portfolio management. The MRM system serves as an internal management tool for intervention implementation and helps the project report on performance and results to donors and the wider community (project stakeholders, development practitioners).
The primary purpose for having an MRM system for the M4C project is to systematically monitor, measure and report on project activities and the changes that they cause. As an M4P project, M4C has three levels where progress is assessed:
• Whole project – M4C assesses the extent to which the results (at output, outcome and impact levels) across its portfolio of sectors are meeting the project objectives and uses this information to adjust its portfolio of sectors and overall strategy
• Sector – In each sector, M4C assesses the extent to which the portfolio of interventions is addressing key constraints and opportunities identified and are resulting in the expected overall changes in the sector. Based on this information, M4C adds, drops or adjusts interventions in each sector. Sectors and cross-sectors are handled slightly differently but with the same overall steering mechanism.
• Intervention – For each intervention, M4C assesses the extent to which the intervention is resulting in expected changes at the output, outcome and impact levels and uses this information to drop or adjust the intervention. An intervention may go through two phases – the pilot or testing phase and, if successful, a scale up phase. In other cases, M4C is using tested interventions, so a pilot phase is not necessary. Sometimes new interventions already reach significant scale so a specific scale up intervention is not needed.
The MRM system is designed to make project management and staff members think throughout the entire project process: choice of sectors, development of sector strategies, design of interventions, intervention implementation, assessing changes, examining progress in sectors, assessing overall project progress and checking whether changes are
MRM Manual, M4C, July 2013 8
sustainable and market systems are evolving in effective and pro-poor ways as a result of project activities.
M4C MRM system shall support the project in: • Improving: As a management tool MRM supports the project management and
project team to keep track of the progress and achievements and to take adequate measures to improve the project performance through linking the results from previous activities with present and future interventions and activities.
• Learning: Through a process of reflection and exchanges, MRM encourages a continuous learning process within the project team (incl. partners and beneficiaries) and Swisscontact.
• Reporting: As a reporting tool, MRM increases external accountability through measuring changes and estimating results at output, outcome and impact levels of the projects and its partners and reporting these results to the SDC, Swisscontact and Practical Action headquarters and other relevant stakeholders (e.g. taxpayers, media etc.)
The different elements of M4C’s MRM system include:
a. Tools to describe the expected results from the project. The most important of these tools is results chains, which are used to articulate and to help track how M4C interventions lead to the achievement of development goals.
b. Key processes that M4C will use to design strategies and interventions, to measure changes caused by interventions, to analyze progress and to manage the overall steering
c. Reports that will be used in order to provide input into decision making and reporting against different deliverables.
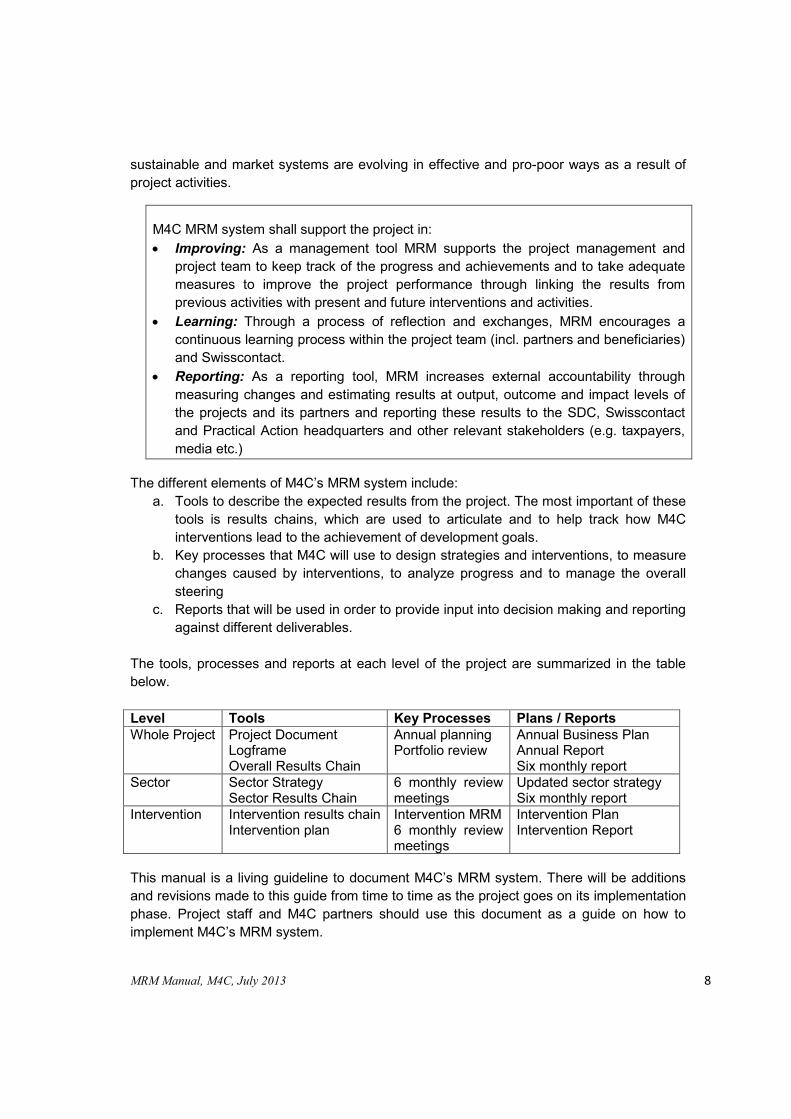
The tools, processes and reports at each level of the project are summarized in the table below. Level Tools Key Processes Plans / Reports Whole Project Project Document
Logframe Overall Results Chain
Annual planning Portfolio review
Annual Business Plan Annual Report Six monthly report
Sector Sector Strategy Sector Results Chain
6 monthly review meetings
Updated sector strategy Six monthly report
Intervention Intervention results chain Intervention plan
Intervention MRM 6 monthly review meetings
Intervention Plan Intervention Report
This manual is a living guideline to document M4C’s MRM system. There will be additions and revisions made to this guide from time to time as the project goes on its implementation phase. Project staff and M4C partners should use this document as a guide on how to implement M4C’s MRM system.
MRM Manual, M4C, July 2013 9
The document has significantly drawn on resources made available through the Swisscontact-Katalyst MRM manual, Swisscontact MRM guidelines, the CAVAC MRM manual, the DCED Results Measurement Standard implementation guidelines and other resources made available through DCED to implement a results measurement system that incorporates the different elements of the DCED Standard for results measurement (see section below). The idea is to draw on the learning that is already available and customize it to the requirements of the M4C project.
2.3 Link to DCED Standard As mentioned before M4C will draw from Swisscontact’s experience of implementing the Monitoring and Results Measurement (MRM) system in Katalyst, which is one of the first projects that contributed towards the development of the Donor Committee for Enterprise Development (DCED) Standard for results measurement. Katalyst got successfully audited against the Standard for results measurement in 2011. Using this internal learning, M4C will design a results measurement system that integrates the different elements of the DCED Standard for results measurement. The eight main elements of the DCED Standard include: 1. Articulating results chains 2. Defining indicators of change 3. Measuring changes in indicators 4. Estimating attributable changes 5. Capturing wider changes in the system or market 6. Tracking program costs 7. Reporting results 8. Managing the system for results measurement
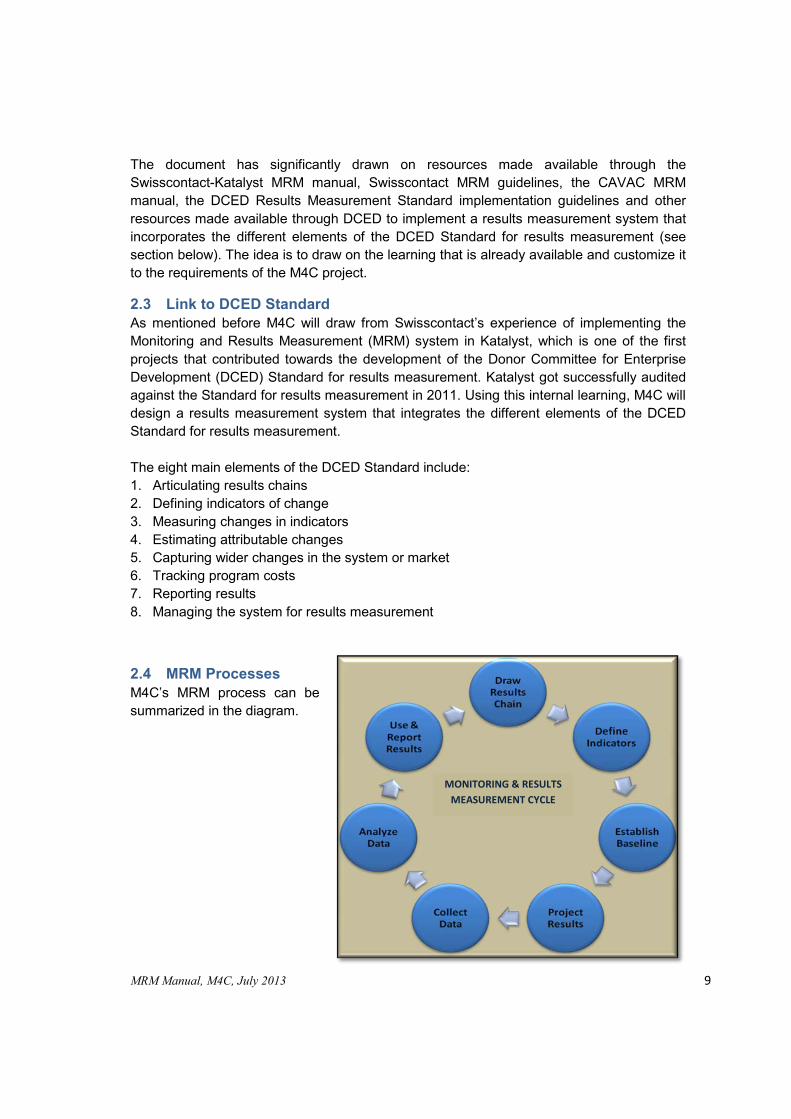
2.4 MRM Processes M4C’s MRM process can be summarized in the diagram.
MONITORING & RESULTS
MEASUREMENT CYCLE

MRM Manual, M4C, July 2013 10
2.5 How MRM Supports Project Management M4C’s work is not designed to directly reach the poor; rather it is aimed at encouraging market systems to function more effectively and efficiently and in ways that bring greater benefits the poor. This raises the issue of showing clearly how M4C’s work benefits the poor. Thus, the MRM system for M4C is used to show how impact will be achieved, how changes will be measured and how the attribution of observed changes to the project activities will be assessed. Once this framework is created, it is used to guide intervention management and learning for the whole project. The sequence of MRM flow shows the sequencing of MRM activities, along with the key documents that will be produced in this sequence.
MRM activities Project decisions and actions
Rapid area assessment report Potential sector identification
Sector study report Identification of sector potential, Key constraints and opportunities
Sector strategy report, Sector logic Defining sector vision, intervention areas, potential partners,
Intervention concept note Identification of partners, targets and main activities
Draft Intervention Plan (Results chain with indicators, projections, MRM plan, background intervention story, calculation sheet ), Baseline
Signing contract and MoU with partners, Implementation of activities as planned
Monitoring of activities Are we on the right track? What needs to be done more? Completion of intervention activities
Draft Intervention Report what has actually happened ? what are the signs of impact? What lessons are learnt? Next steps?
Results Measurement, attribution, analysis of results Did the interventions work? If yes, go for scale up; if no, design and implement new pilot interventions if appropriate
Six months review meeting (are we achieving the targets/goals, what is working and what not, dropping or
adding interventions from/to sector, redesigning the interventions ; Semester Report
Annual portfolio review meeting (are we achieving the log frame or off-log frame target/objectives, which sectors are
working, and which aren’t, to what extent, allocation of resources to sectors, dropping or adding sectors from/to the
portfolio; Annual Report, Annual plan
Updated Intervention Report annually
Updated intervention plan ( cover page, background story, results chain, MRM plan, calculation sheet)
Updated Sector Strategy annually, Aggregation of results (Outputs semi-annually, Outcomes and impacts annually

MRM Manual, M4C, July 2013 11
3 M4C Logframe and Results Chains Interventions for M4C are all framed in order to achieve the targets of the M4C logical framework. The MRM system derives its priorities from the project logframe, thus it is important to first understand the project logframe before proceeding to the different steps in the MRM system.
3.1 M4C Logframe The M4C logframe summarizes the basic causal steps that lead from the project’s activities to the achievement of the project’s outputs, outcomes and goal. The indicators in the project logframe are a summary of what the project expects to achieve in its different markets and in its interventions.
The M4C logframe reflects on the basic impact logic of the project’s work:
• Activities: These are the specific tasks performed using resources and methods in order to achieve the intended outputs of the M4C project. The activities are undertaken with the aim of generating a new or improved service or output aimed at stimulating changes in the competitiveness of the char households.
• Outputs: These are the products and services produced or competences and capacities established directly as a result of project activities. Service providers deliver the outputs to the char households, which ensure the sustainability of change even after M4C exits.
• Outcomes: Outcome is the short or medium term effects (=changes in quality and quantity) expected from the outputs of the project. The effective delivery of output causes a behavioral change in char households, which leads to their improved competitiveness. This is measured in terms of cost reductions, higher production, improved profitability etc. for char households.
• Impact: Impact refers to the improvements of a situation in terms of social, economic or any other benefits which respond to identified development needs of char households under a long-term vision. At the goal level char households experience an increase in income which is derived from the proper use and application of the competitiveness-enhancing service or output.
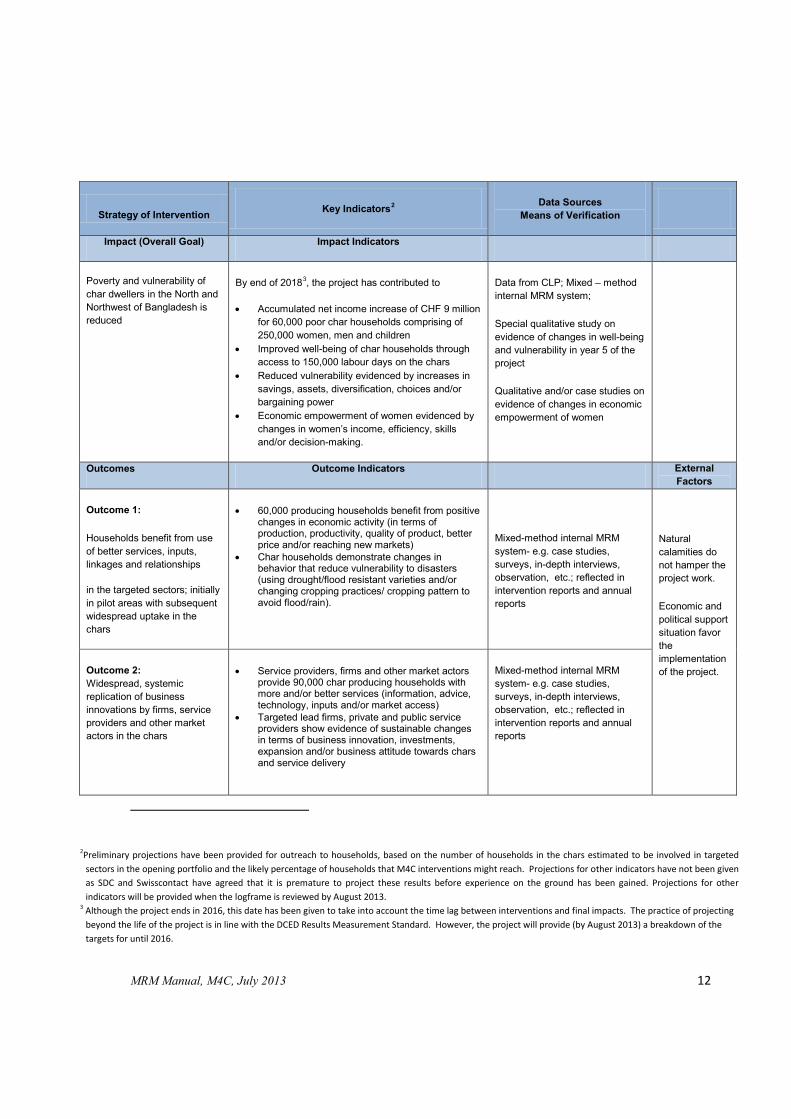
The logframe for M4C is presented below:
MRM Manual, M4C, July 2013 12
2Preliminary projections have been provided for outreach to households, based on the number of households in the chars estimated to be involved in targeted sectors in the opening portfolio and the likely percentage of households that M4C interventions might reach. Projections for other indicators have not been given as SDC and Swisscontact have agreed that it is premature to project these results before experience on the ground has been gained. Projections for other indicators will be provided when the logframe is reviewed by August 2013.
3 Although the project ends in 2016, this date has been given to take into account the time lag between interventions and final impacts. The practice of projecting beyond the life of the project is in line with the DCED Results Measurement Standard. However, the project will provide (by August 2013) a breakdown of the targets for until 2016.
Strategy of Intervention Key Indicators2 Data Sources Means of Verification
Impact (Overall Goal) Impact Indicators
Poverty and vulnerability of char dwellers in the North and Northwest of Bangladesh is reduced
By end of 20183
• Accumulated net income increase of CHF 9 million for 60,000 poor char households comprising of 250,000 women, men and children
, the project has contributed to
• Improved well-being of char households through access to 150,000 labour days on the chars
• Reduced vulnerability evidenced by increases in savings, assets, diversification, choices and/or bargaining power
• Economic empowerment of women evidenced by changes in women’s income, efficiency, skills and/or decision-making.
Data from CLP; Mixed – method internal MRM system;
Special qualitative study on evidence of changes in well-being and vulnerability in year 5 of the project
Qualitative and/or case studies on evidence of changes in economic empowerment of women
Outcomes Outcome Indicators External Factors
Outcome 1:
Households benefit from use of better services, inputs, linkages and relationships
in the targeted sectors; initially in pilot areas with subsequent widespread uptake in the chars
• 60,000 producing households benefit from positive changes in economic activity (in terms of production, productivity, quality of product, better price and/or reaching new markets)
• Char households demonstrate changes in behavior that reduce vulnerability to disasters (using drought/flood resistant varieties and/or changing cropping practices/ cropping pattern to avoid flood/rain).
Mixed-method internal MRM system- e.g. case studies, surveys, in-depth interviews, observation, etc.; reflected in intervention reports and annual reports
Natural calamities do not hamper the project work.
Economic and political support situation favor the implementation of the project.
Outcome 2: Widespread, systemic replication of business innovations by firms, service providers and other market actors in the chars
• Service providers, firms and other market actors provide 90,000 char producing households with more and/or better services (information, advice, technology, inputs and/or market access)
• Targeted lead firms, private and public service providers show evidence of sustainable changes in terms of business innovation, investments, expansion and/or business attitude towards chars and service delivery
Mixed-method internal MRM system- e.g. case studies, surveys, in-depth interviews, observation, etc.; reflected in intervention reports and annual reports
MRM Manual, M4C, July 2013 13
3.2 Articulate the logic of interventions: Results Chains For each intervention area, M4C develops one or several interventions that address the relevant constraint by producing a change, generally at the service market level. The activities and expected changes are captured in a results chain.
M4C designs a results chain for every sector and then every individual intervention in which it works. Results chains are the foundation of the MRM System because they describe how M4C activities lead through a series of intermediate changes to poverty reduction.
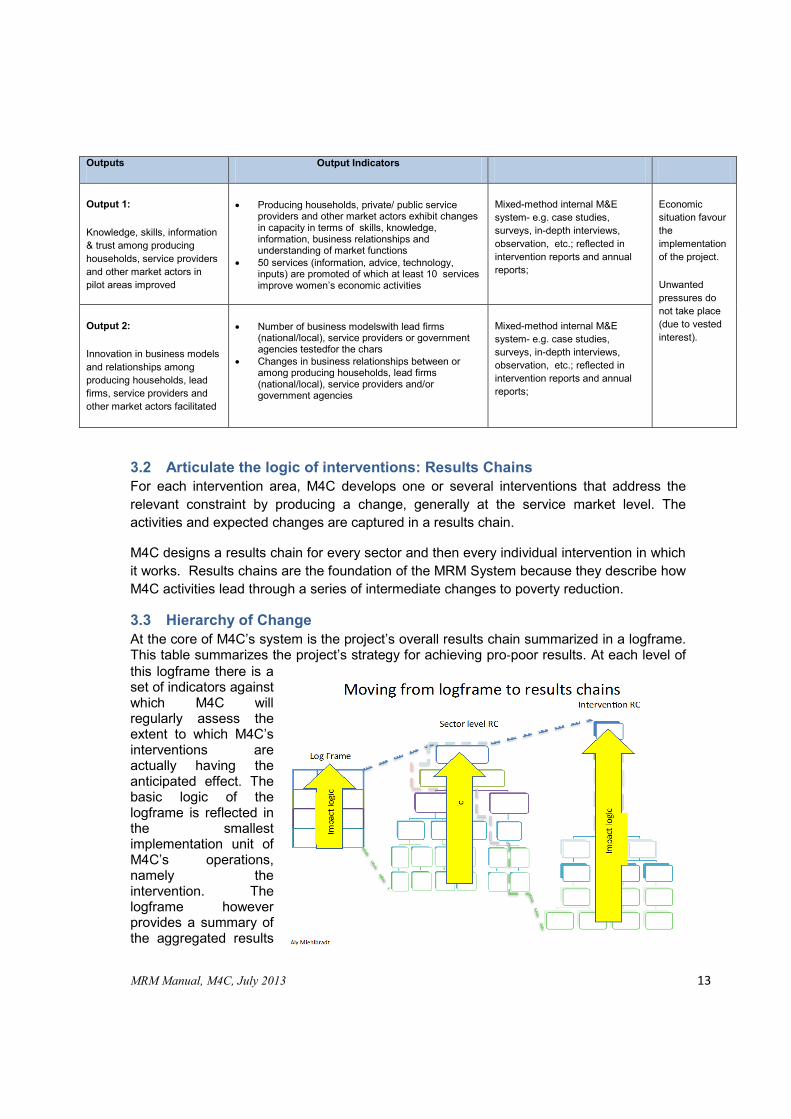
3.3 Hierarchy of Change At the core of M4C’s system is the project’s overall results chain summarized in a logframe. This table summarizes the project’s strategy for achieving pro-poor results. At each level of this logframe there is a set of indicators against which M4C will regularly assess the extent to which M4C’s interventions are actually having the anticipated effect. The basic logic of the logframe is reflected in the smallest implementation unit of M4C’s operations, namely the intervention. The logframe however provides a summary of the aggregated results
Outputs Output Indicators
Output 1:
Knowledge, skills, information & trust among producing households, service providers and other market actors in pilot areas improved
• Producing households, private/ public service providers and other market actors exhibit changes in capacity in terms of skills, knowledge, information, business relationships and understanding of market functions
• 50 services (information, advice, technology, inputs) are promoted of which at least 10 services improve women’s economic activities
Mixed-method internal M&E system- e.g. case studies, surveys, in-depth interviews, observation, etc.; reflected in intervention reports and annual reports;
Economic situation favour the implementation of the project.
Unwanted pressures do not take place (due to vested interest).
Output 2:
Innovation in business models and relationships among producing households, lead firms, service providers and other market actors facilitated
• Number of business modelswith lead firms (national/local), service providers or government agencies testedfor the chars
• Changes in business relationships between or among producing households, lead firms (national/local), service providers and/or government agencies
Mixed-method internal M&E system- e.g. case studies, surveys, in-depth interviews, observation, etc.; reflected in intervention reports and annual reports;
MRM Manual, M4C, July 2013 14
from the work in the different sectors, each of which comprise of several different interventions.
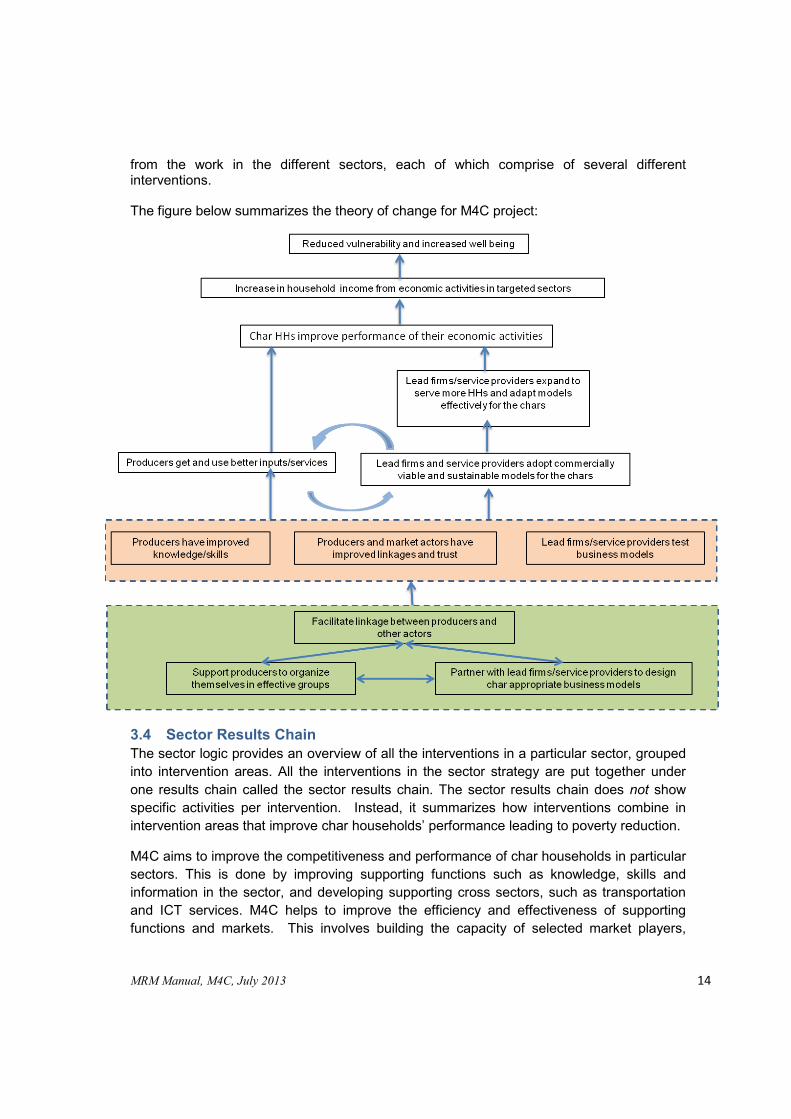
The figure below summarizes the theory of change for M4C project:
3.4 Sector Results Chain The sector logic provides an overview of all the interventions in a particular sector, grouped into intervention areas. All the interventions in the sector strategy are put together under one results chain called the sector results chain. The sector results chain does not show specific activities per intervention. Instead, it summarizes how interventions combine in intervention areas that improve char households’ performance leading to poverty reduction.
M4C aims to improve the competitiveness and performance of char households in particular sectors. This is done by improving supporting functions such as knowledge, skills and information in the sector, and developing supporting cross sectors, such as transportation and ICT services. M4C helps to improve the efficiency and effectiveness of supporting functions and markets. This involves building the capacity of selected market players,
MRM Manual, M4C, July 2013 15
brokering new relationships, and introducing new information and approaches to market players in value chains and supporting markets.
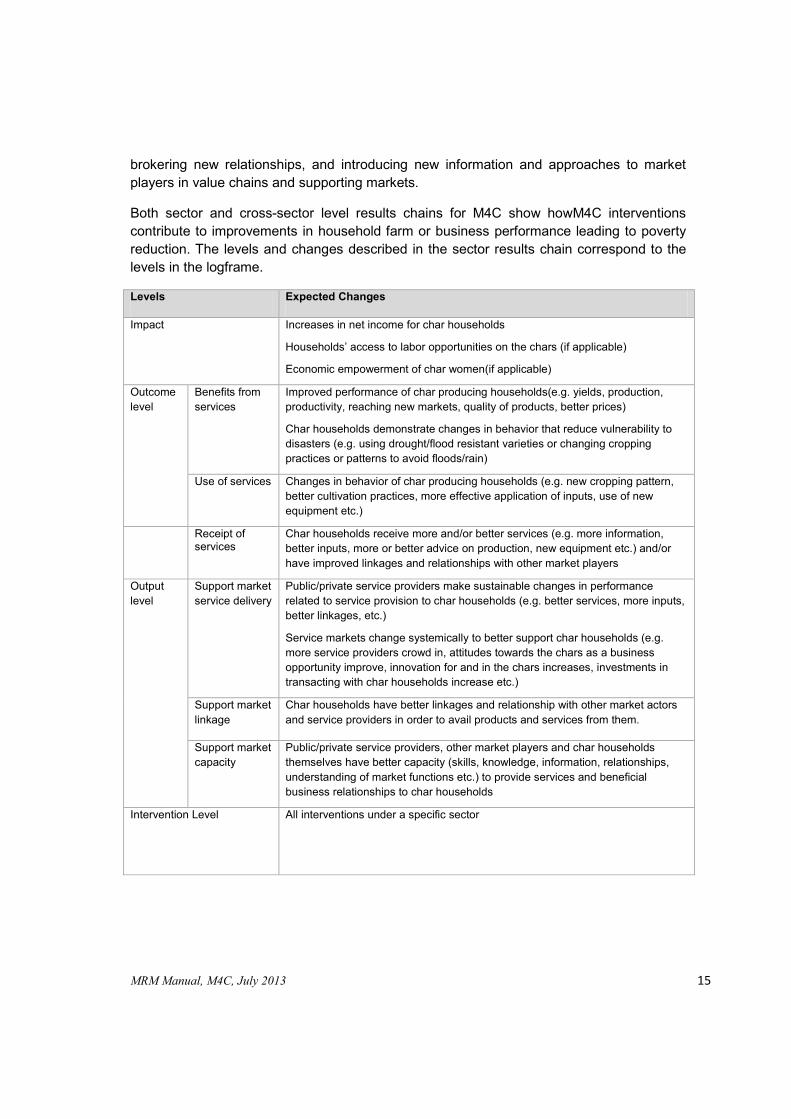
Both sector and cross-sector level results chains for M4C show howM4C interventions contribute to improvements in household farm or business performance leading to poverty reduction. The levels and changes described in the sector results chain correspond to the levels in the logframe.
Levels Expected Changes
Impact Increases in net income for char households
Households’ access to labor opportunities on the chars (if applicable)
Economic empowerment of char women(if applicable)
Outcome level
Benefits from services
Improved performance of char producing households(e.g. yields, production, productivity, reaching new markets, quality of products, better prices)
Char households demonstrate changes in behavior that reduce vulnerability to disasters (e.g. using drought/flood resistant varieties or changing cropping practices or patterns to avoid floods/rain)
Use of services Changes in behavior of char producing households (e.g. new cropping pattern, better cultivation practices, more effective application of inputs, use of new equipment etc.)
Receipt of services
Char households receive more and/or better services (e.g. more information, better inputs, more or better advice on production, new equipment etc.) and/or have improved linkages and relationships with other market players
Output level
Support market service delivery
Public/private service providers make sustainable changes in performance related to service provision to char households (e.g. better services, more inputs, better linkages, etc.)
Service markets change systemically to better support char households (e.g. more service providers crowd in, attitudes towards the chars as a business opportunity improve, innovation for and in the chars increases, investments in transacting with char households increase etc.)
Support market linkage
Char households have better linkages and relationship with other market actors and service providers in order to avail products and services from them.
Support market capacity
Public/private service providers, other market players and char households themselves have better capacity (skills, knowledge, information, relationships, understanding of market functions etc.) to provide services and beneficial business relationships to char households
Intervention Level All interventions under a specific sector
MRM Manual, M4C, July 2013 16
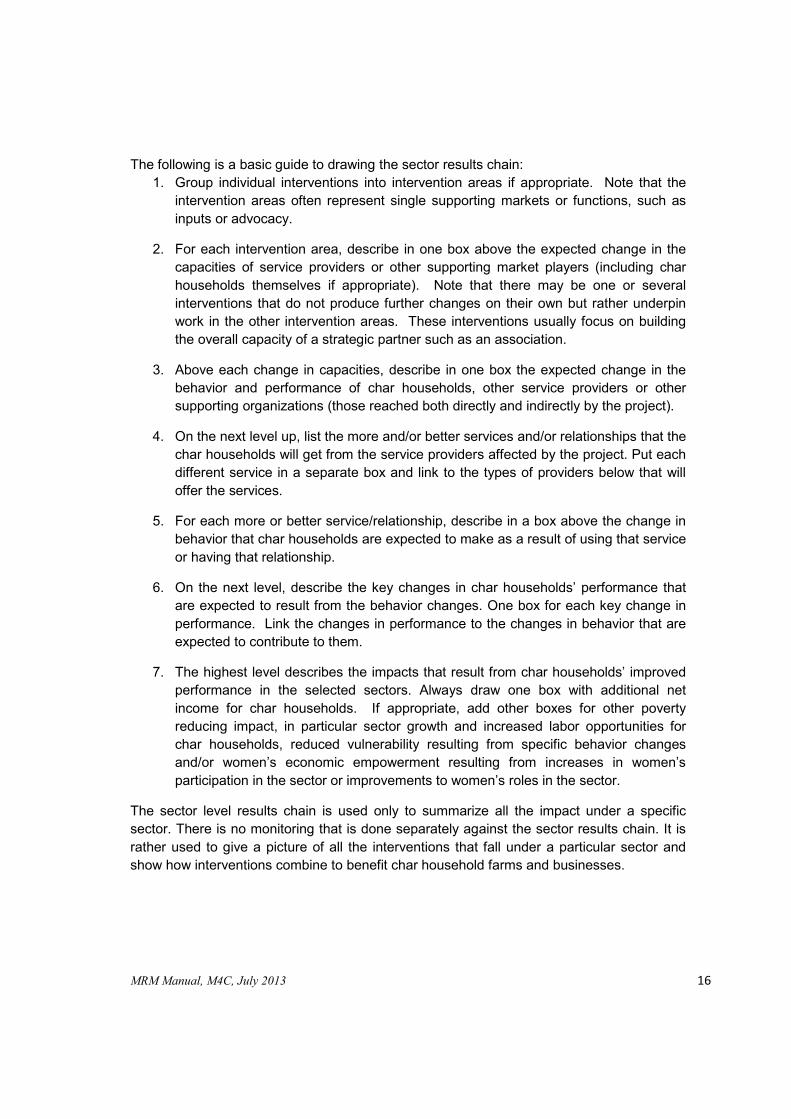
The following is a basic guide to drawing the sector results chain: 1. Group individual interventions into intervention areas if appropriate. Note that the
intervention areas often represent single supporting markets or functions, such as inputs or advocacy.
2. For each intervention area, describe in one box above the expected change in the capacities of service providers or other supporting market players (including char households themselves if appropriate). Note that there may be one or several interventions that do not produce further changes on their own but rather underpin work in the other intervention areas. These interventions usually focus on building the overall capacity of a strategic partner such as an association.
3. Above each change in capacities, describe in one box the expected change in the behavior and performance of char households, other service providers or other supporting organizations (those reached both directly and indirectly by the project).
4. On the next level up, list the more and/or better services and/or relationships that the char households will get from the service providers affected by the project. Put each different service in a separate box and link to the types of providers below that will offer the services.
5. For each more or better service/relationship, describe in a box above the change in behavior that char households are expected to make as a result of using that service or having that relationship.
6. On the next level, describe the key changes in char households’ performance that are expected to result from the behavior changes. One box for each key change in performance. Link the changes in performance to the changes in behavior that are expected to contribute to them.
7. The highest level describes the impacts that result from char households’ improved performance in the selected sectors. Always draw one box with additional net income for char households. If appropriate, add other boxes for other poverty reducing impact, in particular sector growth and increased labor opportunities for char households, reduced vulnerability resulting from specific behavior changes and/or women’s economic empowerment resulting from increases in women’s participation in the sector or improvements to women’s roles in the sector.
The sector level results chain is used only to summarize all the impact under a specific sector. There is no monitoring that is done separately against the sector results chain. It is rather used to give a picture of all the interventions that fall under a particular sector and show how interventions combine to benefit char household farms and businesses.

MRM
Manual, M
4C, July 2013
17
Below is an exam
ple of a sector results chain on the char Chilli sector
Ch
illi pro
du
cers receive b
etter services, info
rmatio
n,
inp
uts an
d h
ave imp
roved
lin
kages & relatio
nsh
ips w
ith
the in
pu
t com
pan
ies, retailers, trad
ers,etc.
Ad
ditio
nal In
com
e
Intervention Area Output
Private inp
ut co
mp
anies an
d
retailers (pesticid
e, fertilizer, gro
wth
pro
mo
ter)exten
ded
their d
istribu
tion
n
etwo
rk into
chars an
d
pro
mo
te qu
ality inp
uts
Local retailers, trad
ers, p
rod
ucers' gro
up
s and
lead
farmers b
ecom
e kn
ow
ledgeable an
d are
pro
vidin
g info
rmatio
n to
char
farmers ab
ou
t pro
per
cultivatio
n tech
niq
ues
Outcome
Ch
illi pro
du
cers use q
uality
inp
uts an
d ap
ply b
etter cu
ltivation
practices th
at red
uces clim
atic vuln
erability
as well
Ch
illi pro
du
cers receive in
form
ation
and
techn
olo
gy o
n im
pro
ved d
rying, grad
ing
and
storin
g system
Ch
ar chilli p
rod
ucers get
high
er yield
Ch
ar chilli p
rod
ucers get
better p
rice
Ch
ar chilli p
rod
ucin
g ho
useh
old
s get h
igher p
rofit
Goal/
Impact
Interven
tion
area 4: Su
pp
ortin
g form
ation
o
f Ch
ar pro
du
cers' gro
up
s, sales & service
po
ints
Interven
tion
area 1: Im
pro
ved access to
q
uality in
pu
ts
Interven
tion
area 2: A
ccess to kn
ow
ledge
on
imp
roved
cu
ltivation
techn
iqu
es
Ch
illi pro
du
cing h
ou
seho
lds'
market kn
ow
ledge, cap
acity an
d b
argainin
g po
wer
increased
Imp
roved
bu
siness
relation
ship
and
trust
amo
ng th
e Jute p
rod
ucin
g h
ou
seho
lds an
d th
e market
actors &
service pro
viders
Bu
lk bu
ying an
d sellin
g are p
rom
oted
for th
e pro
du
cers th
rou
gh p
rod
ucers' gro
up
s, sales p
oin
ts, local trad
ers and
agro-
pro
cessors
Ch
illi pro
du
cers app
ly b
etter po
st harvestin
g tech
niq
ues an
d get h
igher
qu
ality chilli
Vu
lnerab
ility of ch
illi p
rod
ucing h
ou
seho
lds is
redu
ced
Interven
tion
area 3: P
rom
otin
g imp
roved
p
ost h
arvest tech
no
logies an
d
practice fo
r better
market
Agro
pro
cessing an
d
mach
inery co
mp
anies, lo
cal trad
ers and
pro
du
cers' grou
ps
beco
me kn
ow
ledgeab
le and
are p
rovid
ing im
pro
ved
techn
olo
gy and
kno
wled
ge on
p
ost h
arvest techn
iqu
es to
chilli p
rod
ucers
MRM Manual, M4C, July 2013 18
3.5 Intervention Results chain Intervention results chains are drawn showing how M4C’s activities are expected to lead to a series of changes in service markets and market relationships, which in turn contributes to changes in sectors, which lead to increased incomes and other poverty reducing benefits.
The intervention results chains are vital for the project because they show how specific M4C interventions will lead to change in the service providers and among char households. M4C uses intervention results chains to steer interventions by adjusting activities when expected changes do not occur.
The following steps give guidance on how to make an intervention results chains. The steps have been taken from DCED’s guidance on making results chains and modified as per M4C requirement.
A Guide to making intervention results chains 1. Write down the main project activities. If there is more than one activity, you will need to show the
relationship between them. Typically, this means asking: ¾ Does one activity lead to another? Or will they be undertaken at the same time? ¾ Do they all target the same service providers? Or do they target different service providers? ¾ Do they all aim to produce one specific change in service providers’ capacities? Or are they aimed at different changes?
Answering these questions gives more clarity on the logical sequencing timeframe for conducting of activities: what happens when; whether to group two or more activities under one intervention; and how to show the link between different activities. Add dates for the activities and subsequently estimate dates for when different levels of change will take place. This makes it easier to place activities in the order they will need to occur, and have dates for when change can be measured.
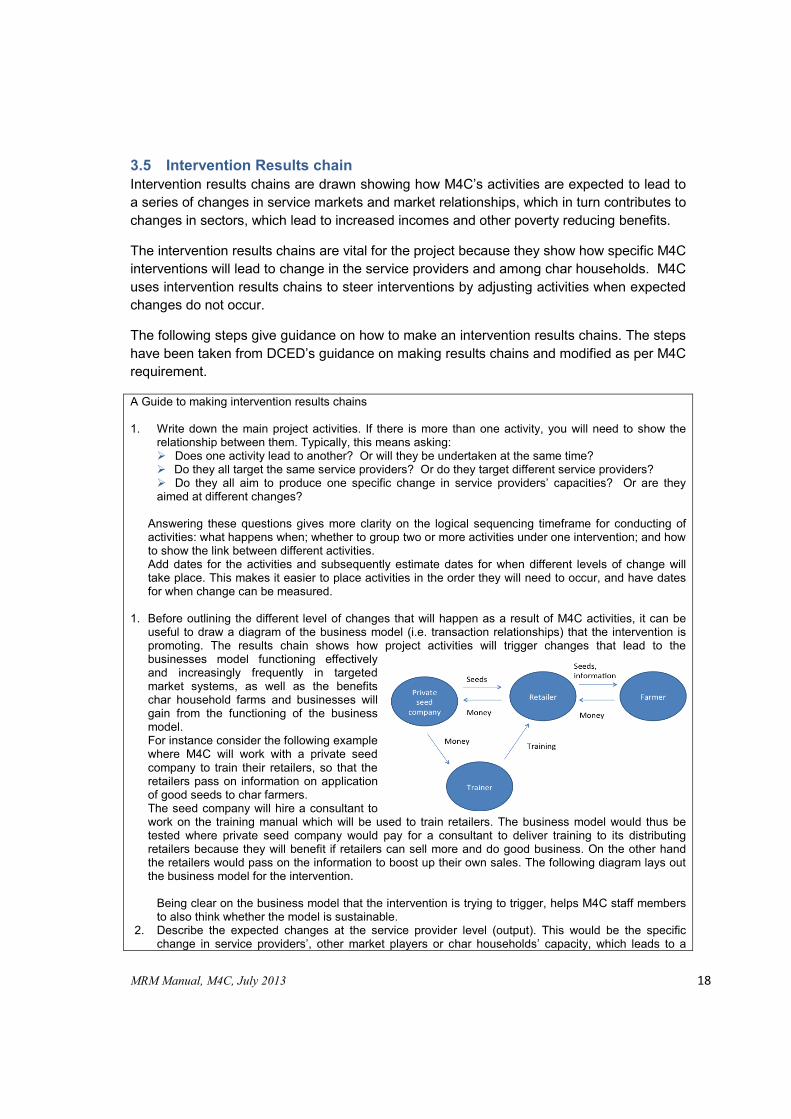
1. Before outlining the different level of changes that will happen as a result of M4C activities, it can be
useful to draw a diagram of the business model (i.e. transaction relationships) that the intervention is promoting. The results chain shows how project activities will trigger changes that lead to the businesses model functioning effectively and increasingly frequently in targeted market systems, as well as the benefits char household farms and businesses will gain from the functioning of the business model. For instance consider the following example where M4C will work with a private seed company to train their retailers, so that the retailers pass on information on application of good seeds to char farmers. The seed company will hire a consultant to work on the training manual which will be used to train retailers. The business model would thus be tested where private seed company would pay for a consultant to deliver training to its distributing retailers because they will benefit if retailers can sell more and do good business. On the other hand the retailers would pass on the information to boost up their own sales. The following diagram lays out the business model for the intervention.
Being clear on the business model that the intervention is trying to trigger, helps M4C staff members to also think whether the model is sustainable.
2. Describe the expected changes at the service provider level (output). This would be the specific change in service providers’, other market players or char households’ capacity, which leads to a
MRM Manual, M4C, July 2013 19
change in their behaviour and interaction with char households (performance). If other service providers are expected to crowd in as a result of this, add a separate line of change showing their change in behaviour and performance.
3. At the outcome level, first state the more or better services char households are expected to receive. Then, describe the specific changes in behaviour that char households will make to use those services. If other char households are expected to copy behaviour changes, show this as a separate box.
4. At the highest outcome level, describe the specific improvements in performance that the behaviour changes are expected to lead to. Draw two boxes for char households’ improved performance (direct and indirect separated out). In some cases, there might be two layers of improved performance (e.g. increased productivity leading to increased profits).
5. Finally draw a box for each poverty reducing impact that results from char households’ changes in performance. There should always be a box for increases in net income. There may be a box for increases in paid labor, decreases in vulnerability and/or women’s economic empowerment if appropriate.
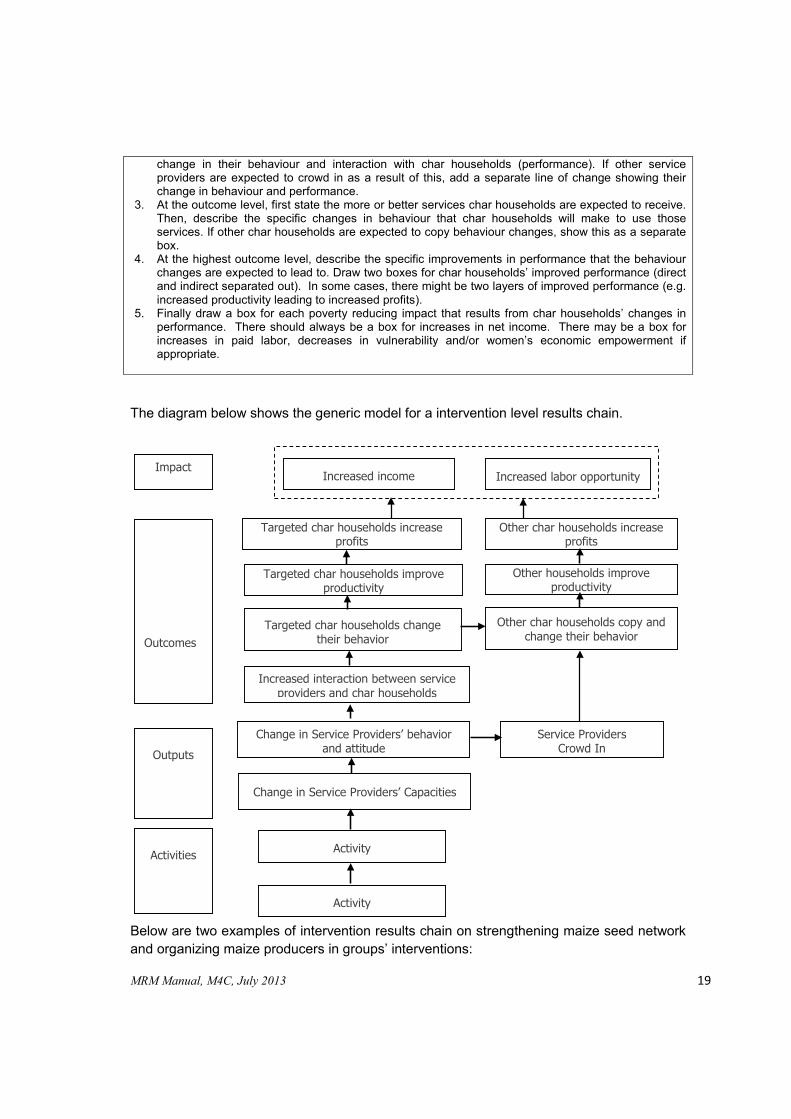
The diagram below shows the generic model for a intervention level results chain.
Below are two examples of intervention results chain on strengthening maize seed network and organizing maize producers in groups’ interventions:
Activity
Targeted char households change their behavior
Activity
Other char households copy and change their behavior
Targeted char households improve productivity
Other households improve productivity
Targeted char households increase profits
Other char households increase profits
Change in Service Providers’ Capacities
Increased interaction between service providers and char households
Service Providers Crowd In
Impact
Outcomes
Outputs
Activities
Increased income
Change in Service Providers’ behavior and attitude
Increased labor opportunity

MRM Manual, M4C, July 2013 20
Strengthening and Expanding Quality Maize Seed Distribution Network in Selected Chars (M1)
Identification of Input Company willing to strengthen their distribution network into Chars
(01) (Aug 2012)
Input Company developed training module for retailers, lead farmers and demo farmers (02)(Oct 2012)
Input Company developed a training module for their
marketing staff in association with M4C (01) (Oct 2012)
Input Company provided trainings to retailers, lead farmers and demo farmers
(Retailer 98, Lead farmer 19, Demo farmer
54) (Oct 2012)
Input Company provided trainings to their marketing
staffs (27) (Oct 2012)
Input Company conducted promotional activities ( Farmers' Meeting, Demo plots, Field days, poster, leaflets, PVC and clothe banner etc.) (FM 285, DP
54, FD 20) (Oct 2012 - Feb 2013)
Marketing Staff are exploring and promoting qaulity maize seed to chars
(27) (Oct-Dec 2012)
Retailers and LFs are promoting quality seeds to selected chars
(Retailer 78, Lead farmer 16) (Oct-Dec 2012)
Targeted Char Farmers are having information on and better access to quality
maize seeds(7,840 HH) (Jan 2013)
Targeted Char Farmers are buying and using quality maize seeds
(6,272 HH)(Jan 2013, Jan 2014)
Targeted Char Households get higher yield and better quality maize
(5,018 HH, 15%)(May 2013, May 2014)
Income of Char Households has increased(BDT 10,115,482) (May 2014)
Input company is assisted to develop plan for market expansion in selected chars
(01) (Sep 2012)
Seed Retailers and LFs get knowledgeable on business expansion
and marketing opportunities in selected chars (Retailer 98, Lead farmer 19) (Oct
2012)
Marketing Staff got adequate knowledge and Skills on market
development on chars (27) (Oct 2012)
Targeted Char Households get higher profit from maize cultivation
(BDT 1,008)(May 2013, May 2014)
Other Char Farmers are having better access to quality maize seeds
(7,840 HH) (Jan 2014)
Other Char Farmers are buying and using quality maize seeds
(6,272 HH) (Jan 2014)
Other Char Households are getting higher yield
(5,018 HH) (May 2014)
Other Char Households get higher profit from maize
(BDT 1,008)(May 2014)
More Input Companies and Retailers have penetrated into chars with quality Maize Seeds
(02) (Jan 2014)
IMPA
CTOU
TCOM
EOU
TPUT
ACTI
VITI
ES
Input Company developed different promotional materials to promote quality maize seed (PVC Banner 80, Cloth banner
80, Leaflet 20,000) (Oct 2012)
Improved quality maize seed distribution network is developed in
selected chars
Box 01
Box 02
Box 03 Box 04 Box 05
Box 06 Box 07Box 08
Box 10Box 09
Box 11
Box 12
Box 13
Box 14
Box 15
Box 16
Box 17
Box 18
Box 19
Box 20
Box 21
Box 22
Box 24
Char Households increase area of maize cultivation
Char households have better access to labour
opportunities
Box 23
Box 25
MRM Manual, M4C, July 2013 21
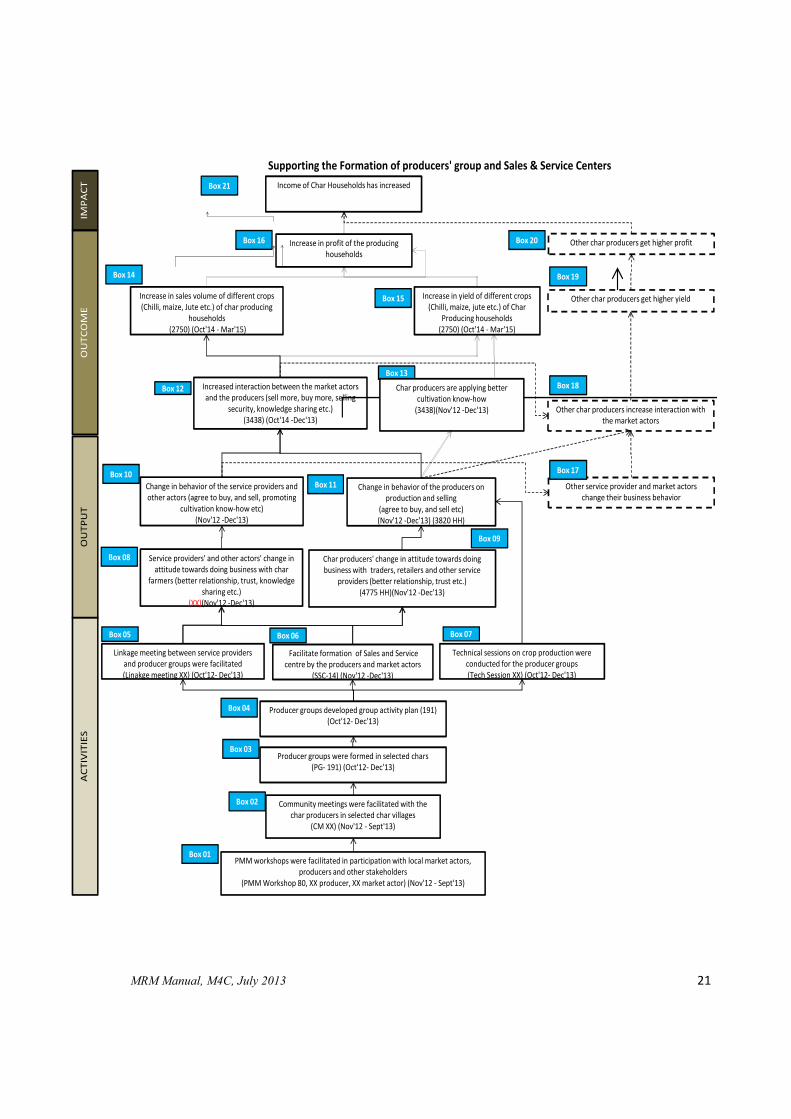
Supporting the Formation of producers' group and Sales & Service Centers
Producer groups were formed in selected chars(PG- 191) (Oct'12- Dec'13)
Facilitate formation of Sales and Service centre by the producers and market actors
(SSC-14) (Nov'12 -Dec'13)
Change in behavior of the producers on production and selling
(agree to buy, and sell etc)(Nov'12 -Dec'13) (3820 HH)
Change in behavior of the service providers and other actors (agree to buy, and sell, promoting
cultivation know-how etc)(Nov'12 -Dec'13)
Increased interaction between the market actors and the producers (sell more, buy more, selling
security, knowledge sharing etc.) (3438) (Oct'14 -Dec'13)
Income of Char Households has increased
PMM workshops were facilitated in participation with local market actors, producers and other stakeholders
(PMM Workshop 80, XX producer, XX market actor) (Nov'12 - Sept'13)
Service providers' and other actors' change in attitude towards doing business with char
farmers (better relationship, trust, knowledge sharing etc.)
(XX)(Nov'12 -Dec'13)
Char producers' change in attitude towards doing business with traders, retailers and other service
providers (better relationship, trust etc.)(4775 HH)(Nov'12 -Dec'13)
IMPA
CTO
UTC
OM
EO
UTP
UT
ACT
IVIT
IES
Increase in sales volume of different crops (Chilli, maize, Jute etc.) of char producing
households(2750) (Oct'14 - Mar'15)
Increase in yield of different crops (Chilli, maize, jute etc.) of Char
Producing households(2750) (Oct'14 - Mar'15)
Increase in profit of the producing households
Box 01
Box 02
Box 03
Box 04
Box 06Box 05 Box 07
Box 08
Box 10
Box 09
Box 11
Box 12
Box 13
Box 14
Box 15
Box 21
Community meetings were facilitated with the char producers in selected char villages
(CM XX) (Nov'12 - Sept'13)
Producer groups developed group activity plan (191) (Oct'12- Dec'13)
Linkage meeting between service providers and producer groups were facilitated (Linakge meeting XX) (Oct'12- Dec'13)
Technical sessions on crop production were conducted for the producer groups (Tech Session XX) (Oct'12- Dec'13)
Char producers are applying better cultivation know-how
(3438)(Nov'12 -Dec'13) Other char producers increase interaction with the market actors
Other service provider and market actors change their business behavior
Other char producers get higher yield
Other char producers get higher profit
Box 17
Box 18
Box 19
Box 20Box 16
MRM Manual, M4C, July 2013 22
4 Defining Indicators of Change The results chain provides a framework for conceptualizing expected changes that will result from project activities. These expected changes must then be translated into relevant (quantitative and/or qualitative) indicators of change. Tracking these indicators over time helps M4C to measure to what extent expected changes are occurring. Each step in the results chain developed in the previous Section therefore requires at least one indicator to provide the basis for tracing changes in the various levels of the results chain.
M4C puts equal emphasis in collecting both quantitative and qualitative indicators. While quantitative indicators give specific estimations to the extent to which change has occurred, qualitative indicators help to measure the nature of change. The indicators help the project staff by specifying the kind of information that needs to be collected through both qualitative and quantitative checks.
Ultimately indicators are also used to gauge the extent to which M4C is able to meet the logframe targets.
For each results chain, M4C develops indicators to answer the following questions:
• Is each expected change happening? • How much is the change? (Extent of change) • For how many people is it changing? (Scale of change) • Is the change likely to last? (Sustainability)
M4C also defines how it will address the following questions through measurement, for example by disaggregating an indicator or planning qualitative information gathering.
• Is there any change leading to economic empowerment of women • Is there any change to reduce vulnerability of char households
In addition, information is gathered to establish how much of the change is due to M4C activities. This is discussed in the section on attribution below.
For each results chain, the MRM and operations teams will ensure:
1) that the questions above will be addressed by the indicators 2) that the indicators will deliver required information for the logframe
It is important that indicators are tested before measurements are taken to ensure that they work effectively, for example through pre-testing and baselines.
4.1 Indicators at Activity level At this level, the indicators include measures of the immediate delivery of M4C activities. This includes outreach to project partners, service providers etc. Some examples of indicators to include in this level are:
MRM Manual, M4C, July 2013 23
For individual interventions For the portfolio • Completion of activities • Level of participation by partner(s) • Number of service providers participating • Contents of plans, partnership agreements
and TORs with partners
• Number of services promoted • Number of business models tested • Number of services specifically targeting
women
4.2 Indicators at Output level At the output level, the logframe indicators measure “changes in knowledge, skills, information & trust among producing households, service providers and other market actors in pilot areas” and “innovation in business models and relationships among producing households, lead firms, service providers and other market actors.”
Indicators for these expected changes basically aim to assess whether M4C activities have lead to sustainable improvement in service/product provision by service providers, which will enable them to deliver services to char households even after completion of M4C project and/or if there are sustainable improvements in char households’ business relationships with other market actors that will be sustained even after completion of the M4C project. In order to gauge this, the project needs to check on how many service providers, lead firms and/or char households have indeed adopted the model, how they have adopted the model and how they have benefited through it.
Some examples of indicators to include in this level are:
• Changes in capacities of partner service providers, market actors and/or char households (skills, knowledge, information, business relationships and understanding of market functions)
• Changes in business relationships between or among producing households, lead firms (national/local), service providers and/or government agencies
• Changes in relationship and level of trust among the char producing HHs, service providers and other market actors.
• Number of service providers exhibiting change in behavior (innovation) • Change in the service provided • Number of services introduced/improved which address DRR • Number of services introduced/improved which address women’s roles • Change in the number of regular char clients per service provider • Reasons behind the change in the number of regular char clients • Number of new service providers entering the market • Reasons behind the entry of more service providers • Change in turnover/sales/profits of service providers • Reasons for repeat sales or increased profits of service providers • Interest of service providers in continuing new/improved service provision • Reasons for service providers’ interest • Capacity of service providers to sustain new/improved service provision • Service providers’ investment in new business model
MRM Manual, M4C, July 2013 24
• Service providers’ attitudes towards doing business with char households • Number of producers' groups/producing HHs agreed to buy inputs from input sellers
in bulk • Number of producers' groups/producing HHs agreed to sell their produce to the
buyers in bulk
4.3 Indicators at Outcome Level At the outcome level, the logframe indicators measure “Households benefit from use of better services, inputs, linkages and relationships in the targeted sectors; initially in pilot areas with subsequent widespread uptake in the chars” and “widespread, systemic replication of business innovations by firms, service providers and other market actors in the chars.” To get to these outcomes, it is also important to measure char households’ receipt of new or better services, inputs, linkages and relationships and the change in behavior they make as a result.
Therefore, the indicators at this level focus on measuring the extent to which char households receive more/better services, inputs and relationships, the behavior changes and business practices in target char households and the performance as a result of such change (competitiveness). The first aim of the indicators is to confirm the strength of the link between getting an output and applying it within a char household’s farm or business, thus pertaining to the behavior change. The second aim at this level is to assess the extent to which changes in the specific business practices outlined per intervention actually result in concrete changes in char households’ production, productivity, costs, product quality, market reach and/or prices. It is expected that not all char households’ that change their behavior will experience these changes in competitiveness.
Some examples of indicators to include in this level are:
• Number of char households that receive more and/or better services, inputs or relationships
• Char households’ satisfaction with new/better services • Number of char households using more and/or better services as evidenced by
specific, expected behavior changes • Char households’ reasons for changes in behavior • Char households’ extent of changes in behavior • Char households’ interest in continuing behavior change • Change in char households’ yield, productivity, sales, costs, sales price, product
quality, market reach • Change in char households’ turnover/profit • Number of char households copying behavior change • Char households’ behavior changes that will reduce their vulnerability to disasters • Number of char households making a behavior change that will reduce their
vulnerability to disasters • Number of women having access to better economic opportunities
MRM Manual, M4C, July 2013 25
• Linkage /agreement status between Producing HHs/producers' groups and the other market actors
• Change in interaction frequency between char HHs and other market actors
4.4 Indicators at Impact level At the Impact/Goal level the logframe indicators measure ‘Poverty and vulnerability of char dwellers in the North and Northwest of Bangladesh’
At this level the indicators will measure the number of char households experiencing a change in net income, the value of the net income changes in select sectors where M4C intervenes, changes in paid labor employed by char households and how increased incomes affect vulnerability. In addition, indicators at this level will measure changes in women’s economic empowerment.
Some examples of indicators to include in this level are:
• Number of char households that have increased their incomes in targeted sectors • Additional income of char households in targeted sectors • Additional wage labor days employed by char producing households in targeted sectors • Reduced vulnerability of char households • Impact on char women’s economic empowerment
4.5 Context and Unintended Impacts In addition to getting information on specific indicators per intervention, M4C also monitors key indicators and trends in each targeted sector to ensure that the interventions remain relevant to the sector context. M4C also scans sectors for information on unintended impacts of interventions, both positive and negative. Examples of sector indicators that M4C monitors in sectors are:
- input and product prices - overall growth in the sector - opportunities and threats in end markets - changes in technology - changing business models or norms in business relationships - government policies, regulations or programs that affect the sector and their
implementation - changing gender roles - other factors in the enabling environment that affect the sector such as relevant
infrastructure or land ownership issues
In addition to the above, information used to detect unintended impacts both positive and negative include:

MRM Manual, M4C, July 2013 26
- signs of market saturation - reasons for changes in any of the above context indicators - satisfaction of market players with the sector and changes in it - innovation in business models - changes in gender roles, relationships or decision making - effects of natural disasters or other shocks in the sector
These indicators and information are not gathered formally. Instead the M4C team gathers this information in the course of their regular interactions with char households, service providers, lead firms and government agencies. The indicators and information are discussed at each six monthly meeting. If there are gaps in information, a plan is made and implemented to fill those gaps. At the six monthly meetings, the team analyses the information to determine if any changes in strategy are needed to ensure that the interventions are still relevant to the sector context, to mitigate any negative unintended impacts and to strengthen any positive unintended impacts.
MRM Manual, M4C, July 2013 27
5 Assessing Change The results chain and indicators of change provides M4C with the basis to frame questions, which allow the project to measure why, and how change is happening, and to what extent the change is a result of M4C activities.
Business Cycles: The business cycle for char households in each targeted sector and for service providers or other market actors interacting with char households affects when to measure. The business cycles the time it takes to convert inputs into outputs. For example the business cycle for most agricultural sectors is a few months, but the business cycle for a handicraft business might only be a week or two. Generally a baseline measurement from the business cycle before change is expected is compared with one or more measurements for business cycles after a change is expected.
Gender Issues: It is important when assessing change that M4C always gathers information on women’s and men’s perspectives on household level results in terms of changes in behavior, roles and household performance in targeted sectors. M4C will do this in the following ways:
• Gather information on women’s participation in program activities such as producer meetings, field days and technical sessions
• Keep track of the services that improve women’s roles, for example drying technologies which enable women to better dry chili and maize
• Each year conduct a qualitative study on women’s economic empowerment covering women’s roles, decision making, access to opportunities and benefits from increased income
CLP: M4C will actively work to benefit poor char men and women who have also benefited from CLP program through asset transfer. However, the impact that M4C reports will be the increases in income and jobs resulting from M4C interventions in M4C targeted sectors. This is possible because the baseline for these indicators will be taken after the business cycle just before an intervention is expected to result in impacts, meaning that the bulk of the results from CLP’s interventions will be included in the baseline figures. Never the less, it is clear that CLP’s asset transfer will have laid the foundation for CLP beneficiaries to take advantage of the opportunities created by M4C. In addition, CLP’s asset transfer will clearly have made a contribution to changes in vulnerability and women’s economic empowerment. Therefore M4C will acknowledge CLP in all reports as a contributor to the impact created among CLP beneficiaries.
Currently, it is planned that M4C and the CLP will not work in the same sectors. Therefore, impact on incomes and labor opportunities in the targeted sectors will not overlap between the two programs. However, impact on changes in vulnerability and women’s economic empowerment may overlap is CLP and M4C are reaching the same households. As above, M4C will acknowledge CLP’s contribution to these types of impacts in reporting. If M4C and CLP do collaborate in some sectors, this collaboration will be acknowledged in reporting. Finally, M4C will report its outreach to char households. It may be that some of these
MRM Manual, M4C, July 2013 28
households are also reached by the CLP t. M4C will acknowledge this overlap in reporting but will not aim to quantify it.
Katalyst: M4C is also working in chars where Katalyst has previously worked, in particular with the maize sector to improve the productivity and profitability of maize farmers. When M4C will work in the same chars where Katalyst had already worked in there will be an overlap in the outreach and impact on maize farmers. Katalyst will be reporting on its impact on maize char farmers till the year 2014. Thus when estimating impact in the maize sectors for 2013 and 2014, M4C will take into account the geographical areas where it will overlap with Katalyst and specifically acknowledge that for those particular chars, impact will be contributed for both Katalyst and M4C’s work.
5.1 Establishing Baselines In order to predict the changes in indicators as a result of M4C’s planned interventions and also to measure the changes over time, the project must know the status of the indicators at the time the intervention starts or before the project activities cause changes. This can be accomplished through a pre-intervention baseline study of the status of indicators in the results chain, or it can be done by a retrospective study (in absence of baseline) that compares the present with a previous point in time in order to assess changes.
1. Determine what data on the indicators is available from previous sector research and analysis
Pre-Intervention Baseline Study
When: A baseline assessment should be conducted per intervention when activities start being implemented. The key is to establish the participants’ condition before they have been significantly affected by Project activities. Thus assessment should therefore take place after the provider has been chosen but before significant capacity building has taken place.
How: If comprehensive sector research has been conducted as outlined in section 3.2, it may not be necessary to gather all additional data to measure the status of the indicators; there may be sufficient information from the sector study/initial market research and analysis. Those responsible for establishing the baseline indicators may therefore wish to take the following steps:
2. Based on this data, calculate and record a baseline figure for as many indicators as possible
3. Make a plan to gather any additional data needed to complete calculations that is not available from previous sector research. (It is usually necessary to gather data on a sample of char households who will get the new or better service, input or relationship so that these same households can be interviewed again after they are expected to have benefited from the service, input or relationship.)
4. Determine the sample size and locations for the baseline data collection. M4C may calculate the sample size using the sample calculator of the following link -
MRM Manual, M4C, July 2013 29
www.raosoft.com/samplesize.html. As a general rule, M4C will assume 50% response distribution and choose a sample with 10% margin of error and 90% confidence interval. (for example, if intervention has the potential to reach 5000 HHs, M4C will take baseline of 67 HHs) However, if the first year’s results in a sector show that impact is likely to be a large part of the portfolio, an additional baseline may be conducted on new households to increase rigor of the study.
5. Gather the relevant data e.g. though surveys, interviews, etc.
6. Process the data and calculate the status of the remaining indicators
7. Make a record of the status of all the indicators at the baseline
8. Check the baseline figures on subsequent monitoring visits.
On top of the data on the indicators M4C sub-contractors (local NGOs), who are facilitating organization of producer groups, also need to establish baseline for the group members in terms of their poverty status, livelihood options and status of market integration before the intervention starts. A template for collecting those data can be found in the Annex.
5.2 Making Projection in Results Chains
Establishing a Retrospective Baseline If a baseline was not established at the time of intervention design, M4C will try to collect baseline information retrospectively by using recall data. Individuals will be asked for recollection of the situation before the intervention and what would have happened if there had been no intervention. However, information that depends on recall over an extended period can be unreliable: “this is especially true for measuring change in areas where recall is weak, or if attitudes, opinions and behaviors are likely to change over time. For example, recall data on income, regular expenditures are not very reliable, especially when using a long reference period.” However information on behavior can sometimes be recollected through recall data. Also in the case of partners and service providers, M4C might be able to collect baseline retrospectively by looking at their written records (e.g. seed sales for retailers, number of participants in groups/associations, etc.).
M4C makes projections for outputs, outcomes and impacts when it draws up the results chains. These projections are put in the results chains with dates indicating when the impacts are expected to be achieved. Each box contains the expected date when change can reasonably be expected to have been achieved. Projections at the impact level for additional income generated is made for additional income accumulated for two year after the completion of project activities.
Each projection is based on well thought out assumptions and findings from the Sector Strategy report, field observations or other credible sources. The assumptions and findings supporting each projection, as well as any calculations made, are included in a comment to each box in the results chain, with information on an additional page if necessary. All projectionsmust be supported by relevant findings and/or clear and credible assumptions.

MRM Manual, M4C, July 2013 30
The table below which is taken from DCED Standard Implementation guidelines shows common sources of Information to use when making projections.
5.3 Measuring Changes in Indicators Change is measured at each level of the results chain based on the designated indicators. Indicators are measured at different times over an intervention’s monitoring span which is specified according to the Monitoring plan. Changes at service providers’ level are usually measured (mainly qualitative aspects such as mind set, knowledge, attitude, behavior etc.)immediately after the end of activities. However, quantitative aspects such as outreach and business expansion of the service providers will be measured after the completion of one business cycle (usually one year). Most impact data for char households is usually measured at the end of the first business cycle once impact at the household level can be expected. Often, impact will be measured again after the second or third production cycle to validate initial impact and include copying households if present and possible. The monitoring plan stores the month and year of data collection and indicates who will be involved in the data collection.
For every intervention, sampling and assessment methodologies will be developed in-house by M4C and data-collection will be done either in-house or in some cases by out-sourced organization.
- M4C will go back to the same service providers and households who were interviewed for the baseline in order to collect impact data.
Impact Assessment
In case of impact assessment the following methodology will be followed:
- Sample sizes for impact assessment will be generally decided on by the intervention
Commonly Used Sources of Information when Making Projections The following are commonly used sources of information. Other sources are also acceptable.
Staff experience and professional opinion: Observations in the field Informal information from key informants, market players or partners Staff’s educated guesses, estimates or judgments
Credible secondary sources: Government data Academic data Studies done by other donors or organizations Credible information from associations Credible and formal information from key informants Benchmarks from other similar areas
Programme information gathering: Market studies and Inception Reports Productivity studies General market surveys or other surveys done for other markets Special studies done by the programme Case Studies done by the programme

MRM Manual, M4C, July 2013 31
teams in consultation with the MRM team. M4C may calculate the sample size using the sample calculator of the following link - www.raosoft.com/samplesize.html. As a general rule, M4C will assume 50% response distribution and choose a sample with 10% margin of error and 90% confidence interval. (for example, if intervention has the potential to reach 5000 HHs, M4C will take baseline of 67 HHs) However, if the first year’s results in a sector show that impact is likely to be a large part of the portfolio, an additional baseline may be conducted on new households to increase rigor of the study. The team will then decide on the sampling locations, and sampling strategy. This covers the issues of: which areas will be visited for data collection, how many respondents there are, who the respondents are, how they will be chosen and contacted. It is a requirement of the DCED Standard that the decisions on sampling are documented including the reasons for the sample that describe why the sample is reasonably representative of the overall population it is taken from. For example, if char households who have received better inputs are being sample, it must be explained why the sample chosen is representative of all char households who have received better inputs.
- The team will then come up with a clear list of all the information to be gathered, this may be done in form of a checklist, which is then translated into a questionnaire. The guide to what questions to ask and what indicators to check can be got from the measurement plan. These questions are designed to assess impact, signs of sustainability, copying and crowding in, and attribution to the project’s activities.
- Data collection is done by the team selected, which may include both monitoring staff and members of implementation team.
- The persons involved in the data collection record all information collected per respondent as individual interviews
- Collation including checking and cleaning the data for mistakes - Pre-analysis to summarize the results - The team together analyzes the data based on which the projections on the results
chains are updated and recorded as estimations.
The tools which will be used by M4C to collect results data include:
Tool Used for How/When Observation Observation is used to gather
qualitative information, quickly assess changes, collect preliminary information before other tools are used, and validate findings from other tools. It can be used to gather information for the relationship matrix.
May be in the normal course of work or may be planned as a separate activity; involves watching market players’ behavior. May also include informal discussions with market players. These will be documented through field visit reports, meeting minutes and as a potential case story form.
In-depth Interviews
In-depth interviews are used to gather qualitative information, explore processes of change, understand underlying reasons for changes, and explore attribution. It can be used to gather information
Sample size ranges from 30-40; respondents are purposely chosen with the aim of maximizing relevant information gathering. There is much probing which leads to
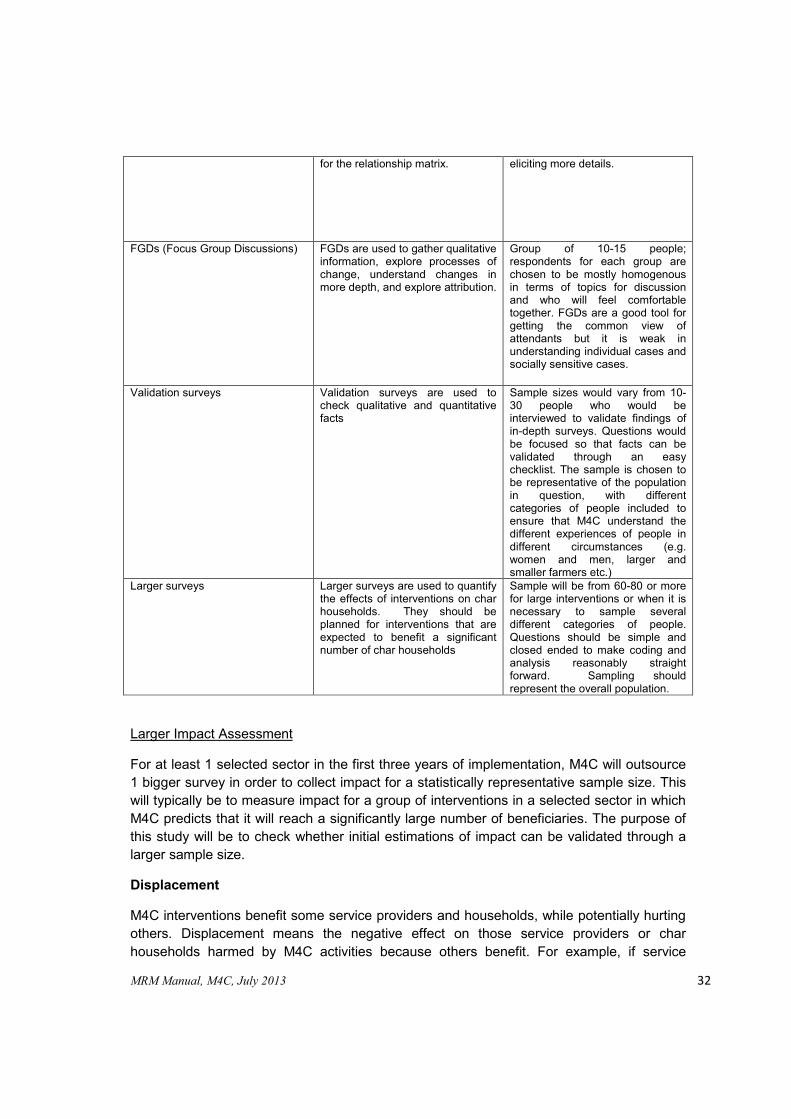
MRM Manual, M4C, July 2013 32
for the relationship matrix. eliciting more details.
FGDs (Focus Group Discussions)
FGDs are used to gather qualitative information, explore processes of change, understand changes in more depth, and explore attribution.
Group of 10-15 people; respondents for each group are chosen to be mostly homogenous in terms of topics for discussion and who will feel comfortable together. FGDs are a good tool for getting the common view of attendants but it is weak in understanding individual cases and socially sensitive cases.
Validation surveys Validation surveys are used to check qualitative and quantitative facts
Sample sizes would vary from 10-30 people who would be interviewed to validate findings of in-depth surveys. Questions would be focused so that facts can be validated through an easy checklist. The sample is chosen to be representative of the population in question, with different categories of people included to ensure that M4C understand the different experiences of people in different circumstances (e.g. women and men, larger and smaller farmers etc.)
Larger surveys Larger surveys are used to quantify the effects of interventions on char households. They should be planned for interventions that are expected to benefit a significant number of char households
Sample will be from 60-80 or more for large interventions or when it is necessary to sample several different categories of people. Questions should be simple and closed ended to make coding and analysis reasonably straight forward. Sampling should represent the overall population.
M4C interventions benefit some service providers and households, while potentially hurting others. Displacement means the negative effect on those service providers or char households harmed by M4C activities because others benefit. For example, if service
Larger Impact Assessment
For at least 1 selected sector in the first three years of implementation, M4C will outsource 1 bigger survey in order to collect impact for a statistically representative sample size. This will typically be to measure impact for a group of interventions in a selected sector in which M4C predicts that it will reach a significantly large number of beneficiaries. The purpose of this study will be to check whether initial estimations of impact can be validated through a larger sample size.
Displacement

MRM Manual, M4C, July 2013 33
providers benefiting from M4C interventions sell more inputs, other service providers may sell fewer inputs as a result. Or alternatively, if some char households sell more to certain buyers, other households (either on the chars or on the mainland) may sell less. So, in theory, it is necessary to determine whether displacement effects occur and estimate their size.
M4C takes displacement into account in the choice of sectors and services. M4C chooses to work in expanding markets (both for sectors and services), and therefore expects displacement to be minimal. In other words, demand is expected to be sufficient in M4C targeted markets that the markets can absorb expanded production and sales of project-assisted service providers and char households without significantly affecting the production and sales of other service providers, businesses and households.
M4C only takes displacement into account in MRM, when it is expected to be very significant. Specifically, displacement may be an issue if targeted markets become saturated or their growth slows. Consequently, M4C will monitor the growth of markets it targets. If growth slows or there are signs that the market is becoming saturated, M4C will gather qualitative information to assess the extent of displacement from interventions in that sector. M4C will then report on the qualitative findings from this investigation when reporting project impact. M4C will not estimate displacement quantitatively because assessing the extent of displacement quantitatively for interventions is technically complex, costly, and time consuming.
5.4 Defining and Measuring Attributable Change M4C aims to plausibly isolate the changes that result from its own activities from what would have happened anyway as a result of market forces or other factors in the environment. The foundations of assessing attribution are well-constructed results chains and measuring change at each level of those results chains. Well-constructed results chains help project staff to logically think through how project activities will lead, through various changes, to income changes for char households. By measuring change at each level of the results chain, M4C determines if and to what extent the expected change actually happened. If each change did happen as expected, the logical links up the results chain demonstrate that the changes are likely to have been caused, at least partly, by M4C activities. If each change did not happen as expected, then M4C does not attribute any changes at further levels of the results chain to activities because it is likely that those changes were a result of other factors. The diagram below distinguishes the change the M4C project causes as a result of its activities from what would have happened otherwise, the ‘counter-factual.’
MRM Manual, M4C, July 2013 34
It is important to note that in some cases when M4C implements more than one intervention aimed at the same target households, it might not be possible to isolate the exact amount of changes in competitiveness from each intervention. In such cases it would still be necessary to measure the behavior changes as results of the individual interventions separately and measure the combined effect on competitiveness. A reasonable written justification should also be provided explaining why impact on competitiveness has been measured jointly.
In order to measure attributable changes, M4C uses the following methodologies:
- Gathering information at all levels of results chain (ALWAYS): If change is happening at one level of results chain, but not the next, then the impact chain is broken. It is thus important for M4C to measure each level of chain in the results chain as otherwise it fails to establish the link with the next level and hence cannot attribute change due to its activities. For qualitative information M4C staff interviews service providers, char households and other market players about why changes happened and the factors that contributed to this change, including the possible role of the M4C activities.
- Using qualitative information to understand change processes (ALWAYS):M4C uses qualitative research to investigate the change processes happening in an intervention. This qualitative research helps project to tell the story of an intervention because the information gathered gives the reasons why each change happened and how they link to the previous box in the results chain. M4C always gathers this information sometimes mainly informally or together with other tools and sometimes in more depth through case studies.
For significant interventions, where it is likely that external factors are also producing change in the indicators, it is important to also include another method to understand the extent to which changes are due to M4C activities. The following provides a menu of methods that M4C will choose from in this case:
- Conducting quasi-experimental surveys (CASE BY CASE BASIS): In certain cases specified below, M4C compares an affected group with a control group Quasi-experimental methods allow for the comparison of changes between a group of enterprises that were affected by M4C activities and a group that were not. Significant differences in how these two groups change represent the impact resulting from M4C activities. Quasi-experimental methods are used for only one year (baseline to early signs of impact) because after that many control producers may benefit from project’s activity. In the second year, the impact measured in year one is validated through before and after measurement and qualitative information gathered.
- Control for external factors (CASE BY CASE BASIS): If possible, M4C can hold constant other factors that may be affecting a particular change when looking at before and after data. For example, if the other factors that may be affecting the handicraft sector are the prices of inputs, then M4C can hold the prices constant when analyzing

MRM Manual, M4C, July 2013 35
before and after data. This method does not work for agricultural sectors because weather will always be a big factor in char households’ yields and it is not possible to hold weather conditions constant in calculations.
- Comparison with secondary data (CASE BY CASE BASIS): If possible, M4C can compare the results from the participant group with secondary data on another or larger group. This is only possible when data from the chars is available, as data from other areas is likely too different from the chars to be useful.
- Trend analysis (CASE BY CASE BASIS): If M4C is able to gather some data on how the situation has been changing over a few years previous to the intervention, the team can estimate what the counterfactual would have been if this type of change continued. It is not likely that quantitative data on the chars will be available for this. But qualitative data on changes in sectors or behaviors on thechars may be possible to gather retrospectively. The following table describes the different methods used for M4C sectors Sector Method How and Why Maize Quasi-experimental surveys
(participants and control group)
Lot of external factors (e.g. weather, pest, prices) affects producer’s performance. Control group shows us would perform without project’s activities One control group for all interventions with a sample size of normally half of the benefiting producers.
Chilli Jute Onion
Mustard Quasi-experimental surveys (participants and control group) for current farmers Before and after with qualitative information gathering for new farmers
Same as above for current farmers For new farmers, without the project no income existed from this crop. So, all income from this crop is attributable to the project. The qualitative information is to validate they would not start the crop without project activities. Ask producers why they started the crop and how they get to know about it?
Ground Nut
Handicraft Before and after with qualitative information gathering for new farmers
Handicraft is a new activity for the char producers. So, without the project no income existed from this activity and it is not displacing any other economic activity. So, all income from this activity is attributable to the project. The qualitative information is to validate they would not start it without project activities and it is not displacing any other economic activity. Ask producers why they started the activity and how they get to know about it? Have they stopped any other activity because of it?
Finance (money transfer, savings)
Comparison with other methods for transacting money or savings
Project promoted financial services are new to the chars replacing traditional ways of transferring money and savings. We compare the cost and interest of the old way with the new way. The difference is increase in income/decrease in cost which is attributable to
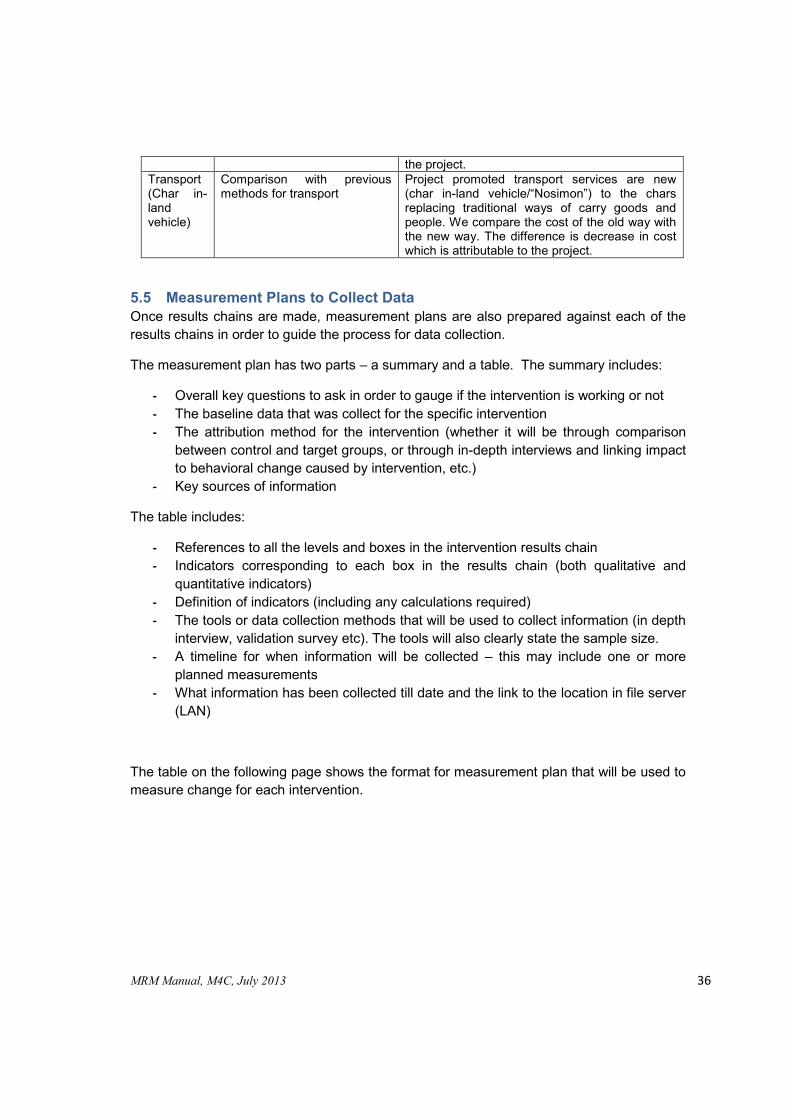
MRM Manual, M4C, July 2013 36
the project. Transport (Char in-land vehicle)
Comparison with previous methods for transport
Project promoted transport services are new (char in-land vehicle/“Nosimon”) to the chars replacing traditional ways of carry goods and people. We compare the cost of the old way with the new way. The difference is decrease in cost which is attributable to the project.
5.5 Measurement Plans to Collect Data Once results chains are made, measurement plans are also prepared against each of the results chains in order to guide the process for data collection.
The measurement plan has two parts – a summary and a table. The summary includes:
- Overall key questions to ask in order to gauge if the intervention is working or not - The baseline data that was collect for the specific intervention - The attribution method for the intervention (whether it will be through comparison
between control and target groups, or through in-depth interviews and linking impact to behavioral change caused by intervention, etc.)
- Key sources of information
The table includes:
- References to all the levels and boxes in the intervention results chain - Indicators corresponding to each box in the results chain (both qualitative and
quantitative indicators) - Definition of indicators (including any calculations required) - The tools or data collection methods that will be used to collect information (in depth
interview, validation survey etc). The tools will also clearly state the sample size. - A timeline for when information will be collected – this may include one or more
planned measurements - What information has been collected till date and the link to the location in file server
(LAN)
The table on the following page shows the format for measurement plan that will be used to measure change for each intervention.
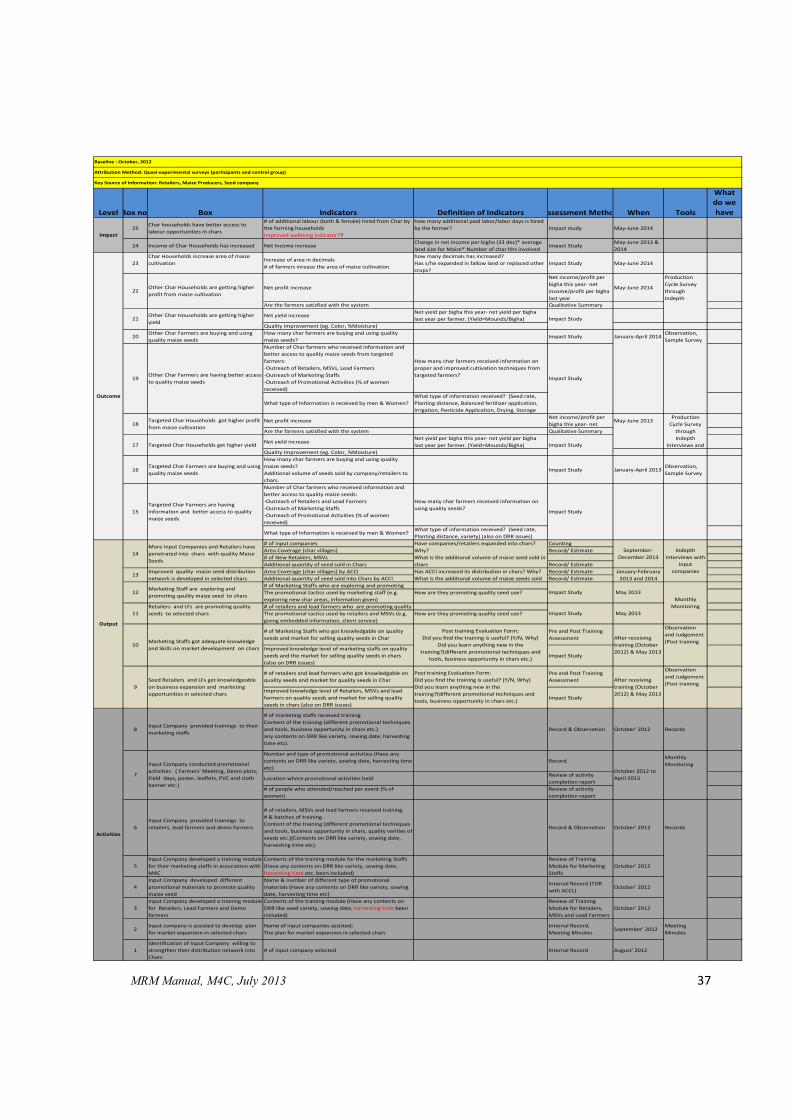
MRM Manual, M4C, July 2013 37
Level Box no Box Indicators Definition of indicators ssessment Metho When Tools
What
do we
have
25Char households have better access to labour opportunities in chars
# of additional labour (both & female) hired from Char by the farming householdsImproved welbeing indicator??
how many additional paid labor/labor days is hired by the farmer? Impact study May-June 2014
24 Income of Char Households has increased Net Income increaseChange in net income per bigha (33 dec)* average land size for Maize* Number of char hhs involved
Impact StudyMay-June 2013 & 2014
23Char Households increase area of maize cultivation
Increase of area in decimals# of farmers inrease the area of maize cultivation
how many decimals has increased?Has s/he expanded in fallow land or replaced other crops?
Impact Study May-June 2014
Net profit increase
Net income/profit per bigha this year- net income/profit per bigha last year
May-June 2014
Production Cycle Survey through Indepth
Are the farmers satisfied with the system Qualitative Summary
Net yield increaseNet yield per bigha this year- net yield per bigha last year per farmer. (Yield=Mounds/Bigha)
Quality Improvement (eg. Color, %Moisture)
20Other Char Farmers are buying and using quality maize seeds
How many char farmers are buying and using quality maize seeds?
Impact Study January-April 2014Observation, Sample Survey
Number of Char farmers who received information and better access to quality maize seeds from targeted farmers: -Outreach of Retailers, MSVs, Lead Farmers-Outreach of Marketing Staffs-Outreach of Promotional Activities (% of women received)
How many char farmers received information on proper and improved cultivation techniques from targeted farmers?
What type of Information is received by men & Women? What type of information received? (Seed rate, Planting distance, Balanced fertilizer application, Irrigation, Pesticide Application, Drying, Storage
Net profit increaseNet income/profit per bigha this year- net
May-June 2013
Are the farmers satisfied with the system Qualitative Summary
Net yield increaseNet yield per bigha this year- net yield per bigha last year per farmer. (Yield=Mounds/Bigha)
Quality Improvement (eg. Color, %Moisture)
16Targeted Char Farmers are buying and using quality maize seeds
How many char farmers are buying and using quality maize seeds?Additional volume of seeds sold by company/retailers to chars.
Impact Study January-April 2013Observation, Sample Survey
Number of Char farmers who received information and better access to quality maize seeds: -Outreach of Retailers and Lead Farmers-Outreach of Marketing Staffs-Outreach of Promotional Activities (% of women received)
How many char farmers received information on using quality seeds?
What type of Information is received by men & Women? What type of information received? (Seed rate, Planting distance, variety) (also on DRR issues)
# of input companies CountingArea Coverage (char villages) Record/ Estimate# of New Retailers, MSVsAdditional quantity of seed sold in Chars Record/ EstimateArea Coverage (char villages) by ACCI Record/ EstimateAdditional quantity of seed sold into Chars by ACCI Record/ Estimate# of Marketing Staffs who are exploring and promoting The promotional tactics used by marketing staff (e.g. exploring new char areas, information given)
How are they promoting quality seed use?
# of retailers and lead farmers who are promoting quality The promotional tactics used by retailers and MSVs (e.g. giving embedded information, client service)
How are they promoting quality seed use?
# of Marketing Staffs who got knowledgable on quality seeds and market for selling quality seeds in Char
Pre and Post Training Assessment
Observation and Judgement (Post training
Improved knowledge level of marketing staffs on quality seeds and the market for selling quality seeds in chars (also on DRR issues)
Impact Study
# of retailers and lead farmers who got knowledgable on quality seeds and market for quality seeds in Char
Pre and Post Training Assessment
Observation and Judgement (Post training
Improved knowledge level of Retailers, MSVs and lead farmers on quality seeds and market for selling quality seeds in chars (also on DRR issues)
Impact Study
8Input Company provided trainings to their marketing staffs
# of marketing staffs received trainingContent of the training (different promotional techniques and tools, business opportunity in chars etc.)any contents on DRR like variety, sowing date, harvesting time etc).
Record & Observetion October' 2012 Records
Number and type of promotional activities (Have any contents on DRR like variety, sowing date, harvesting time etc)
RecordMonthly Monitoring
Location where promotional activities heldReview of activity completion report
# of people who attended/reached per event (% of women)
Review of activity completion report
6Input Company provided trainings to retailers, lead farmers and demo farmers
# of retailers, MSVs and lead farmers received training.# & batches of training.Content of the training (different promotional techniques and tools, business opportunity in chars, quality varities of seeds etc.)(Contents on DRR like variety, sowing date, harvesting time etc).
Record & Observetion October' 2012 Records
5Input Company developed a training module for their marketing staffs in association with M4C
Contents of the training module for the marketing Staffs (Have any contents on DRR like variety, sowing date, harvesting time etc. been included)
Review of Training Module for Marketing Staffs
October' 2012
4Input Company developed different promotional materials to promote quality maize seed
Name & number of different type of promotional materials (Have any contents on DRR like variety, sowing date, harvesting time etc)
Internal Record (TOR with ACCL)
October' 2012
3Input Company developed a training module for Retailers, Lead Farmers and Demo farmers
Contents of the training module (Have any contents on DRR like seed variety, sowing date, harvesting time been included)
Review of Training Module for Retailers, MSVs and Lead Farmers
October' 2012
2Input company is assisted to develop plan for market expansion in selected chars
Name of input companies assisted;The plan for market expansion in selected chars
Internal Record, Meeting Minutes
September' 2012Meeting Minutes
1Identification of Input Company willing to strengthen their distribution network into Chars
# of input company selected Internal Record August' 2012
Other Char Households are getting higher profit from maize cultivation
21 Impact Study
Monthly Monitoring
January-February 2013 and 2014
Indepth Interviews with
Input companies
Have companies/retailers expanded into chars? Why?What is the additional volume of maize seed sold in charsHas ACCI increased its distribution in chars? Why?What is the additional volume of maize seeds sold
Impact Study May 2013
Impact Study May 2013
September-December 2013
Production Cycle Survey
through Indepth
Interviews and
Output
14More Input Companies and Retailers have penetrated into chars with quality Maize Seeds
13 Improved quality maize seed distribution network is developed in selected chars
12Marketing Staff are exploring and promoting qaulity maize seed to chars
Attribution Method: Quasi-experimental surveys (participants and control group)
Key Source of Information: Retailers, Maize Producers, Seed company
October 2012 to April 2013
Post training Evaluation Form:Did you find the training is useful? (Y/N, Why)Did you learn anything new in the training?(different promotional techniques and tools, business opportunity in chars etc.)
After receiving training (October 2012) & May 2013
Post training Evaluation Form:Did you find the training is useful? (Y/N, Why)
Did you learn anything new in the training?(different promotional techniques and
tools, business opportunity in chars etc.)
9Seed Retailers and LFs get knowledgeable on business expansion and marketing opportunities in selected chars
After receiving training (October 2012) & May 2013
Activities
7
Input Company conducted promotional activities ( Farmers' Meeting, Demo plots, Field days, poster, leaflets, PVC and cloth banner etc.)
11Retailers and LFs are promoting quality seeds to selected chars
10Marketing Staffs got adequate knowledge and Skills on market development on chars
Baseline : October, 2012
Impact
Outcome
15Targeted Char Farmers are having information and better access to quality maize seeds
17 Targeted Char Households get higher yield
19Other Char Farmers are having better access to quality maize seeds
18Targeted Char Households got higher profit from maize cultivation
Other Char Households are getting higher yield
Impact Study
Impact Study
Impact Study
22

MRM Manual, M4C, July 2013 38
5.6 Cross-Sectors Sector and intervention results chains, indicators and measurement plans in cross-sectors, such as transport, are similar to those in productive sectors. The challenge with cross-sectors is that there is usually a greater diversity in how those services are used to benefit char households. Following are examples of how M4C will calculate the change for its current cross cutting sectors – • Transport – In transport sector M4C will primarily look into the average decrease in
transportation cost per household and calculate the total amount of reduced cost by multiplying with the outreach. Income increase as such will not be measured separately for transport as it will be captured with the M4C product sectors.
• Financial services - In finance sector M4C will capture average decrease in transaction costs for transfer and calculate the total amount of reduced cost by multiplying with the outreach and average transactions per year per person. If and when the financial service providers start providing interest on the savings, M4C will calculate the average interest gained by the reached households. Outreach and interest figures can be collected from the financial service provider/bank and from the users.
In the above sectors or new cross sectors, M4C will decide on assessment and attribution methods depending on the nature of the sector and interventions.
5.7 Enabling Environment The following steps will be followed in case of interventions that address enabling environment issues such as changes in policy, etc which usually are long-term:
• Results chains, indicators and measurement plans for enabling environment interventions are similar to those for other interventions.
• Whenever possible, the results of these interventions will be measured at all levels, including impact on char households, even if the time frames are longer.
• However, it is not always possible to assess results of enabling environment interventions at all levels, either because the timeframes for impact are too long or because an intervention may be necessary to create the opportunity for impact on char households but not actually cause it. In this case, the results chain is developed to go as far as possible up the levels of impact, and change is only measured up to this level.
• The results of these interventions will not be reported at the impact level but will be reported at other applicable levels.
• As enabling environment interventions often have long time frames, M4C includes more intermediate indicators than for other interventions so that progress can be tracked and adjustments to the intervention made in a timely manner.
5.8 Logistics and Quality Control M4C ensures that all data is gathered carefully and consistently, both when it is done in house and when it is outsourced. To this end, M4C consistently follows the practices below:

MRM Manual, M4C, July 2013 39
- Design questionnaires and other information gathering formats iteratively, ensuring that both MRM and operations staff field are confident that the necessary information will be gathered.
- Train all those who will be involved in data collection – this will be general training for M4C staff and specific training for interviewers of outsourced research
- Pre-test questionnaires to ensure they work effectively and revise as needed - Prepare coding and data collation formats in advance and test these with the pre-
test questionnaire responses to ensure they function well - Plan data gathering logistics in advance and review them with the team prior to
going to the field - Supervise data collection particularly when outsourced - Check all questionnaires to identify mistakes in data collection and either correct
them by going back to the respondent or take out that data point - Check collated data to identify and correct mistakes in data entry
5.9 Special Studies Some aspects of change cannot be measured only through project monitoring as described above. For these aspects of change, M4C will conduct special studies. The current plan for special studies is described below.
Gender study:
• Changes related to increases in income
Once a year (in September). The objective is to monitor women’s economic empowerment due to M4C activities. It will be qualitative in nature with 30 samples covering women farmer, unpaid labor, paid labor and women who have attended M4C activities. The study will broadly look into –
• Changes related to women’s and men’s roles • Changes related to women’s decision-making • Changes related to access to opportunities
Labor study:
1. Changes in the vulnerability of char households are a result of income increases
Starting in 2014 M4C will conduct a qualitative labor study on vulnerability and well being. It is likely to be combined with the gender study to minimize resource.
In addition to that as per logframe, M4C will conduct special studies in the last year of the project on
2. Women’s economic empowerment 3. Labor well being
It is likely that these will be outsourced and/or expertise will be brought in to assist M4C with the studies. Other special studies may be added if and when required.
5.10 Indirect Impact on Mainland Service Provider and Enterprises Since M4C will be working with partners/service providers who also work in mainland, it is likely that mainland producing households will also be impacted from M4C activities.

MRM Manual, M4C, July 2013 40
However, expected results on the mainland will not be included in results chains or projections. M4C will identify specific interventions in case of substantial impact on mainland producing households and report on it through the intervention report. In order to estimate impacts, M4C will get outreach figures from the supported providers and estimate net additional income for mainland households using secondary sources or data from the chars. M4C will calculate it annually.

MRM Manual, M4C, July 2013 41
6 Analyzing and Using Information M4C analyzes the information coming in from the field to help make decisions at three levels: interventions, sectors and the overall project portfolio. The challenges in M4C is that information comes in at different times and in different forms, such as observations of staff, field reports of co-facilitators, summaries of in-depth interviews, case studies of char households and reports on surveys. Often, some of the information will be contradictory and practically, it can never be completely comprehensive. In this context, M4C staff and managers make sense of the information using particular principles and processes, so that they can use the information to help make decisions.
6.1 Principles for Analyzing Information Analysis for decision-making: The most important principle is that M4C gathers information to help make particular decisions. Data is analyzed in such a way to help make those decisions, not to make long reports. So, data analysis focuses on a limited number of specific questions that will help make particular decisions.
Honest inquiry: M4C promotes an organizational culture that encourages honest reflection on results. It is human nature for staff to want the interventions they are involved in to succeed. Therefore, the challenge for M4C is that staff will naturally look for the positive aspects of incoming information. In order to achieve a balanced analysis leading to accurate conclusions and credible reporting, M4C ensures that:
• open reflection is encouraged and consistently rewarded, • quantitative and qualitative analysis processes are consistently followed, • the process of analysis is done jointly among the operations officers responsible for
an intervention or sector and those not directly involved in specific interventions including MRM staff, managers and, if appropriate, peer operations officers,
• constructive questions, challenging and skepticism in analysis meetings are encouraged, and
• failure of interventions is accepted and followed by analysis and decisions on how to adjust an intervention or sector portfolio to improve results.
Averages and distribution of information: When looking at data on a sample of service providers or char households, a sector team calculates or estimates the average across the sample. The average is used for the calculation of estimated results. However, the team also examines the data to see if there is a norm – in other words if many of the service provider or char households have similar data - or if the data is very spread out – in other words if the service providers or char households in the sample vary a lot. If the data varies a lot, M4C looks for the reasons why. This helps the team determine, for example, if one similar service will be appropriate in all circumstances of if a service needs to be tailored to different circumstances (e.g. geographical, type of soil, type of service provider, type of char, type of household etc.)
MRM Manual, M4C, July 2013 42
Triangulation: Data from a single source or single method can be unreliable. Before drawing conclusions from data, M4C teams compare data on the same issues from several sources and/or methods, to the extent practical. For example, M4C looks at data from both service providers and char households on the amount, quality and characteristics of each service. When trying to understand how char households use and benefit from services, M4C will look at information gathered in different ways, for example observations of staff on household behavior changes, in-depth case studies on a few households and how they have received services, used them and benefited from them, and a survey which quantifies changes in getting services, behavior change and performance change. Triangulation helps M4C draw more accurate conclusions from information that would be possible relying only on a single source or method.
Qualitative and Quantitative Information: M4C uses both qualitative and quantitative information to draw conclusions because, in the complex environments in which M4C works, both types of information are needed to understand project impact. Neither qualitative nor quantitative information is used more, but rather M4C uses both together to draw conclusions as much as possible. For example, when trying to understand the extent to which the performance of char household farms is changing as a result of using a particular service, M4C might look at the results of a small quasi-experimental survey that estimates, quantitatively, the change in households’ performance as a result of the service alongside qualitative information on what households say about changes in performance and why they have happened.
Relationship Matrix (RM): Relationship matrix is used to monitor relationships among the actors. M4C is using this tool to monitor attitude and behavioral changes between char producers and other market actors. In all agricultural sectors M4C is currently working in (Maize, Chilli and Jute) have one intervention area called “Supporting formation of producer groups and/or service points on the chars”. The core objective of this intervention area is to organize char producers, increase interaction, bargaining power, relationship and trust between producers and other market actors. RM tool helps M4C to monitor changes of the above mention indicators. After setting a baseline and a target, relationships will be monitored and measured in a regular interval. From each upazilla one relationship matrix will be developed for monitoring. Sub-contractors will take the lead to collect information from the field with the help of outsourced firms if necessary.
Gender: Women and men generally have different roles in the various sectors M4C targets. For example in the handicraft sector, usually women produce the products but men purchase the inputs based on requests from the women producers. In another example, in maize, usually men plow, men and women sow and weed, and mostly women harvest and shell. Decision making about what to produce and how is sometimes done principally by men, sometimes by women and sometimes jointly. When analyzing MRM information, the M4C team aims to understand how the services they promote interact with this complex environment of roles and decision-making. The analysis focused primarily on two questions:

MRM Manual, M4C, July 2013 43
• Are the services as effective as possible with respect to gender roles and decision making? This is analyzed by examining if the services that are offered and, especially the way in which services are offered, effectively promotes behavior changes in char households that will result in improvements in households’ performance. For example, if information is provided through input suppliers who primarily interact with men, but the information is primarily used by women, the M4C team will examine issues like: 1) Is the information given in such a way that it is easy for the men to transmit to the women? Would there be a way for the information to reach the women more directly? Will it be easy for the women to use the information effectively? This analysis will help M4C work with providers to ensure that the services are as effective as possible in promoting specific behavior changes among char women and men.
• What effects are promoted services and the way they are offered, changes in household behavior and performance and changes in net income having on the roles, decision-making and relationships among women and men in char households? This is analyzed to contribute to the M4C team’s decisions on how to promote women’s economic empowerment. The analysis focuses primarily on 1) Are project activities having any negative effects on the roles, decision-making and relationships of women and men in char households? 2) Are there particular opportunities to promote women’s economic empowerment within the sectors M4C targets by adjusting or adding interventions?
DRR: DRR components are built within M4C interventions. M4C will analyze DRR related information by taking into account of the disasters that occurred during that period. In each disaster, M4C will monitor if the precautions or remedies that are promoted through the interventions have worked or not. M4C will analyze if the coping mechanism for the producers, traders or any other market actors are similar to the assessment findings.
6.2 Process of Analysis When M4C analyzes information both for decision-making and reporting, the focus is on the five key questions used to develop indicators:
Are expected changes happening? For example, if a box in the results chain says that char farmers are expected to plant maize earlier in the season, are char farmers’planting maize earlier than they were before the intervention?
How much is the change?(Extent of change) For example, if it is expected that char farmers will lower their input costs, how much lower are input costs in the season after the intervention as compared to the season before the intervention?
For how many people is it changing? (Scale of change) For example, if it is expected that char handicraft makers will get more advice on production, how many char handicraft makers are getting more advice?

MRM Manual, M4C, July 2013 44
How much of the change is due to M4C activities? (Attribution) For example, if it is expected that char farmers will improve their yields, how much of the yield increase is due to M4C activities (as opposed to other factors like weather changes)?
Is the change likely to last? (Sustainability) For example, if it is expected that large traders will provide information on chilli drying and grading , are the traders likely to continue (and expand) giving that information to chili producers year after year? Signs that is likely to continue are that chilli trader is happy with the quality of dry chilli, sell more to the processing companies, get better price.
Is there any sign of systemic changes? (Crowding-in, Copying) For example, are market actors considering char a viable market for inputs and source of products? Are service providers continuing to adapt business model for chars? Are lead farms deploy more agents/employees to the chars? Are other lead firms and service providers replicating business models of the M4C partners? Are other producers copying improved practices from the directly affected producers?
M4C answers these questions through the following process:
Report from info gathering: When information is gathered, it is documented in a short report. For example, operations officers will prepare a short field report on their observations during a field visit. If in-depth interviews with service providers or char households are conducted, a report is written that details the information collected.
Pre-analysis: Often, information must be summarized in a convenient form in order to analyze it and draw conclusions. For example, if 5 in-depth interviews are conducted, the staff member in charge of the interviews will not only document the information gathered from each interview, but will also summarize the answers to the key questions across all the interviews. If a survey is conducted, the staff member in charge of the survey (together with an outsourced contractor if appropriate) will summarize the results of the survey including averages of data, distribution of data and other significant findings from the survey. Reports will be focused on key questions and reasonably brief in order to make the information accessible to other staff.
Joint analysis: Summaries of information gathered will be discussed in meetings within sector teams and including MRM staff and/or managers as appropriate. While this will happen frequently, it will also happen consistently and formally every six months. Before this type of meeting, all staff who will be at the meeting will read any relevant summary or report. At the meeting, the staff member in charge of gathering the information will summarize the findings of the information gathering. The meeting may include several summarizes. For example, an operations officer might summarize his/her observations from a recent field visit and an MRM officer might summarize the findings from a recent survey. The information will be discussed with the aim of answering key questions to help make relevant decisions. The discussion will aim to make sense of the information in a balanced way.
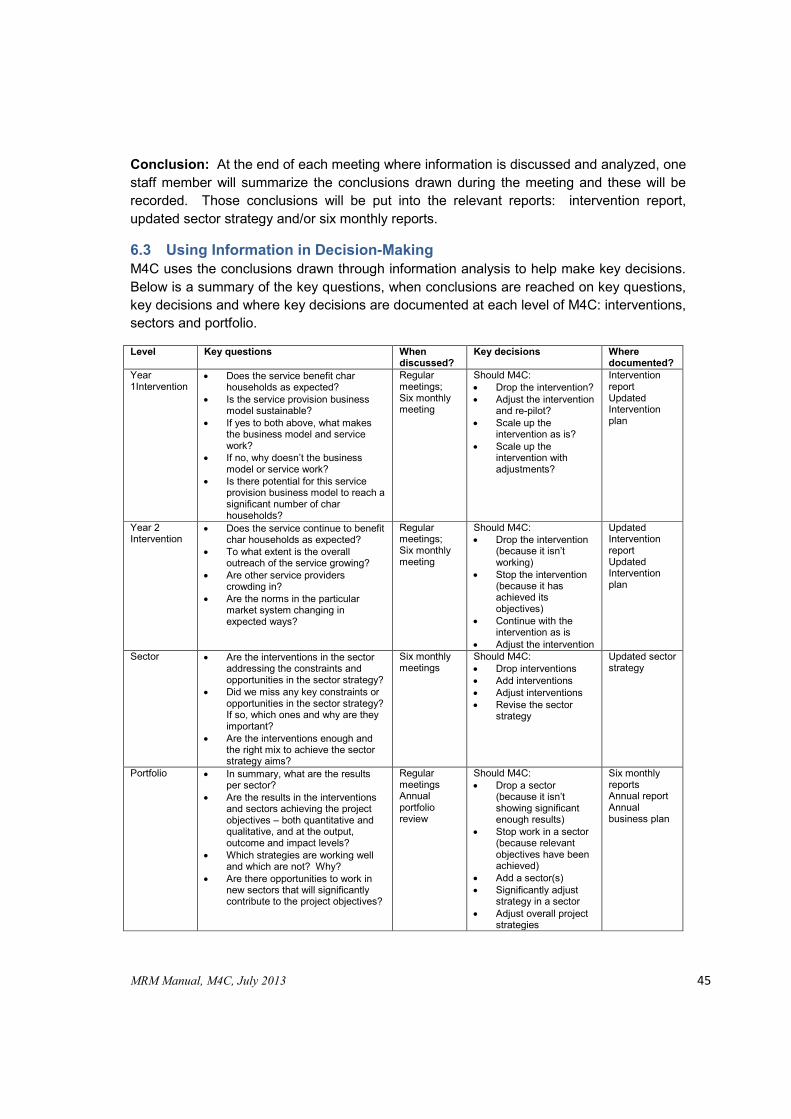
MRM Manual, M4C, July 2013 45
Conclusion: At the end of each meeting where information is discussed and analyzed, one staff member will summarize the conclusions drawn during the meeting and these will be recorded. Those conclusions will be put into the relevant reports: intervention report, updated sector strategy and/or six monthly reports.
6.3 Using Information in Decision-Making M4C uses the conclusions drawn through information analysis to help make key decisions. Below is a summary of the key questions, when conclusions are reached on key questions, key decisions and where key decisions are documented at each level of M4C: interventions, sectors and portfolio.
Level Key questions When discussed?
Key decisions Where documented?
Year 1Intervention
• Does the service benefit char households as expected?
• Is the service provision business model sustainable?
• If yes to both above, what makes the business model and service work?
• If no, why doesn’t the business model or service work?
• Is there potential for this service provision business model to reach a significant number of char households?
Regular meetings; Six monthly meeting
Should M4C: • Drop the intervention? • Adjust the intervention
and re-pilot? • Scale up the
intervention as is? • Scale up the
intervention with adjustments?
Intervention report Updated Intervention plan
Year 2 Intervention
• Does the service continue to benefit char households as expected?
• To what extent is the overall outreach of the service growing?
• Are other service providers crowding in?
• Are the norms in the particular market system changing in expected ways?
Regular meetings; Six monthly meeting
Should M4C: • Drop the intervention
(because it isn’t working)
• Stop the intervention (because it has achieved its objectives)
• Continue with the intervention as is
• Adjust the intervention
Updated Intervention report Updated Intervention plan
Sector • Are the interventions in the sector addressing the constraints and opportunities in the sector strategy?
• Did we miss any key constraints or opportunities in the sector strategy? If so, which ones and why are they important?
• Are the interventions enough and the right mix to achieve the sector strategy aims?
Six monthly meetings
Should M4C: • Drop interventions • Add interventions • Adjust interventions • Revise the sector
strategy
Updated sector strategy
Portfolio • In summary, what are the results per sector?
• Are the results in the interventions and sectors achieving the project objectives – both quantitative and qualitative, and at the output, outcome and impact levels?
• Which strategies are working well and which are not? Why?
• Are there opportunities to work in new sectors that will significantly contribute to the project objectives?
Regular meetings Annual portfolio review
Should M4C: • Drop a sector
(because it isn’t showing significant enough results)
• Stop work in a sector (because relevant objectives have been achieved)
• Add a sector(s) • Significantly adjust
strategy in a sector • Adjust overall project
strategies
Six monthly reports Annual report Annual business plan
MRM Manual, M4C, July 2013 46
7 Aggregating Impact M4C will aggregate quantitative projectionsand estimates of its impact in terms of new/better services or business models (number of services promoted, number of business modelstested, number of partners involved, number of services promoted which specifically target women), outreach (number of households receive services, number of households perform better, and number of households increase income), impacts among char households (aggregate increases in incomes, aggregate increase in labor hired) across all interventions. Aggregated figures for services delivery (number of services promoted, number of service providers involved, number of services promoted which specifically target women) and outreach (number of households receive services) will be calculated twice a year for six monthly reports and aggregated figures for business models (number of business models tested) outreach (number of households perform better, and number of households increase income) and impacts among char households (income generated, labor hired) will be calculated once a year for the annual reports.
The methods of aggregation are explained below:
• For aggregating income: Income figures for M4C interventions are calculated as additional income generated as a result of each individual intervention. Thus these figures can be added to give aggregate income generated for M4C work.
• For aggregating wage labor: Changes in wage labor for M4C interventions are calculated as additional labor days generated as a result of each individual intervention. Thus these figures can be added to give aggregate wage labor days generated from M4C work.
• For aggregating outreach: To aggregate outreach M4C will emphasis overlap at two levels – intervention level and sector level. In intervention level for those interventions without overlapping beneficiaries, outreach figures will simply be added up together to come to a total number of beneficiaries reached. However there will be cases where a number of interventions affect the same group of people. In such case the extent of overlap will be gauged as a percentage depending on factors such as overlapping service providers, geographical location etc. In sector level percentage of char producers who are involved in more than one sector will be calculated and will be discounted. For example, from initial baseline it was found that there is a 24% overlap between maize and chilli farmers. While aggregating maize and chilli outreach, 24% will be reduced.
In addition to aggregating quantitative data, M4C will synthesize qualitative data for semester and annual reports. This synthesis will focus firstly on the qualitative indicators in the logframe but will also include other relevant qualitative information when appropriate. Information for the synthesis will come primarily from intervention reports and six-monthly meetings.

MRM Manual, M4C, July 2013 47
8 Tracking Costs M4C’s accounting system tracks costs across the project. These costs will be reported in annual reports alongside impacts in order to provide context to the results. Moreover, for keeping track of the progress of project activities, M4C will also track costs for each sector.
9 Reporting and Documentation There are a number of different reports and documents that are generated in M4C either for management purposes, for the purpose of keeping records, and for the purpose of communicating M4C’s work or methodologies to different audiences. The main reports and documents are as follows:
Internal • Sector strategy report • Intervention Concept note • Intervention plan • Intervention report • Monthly report and activity plan • Six monthly review report • Aggregation worksheet
External • Semester/six monthly report • Annual report • Annual business plan • Annual Gender Report
The diagram below illustrates an example of key MRM activities with reporting timelines.
Sector Strategy Report
July 2012
Intervention Concept Note
Sep 2012
Results Chain Development
Nov 2012
Intervention Plan
FinalizationDec 2012
Early Signs of Impact
AssessmentJul 2013
Draft Intervention
Report Aug2013
Final Impact Assessment
Jul 2014
Final Intervention
ReportAug 2014

MRM Manual, M4C, July 2013 48
Communications documents derived from MRM are:
• Case study • Website news
More communications products will be added when appropriate.
The following table presents the list and timing of different reports and review meetings of M4C.
The following table presents the details about different meetings such as brief agenda, timing, participants, outputs of these meetings etc.
Weekly Team Meeting
Monthly Team Meeting
Six-monthly Review Annual Planning
Agenda
Review last week Review last month activities
Review last 6 months Plan for next year
Plan for next week
Issues and challenges
Issues and Challenges
Opportunities Review against Business Plan/Sector Strategy
Plan for next month Plan for next semester Participants Bogra Operations
team Operations team Operations team; sub-
contractors M4C Management
Led by Manager-Operations
Director-Operations Manager- MRM GM
When Thursday Last Wednesday of every month
January; July February
Inputs to these meetings
Monthly report Quarterly reports; field observations; MRM data per intervention, intervention reports, updated intervention plans, sector strategy
Six monthly reports, Aggregated MRM data and updated projections, Updated sector strategies
1 2 3 4 1 2 3 4 1 2 3 4 1 2 3 4 1 2 3 4 1 2 3 4 1 2 3 4 1 2 3 4 1 2 3 4 1 2 3 4 1 2 3 4 1 2 3 4
REPORTS
Business Plan
Monthly Report
Semester Report
Annual ReportAnnual Gender Report
REVIEW MEETINGS
Monthly
Six-monthly
Annual
JuneDec Jan Feb Mar Apr MayJuly Aug Sept Oct Nov
MRM Manual, M4C, July 2013 49
Output of the meetings
Meeting Minutes Updated Monthly Report
Six monthly report; updated sector strategy updated intervention plans and reports
Business Plan
Outputs used for
Check progress at next meeting, keep records of decisions
Semester Report; Annual Report
Business Plan
9.1.1 Sector strategy report M4C initiates work in a particular sector by conducting a Sector Study. A sector encompasses a particular product or service market in which M4C will work. The study aims to help M4C understand how the market works (including gender roles), and determine how to improve competitiveness and pro-poor growth in that particular market. The Sector Study results in a Sector Strategy report which summarizes the opportunities and constraints within the particular sector.
Based on the findings of the Sector Study, M4C develops a sector strategy to direct the project to facilitate changes that are required to allow the private sector to take advantage of particular opportunities for pro-poor growth. These strategies help in the attainment of thelogframe goals of M4C project. These strategies include intervention areas, or groups of activities designed to address a particular constraint or opportunity.
The sector strategy will comprise of the following sections:
I. Rationale: An analysis of the sector status in the chars, the involvement of the poor and the reason for intervening in the sector.
II. Sector Profile: The geographical profile of the sector and role of different stakeholders in the sector.
III. Sector Analysis: Analysis of the sector in terms of opportunities and constraints, how and why the market is failing to address the needs of the poor. How women are involved in this sector and the disaster risks prevalent in the sector.
IV. M4C Strategy: The different intervention areas in which M4C will work and how they will address the opportunities and constraints. The individual interventions under each of the intervention areas.
9.1.2 Intervention Concept Note Intervention concept note is essential before implementing any intervention. When Operations team develops an intervention idea and in a process of selecting partners is the right time to develop the concept note. Each concept note will include –
• Draft Results Chain (handwritten) • Draft Business or Service delivery model • Bullet points for additional information if necessary
9.1.3 Intervention Plan An intervention plan is made against each intervention on the onset of intervention activities. This document is mainly prepared for internal purposes. It is usually recorded in excel worksheets.
MRM Manual, M4C, July 2013 50
• Cover page: This is one page long and is present at the beginning of the plan for each intervention. It includes:
What does it contain?
- Dates: Intervention starting date, expected activity closing date, expected monitoring closing date
- Intervention code - Updated summary information on the intervention impacts: This would include
outreach number and income generated for both direct and indirect beneficiaries. - Any impact data available on gender and vulnerability reduction, pertaining to an
intervention, should also be mentioned here - A section capturing the review dates and updates made to the document
• Background story: It briefly describes the story of the intervention, that is what is to be
done and why. It also includes information regarding intervention duration, intervention cost, name of intervention managers, strategic partners and implementation partners.
• Results Chain: The third page on the intervention plan contains the results chain that
shows how the intervention activities will lead to expected changes in different levels leading ultimately to goal level impact.
• Calculation Sheet: All calculations supporting the numbers shown in the results chains
are provided here with proper references to the boxes in the results chain. All sources supporting the data should be mentioned. For example, interviews (mentioning respondent with contact info), field studies (with dates), assessment reports, attendance sheets, training participation lists, registration sheets, meeting minutes, etc.
• Measurement plan: This sheet contains the measurement plan that has been made
against the results chain. The measurement plan is the planning tool for data collection and impact assessment. It is a table that contains details on which indicators to be measured, how it will be done, who will do it and when it will be done for each level of change.
• Information Sheet: The impact record sheet puts together all information that has been
collected to record impact to date. It contains information that has been collected from different sources, including both baseline and impact data collection. The impact record sheet will include data on sampling methodology and record findings of individual interviews. The purpose of this record sheet is to put together all information in one single document for easy access.
When is it written? Once a results chain is drafted, it is written. It may be written before or as an intervention is starting. It should be completed within a month of an intervention start date. The intervention start date is the date when the contract is signed with the partner organization in order to roll out the interventions. How often is it updated? The intervention plan is reviewed and updated on a six monthly basis, prior to each six monthly cycle. Update is needed while taking decision for scale up from pilot.

MRM Manual, M4C, July 2013 51
9.1.4 Intervention Report An intervention report is written to summarize what happened in an intervention, estimate the impact at all levels from the intervention and note lessons learned.
• Cover page What does it contain?
• The background of the intervention (may be copied form the IP background story: This is basically a summary of the intervention story, the logic behind doing it and how it aims to achieve pro-poor impact. - The rationale behind the intervention. What key objectives the intervention aims to
achieve? - What did the intervention actually do? (Give dates for events, how many people
participated and other relevant facts about the intervention.) - Who were the key service providers/ entry points? - What problem or constraints did this intervention try to address? How did it do so?
• Intervention story - What actually happened (copy from TOR with actual numbers)
• The impact story: This section explains what the impact of this intervention was.
- Were all the expected results of the intervention in different levels of the intervention results chain met? Updated RC
- comment on results for qualitative indicators, especially o B model sustainability + provider innovation, investment, expansion, attitude o Change in bus relationships o Changes in capacity of providers, others, hhs – dimension in Logframe o Changes related to DRR behaviors o Women’s involvement + benefits for women (eg efficiency, skills, decision
making etc) o Systemic change – copying, crowding in
- Learning: The section describes the learning from the intervention. What did the project team learn from the intervention? What does this mean for the sector strategy? How might the lessons be applied to other interventions in same chars or different chars?
- Next steps: Explain what the key next steps for the intervention are: is it going to be deepened, discontinued and/or scaled up? What is the scale up plan if there is any?
9.1.5 Monthly report
When is it written? It is drafted after the early signs of impact study, and finalized after the last impact study (generally 2 years after intervention).
In each month M4C prepares a monthly progress report describing both the quantitative and qualitative information. It reflects the activity plan prepared for the month, its progress, key issues and number of events occurred. The monthly report is presented by sectors and

MRM Manual, M4C, July 2013 52
partners within the sector. Operation team put quantitative information per district and accumulated figures are shown in the final report. In each month with the monthly report MRM team will update the Intervention Register.
9.1.6 Six monthly review report After every six monthly review meeting a report is generated to capture the discussions and decisions of the meeting. The contents of the 6MRM Report are to organized by the following sections:
1. Meeting Details: Provides the date of the meeting and the meeting participants. 2. Discussion Findings: Summary of sector wise presentations 3. New Ideas: List new intervention ideas that can be looked in to in the next 6 months
of implementation. 4. Lessons Learned: Summarizes the primary lessons learned from the past three
months. 5. Follow-Up Questions: Key questions for the next 6MRM and a description of the
plan to follow up on them.
9.1.7 Aggregation worksheet Aggregation worksheet is an impact projection and analysis tool for M4C. It contains incremental and cumulative outreach and income figures for each intervention of each sector. It also calculates the overlap of outreach between interventions and among sectors. This worksheet is updated in six months. Projections are made while developing results chain for a new intervention and it is reviewed after the completion of activities and further revised after the impact assessment. Aggregation worksheet is an internal reporting tool to keep updated about the M4C targets and progress.
9.1.8 Semester Report Semester /Six monthly reports are written every six months after having a six monthly review meeting among the M4C operations team and the co facilitators. The report is submitted to the donor semi-annually. The semester report’s emphasis is more on outputs and activities/interventions of the project. Major contents of the six monthly/semester report are the same as the quarterly reports. It gives information on progress status of the project for the last six months and tells where the project stands in comparison to the business plan target and objectives. Like the quarterly reports, this report contains sector and intervention wise information such as main results achieved and implementation performance of the project, description of achievements of output and outcome indicators measured against business plan objectives and targets and reflecting quantitative and qualitative dimensions of the achievement, information on direct, indirect, positive, negative and unintended effects of the interventions and plan for the next six months. The information from the Semester/Six Monthly Report is fed into the Annual report.
9.1.9 Annual Report The annual report provides information to donors on where the project implementation stands compared to the annual/business plan and the logframe. The main focus of the annual report is on outcomes of the project interventions. The overall reference frame for
MRM Manual, M4C, July 2013 53
the annual reports is the logframe. Major contents of the annual report include short description of the project and its strategy, main results achieved and implementation performance of the project in the last year, description of achievement of outcome indicators measured against business plan objectives and targets and reflecting quantitative and qualitative dimensions of the achievement, summary of achieved outputs based on a comparison with the planned outputs and its contribution to outcomes, implementation constraints and ways to overcome them, information on direct, indirect, positive, negative and unintended effects of the interventions, main steering implications for next period of interventions, any changes to main assumptions, finance and management information (amount and percentage of budget spent vs. planned for the period, comments on the significant budget deviations, cash flow forecast for the next 12 months, human resources management etc) and key lessons learnt.
9.1.10 Annual Gender Report In every March M4C will develop an annual gender report and submit to SDC gender platform. The content of the gender report will be the progress in line with GEM, new assessments and interventions completed, lessons learned, monitoring and results measurement and challenges faced.
9.1.11 Annual Business Plan The annual/business plan is submitted to the donor every year. The plan emphasizes outputs and activities and shows the causal link to the expected outcomes. Major contents of the plan are short description of the planned outcomes for the year on the basis of the logframe, short description of the planned outputs and activities of the year. It should also identify the changes against the previous plan and should explain why the changes are required. The plan must include an activity-based budget that is linked to the planned outputs. It also provides the detailed plan (timetable) of planned outputs and activities.

MRM Manual, M4C, July 2013 54
10 Tasks and Responsibilities
The entire team of M4C along with the co-facilitators is responsible to implement the MRM system of M4C. The specific tasks and responsibilities of M4C team (The General Manager, the MRM team and the Operations team) and its co-facilitators are described below. These responsibilities are included in job descriptions and assessed in staff performance reviews. For co-facilitators, they are included in contracts and reviews of contract performance.
GENERAL MANAGER The General Manager has overall responsibility for designing and implementation of the M4C MRM system. The specific responsibilities include the following.
• Contributes to and approves the final MRM system design • Ensures that the MRM system responds to the information needs of internal and
external stakeholders. • Ensures that MRM information is integrated into program planning, decision-making,
intervention design, and day-to-day operations. • Ensures discipline all MRM process • Promotes appropriate culture for honest enquiry and analysis • Reviews and approves different reports such as three month reports, six monthly
and annual reports • Reviews the MRM system periodically, together with the MRM team, to ensure it is
functioning effectively and to specify improvements needed. . OPERATIONS TEAM The operation team of M4C consists of the Director Operations, Manager Operations, Manager Capacity Development, Coordinator- Operations and operations officers including focal persons for gender and DRR. The specific responsibilities of the operations team include the following.
• Develop the intervention and sector results chains in association with the MRM team • Help MRM Team in developing and implementing the MRM plan • Update the Results chains on a regular basis with MRM team’s support. • Develop and implement the Intervention plan with MRM team • Draft, finalize and update the sector strategy and intervention reports on a regular
basis.
MRM TEAM The MRM team consists of MRM manager and MRM officers. The team has the primary responsibility to develop, implement and oversee of M4C MRM system. Specific responsibilities of the MRM team include the following:
• Assist the operation team in developing the results chains (M4C, Sectors and Intervention results chains)
• Assist operation team in developing and implementing intervention and MRM plan.
MRM Manual, M4C, July 2013 55
• Provides MRM training to the operation team and M4C co-facilitators. • Supports management, as necessary, in using MRM data for decision-making
related to specific interventions, sectors and the direction of the overall program portfolio.
• Maintains a project-wide MRM calendar and coordinates all MRM activities. • Carry out annual program-wide aggregation of impact projections and estimates. • Assist operations team on integration of MRM findings into planning and decision-
making. • Prepare the Six monthly and annual operation reports together with operations team
and general manager. • Reviews the MRM system periodically, together with the General Manager, to
ensure it is functioning effectively and to specify improvements needed. • Implement improvements to the MRM system as determined by periodic reviews.
List of Annexes (will be kept as separate files):
- Sector Results Chain - Intervention Results Chain - Concept note - Intervention Plan - Sample Intervention Report - Example six monthly review report - Case study - Subcontractor reports - Relationship Matrix - Log frame - Sample questionnaire / Study method for Impact Assessment - Checklist of issues: WEE, DRR, vulnerability, trust and relationships