Embed Size (px)
DESCRIPTION
Guide for monitoring and results measurement in private sector development projects that use M4P approach and i accordance with DCED standards
Citation preview
Monitoring and Results Measurement Manual
VEEDA Vranje and RDA Zlatibor
Version 1.3, March 2014

Contents
Abbreviations and Acronyms.........................................................................................................3
Executive Summary.......................................................................................................................4
Section One: Introduction..............................................................................................................7
1.1. Standards............................................................................................................................8
1.2. Purpose of MRM system.....................................................................................................8
Section Two: The Results Measurement System..........................................................................8
2.1. Sector Analysis...................................................................................................................9
2.2. Intervention design..............................................................................................................9
2.3. Monitoring and measurement of intervention results........................................................10
Section Three: Monitoring Documents........................................................................................11
3.1. Sector Strategy.................................................................................................................11
3.2. Intervention Guide.............................................................................................................11
3.3. Impact assessment report.................................................................................................17
Section Four: Methods, research practices and attribution.........................................................18
4.1. Definition of the PSD programmes’ target group..............................................................18
4.2. Impact indicators definition...............................................................................................18
4.3. Research practices...........................................................................................................20
4.4. Measurement and attribution methods – means of verification........................................21
4.5. Measuring indirect impact.................................................................................................24
Section Five: Reporting...............................................................................................................25
Section Six: Roles and Responsibilities......................................................................................25
Annex 1 – Gender and youth.......................................................................................................27
Annex 2 – Sustainability, systemic change and scale.................................................................28
Annex 3 – Tips on conducting good research.............................................................................30
Annex 4 – Business model example...........................................................................................31
2 | P a g e
Abbreviations and Acronyms
DCED Donor Committee for Enterprise Development
GoS Government of Serbia
GE Gender Equality
LED Local Economic Development
LSG Local Self-Government
MRM Monitoring and Results Measurement
M&E Monitoring and Evaluation
M4P Making Markets Work for the Poor
OECD-DAC Organisation for Economic Co-operation and Development-Development Assistance Committee
PSD Private Sector Development programmes implemented by VEEDA and RDA Zlatibor
SECO Swiss State Secretariat for Economic Affairs
SCO Swiss Cooperation Office in Serbia
SDC Swiss Development Cooperation
VEEDA Regional Economic and Entrepreneurship Development Agency Pcinja District
RDA Zlatibor Regional Development Agency Zlatibor
WEE Women’s Economic Empowerment
3 | P a g e
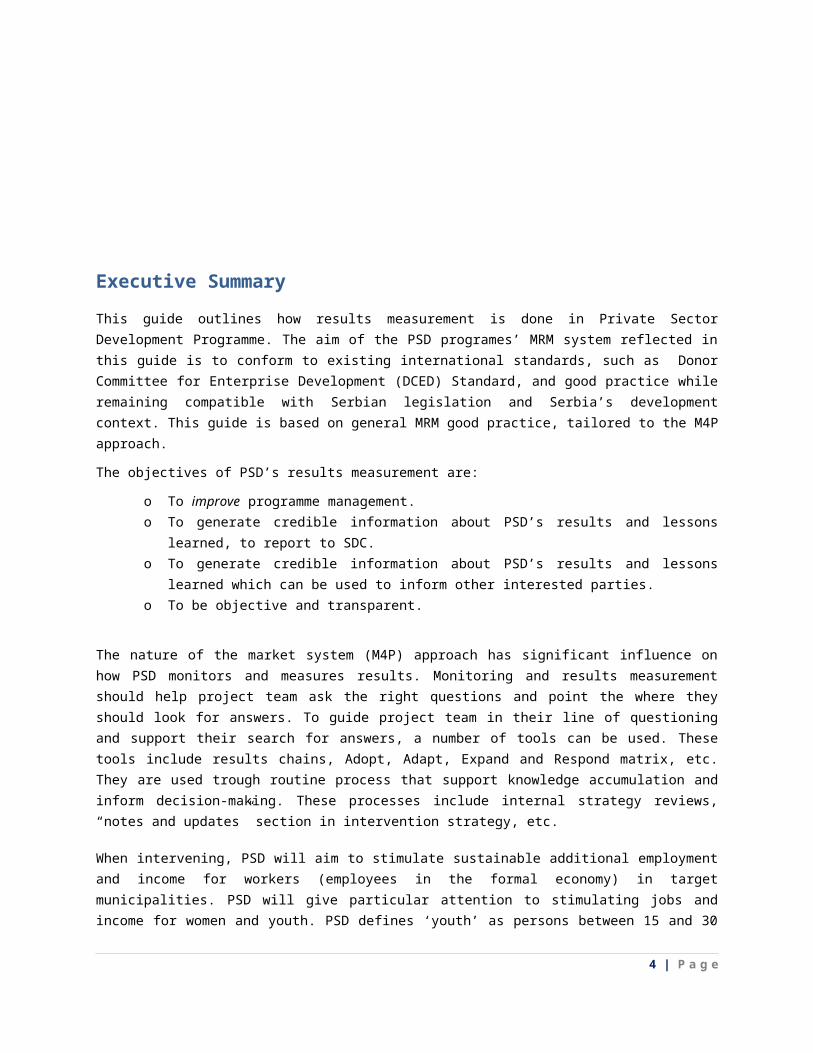
Executive Summary
This guide outlines how results measurement is done in Private Sector Development Programme. The aim of the PSD programes’ MRM system reflected in this guide is to conform to existing international standards, such as Donor Committee for Enterprise Development (DCED) Standard, and good practice while remaining compatible with Serbian legislation and Serbia’s development context. This guide is based on general MRM good practice, tailored to the M4P approach.
The objectives of PSD’s results measurement are:
o To improve programme management.
o To generate credible information about PSD’s results and lessons learned, to report to SDC.
o To generate credible information about PSD’s results and lessons learned which can be used
to inform other interested parties. o To be objective and transparent.
The nature of the market system (M4P) approach has significant influence on how PSD monitors and measures results. Monitoring and results measurement should help project team ask the right questions and point the where they should look for answers. To guide project team in their line of questioning and support their search for answers, a number of tools can be used. These tools include results chains, Adopt, Adapt, Expand and Respond matrix, etc. They are used trough routine process that support knowledge accumulation and inform decision-making. These processes include internal strategy reviews, “notes and updates” section in intervention strategy, etc.
When intervening, PSD will aim to stimulate sustainable additional employment and income for workers (employees in the formal economy) in target municipalities. PSD will give particular attention to stimulating jobs and income for women and youth. PSD defines ‘youth’ as persons between 15 and 30 years old. Among workers, PSD will focus on those earning less than RSD 34,000 (about CHF 370).
PSD will also stimulate additional income for enterprises in target municipalities. Among those enterprises, PSD will report as impact additional income generated only by micro, small and medium-sized enterprises (MSMEs). PSD will not partner with enterprises to raise their profits in ways which have little or no benefit for workers (e.g. replacing employees with machinery).
Serbian legislation affects how PSD define ‘additional employment’.
PSD do not count informal jobs in its baselines or its impact assessment. PSD will only count only formally employed women and men (with labour / employment contract).
In agricultural sectors the programme counts only those women and men who have registered their household (farm) and do business through a bank account (ie legal channels).
When reporting ‘additional jobs’ to SDC, PSD will report on how many full-time equivalent jobs the programme has created. PSD count as a full-time job in two ways, depending of the sector:
Industry/tourism full-time job definition: Employed person is a person who is employed in accordance with the labour legislation and as such is contributing to the mandatory social insurance. Here, a full-time job is defined as 240 working days per year.
4 | P a g e
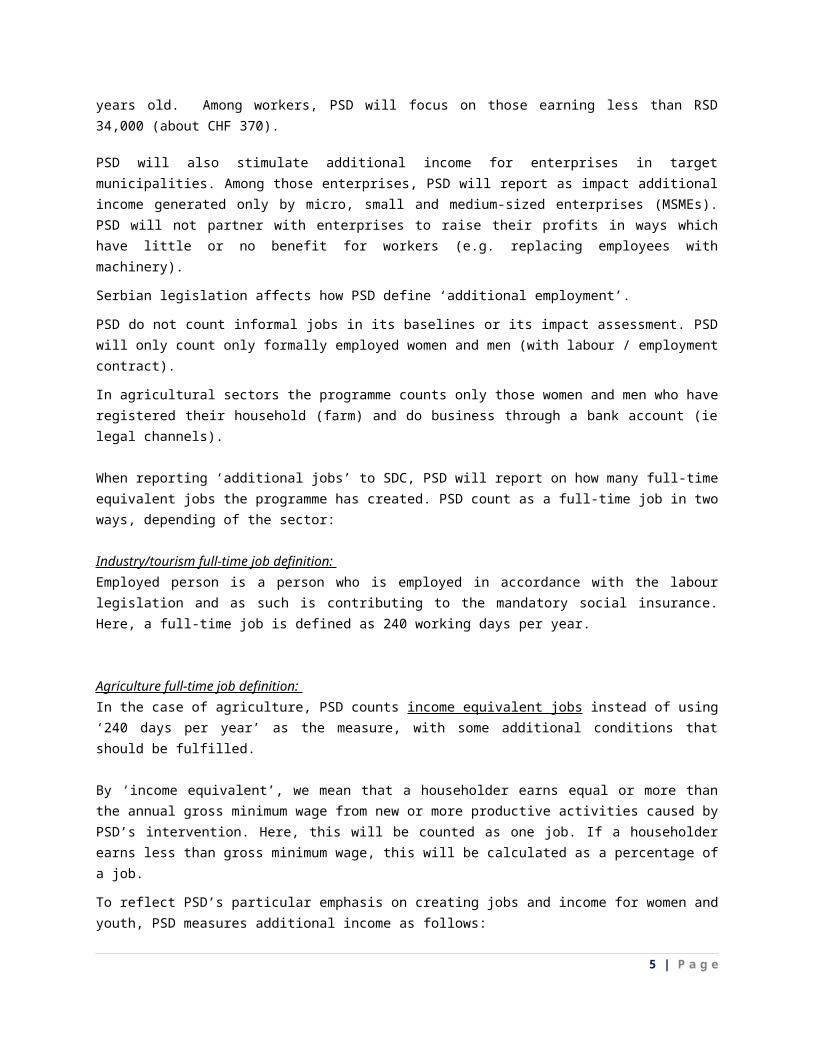
Agriculture full-time job definition: In the case of agriculture, PSD counts income equivalent jobs instead of using ‘240 days per year’ as the measure, with some additional conditions that should be fulfilled.
By ‘income equivalent’, we mean that a householder earns equal or more than the annual gross minimum wage from new or more productive activities caused by PSD’s intervention. Here, this will be counted as one job. If a householder earns less than gross minimum wage, this will be calculated as a percentage of a job.
To reflect PSD’s particular emphasis on creating jobs and income for women and youth, PSD measures additional income as follows:
- Total net additional income (CHF) for workers and enterprises.
- Within total net additional income, amount (CHF) generated by women.
- Within total net additional income, amount (CHF) generated by youth.
- Within total net additional income, amount (CHF) generated by workers and self-employed; amount generated by SMEs.
- Women and youth who generate additional income as workers would be included. So would women and youth who generate additional income as business owners.
- The number of jobs stimulated by the programme would also be disaggregated by gender, by youth, and by employees/ self-employed.
Attribution refers to extent of change that can be claimed by a project/intervention out of total change that takes place.
The methods which PSD uses to attribute changes to its interventions include:o Creating results chains, to logically articulate how activities will lead to impact.
o Reviewing these results chains regularly, to check that the results reported at each level can
logically explain changes at the level above. If they cannot, PSD will commission extra research to clarify attribution.
o Where applicable, measuring baselines.
o Where feasible, comparing beneficiaries with a control group of similar non-beneficiaries. When
doing this, PSD will take care to isolate the impact of differences between beneficiaries and non-beneficiaries in the control group. This means looking out for differences (e.g. in attitudes between people in treatment and control group) whilst testing surveys.
o Interviewing partners and beneficiaries to understand if the changes that they have made, which
appear to have resulted from PSD’s facilitation, would have occurred anyway. Asking “why” people change, in in-depth interviews, can provide information on sustainability too.
o For example, if PSD is promoting access to blueberry seedlings, PSD would ask new blueberry
farmers where they got their seedlings from. If there are other factors that contribute to the change, PSD will conduct research which attempts to isolate changes created by PSD’s intervention. E.g. partners will be asked how much they would have changed without PSD support. Where there is lots of uncertainty about what would have happened without PSD’s
5 | P a g e
intervention, PSD will instead estimate how much its contribution influenced the change. Here, PSD will only report its estimated contribution to changes as impact.
o Triangulate, e.g. complementing closed-question surveys with a few in-depth interviews. This
helps to avoid PSD hearing “what we or they think we want to hear” and not noticing hidden influences, costs or benefits.
Estimating attribution will differ in a pilot phase and during scale up. During the pilot, PSD will validate the different levels of changes in a results chain to ensure that change has occurred triggered by programme activities. I.e. PSD will measure to what extend the change occurred due to the programme activities, and keep asking why change happened at each step.
During the scale up, when there are other factors that are likely to be significantly affecting the change, then the programme needs to layer another method on top of the above to assess attribution. A mix or combination is often the best strategy to overcome disadvantages of each individual method.
PSD considers as direct impact the benefits to the target group created by PSD’s support to partners (eg cost sharing, training, mentoring etc). I.e. if PSD supports a processor and as a result 50 householders start to cultivate herbs/fruit, these householders’ additional employment and income will be considered as direct impact.
Indirect impact is defined as benefits to the target group and/or companies as the result of copying and crowding in that takes place without project support.
Crowding in is the process through which interventions catalyse or bring in other players and functions in the market system so that it works better for the poor.
New target enterprises or workers who benefit from this crowding in are referred to as ‘copying’; their additional employment and income are considered indirect impact.
Examples of indicators at appropriate levels to monitor progress towards crowding in include:
Number of players who adopt new business model, without assistance from the project. Number of farmers who adopt new cultivation practices, due to assistance from a processor who
has not received direct project support.
PSD will look for the changes in the market system and try to find evidence of copying and crowding in. This involves visiting market players, both those directly supported by the programme, and those who are not.
When interviewing partners, PSD will ask if partners are aware of other organisations which have changed their practices due to PSD-supported changes. If so, PSD will follow up with these organisations. PSD will informally ask them to verify where they got the idea to change from. Where possible, PSD will try to measure what impact the crowding-in enterprises have on PSD’s target group, disaggregating as always by gender and youth.
PSD also measures indirect impact, when rural households spread an innovation between themselves. For example, when PSD supports the cultivation of a new fruit variety, and beneficiaries give seedlings to other farmers. Where this is likely, PSD includes a question in surveys and interviews with known beneficiaries, asking if they have shared knowledge / inputs with other enterprises / rural households. If they have, and if PSD was unaware of this, the PSD interviewer will ask for contact details of the ‘copying’ enterprises/ rural households. PSD will then interview these ‘copiers’ to find out how much they have benefited from the information.
6 | P a g e
As required by SDC, PSD reports on semi-annual basis with two types of reports: Operational report and financial report. Both reports are presented at the same time so that SDC can compare results achieved with costs, for each market.
The reports need to be comprehensive yet concise, they need to reflect on the expected information, and most importantly the reports need to be accurate and up to date. Presenting the correct monitoring data and current challenges is as important as underlining the progress and successes.
All MRM related responsibilities need careful planning, and oversight from the Team Leader. Hence, within PSD, monitoring and results measurement is part of all everyone’s job. All technical staff job descriptions and performance reviews include monitoring, results measurement and analysis of results.
Section One: Introduction
The purpose of this manual is to explain how Private Sector Development (PSD) programmes measure results. Private Sector Development (PSD) programme is implemented by the Regional Development Agency for Pcinja District (VEEDA) and RDA Zlatibor.
Private Sector Development (PSD) in South-West Serbia. RDA Zlatibor: The programme works in tourism and traditional products, sectors which are anticipated to provide the best opportunity for growth, employment and income generation in the programme’s target region - 25 municipalities in Southwest Serbia.
Private Sector Development (PSD) in South Serbia: VEEDA: The project works in wood, finished wood products (primarily furniture) and Non Timber Forest Products (NTFP’s) sectors. The programme has a national mandate with a regional focus, and from September 2012 in addition to South Serbia, covers Central, West and East Serbia, where 70% of the targeted sectors production occurs. The extended mandate covers 14 districts, instead of the initial 2 districts and targets 4 times the number of beneficiaries.
The two PSD programmes strive to further systematize and develop their Monitoring and Results Measurement (MRM) systems. This guide aims at supporting this effort of bringing these MRM systems even closer to existing international standards and good practice while remaining compatible with Serbian legislation and Serbia’s development context.
The programmes also aim to harmonise their MRM systems, allowing for greater cross-learning and a degree of comparability. Harmonisation is helped by the similarities between the programmes: they share similar project goals and the same implementation methodology (M4P), donor and back-stopper. The two programmes also
7 | P a g e
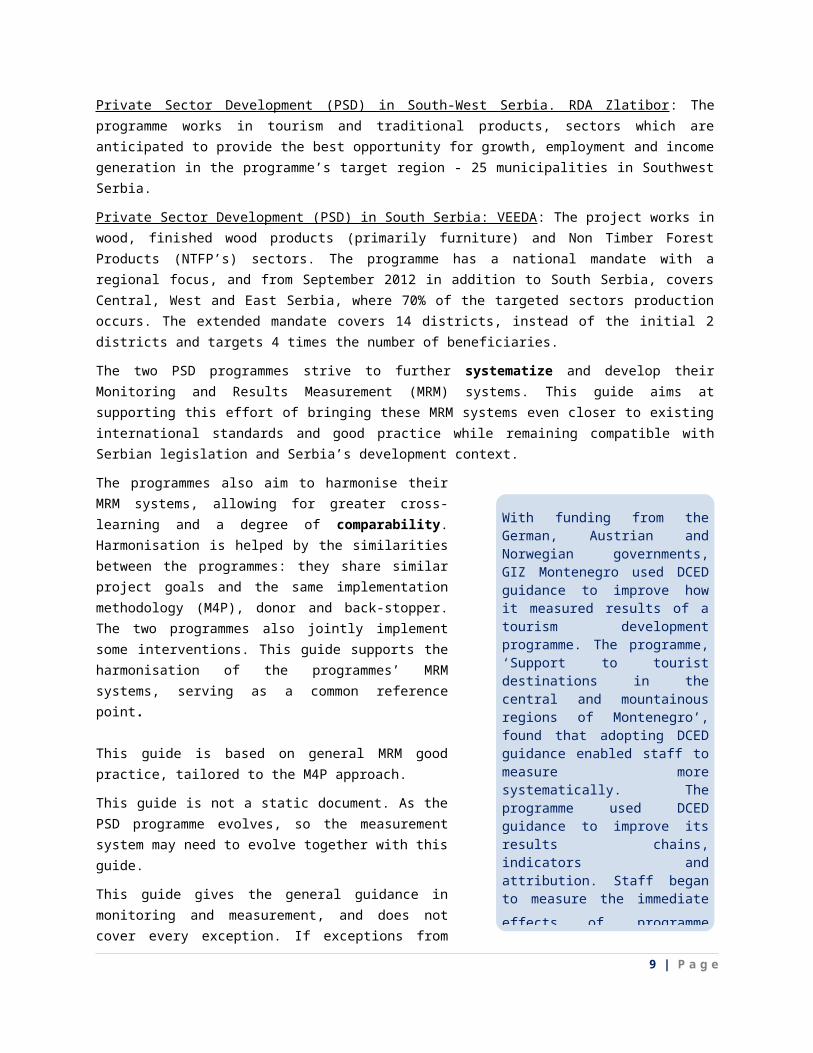
With funding from the German, Austrian and Norwegian governments, GIZ Montenegro used DCED guidance to improve how it measured results of a tourism development programme. The programme, ‘Support to tourist destinations in the central and mountainous regions of Montenegro’, found that adopting DCED guidance enabled staff to measure more systematically. The programme used DCED guidance to improve its results chains, indicators and attribution. Staff began to measure the immediate
effects of programme activities, as well as tourism businesses’ employment and income. This enabled the programme to gather stronger evidence that its activities contributed to tourism businesses’ success.
jointly implement some interventions. This guide supports the harmonisation of the programmes’ MRM systems, serving as a common reference point.
This guide is based on general MRM good practice, tailored to the M4P approach.
This guide is not a static document. As the PSD programme evolves, so the measurement system may need to evolve together with this guide.
This guide gives the general guidance in monitoring and measurement, and does not cover every exception. If exceptions from general direction take place, PSD will deal with them on a case-by-case basis.
1.1. Standards
The PSD programmes’ MRM system is based on international standards. It aims to be compliant with the Donor Committee for Enterprise Development (DCED) Standard, which is designed specifically for private sector development programmes. In doing so, PSD’s measurement system should be capable of producing information for evaluators, who often refer to OECD-DAC’s Evaluation Criteria.1
Whilst aiming to conform to international standards, our MRM systems also reflect Serbian legislation.2
1.2. Purpose of MRM system
Our MRM system has three main purposes: to provide accountability, transparency, and to enable learning and based programme management decisions.
The objectives of PSD’s results measurement are:
o To improve programme management. Providing managers with information to assess which
interventions are working, and which are not, and why. For this, PSD needs: Results chains and indicators which are useful to track progress. Regular tracking of these indicators, especially during pilots.
o To generate credible information about PSD’s results and lessons learned, to report to SDC
o To generate credible information about PSD’s results and lessons learned which can be used
to inform other interested parties. For example, Serbian government counterparts and other development practitioners.
o To be objective and transparent. Maintaining partners’ and SDC’s trust is vital to the success
of PSD. Some interventions may fail, either due to unforeseeable circumstances or wrong decisions. PSD will rather learn from failure, and not try to hide such situations.
1 For example, both DCED and OECD-DAC emphasise the need for programme staff to be clear about each intervention’s ‘theory of change’.Typically, programmes express this ‘theory of change’ through their Project Documents, results chains, and written intervention strategies. This is what PSD does. DCED and OECD-DAC also see clear, specific, attributable indicators and targets as essential to monitoring progress towards programme objectives. PSD’s measurement system features both targets and indicators.2 Serbian legislation affects how we define ‘additional employment’. See Section 5.2 for details.
8 | P a g e
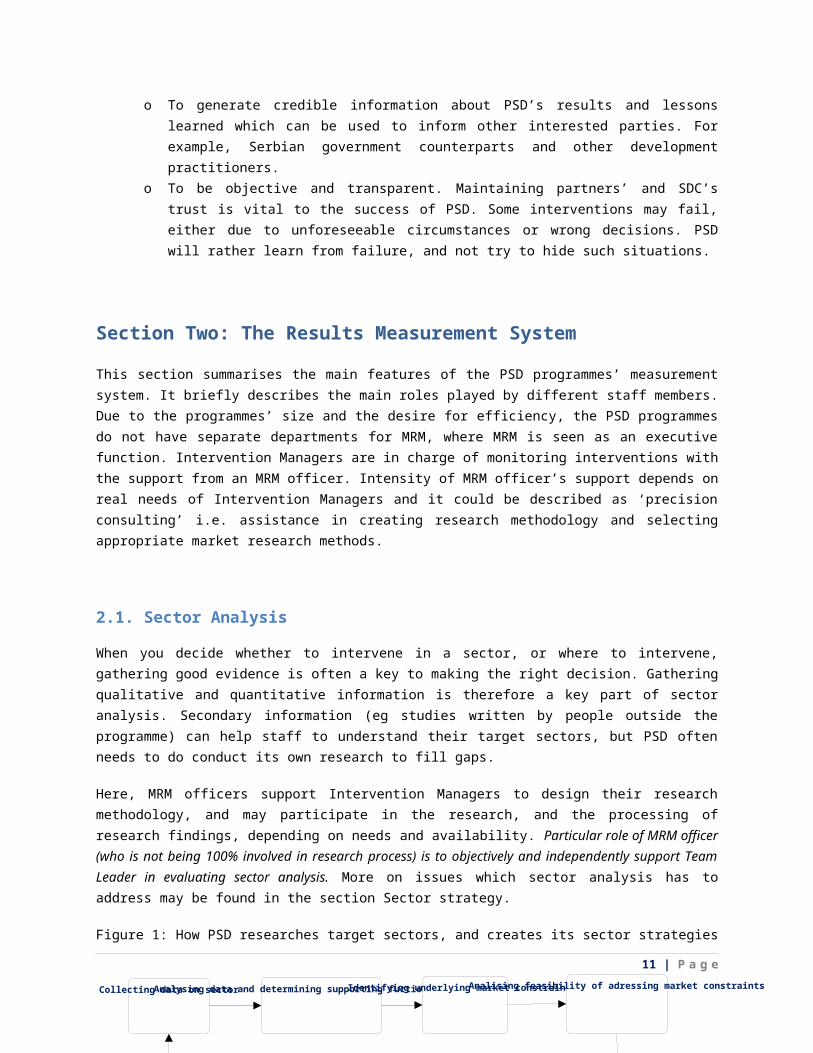
Creating method/plan of sector analysis
Collecting data on sectorAnalysing data and determining supporting fuctions and rulesIdentifying underlying market constraints Analising feasibility of adressing market constraints
Identifying gaps in market research Creating market strategy
Section Two: The Results Measurement System
This section summarises the main features of the PSD programmes’ measurement system. It briefly describes the main roles played by different staff members. Due to the programmes’ size and the desire for efficiency, the PSD programmes do not have separate departments for MRM, where MRM is seen as an executive function. Intervention Managers are in charge of monitoring interventions with the support from an MRM officer. Intensity of MRM officer’s support depends on real needs of Intervention Managers and it could be described as ‘precision consulting’ i.e. assistance in creating research methodology and selecting appropriate market research methods.
2.1. Sector Analysis
When you decide whether to intervene in a sector, or where to intervene, gathering good evidence is often a key to making the right decision. Gathering qualitative and quantitative information is therefore a key part of sector analysis. Secondary information (eg studies written by people outside the programme) can help staff to understand their target sectors, but PSD often needs to do conduct its own research to fill gaps.
Here, MRM officers support Intervention Managers to design their research methodology, and may participate in the research, and the processing of research findings, depending on needs and availability. Particular role of MRM officer (who is not being 100% involved in research process) is to objectively and independently support Team Leader in evaluating sector analysis. More on issues which sector analysis has to address may be found in the section Sector strategy.
Figure 1: How PSD researches target sectors, and creates its sector strategies
9 | P a g e
2.2. Intervention design
Interventions address constraints to sustainable employment and income for PSD’s target identified through sector analysis. To decide which intervention ideas to pursue, PSD assesses each intervention idea according to the following criteria:
The number of additional jobs that the intervention is likely to create – overall, and particularly for women and youth.
The amount of additional income that the intervention is likely to create – overall, and particularly for women and youth.
How likely PSD’s intervention is to create sustainable systemic change. How much the intervention would contribute to women’s economic empowerment. Whether the intervention would support Serbia’s EU integration agenda.
In the early stage of intervention design, Intervention Manager must confirm that a proposed intervention can bring about systemic change. It also is essential to determine if it is possible to monitor the change and prove that it is result of project activities. The first stage is to create a results chain (for details on result chain design techniques, see section 3.2). The results chain illustrates how you expect your activities to lead to changes in the market system, and these changes to create employment and income for the target group. Drawing a results chain helps you to visualise an intervention, and test how logically it can be expected to lead to results.
Next, the Intervention Manager and MRM officer set indicators and propose how these indicators will be measured. They also identify the main assumptions about how one change will lead to another, and make plans to verify them. Setting indicators also helps staff to check that an intervention will lead to measurable, attributable results for PSD. This is essential when deciding whether to pursue an intervention. Next, data is collected data and baseline indicators collected.
Using this baseline data, an intervention’s expected results can then be projected. As the criteria above show, two key criteria when deciding which interventions to pursue are additional employment and income.
After PSD has decided to pursue an intervention, the responsible Intervention Manager may decide to refine the results chain, or to alter it based on a change in intervention tactics. Indicators and projections would then be revised accordingly.
2.3. Monitoring and measurement of intervention results
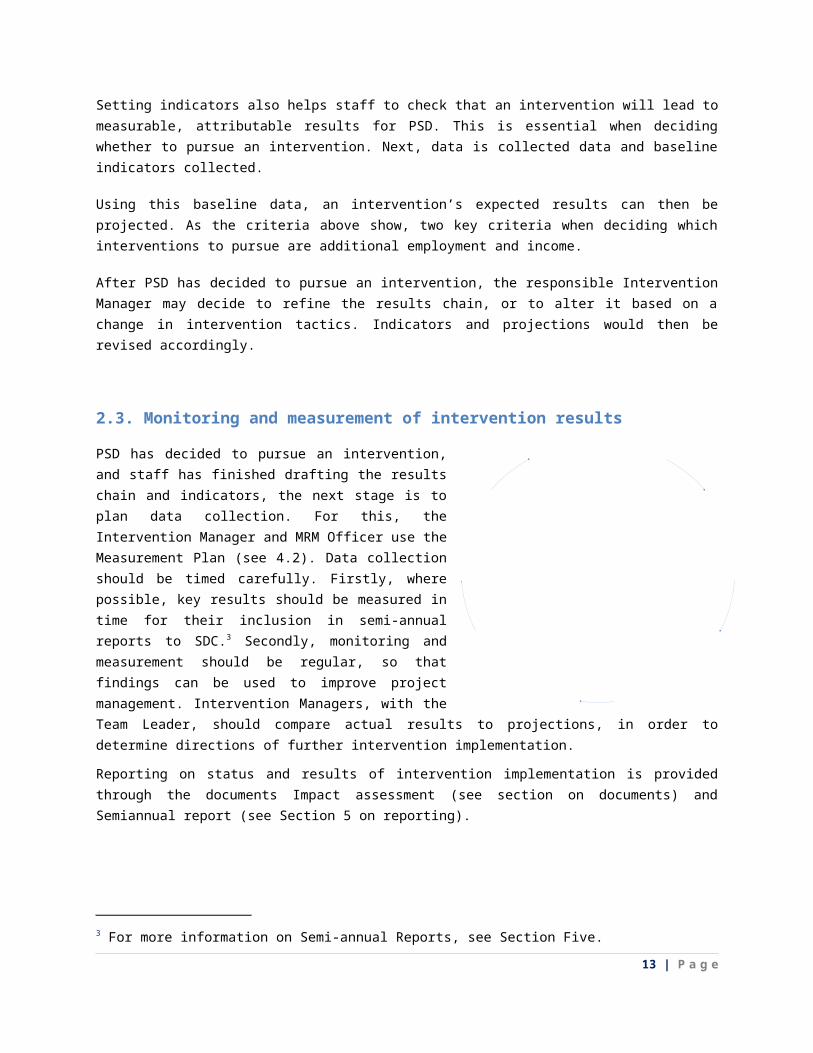
PSD has decided to pursue an intervention, and staff has finished drafting the results chain and indicators, the next stage is to plan data collection. For this, the Intervention
10 | P a g e
Cretaing detailed result
chain
Defining key indicators of
change
Collecting dataReports
Intervention analysis
Manager and MRM Officer use the Measurement Plan (see 4.2). Data collection should be timed carefully. Firstly, where possible, key results should be measured in time for their inclusion in semi-annual reports to SDC.3 Secondly, monitoring and measurement should be regular, so that findings can be used to improve project management. Intervention Managers, with the Team Leader, should compare actual results to projections, in order to determine directions of further intervention implementation.
Reporting on status and results of intervention implementation is provided through the documents Impact assessment (see section on documents) and Semiannual report (see Section 5 on reporting).
Section Three: Monitoring Documents
In this section the main documents used in PSD’s monitoring and results measurement are listed and described4. The main documents are:
Sector Strategy: When deciding how and where to intervene, PSD follows an M4P diagnostic process. The Sector Strategy is where PSD writes up its findings from the diagnostic process. The document includes analysis of the sector, taking this forward into outlining which key constraints the programme aims to address, with a clear rationale as to why they were chosen over others (i.e. feasibility &/or risk).
Intervention Guides: this document is the main document for monitoring and results measurement. It includes a narrative description of the background to each intervention, the intervention strategies and results chains with separate lines for direct impact (supported by the project) and indirect impact (the result of crowding in or scaling up in another way, with or without project facilitation), monitoring plan and documented projections on impact
Impact Assessment Report: this document outlines what the situation was before intervention, the results achieved (qualitative and quantitative) by PSD’s intervention, and how these results were measured. It is drafted when PSD first measures impact and updated at the end of the monitoring period.
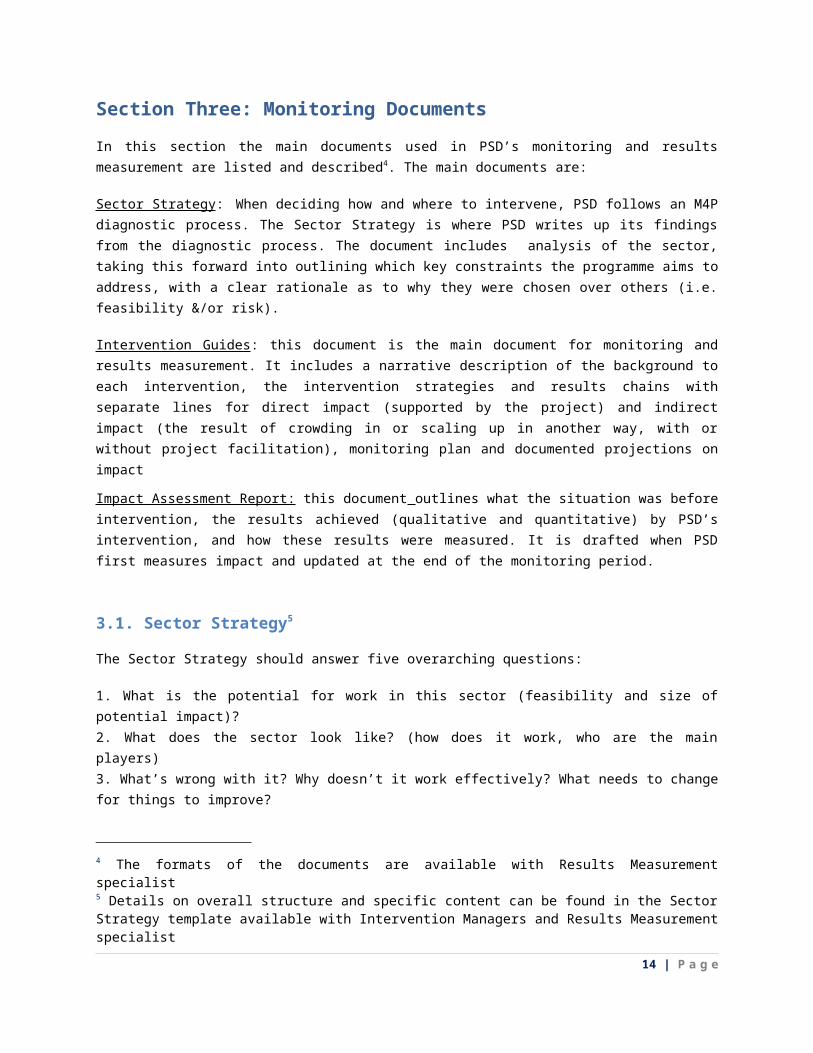
3.1. Sector Strategy5
The Sector Strategy should answer five overarching questions:
1. What is the potential for work in this sector (feasibility and size of potential impact)? 2. What does the sector look like? (how does it work, who are the main players)3. What’s wrong with it? Why doesn’t it work effectively? What needs to change for things to improve?4. How do we envisage the sector will function differently/better in the future?5. What are the main things that PSD is going to do?
Sector strategy has two main purposes. First, strategy should give the big picture of the sector - its size, demand and supply, players involved, their roles, the trends etc. It is mapping of the specific market
3 For more information on Semi-annual Reports, see Section Five.4 The formats of the documents are available with Results Measurement specialist5 Details on overall structure and specific content can be found in the Sector Strategy template available with Intervention Managers and Results Measurement specialist
11 | P a g e
system, its dynamic and the position of target group. It should explain where problems lie and what is preventing the solution. It is narrowing down to the specific market constrains.
Secondly, drafting a Sector Strategy helps PSD to articulate its vision of how PSD can make the market work better for the target group. The Sector Strategy thus forms the basis for intervention design.
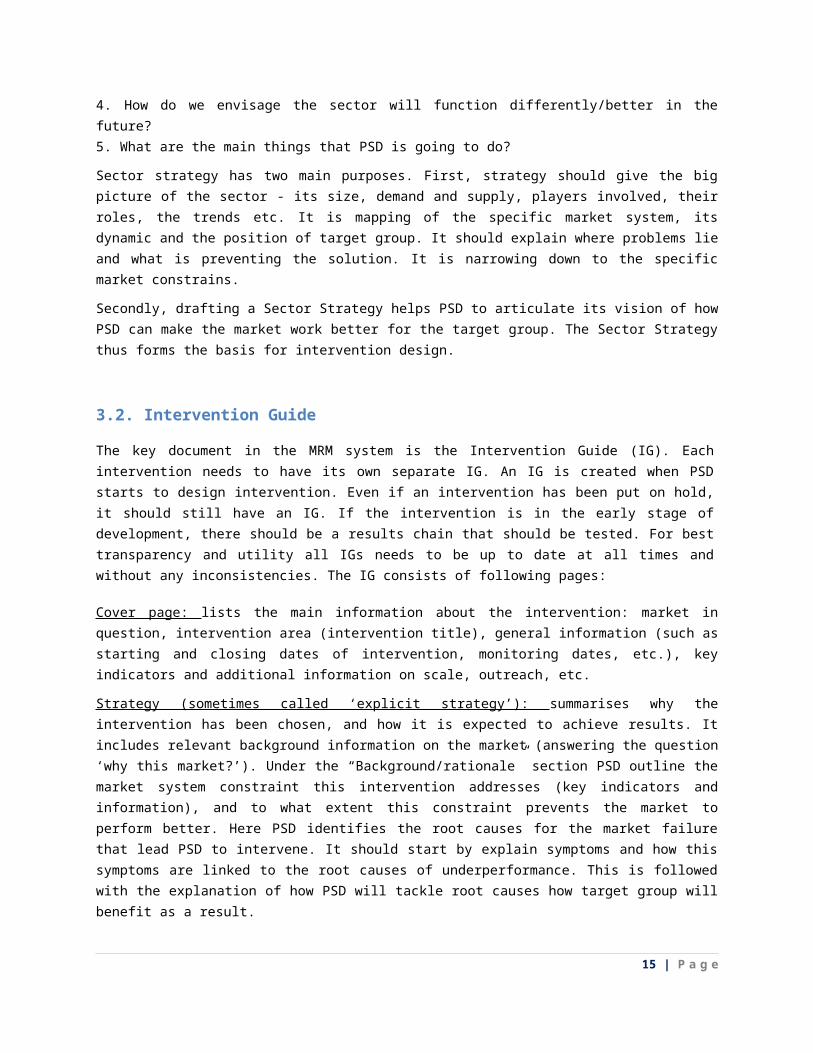
3.2. Intervention Guide
The key document in the MRM system is the Intervention Guide (IG). Each intervention needs to have its own separate IG. An IG is created when PSD starts to design intervention. Even if an intervention has been put on hold, it should still have an IG. If the intervention is in the early stage of development, there should be a results chain that should be tested. For best transparency and utility all IGs needs to be up to date at all times and without any inconsistencies. The IG consists of following pages:
Cover page: lists the main information about the intervention: market in question, intervention area (intervention title), general information (such as starting and closing dates of intervention, monitoring dates, etc.), key indicators and additional information on scale, outreach, etc.
Strategy (sometimes called ‘explicit strategy’): summarises why the intervention has been chosen, and how it is expected to achieve results. It includes relevant background information on the market (answering the question ‘why this market?’). Under the “Background/rationale” section PSD outline the market system constraint this intervention addresses (key indicators and information), and to what extent this constraint prevents the market to perform better. Here PSD identifies the root causes for the market failure that lead PSD to intervene. It should start by explain symptoms and how this symptoms are linked to the root causes of underperformance. This is followed with the explanation of how PSD will tackle root causes how target group will benefit as a result.
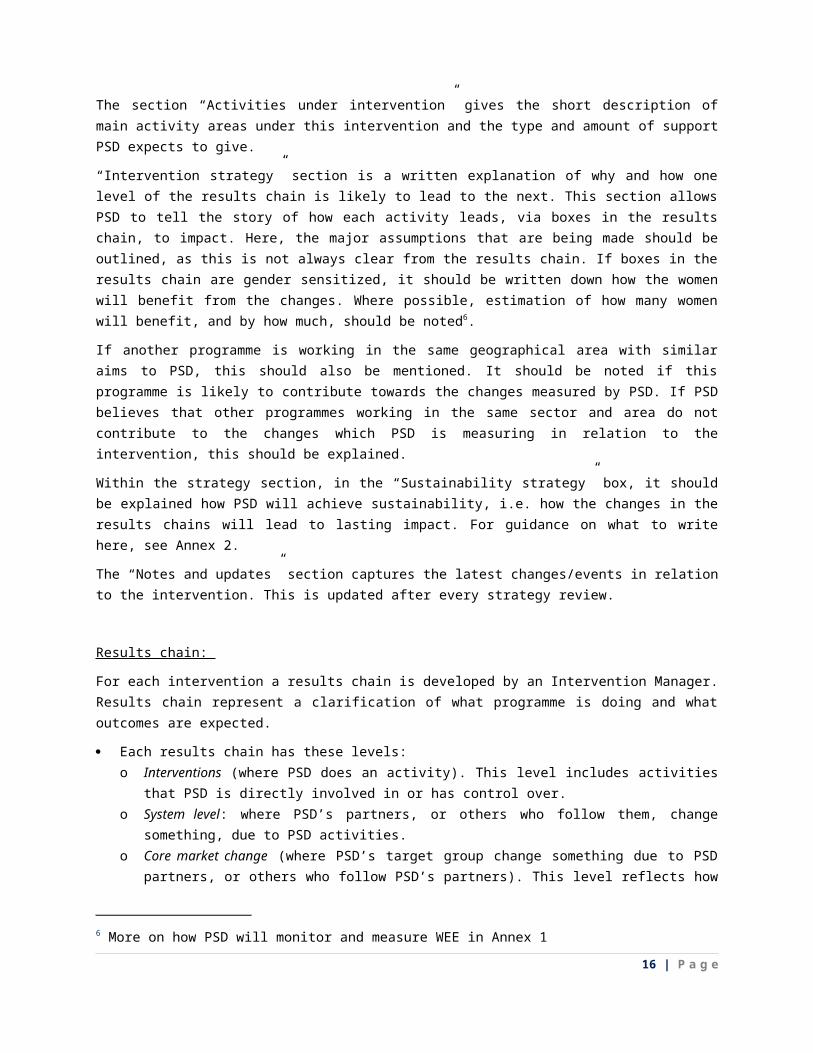
The section “Activities under intervention” gives the short description of main activity areas under this intervention and the type and amount of support PSD expects to give.
“Intervention strategy” section is a written explanation of why and how one level of the results chain is likely to lead to the next. This section allows PSD to tell the story of how each activity leads, via boxes in the results chain, to impact. Here, the major assumptions that are being made should be outlined, as this is not always clear from the results chain. If boxes in the results chain are gender sensitized, it should be written down how the women will benefit from the changes. Where possible, estimation of how many women will benefit, and by how much, should be noted6.
If another programme is working in the same geographical area with similar aims to PSD, this should also be mentioned. It should be noted if this programme is likely to contribute towards the changes measured by PSD. If PSD believes that other programmes working in the same sector and area do not contribute to the changes which PSD is measuring in relation to the intervention, this should be explained.
Within the strategy section, in the “Sustainability strategy” box, it should be explained how PSD will achieve sustainability, i.e. how the changes in the results chains will lead to lasting impact. For guidance on what to write here, see Annex 2.
The “Notes and updates” section captures the latest changes/events in relation to the intervention. This is updated after every strategy review.
6 More on how PSD will monitor and measure WEE in Annex 1
12 | P a g e
Interventions (activities)
Market system level
Core market
Income and employment
What PSD does or support partner to do
Direct result from PSD activities
Transactions of
service/products to beneficiaries
Crowding in
Other beneficiaries influenced to seek
service/product
Benefits of using the service
Greater production/profit by beneficiaries
More income, employment generated
Results chain:
For each intervention a results chain is developed by an Intervention Manager. Results chain represent a clarification of what programme is doing and what outcomes are expected.
Each results chain has these levels: o Interventions (where PSD does an activity). This level includes activities that PSD is directly
involved in or has control over. o System level: where PSD’s partners, or others who follow them, change something, due to PSD
activities. o Core market change (where PSD’s target group change something due to PSD partners, or
others who follow PSD’s partners). This level reflects how beneficiaries use new or improved products or services, and benefits from these in terms of greater sales, yields, etc.
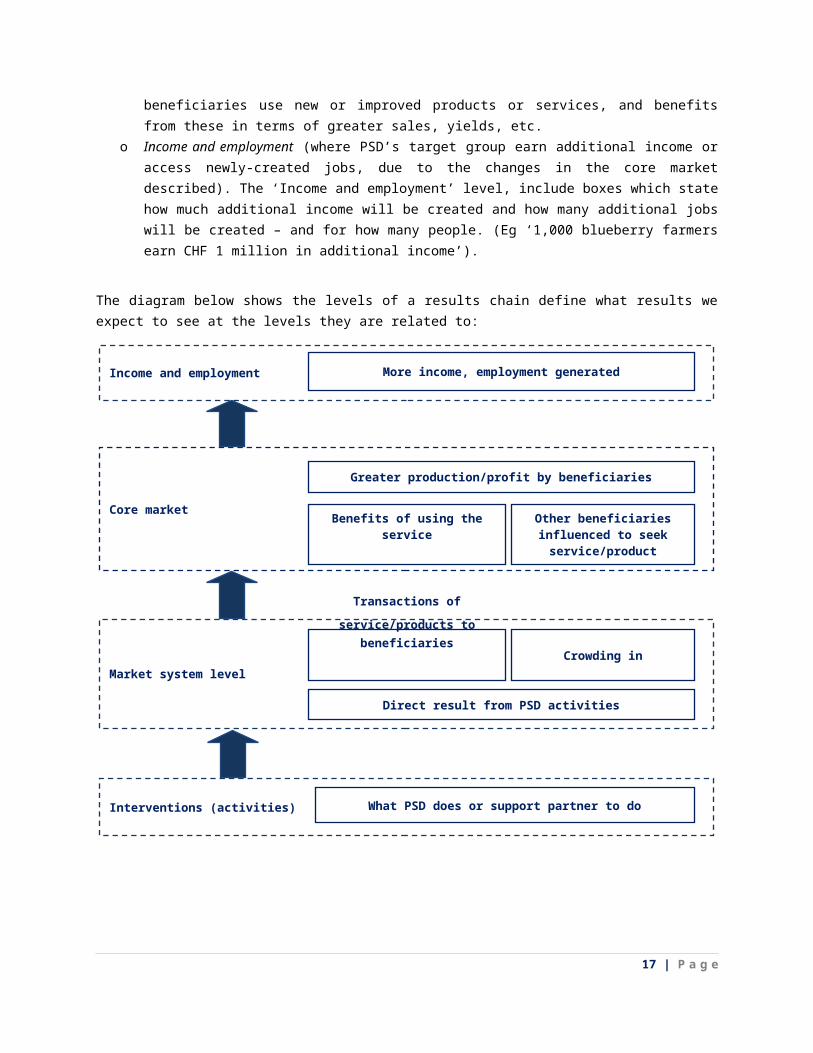
o Income and employment (where PSD’s target group earn additional income or access newly-
created jobs, due to the changes in the core market described). The ‘Income and employment’ level, include boxes which state how much additional income will be created and how many additional jobs will be created – and for how many people. (Eg ‘1,000 blueberry farmers earn CHF 1 million in additional income’).
The diagram below shows the levels of a results chain define what results we expect to see at the levels they are related to:
13 | P a g e
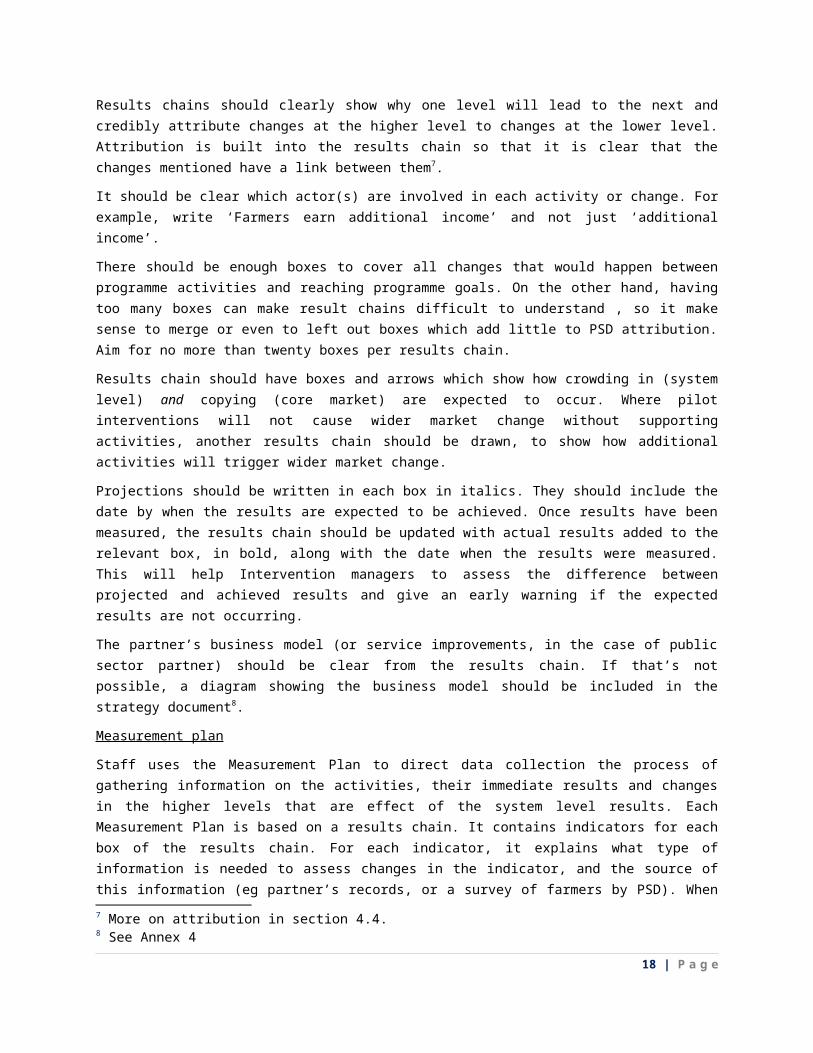
Results chains should clearly show why one level will lead to the next and credibly attribute changes at the higher level to changes at the lower level. Attribution is built into the results chain so that it is clear that the changes mentioned have a link between them7.
It should be clear which actor(s) are involved in each activity or change. For example, write ‘Farmers earn additional income’ and not just ‘additional income’.
There should be enough boxes to cover all changes that would happen between programme activities and reaching programme goals. On the other hand, having too many boxes can make result chains difficult to understand , so it make sense to merge or even to left out boxes which add little to PSD attribution. Aim for no more than twenty boxes per results chain.
Results chain should have boxes and arrows which show how crowding in (system level) and copying (core market) are expected to occur. Where pilot interventions will not cause wider market change without supporting activities, another results chain should be drawn, to show how additional activities will trigger wider market change.
Projections should be written in each box in italics. They should include the date by when the results are expected to be achieved. Once results have been measured, the results chain should be updated with actual results added to the relevant box, in bold, along with the date when the results were measured. This will help Intervention managers to assess the difference between projected and achieved results and give an early warning if the expected results are not occurring.
The partner’s business model (or service improvements, in the case of public sector partner) should be clear from the results chain. If that’s not possible, a diagram showing the business model should be included in the strategy document8.
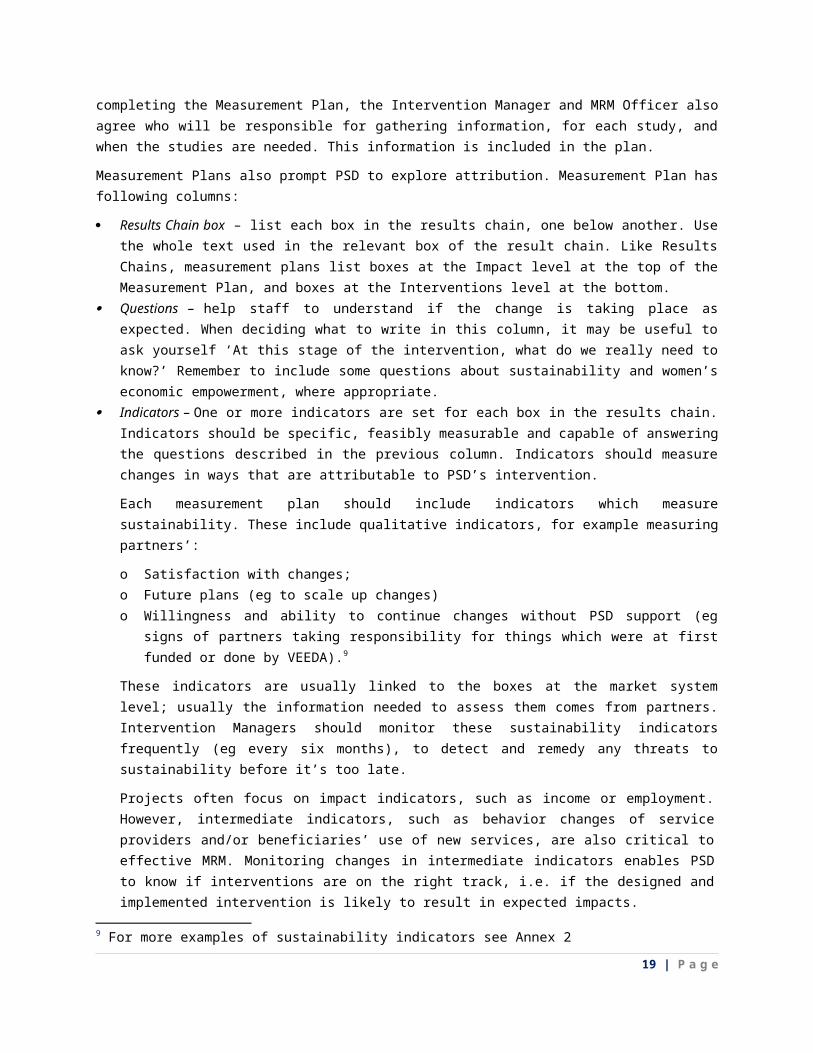
Measurement plan
Staff uses the Measurement Plan to direct data collection the process of gathering information on the activities, their immediate results and changes in the higher levels that are effect of the system level results. Each Measurement Plan is based on a results chain. It contains indicators for each box of the results chain. For each indicator, it explains what type of information is needed to assess changes in the indicator, and the source of this information (eg partner’s records, or a survey of farmers by PSD). When completing the Measurement Plan, the Intervention Manager and MRM Officer also agree who will be responsible for gathering information, for each study, and when the studies are needed. This information is included in the plan.
Measurement Plans also prompt PSD to explore attribution. Measurement Plan has following columns:
Results Chain box – list each box in the results chain, one below another. Use the whole text used in the relevant box of the result chain. Like Results Chains, measurement plans list boxes at the Impact level at the top of the Measurement Plan, and boxes at the Interventions level at the bottom.
Questions – help staff to understand if the change is taking place as expected. When deciding what to write in this column, it may be useful to ask yourself ‘At this stage of the intervention, what do we really need to know?’ Remember to include some questions about sustainability and women’s economic empowerment, where appropriate.
Indicators – One or more indicators are set for each box in the results chain. Indicators should be specific, feasibly measurable and capable of answering the questions described in the previous column. Indicators should measure changes in ways that are attributable to PSD’s intervention.
7 More on attribution in section 4.4.8 See Annex 4
14 | P a g e
Each measurement plan should include indicators which measure sustainability. These include qualitative indicators, for example measuring partners’:
o Satisfaction with changes;
o Future plans (eg to scale up changes)
o Willingness and ability to continue changes without PSD support (eg signs of partners taking
responsibility for things which were at first funded or done by VEEDA).9
These indicators are usually linked to the boxes at the market system level; usually the information needed to assess them comes from partners. Intervention Managers should monitor these sustainability indicators frequently (eg every six months), to detect and remedy any threats to sustainability before it’s too late.
Projects often focus on impact indicators, such as income or employment. However, intermediate indicators, such as behavior changes of service providers and/or beneficiaries’ use of new services, are also critical to effective MRM. Monitoring changes in intermediate indicators enables PSD to know if interventions are on the right track, i.e. if the designed and implemented intervention is likely to result in expected impacts.
In some cases PSD may use proxy indicators10 where this is more practical than measuring the actual change itself. In this case, PSD should add a note under ‘How’ explaining why a proxy is being used and how it is a suitable proxy (eg why a certain indicator would be hard to measure).
How – describes how data on indicators will be collected. The method of data collection depends on the type of information that is required. As Section 5.4 explains, it can vary from observation to interviews and surveys. Often, it is sensible to use more than one method to measure key indicators, particularly at the ‘Income and employment’ level. This improves the credibility of PSD’s measurement; different methods can compensate for each other’s weaknesses. For example, research which explains ‘why’ something changes can improve attribution, instead of PSD just measuring ‘how much’ something changes after PSD intervenes. Usually this means asking partners ‘why did you decide to change x?’
Time – shows when data will be collected. The expected dates of data collection will correspond to the time when the desired change is expected to occur. For example, the satisfaction trainees a partner’s training course can be measured after the training is complete. This box can have multiple dates; often if it is useful to |monitor changes in an indicator at several stages during the intervention. When an indicator is measured several times, the first entry in the ‘When’ column shouldn’t be deleted, but new entries should be added (eg ‘July 2012; July 2013; July 2014’).
Who – this can be MRM Officer or Intervention Manager. Sometimes, data collection will be outsourced and this should be stated in the column.
What we have – baseline – PSD should decide which indicators needs to measure a baseline for and to make a plan to measure the baselines before PSD’s intervention would change the status of the indicator. PSD should ensure that the ‘When’ column reflects these plans.
Measurement plan needs to include a section which summarises how attribution will be handled11 by the programme. It should contain explanation of which methods will be used for estimating attribution and why that method has been chosen.
9 For more examples of sustainability indicators see Annex 210 Proxy indicator: An indicator for which measurable change is clearly and reliably correlated with an indicator of a change that the programme aims to achieve (but is more practical to measure). Source: DCED (2013) DCED Standard Version VI, p. 17.11 More on attribution methods and means of verification in section 5.4.
15 | P a g e
Risk analysis
Risk analysis is created when the intervention is being considered /designed. It helps Intervention Managers to assess how risks can affect intervention and the impact of intervention. The chances for the risk occurring needs to be estimated and there must be a plan to reduce negative effects of these risks.
Supporting calculations
As described in section 2.2, changes in key quantitative indicators should be projected, so that PSD can estimate future programme impact. For example, ‘blueberry growers earn CHF 1 million additional income by August 2015’. Projections for income, employment and outreach are essential. Each intervention plan needs to include detailed calculations for the projections made in results chain. Calculations should be based on existing information (for example, from the field or in consultation with the relevant experts). The sources of information used in projections should be clearly listed. Sometimes assumptions must be made that are based on expected project achievements, findings from the context and other performed analytical documents. This should be also recorded in the calculation sheet. Results should be always discounted by opportunity costs while taking into account local conditions. Changes in qualitative indicators do not have to be predicted, but Intervention Managers should know when these indicators can be expected to change.
Internal strategy reviews
Internal strategy reviews usually take place during backstopping missions. If this is not the case, PSD will review its strategy at least once per year, scheduling an Annual Strategic Review meeting.
The findings of a portfolio review during a backstopping mission are reflected in the backstoppers’ aide memoire, which contains observations, recommendations and advises on strategy and tactics. If needed, results chains and measurement plans should be updated after backstopping missions.
Before a portfolio review or Annual Strategic review meeting, all Intervention Guides should be updated by Intervention Managers. Results chains should reflect current intervention strategy. Projections and risk analysis should be reviewed too. All IGs should be then sent to Results Measurement specialist, who will send them to the back-stoppers. Before an annual review, the RM Specialist will also aggregate the results so that the logframe, with the latest results, is ready in time for the annual review. RM specialist should compare latest results with initial projections. If there are differences between projections and latest results, RM specialist should put it in writing what was learned from monitoring. Intervention Manager and Team Leader with the support from Results Measurement Specialist should then decide what will be done and what changes are required.
The whole team should be involved in the Annual Strategy Review meeting, while Intervention Managers are responsible to update results chains to reflect change in intervention strategy and as well as projections that correlate to the results chain.
The Annual Strategic Review meeting report of what was discussed and agreed is usually written by the programme’s Administrator, and reviewed by the Team Leader.
All changes should be listed in the update sections of the Intervention Strategy. The old versions of result chains should be kept12.
The only exception is when PSD is updating the results chain of an intervention which has finished. If measurement shows that there was no crowding in or coping, why this did not happen should be explained in Impact Assessment Report.
12 VEEDA keeps old versions of results chains in Public folder on server
16 | P a g e
If an IG does not require updates after a review, this should be also noted in the ‘Intervention Strategy’ section, saying when the IG was reviewed and that no changes were considered necessary.
As well as during backstopping missions and annual reviews, PSD staff can also review strategy at other times, if circumstances change or there are new findings on the market which make a new strategy worth considering. PSD’s interventions should be opportunistic and flexible in response to changes, in order to maximize benefits for the target group. In this case, a one-to-one meeting should be held between Intervention Manager and Team Leader, to decide on the necessary changes. All other steps (updating the results chains and projections and recording these changes) are done as described above.
3.3. Impact assessment report
The Impact Assessment report is a document that describes changes facilitated by an intervention and how these changes were measured. The Impact Assessment Report has two purposes: to store impact information, and to describe the reliability of this information. Each intervention should have its own Impact Assessment Report. It is an internal document, which can later be used to develop communications material (reports, case studies, etc.)
An Impact Assessment Report is first written when PSD first measures impact (change in income and employment). It should be updated when PSD completes the final impact assessment.
It is not necessary to describe why the intervention was chosen, what the market looks like, or how PSD’s activities were completed as this is documented in Strategy/explicit strategy document of the IG.
The Impact Assessment Report format contains the following sections:
Intervention Story – summarizes textually what the programme did. Staff can copy the explanation given in the IG/ Strategy paper.
Data Gathering Methodology – describes the methodology used in the impact assessment. If the methodology conforms with the good research practices described in section 5.3 this should be highlighted. If PSD faces challenges which forced PSD to deviate from good practices, this should be also described, and any effects that deviations might have on the accuracy of findings should be noted. If the research methodology is different to what PSD originally planned, even if it still complies with good practice, explanation of how and why changes were made is needed.
In the next section, Findings, the changes in indicators which measurement recorded are explained. Every box mentioned at system level and at the core market level must be mentioned, explaining results at each level. Where relevant, for indicators that feature in PM’s logframe, three types of result should be provided: direct results13, indirect results14 and the total (combined direct and indirect results). Where relevant, results for male and female beneficiaries should be presented separately. Any evidence of sustainability should be noted15.
13 Change by, or because of, market players assisted by PM.14 ‘Indirect’ results are the results of crowding in. In other words, change by, or because of, market players imitating innovations that PM helped to create, without PM’s assistance.15 More information on sustainability see in Annex 2
17 | P a g e
Each Impact Assessment report ends with a Summary and Conclusions section which summarizes the impact16 achieved by the intervention (extrapolated from PSD research). Any learning that can contribute to further work in this market or others should also be included under this section.
If the intervention was unable to achieve any impact, this section should explain why.
The report is considered as final after the final impact assessment when the report is updated with evidence of sustainability and systemic change observed.
Section Four: Methods, research practices and attribution
4.1. Definition of the PSD programmes’ target group
In order to be in compliance with the Swiss strategy and at the same time with the local regulations, PSD programmes accepted Serbian standards and definitions in terms of income and employment.
PSD will stimulate sustainable additional employment and income for workers (employees in the formal economy) in target municipalities. PSD will give particular attention to stimulating jobs and income for women and youth. PSD defines ‘youth’ as persons between 15 and 30 years old. Among workers, PSD will focus on those earning less than RSD 34,000 (about CHF 370)17.
PSD will also stimulate additional income for enterprises in target municipalities. Among those enterprises, PSD will report as impact additional income generated only by micro, small and medium-sized enterprises (MSMEs). PSD will not partner with enterprises to raise their profits in ways which have little or no benefit for workers (eg replacing employees with machinery).
4.2. Impact indicators definition
In order to be compliant with Serbian legislation and at the same time with SDC priorities reflected in Swiss Cooperation Strategy 2014-2017, PSD defined income and employment impact indicators as follows below:
Jobs
PSD is aware that many donor programmes report jobs in the informal economy, both in their baselines and as results. Serbian legislation views jobs in the informal economy as illegal, however. As PSD is reporting in accordance with Serbia legislation, PSD will not count informal jobs in its baselines or its impact assessment. PSD will only count only formally employed women and men (with labour / employment contract).
16 By ‘impact’ we mean the changes in ‘Impact’ level logframe indicators caused by the intervention. In other words, the additional income, outreach and employment caused by the intervention ─ for the whole target group, specifically for women, and specifically for youth.17 According to the Household Budget Survey done by Serbian government in 2010, households whose consumption was below 8,544 dinars per consumer unit, were poor. The average family counts members, which gives 8.544*4=34,175 RSD.
18 | P a g e
In agricultural sectors the programme counts only those women and men who have registered their household (farm) and do business through a bank account (ie legal channels). In this context, workers who were previously in the informal economy and because of PSD interventions gain formal employment are counted as additional jobs. The same applies for rural households. If a previously unregistered household that was performing any type of agricultural activities becomes registered, as a result of PSD activities, PSD counts this as a new job.
When reporting ‘additional jobs’ to SDC, PSD will report on how many full-time equivalent jobs the programme has created. PSD count as a full-time job in two ways, depending of the sector:
Industry/tourism full-time job definition: According to Article 2 of the Rulebook18 an employed person is a person who is employed in accordance with the labour legislation and as such is contributing to the mandatory social insurance. Thus, in determining the number of employees, the persons taken into account are:
- Employed for an indefinite period = 1 full-time job- Employed for a definite time = % of full-time job- Part-time employed = % of full-time job
Here, a full-time job is defined as 240 working days per year. Persons who were employed as apprentices are also considered as employed persons.
Agriculture full-time job definition: Agricultural production in Serbia is a seasonal activity. Farmers work long hours during peak season, and have quiet periods in winter. Depending on the type of production and cycle duration, farmers in Serbia are usually active for six months or more, but in all cases less than one year. Regardless of the production type, all registration of the household lasts one year and is recognised as a whole year activity. Also, social and pension contributions householders pay for the whole year. For these reasons, in the case of agriculture, PSD counts income equivalent jobs instead of using ‘240 days per year’ as the measure, with some additional conditions that should be fulfilled.
By ‘income equivalent’, we mean that a householder earns equal or more than the annual gross minimum wage from new or more productive activities caused by PSD’s intervention. Here, this will be counted as one job. If a householder earns less than gross minimum wage, this will be calculated as a percentage of a job. In other words:
1 income equivalent job: If total additional income for the production season / 12 months ≥ 300 CHF19
% of income equivalent job: If total additional income for the production season / 12 months < 300 CHF
Example: Additional income for household from blueberry growing is 5,000 CHF. 5,000 CHF / 12 months = 416.66 CHF > 300 CHFIf the household is registered, blueberry growing in this case created 1 (one) additional job.
18 "Official Gazette of RS", No. 33/1019 As of January 2014, the gross minimum wage in Serbia was 28,582 RSD ≈ 300 CHF per month. If the minimum gross wage changes, this formula will be adapted accordingly.
19 | P a g e
Additional income:
To reflect PSD’s particular emphasis on creating jobs and income for women and youth, PSD measures additional income as follows:
- Total net additional income (CHF) for workers and enterprises.
- Within total net additional income, amount (CHF) generated by women.
- Within total net additional income, amount (CHF) generated by youth.
- Within total net additional income, amount (CHF) generated by workers and self-employed; amount generated by SMEs.
- Women and youth who generate additional income as workers would be included. So would women and youth who generate additional income as business owners.
- The number of jobs stimulated by the programme would also be disaggregated by gender, by youth, and by employees/ self-employed.
When PSD calculates formalized jobs as impact, the complete income earned from the new formal job will be calculated as additional income. PSD will measure income from informal jobs to see if farmers are earning more from PSD interventions, which will be one of the sustainability indicators.
When farmers replace old crops with more profitable ones, due to PSD interventions, PSD will first consider if demand for the less productive crop is likely to be replaced by supply from outside the target area. If so, PSD will estimate how much income farmers would have earned from the old crop, then discount it from reported ‘additional income’. This is because the overall value of food production within the target area will only have increased by the extra value of the new, more profitable crop.
4.3. Research practices
PSD collects data at different times during the monitoring period of the interventions. At a minimum, system-level indicators are measured annually, while core market and impact indicators are measured at the baseline, mid- and end-point of the programme. PSD will also conduct additional research two years after the completion of the intervention. The timing of data collection also depends on the intervention’s progress. During the pilot, smaller, more frequent monitoring is done, because during pilots the uncertainty over whether something is working is highest. Regular monitoring will inform managers about whether they need to change intervention strategy or tactics. Larger, less frequent, more precise studies of impact are done during scale up. These studies focus on how much and how many people have benefited overall, and specifically how many women and youth have benefited.Initial frequent contact with beneficiaries, to determine if they benefit, is later during the uptake replaced with an assessment focusing more on measuring the outreach of the intervention by working with the service providers and thus estimating the outreach. This measuring scale and indirect outreach at the uptake phase requires staff to shift from more traditional results assessment tools to a more creative and investigative reporting mode. Hence there is a need for innovative ways to track the diffusion of new behavior and business models through the value chain. Still, while assessing the benefits to target beneficiaries can be less intensive in the scale up phase, it is still important to check through small
20 | P a g e
measurements that target enterprises continue to benefit to the expected extent. If they do not, this is a signal to conduct more information gathering to determine why not. If they do, the project can continue to focus on encouraging adoption of new behavior i.e. models.
PSD uses different methods to measure different indicators. Methods can range from observation, in-depth interviews with key informants, comparison between a target and control group, to surveys and analysis that require expertise from outside the PSD team. The MRM officer should advise on the choice of method, taking into account importance of the study, likely size of impact, cost of intervention, cost of measuring, desired confidence interval and level and triangulation options.20
4.4. Measurement and attribution methods – means of verification
Attribution is defined by the Glossary of Key Terms developed by the DAC Network on Development Evaluation as the ascription of a causal link between observed (or expected to be observed) changes and a specific intervention21. In simple terms this means that attribution refers to extent of change that can be claimed by a project/intervention out of total change that takes place. For all reported impact, PSD should demonstrate attribution well enough to convince a reasonable but sceptical observer.22
The methods which PSD uses to attribute changes to its interventions include:o Creating results chains, to logically articulate how activities will lead to impact.
o Reviewing these results chains regularly, to check that the results reported at each level can
logically explain changes at the level above. If they cannot, PSD will commission extra research to clarify attribution.
o Where applicable, measuring baselines.
o Where feasible, comparing beneficiaries with a control group of similar non-beneficiaries. When
doing this, PSD will take care to isolate the impact of differences between beneficiaries and non-beneficiaries in the control group. This means looking out for differences (eg in attitudes between people in treatment and control group) whilst testing surveys.
o Interviewing partners and beneficiaries to understand if the changes that they have made, which
appear to have resulted from PSD’s facilitation, would have occurred anyway. Asking “why” people change, in in-depth interviews, can provide information on sustainability too.
o For example, if PSD is promoting access to blueberry seedlings, PSD would ask new blueberry
farmers where they got their seedlings from. If there are other factors that contribute to the
20 More on how to conduct a good research in Annex 321 http://www.oecd.org/dac/2754804.pdf 22 Definition adapted from the glossary of the DCED Standard. The DCED Standard for Measuring Achievements In Private Sector Development. Version V, 13 January 2010.
21 | P a g e
The Rural Development Programme for England ran from 2007 to 2013, funded by the European Union and the UK Government. The programme aimed to improve the competitiveness of England’s farming and forestry sectors, the rural environment, quality of life and to diversify the rural economy. The programme’s results were measured with means of verification which PSD also uses: data on programme activities, case studies and surveys of programme beneficiaries and non-beneficiaries. Measurement identified a number of opportunities to improve the programme’s delivery.
change, PSD will conduct research which attempts to isolate changes created by PSD’s intervention. E.g. partners will be asked how much they would have changed without PSD support. Where there is lots of uncertainty about what would have happened without PSD’s intervention, PSD will instead estimate how much its contribution influenced the change. Here, PSD will only report its estimated contribution to changes as impact.
o Triangulate, eg complementing closed-question surveys with a few in-depth interviews. This helps
to avoid PSD hearing “what we or they think we want to hear” and not noticing hidden influences, costs or benefits.
Estimating attribution will differ in a pilot phase and during scale up. During the pilot, PSD will validate the different levels of changes in a results chain to ensure that change has occurred triggered by programme activities. I.e. PSD will measure to what extend the change occurred due to the programme activities, and keep asking why change happened at each step.
During the scale up, when there are other factors that are likely to be significantly affecting the change, then the programme needs to layer another method on top of the above to assess attribution.
The table below summarises some of the options that programme staff may use at each step in the results chain; this table is not intended as a hierarchy as different circumstances will determine which options are more appropriate. The options are not mutually exclusive and a mix or combination is often the best strategy; of the MRM Officer and Theme Coordinator will discuss which means of verification will be used for each step in the results chain.23
Means of verification table:
Method Application Advantages Disadvantages
Opinions of key informants and expert interviews
May be important when the key change is driven by one person (e.g. politician changing a policy)
Low cost May be influenced by interviewer; likely to be somewhat subjective.
Comparison of treatment and control group (randomised samples)
When samples are large enough - in measuring changes attributable to one step in the results chain (probably not feasible for the whole model in one trial)
Held by statisticians to be the most reliable way to measure results (albeit based mainly on experiences with simple / single treatments)
Difficult to design and administer if the treatment group is self-selecting (e.g. buying a service). In that case, a randomised sample would need to be refused a service they tried to purchase
Quasi-experimental design (difference of difference - comparing before and after for treatment and control groups)
Often appropriate for pilot efforts and/or measuring attributable changes for one step in the results chain
More approximate, in acknowledging that the control group is not an exact control
Cheaper than randomised controlled trials, but still expensive. Careful design and measurement needed to ensure accuracy. Not valid when the target group is unique, as is often the case with large urban clusters, or when
23 Guidelines to the DCED Standard for Results Measurement: Estimating Attributable Changes, Nabanita Sen, March 2013
22 | P a g e
interventions can influence the control group as well as the treatment group.
Participatory approaches (focus groups etc.)
Where the change in behaviour might have been caused by different factors
May be the only way to show attribution in some cases
May be subjective, open to bias (e.g. high subsidies may attract positive ratings, even though not sustainable)
Observation Where attribution is fairly clear (e.g. resulting from new technology)
Low cost May not be perceived as convincing – especially where attribution is not obvious
Regression Analysis Where a wide range of data can be accurately gathered
Can be reasonably accurate if well designed and executed
High level of skill needed; Accuracy relies on identifying and gathering data on other significant factors contributing to the change
Extrapolation of attribution proven in pilot or case study
Where funds are not available for large-scale measurement
Low cost, relatively convincing
Needs periodic verification by other means (e.g. through surveys or additional case studies)
Trend analysis Where other, larger trends are very significant and trends can be reasonably tracked and estimated
Takes into account larger economic and market trends; relatively low cost
Risks assuming that the identified and measured trends are the only (or main) ones applicable; best used, therefore, in combination with other methods
Case studies analyzing behaviour and performance changes at each step of the results chain
Where qualitative understanding is needed, in order to interpret quantitative data
Low cost; can be a good indication of attribution if well designed and executed
Many not represent the universe of beneficiaries; can be time consuming; may be influenced by interviewers
4.5. Measuring indirect impact
PSD considers as direct impact the benefits to the target group created by PSD’s support to partners (eg cost sharing, training, mentoring etc). I.e. if PSD supports a processor and as a result 50 householders start to cultivate herbs/fruit, these householders’ additional employment and income will be considered as direct impact.
Indirect impact is defined as benefits to the target group and/or companies as the result of copying and crowding in that takes place without project support.
Crowding in is the process through which interventions catalyse or bring in other players and functions in the market system so that it works better for the poor24.
Example of crowding in: PSD supports targeted enterprises to start providing a new service, by supplying training. Other enterprises see that this training can be profitable, and start supplying it as well.
24 The Operational Guide for the M4P Approach, Springfield Centre
23 | P a g e
New target enterprises or workers who benefit from this crowding in are referred to as ‘copying’; their additional employment and income are considered indirect impact.
Unassisted crowding in and copying are frequently slow; they require market players to understand very clearly how a new innovation can benefit them, how they can adopt it, and be willing to risk investing in the innovation. When designing an intervention, Intervention Managers should consider when unassisted crowding in and copying can realistically be expected to occur. Then, set indicators at the appropriate levels to monitor progress. Examples of such indicators include:
Number of players who adopt new business model, without assistance from the project. Number of farmers who adopt new cultivation practices, due to assistance from a processor who
has not received direct project support.
While measuring direct impact is relatively straightforward, measuring indirect impact may be extremely challenging.
PSD will look for the changes in the market system and try to find evidence of copying and crowding. This involves visiting market players, both those directly supported by the programme, and those who are not. When interviewing partners, PSD will ask if partners are aware of other organisations which have changed their practices due to PSD-supported changes. If so, PSD will follow up with these organisations. PSD will informally ask them to verify where they got the idea to change from. Where possible, PSD will try to measure what impact the crowding-in enterprises have on PSD’s target group, disaggregating as always by gender and youth.
PSD also measures indirect impact, when rural households spread an innovation between themselves. For example, when PSD supports the cultivation of a new fruit variety, and beneficiaries give seedlings to other farmers. Where this is likely, PSD includes a question in surveys and interviews with known beneficiaries, asking if they have shared knowledge/ inputs with other enterprises/ rural households. If they have, and if PSD was unaware of this, the PSD interviewer will ask for contact details of the ‘copying’ enterprises/ rural households. PSD will then interview these ‘copiers’ to find out how much they have benefited from the information.
Documenting assumptions and calculations
Systemic change is normally expected to impact large number of people or businesses. Consequently, it will generally be impossible to survey or measure all of them. Instead, assumptions are used to calculate the impact, based on a fairly representative sample of data. All assumptions and calculations should be clearly documented and explained. The RM Specialist will decide the sample size for each survey. The sample size will primarily depend on the means of verification, how many beneficiaries the intervention is thought to have reached, how much impact is expected to vary between beneficiaries and the overall, expected size of impact. High-impact interventions will be measured more rigorously.
Section Five: Reporting
As required by SDC, PSD reports on semiannual basis with two types of reports: Operational report and financial report. Both reports are presented at the same time so that SDC can compare results achieved with costs, for each market. By results, we mean changes in each Impact-level logframe indicators, as per the latest measurement. By costs, we mean how much PSD had spent in a market at the time when results of that market’s interventions were last measured.
24 | P a g e
The format of the reports is set by SDC25.
PSD’s semiannual reports to SDC should note which other development programmes or government initiatives are supporting PSD’s target group, in the same target sectors as PSD, and outline how. The description of other programmes or government initiatives should be presented in the Annex of the Operational report. If other government or donor-funded initiatives have contributed to the results, PSD writes clearly and honestly in this report how they have done so.
PSD will produce case studies for SDC and wider development community when interventions show enough evidence of sustainability and systemic change.
On a more general note, the efforts on the MRM system are necessarily aimed to enable accountability towards the donor through regular external reporting. The reports need to be comprehensive yet concise, they need to reflect on the expected information, and most importantly the reports need to be accurate and up to date. Presenting the correct monitoring data and current challenges is as important as underlining the progress and successes.
Section Six: Roles and Responsibilities
Intervention managers are not accountable for how many interventions they complete, but for maximising long-term results. Intervention managers therefore need to understand first-hand if the programme is having the desired results. This will only happen if Intervention Managers are given enough time to be involved in measurement. All MRM related responsibilities need careful planning, and oversight from the Team Leader. Hence, within PSD, monitoring and results measurement is part of all everyone’s job. All technical staff job descriptions and performance reviews include monitoring, results measurement and analysis of results.
The table below summarises roles and responsibilities of different PSD team members.
Task Who is responsible
Research to inform the selection and/or design of a new intervention.
Intervention Managers with the support from MRM officer
Drafting the Intervention Guide when a new intervention is being considered/ designed
Intervention Managers. Quality control and finalizing is done by MRM officer
Gender inclusion in the intervention Intervention Managers with the support by Gender focal point
Deciding on study methodology MRM officer with help from the Intervention Manager
Deciding when data needs to be gathered MRM Officer with the help from Intervention Managers
Deciding who will gather data MRM Officer
Drafting surveys/ questionnaires Intervention Managers with help from MRM officer
Checking surveys/ questionnaires MRM officer
Training enumerators MRM officer
Supervising enumerators during data collection MRM officer
25 Format of reports are available from the RM specialist and Project Assistant.
25 | P a g e
Cleaning and analysing data MRM officer
Calling back respondents, where data is missing or unclear
Intervention Managers if they originally conducted the interview
Enumerators if they originally conducted the interview, after receiving instructions from MRM officer
Using results in decision-making Intervention Managers with the help from MRM officer
Updating IG (including results chains, projections and references to researches that underpin assumptions)
Intervention Managers, checked and finalized by MRM officer
Training new staff on measurement MRM officer with the support from Intervention Managers
Aggregating results MRM officer
Reporting results to SDC MRM officer drafts the Operational report. Project Assistant drafts financial report. Theme Leader gives final approval of both reports
Writing case studies MRM officer with the support from Intervention Managers. Final approval given by Team leader
Making any necessary changes to PSD’s approach to measurement
MRM Officer with the approval from Team Leader
Annex 1 – Gender and youth
Promoting gender equality and empowering women is a priority for all agencies involved in development. The importance of Women’s Economic Empowerment (WEE): the economic advancement of women, their access to opportunities and life chances, assets, services and support and the development of decision making authority in public and private spheres, is widely recognized as being essential to economic growth and poverty reduction worldwide.
As a result of the economic crisis, youth unemployment in Europe has grown, even in the most developed countries. Youth unemployment is an important indicator of the future development of the economy and social development.
The overall economic situation in Serbia hampers the creation of new job opportunities, especially for young job-seekers and women. This is why PSD is putting particular focus on youth26 and women when stimulating systemic market development in selected sectors and value chains.
26 Persons between 15 and 30 years old are considered as youth in Serbia, National strategy for youth, Republic of Serbia
26 | P a g e
The PSD programmes want to know if youth and women in targeted regions are benefiting from the changes in market systems stimulated by PSD. At minimum, monitoring of each intervention should measure the following:
How many young people below 30 and women are benefiting as the result of intervention. How many additional jobs are created as the result of intervention for youth and women How much additional income youth and women generate as the result of intervention. How many youth and women have access to innovations supported by the intervention.
For this to happen, PSD disaggregate all impact indicators by gender and youth and non-youth. PSD disaggregate those indicators at lower levels of the results chain which track changes with the potential to exclude women and youth. For example, if PSD facilitates changes which lead to the creation of a new training course, PSD would measure women’s participation in this training course.
As well as tracking and reporting on sex-disaggregated indicators, PSD also measures women’s economic empowerment in other ways. Where a PSD intervention can empower women, for example by giving women greater access to technical knowledge from which they have historically been excluded, PSD first gender-sensitizes the results chain. PSD adds boxes describing how its activities will stimulate changes which the market works better for women. Next, PSD adds indicators, to assess how much women are economically empowered by the intervention. Examples of the WEE indicators include:
• Women’s access to public decision making - # of women accessing public decision making fora/ # of decisions made/ WEE initiatives generated by public women’s fora/ % increase in annual budget allocated to Local Gender Committee , by the end of the programme/annually/during the programme
• Women’s control over HH income - # of women exercising control over the use of HH income, by the end of the programme/annually/during the programme
• Women’s use of knowledge & skills provided through programme interventions - # of women using knowledge & skills/information provided through programme interventions to access livelihood options/make choices regarding livelihood options/skills/training, by the end of the programme/annually/during the programme
Annex 2 – Sustainability, systemic change and scale
Sustainability is essential to the PSD programme and it is considered from the early stages of the intervention design.
Sustainability can be defined as the capability of the market system to ensure that relevant, differentiated products and services continue to be offered beyond the period of intervention27.
Sustainability, systemic change and scale are closely related.
For M4P projects indications that systemic change is taking place include crowding in (e.g. service or input providers starting services similar to those developed with the project support), copying (e.g. enterprises copying improvements introduced in other companies with project support), sector growth (businesses grow, new entrants to the market), changes along the value chain resulting from project support at a certain level, and other indirect impact (e.g. the emergence of a related service in completely different sectors)28.
27 The Springfield Centre28 Adam Kessler with Nabanita Sen, February 2013, Guidelines to the DCED Standard for Results Measurement: Capturing Wider Changes in the System or Market
27 | P a g e
Systemic change is often important to achieving scale. However, some level of scale can be achieved without immediate systemic change, by providing direct assistance to replication for instance. In that case, an M4P project will expect that replication would lead to systemic change as more market players become aware of the advantages of the innovation others have adopted.
PSD monitors and measures each of the interventions’ progress towards sustainability and scale. For this purpose, PSD uses the Adopt, Adapt, Expand and Respond matrix.
Elements of systemic change29:
Each intervention is different and requires a different approach to assessing changes, but each of them needs to have relevant sustainability indicators. PSD’s choice of sustainability indicators, linked to the results chain and included in the measurement plan, is informed by the concepts of Adopt, Adapt, Expand and Respond.
In the table below are some examples of the types of sustainability indicators30 which Intervention Managers should include in their measurement plans. It is not necessary that each intervention has all indicators listed in the table, but it is necessary to select those indicators that can best fit to the intervention and give the answer to the question “will the changes last after the intervention stops?”
Examples of the sustainability indicators:
Stage Question Indicator
Adopt If programme support stops, will partners return to their previous way of working?
Benefits for the partner: change in partners’ costs and revenues due to innovation; number of new customers/contract partner gain from the pilot;
Satisfaction level: partners’ satisfaction with pilot results; target group satisfaction with new product/service
Partners’ investment/share of investment: partners’ share in the cost of pilot (financial and non-financial)
Adapt If programme support Independent investment/continuation of investment: partners’ investment in
29 Resource: The Springfield Centre 30 This list of indicators is not final, indicators can be added with regard to the specific intervention
28 | P a g e
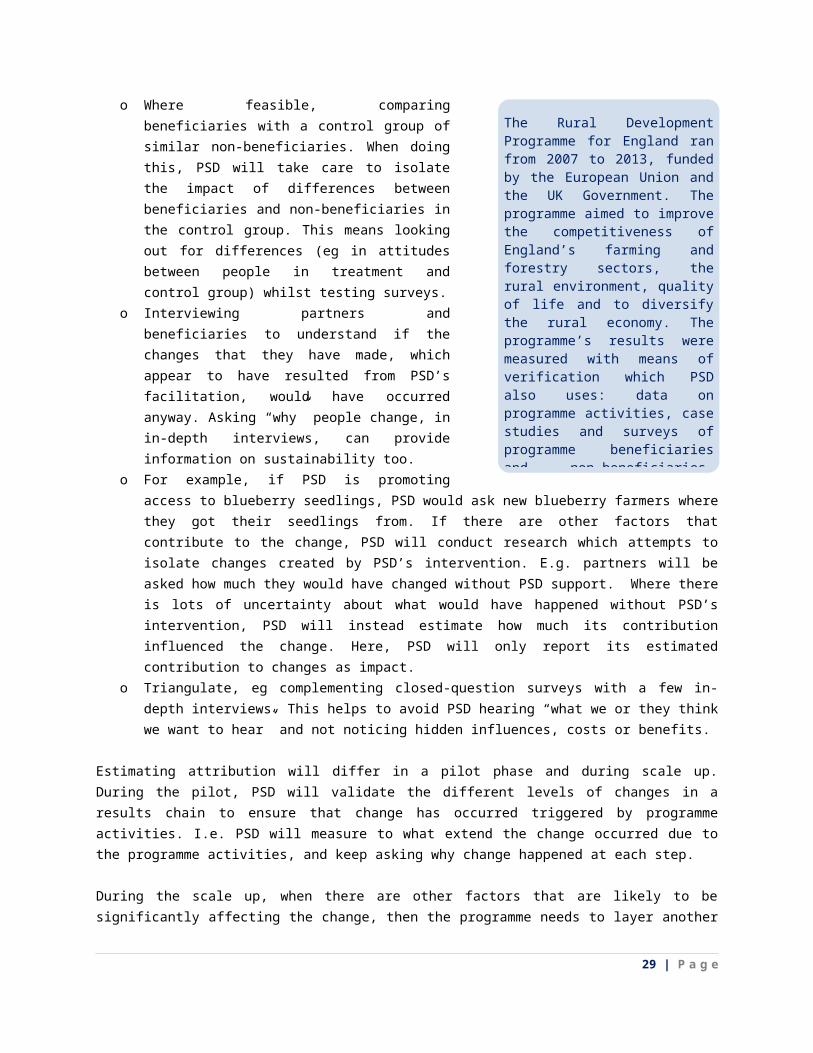
stops, will partners’ upgrade the innovation they have adopted?
innovation after the programme support ends; partners’ independent investment in improvements; description of the improvements made by partners’
Target group continue to benefit from the innovation: number of people benefiting from the innovation is increasing
Partners’ business model changed/adjusted due to the innovations: description of the changes in partners’ business model or strategy (eg new staff recruited and dedicated to work with innovation, job description of current staff amended, changes in budget)
Expand If programe support stops, will target group depend on few firms?
Original partners carry forward the innovation: eg roll out to new regions - number of new regions; number of potential target group that can be reached in new regions
Crowding in: number of market players that copy changes or improve due to the changes; number and capacities of scale agents involved (players that can influence others to adopt the innovation)
Competition or collaboration in the market: level of competition between market players; assessment of the barriers that new adopters would face; level of collaboration between partners; explanation and description of the collaboration (eg joint ventures, joint actions toward institutions, advocacy)
Respond If programme support stops, will partners be able to respond to challenges?
Resilience and flexibility: evidence on the system ability to resists to external factors (shocks)
Responsiveness: evidence that players in core and supporting market system are flexible to the changes (eg adjustment of the practices, revised regulations)
Annex 3 – Tips on conducting good research
Research is a part of a broader results measurement system. High quality research will not show impact by itself. It should be backed up by a clear results chain, relevant indicators, and a solid attribution strategy. The starting point of the research is to ensure that intervention has a well-developed results chain. This will show exactly what type of changes are expected, and so help frame the research question.
This section will outline some of the main tips related to the research practices most commonly used by PSD programme. Readers can find more information on practical tips in Practical Guidelines for conducting research31.
The most common methods of data collection used by the PSD programme are in-depth interviews and surveys.
SurveySurvey is the one of the most widely used modes of data collection. A survey collects data from a large number of people, using a standardized set of questions.
31 http://www.enterprise-development.org/page/download?id=2133
29 | P a g e
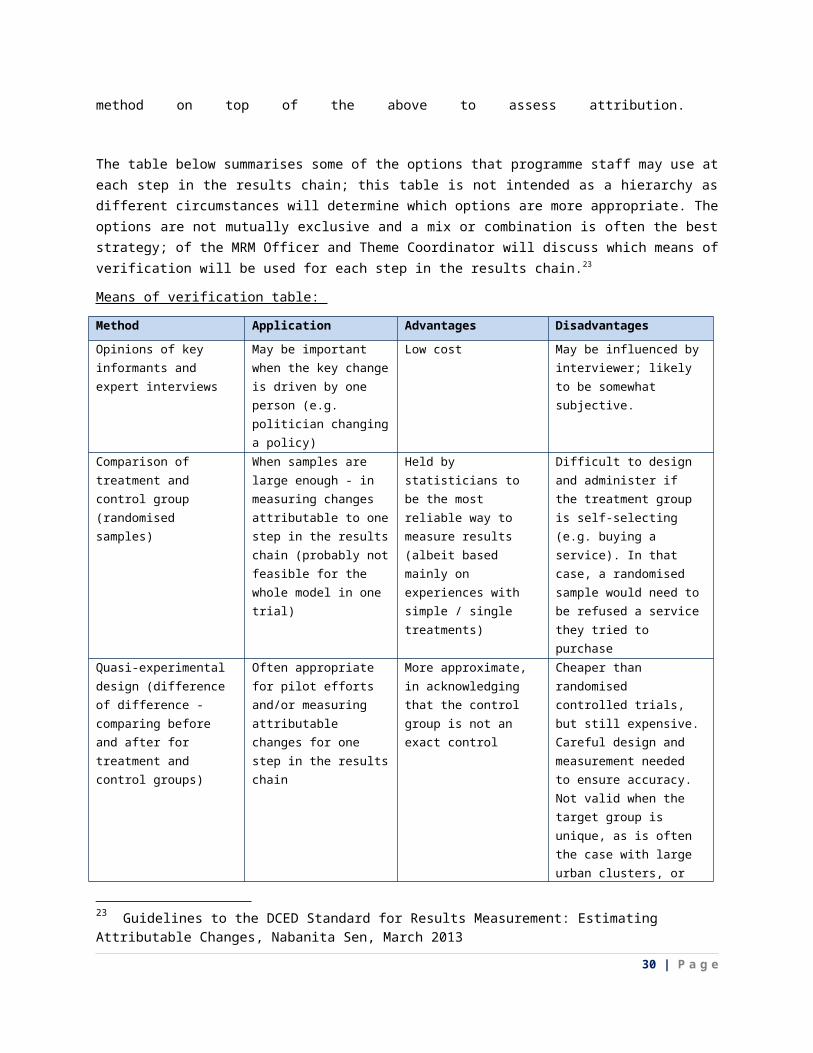
Advantages: give quantified, reliable data on a wide range of issues e.g. opinions and needs of stakeholders, the socio-economic situations of various groups, changes in income, perception, and more; useful for answering quantitative questions, such as establishing changes in income, employment, or growth rates of firms; useful to evaluate impact of the programmeDisadvantages: often resource intensive, less useful for uncovering perceptions of the project, sensitive issues, or unanticipated benefits, may give a simplistic picture of the situation
Tips for conducting a good survey32:
o Keep it simple, clear, easy, and short.
o If there are similar surveys conducted by others, find them and review
o Make sure the questions are well worded
o Avoid double-barrelled or double negative questions.
o Use multiple items to measure abstract constructs.
o Do not use "leading" or "loaded" questions.
o To improve quality of the major surveys, pilot them first
o If the survey is conducted by external enumerators, ensure that they are they are properly
briefed. It is useful to conduct a mock interview session with themo Look for opportunities to group together indicators and measure them together in one
survey/questionnaire.
Determining sample size
Sample sizes for surveys and interviews are decided by the RM specialist. In theory, the sample size should be representative of the targeted population. In practice, time and fund limitations often mean that samples are smaller, and a combination of qualitative and quantitative research methods are used to partly compensate.
The RM specialist will decide on sample size case-by-case.
In some cases PSD may use smaller samples because there is little variation between respondents. For example, if after interviews with 20 respondents PSD receives the same answers (saturation), the RM specialist may decide that that it is unnecessary to interview more respondents.
Also, where there will be less variation within control group, the control group can be smaller.
When choosing sample size, control and treatment group will be treated as separate populations.
Where it is necessary to conduct more robust surveys, and when it is feasible, MRM officer will decide to increase sample size.
Annex 4 – Business model example33
32 Source: DCED33 Blueberry production
30 | P a g e


![^JfEWS :] THE CilMOEN~MRm~](https://img.pdfslide.us/doc/110x75/61ed4499603c703d6079ce65/jfews-the-cilmoenmrm.jpg)