Embed Size (px)
Citation preview
NBN Co Limited
© NBN Co Limited 2013 Page 1 of 19 19 April 2013
Report to
Parliamentary Joint Committee
on the
National Broadband Network Financial and Rollout Data
19 April 2013
NBN Co Limited
© NBN Co Limited 2013 Page 2 of 19 19 April 2013
TABLE OF CONTENTS
TABLE OF EXHIBITS ................................................................................................................................................ 3
1 CAPITAL EXPENDITURE .................................................................................................................................. 4
1.1 FTTP ACCESS ........................................................................................................................................................... 5
1.2 FTTP CUSTOMER CONNECT ........................................................................................................................................ 6
1.3 GREENFIELDS (NEW DEVELOPMENTS & INFILLS) .............................................................................................................. 7
1.4 TRANSIT ................................................................................................................................................................. 10
1.5 FIXED WIRELESS AND SATELLITE.................................................................................................................................. 11
2 OPERATING EXPENDITURE .......................................................................................................................... 12
3 PRICING ....................................................................................................................................................... 13
4 TAKE-UP ...................................................................................................................................................... 15
5 USAGE ......................................................................................................................................................... 17
6 ACTIVITY PROFILE ........................................................................................................................................ 18
NBN Co Limited
© NBN Co Limited 2013 Page 3 of 19 19 April 2013
TABLE OF EXHIBITS
EXHIBIT 1-1: BREAKDOWN OF TOTAL ESTIMATED CAPITAL COSTS TO FY2021 ($ BILLION) (NOMINAL DOLLARS) 4
EXHIBIT 1-2: TOTAL ESTIMATED CAPITAL COSTS TO FY2021 ($ BILLION) (NOMINAL DOLLARS) ............................ 4
EXHIBIT 1-3: DIAGRAM OF TRANSIT AND FIBRE ACCESS NETWORK (BROWNFIELDS SINGLE DWELLING UNIT) .... 5
EXHIBIT 1-4: FTTP ACCESS COST PER PREMISE PASSED ($ PER PREMISE) (NOMINAL DOLLARS) ........................... 5
EXHIBIT 1-5: DIAGRAM OF TRANSIT AND FIBRE ACCESS NETWORK (BROWNFIELDS SINGLE DWELLING UNIT) .... 6
EXHIBIT 1-6: FTTP CUSTOMER CONNECT – DEMAND DROPS COST PER PREMISE SINGLE DWELLING UNITS ($
PER PREMISE) (NOMINAL DOLLARS) .............................................................................................................. 6
EXHIBIT 1-7: DIAGRAM OF TRANSIT AND FIBRE ACCESS NETWORK (GREENFIELDS SINGLE DWELLING UNIT) ...... 7
EXHIBIT 1-8: BREAKDOWN OF TOTAL ESTIMATED CAPITAL COSTS FOR GREENFIELDS TO FY2021 ($ BILLION)
(NOMINAL DOLLARS) ..................................................................................................................................... 7
EXHIBIT 1-9: GREENFIELDS CUSTOMER CONNECT COST PER PREMISE SINGLE DWELLING UNITS ($ PER
PREMISE) (NOMINAL DOLLARS) ..................................................................................................................... 8
EXHIBIT 1-10: NEW DEVELOPMENTS IN-ESTATE COST PER PREMISE ($ PER PREMISE) (NOMINAL DOLLARS) ...... 8
EXHIBIT 1-11: COST PER CONNECTIVITY LINK ($ PER METRE) ................................................................................ 9
EXHIBIT 1-12: COST PER NEW DEVELOPMENTS TFAN (CABINET) .......................................................................... 9
EXHIBIT 1-13: TOTAL ESTIMATED CAPITAL COSTS FOR TRANSIT TO FY2021 ($ BILLION) (NOMINAL DOLLARS) .. 10
EXHIBIT 1-14: FIXED WIRELESS CAPITAL COSTS PER SITE (NOMINAL DOLLARS) .................................................. 11
EXHIBIT 1-15: TOTAL ESTIMATED CAPITAL COSTS FOR LONG TERM SATELLITE SOLUTION ($ BILLION) (NOMINAL
DOLLARS) ..................................................................................................................................................... 11
EXHIBIT 2-1: BREAKDOWN OF TOTAL ESTIMATED OPERATING EXPENDITURE TO FY2021 ($ BILLION) (NOMINAL
DOLLARS) ..................................................................................................................................................... 12
EXHIBIT 2-2: TOTAL ESTIMATED OPERATING EXPENDITURE TO FY2021 ($ BILLION) (NOMINAL DOLLARS) ........ 12
EXHIBIT 3-1: 12 MBPS / 1 MBPS $ PER MONTH REAL WHOLESALE PRICES - 30GB / MONTH ALLOWANCE
(CONSTANT) ................................................................................................................................................. 13
EXHIBIT 3-2: 100 MBPS / 40 MBPS $ PER MONTH REAL WHOLESALE PRICES - 100GB / MONTH ALLOWANCE
(CONSTANT) ................................................................................................................................................. 13
EXHIBIT 3-3: 1000 MBPS / 400 MBPS $ PER MONTH REAL WHOLESALE PRICES - 300GB / MONTH ALLOWANCE
(CONSTANT) ................................................................................................................................................. 14
EXHIBIT 4-1: PREMISES CONNECTED – ALL TECHNOLOGIES ................................................................................. 15
EXHIBIT 4-2: TAKE-UP COMPARISON – FTTP BROWNFIELDS ................................................................................ 15
EXHIBIT 4-3: FIBRE SPEED PROFILE ....................................................................................................................... 16
EXHIBIT 5-1: FIXED VERSUS MOBILE BROADBAND DOWNLOAD USAGE .............................................................. 17
EXHIBIT 5-2: AVERAGE FIBRE USAGE PER USER PER MONTH (GB) ....................................................................... 17
EXHIBIT 6-1: ACTIVITY PROFILE ............................................................................................................................. 18
NBN Co Limited
© NBN Co Limited 2013 Page 4 of 19 19 April 2013
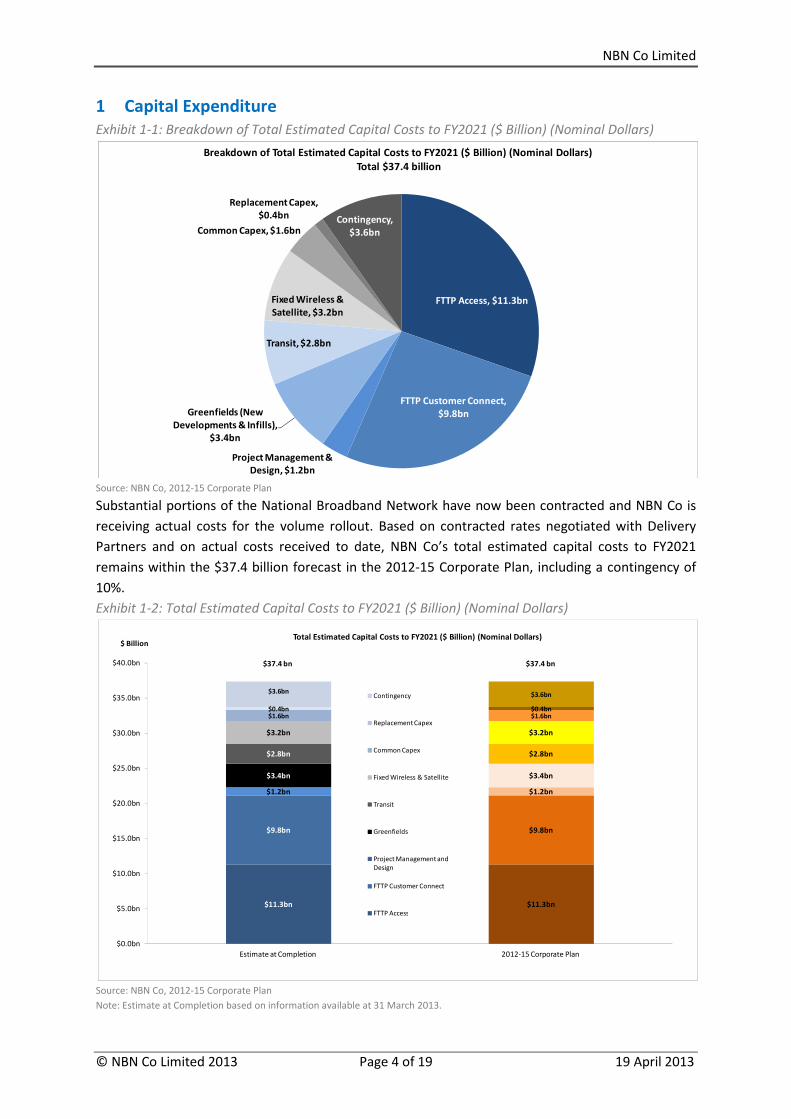
1 Capital Expenditure
Exhibit 1-1: Breakdown of Total Estimated Capital Costs to FY2021 ($ Billion) (Nominal Dollars)
Source: NBN Co, 2012-15 Corporate Plan
Substantial portions of the National Broadband Network have now been contracted and NBN Co is
receiving actual costs for the volume rollout. Based on contracted rates negotiated with Delivery
Partners and on actual costs received to date, NBN Co’s total estimated capital costs to FY2021
remains within the $37.4 billion forecast in the 2012-15 Corporate Plan, including a contingency of
10%.
Exhibit 1-2: Total Estimated Capital Costs to FY2021 ($ Billion) (Nominal Dollars)
Source: NBN Co, 2012-15 Corporate Plan
Note: Estimate at Completion based on information available at 31 March 2013.
FTTP Access, $11.3bn
FTTP Customer Connect,
$9.8bn
Project Management &
Design, $1.2bn
Greenfields (New
Developments & Infills),
$3.4bn
Transit, $2.8bn
Fixed Wireless &
Satellite, $3.2bn
Common Capex, $1.6bn
Replacement Capex,
$0.4bn Contingency,
$3.6bn
Breakdown of Total Estimated Capital Costs to FY2021 ($ Billion) (Nominal Dollars)
Total $37.4 billion
$11.3bn $11.3bn
$9.8bn $9.8bn
$1.2bn $1.2bn
$3.4bn $3.4bn
$2.8bn $2.8bn
$3.2bn $3.2bn
$1.6bn $1.6bn$0.4bn $0.4bn
$3.6bn $3.6bn
$0.0bn
$5.0bn
$10.0bn
$15.0bn
$20.0bn
$25.0bn
$30.0bn
$35.0bn
$40.0bn
Estimate at Completion 2012-15 Corporate Plan
$ BillionTotal Estimated Capital Costs to FY2021 ($ Billion) (Nominal Dollars)
Contingency
Replacement Capex
Common Capex
Fixed Wireless & Satellite
Transit
Greenfields
Project Management and
Design
FTTP Customer Connect
FTTP Access
$37.4 bn $37.4 bn
NBN Co Limited
© NBN Co Limited 2013 Page 5 of 19 19 April 2013
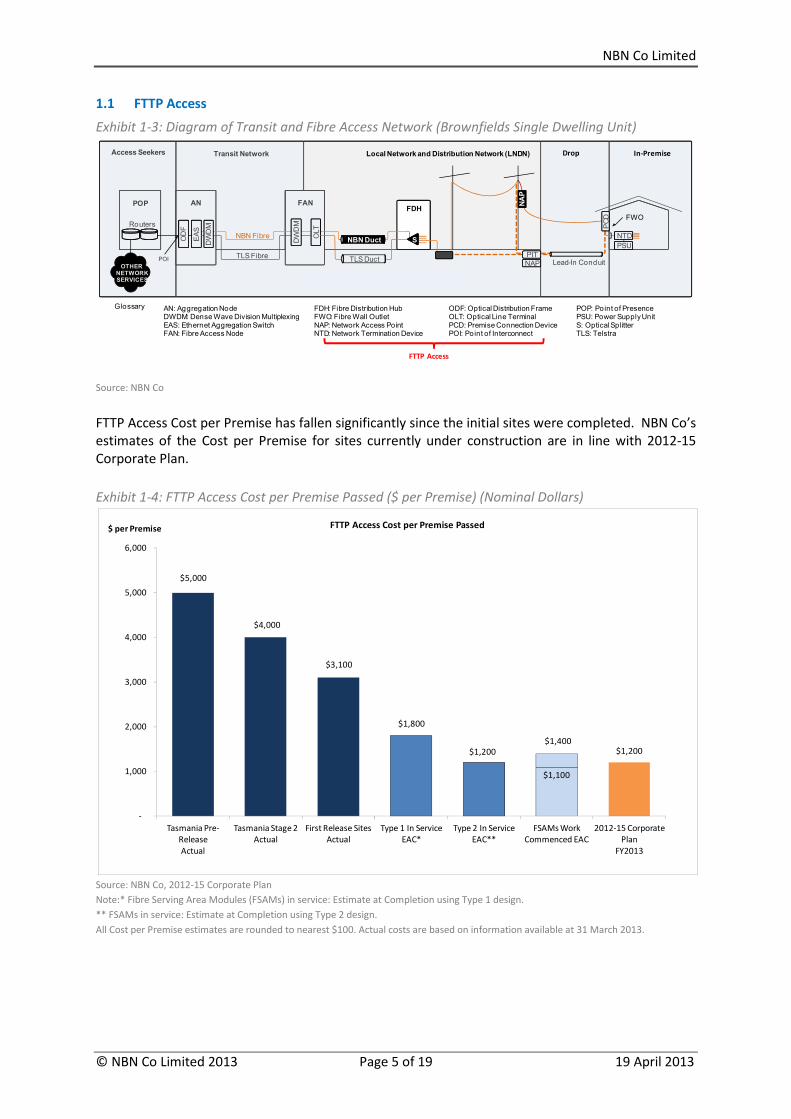
1.1 FTTP Access
Exhibit 1-3: Diagram of Transit and Fibre Access Network (Brownfields Single Dwelling Unit)
Source: NBN Co
FTTP Access Cost per Premise has fallen significantly since the initial sites were completed. NBN Co’s
estimates of the Cost per Premise for sites currently under construction are in line with 2012-15
Corporate Plan.
Exhibit 1-4: FTTP Access Cost per Premise Passed ($ per Premise) (Nominal Dollars)
Source: NBN Co, 2012-15 Corporate Plan
Note:* Fibre Serving Area Modules (FSAMs) in service: Estimate at Completion using Type 1 design.
** FSAMs in service: Estimate at Completion using Type 2 design.
All Cost per Premise estimates are rounded to nearest $100. Actual costs are based on information available at 31 March 2013.
Access Seekers
Telstra Infrastructure
Transit Network
AN
Local Network and Distribution Network (LNDN)
FDH
Lead-In End-User Premises
FAN
PC
D
OTHERNETWORKSERVICES
NAP
NAP
PITLead-In Conduit
OLT
NTD
PSU
EA
S
PITTLS Fibre
DW
DM
DW
DM
NBN Fibre
POP
Routers
POI TLS Duct
NBN DuctOD
F
S
AN: Aggregation NodeDWDM: Dense Wave Division MultiplexingEAS: Ethernet Aggregation SwitchFAN: Fibre Access Node
FDH: Fibre Distribution HubFWO: Fibre Wall OutletNAP: Network Access PointNTD: Network Termination Device
ODF: Optical Distribution FrameOLT: Optical Line TerminalPCD: Premise Connection DevicePOI: Point of Interconnect
POP: Point of PresencePSU: Power Supply UnitS: Optical SplitterTLS: Telstra
Glossary
FWO
Cost Per Premise Passed (LNDN Capex) Cost Per Premise Connected
(Lead-Ins + EUP Equipments)
Drop In-Premise
FTTP Access
$1,800
$1,200
$1,100
$5,000
$4,000
$3,100
$1,400 $1,200
-
1,000
2,000
3,000
4,000
5,000
6,000
Tasmania Pre-
Release
Actual
Tasmania Stage 2
Actual
First Release Sites
Actual
Type 1 In Service
EAC*
Type 2 In Service
EAC**
FSAMs Work
Commenced EAC
2012-15 Corporate
Plan
FY2013
$ per Premise FTTP Access Cost per Premise Passed
NBN Co Limited
© NBN Co Limited 2013 Page 6 of 19 19 April 2013
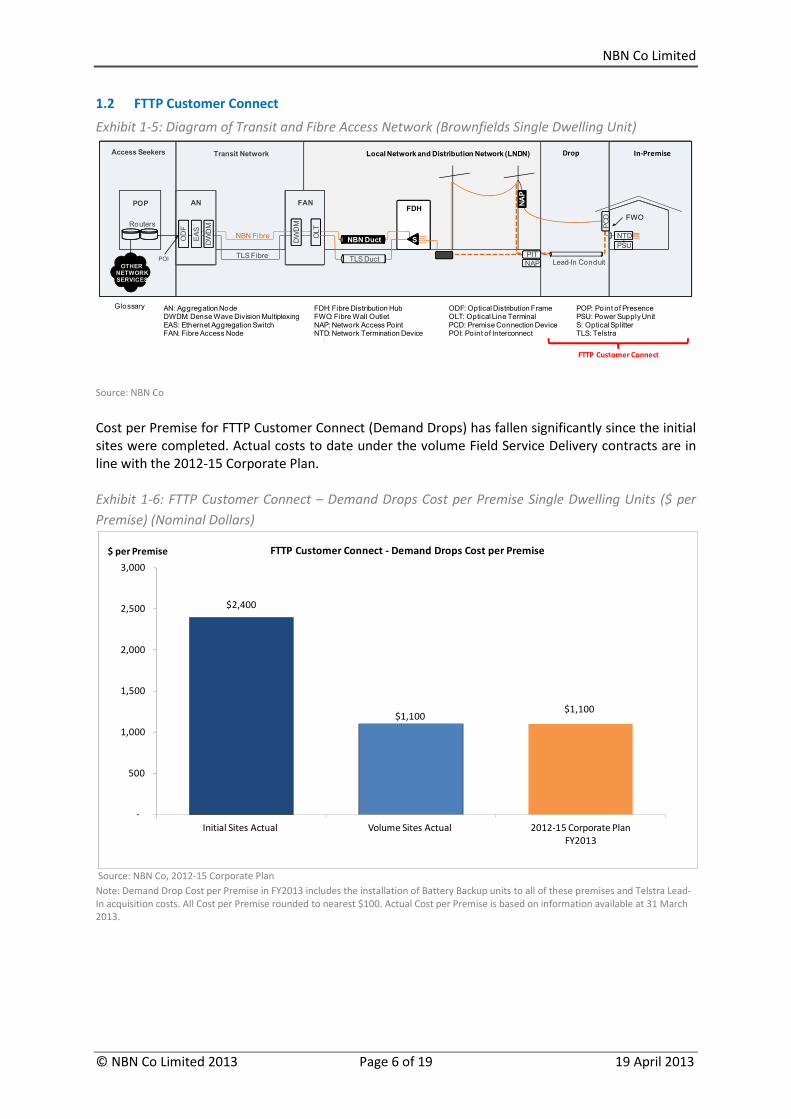
1.2 FTTP Customer Connect
Exhibit 1-5: Diagram of Transit and Fibre Access Network (Brownfields Single Dwelling Unit)
Source: NBN Co
Cost per Premise for FTTP Customer Connect (Demand Drops) has fallen significantly since the initial
sites were completed. Actual costs to date under the volume Field Service Delivery contracts are in
line with the 2012-15 Corporate Plan.
Exhibit 1-6: FTTP Customer Connect – Demand Drops Cost per Premise Single Dwelling Units ($ per
Premise) (Nominal Dollars)
Source: NBN Co, 2012-15 Corporate Plan
Note: Demand Drop Cost per Premise in FY2013 includes the installation of Battery Backup units to all of these premises and Telstra Lead-
In acquisition costs. All Cost per Premise rounded to nearest $100. Actual Cost per Premise is based on information available at 31 March
2013.
Access Seekers
Telstra Infrastructure
Transit Network
AN
Local Network and Distribution Network (LNDN)
FDH
Lead-In End-User Premises
FAN
PC
D
OTHERNETWORKSERVICES
NAP
NAP
PITLead-In Conduit
OLT
NTD
PSU
EA
S
PITTLS Fibre
DW
DM
DW
DM
NBN Fibre
POP
Routers
POI TLS Duct
NBN DuctOD
F
S
AN: Aggregation NodeDWDM: Dense Wave Division MultiplexingEAS: Ethernet Aggregation SwitchFAN: Fibre Access Node
FDH: Fibre Distribution HubFWO: Fibre Wall OutletNAP: Network Access PointNTD: Network Termination Device
ODF: Optical Distribution FrameOLT: Optical Line TerminalPCD: Premise Connection DevicePOI: Point of Interconnect
POP: Point of PresencePSU: Power Supply UnitS: Optical SplitterTLS: Telstra
Glossary
FWO
Cost Per Premise Passed (LNDN Capex) Cost Per Premise Connected
(Lead-Ins + EUP Equipments)
Drop In-Premise
FTTP Customer Connect
$2,400
$1,100$1,100
-
500
1,000
1,500
2,000
2,500
3,000
Initial Sites Actual Volume Sites Actual 2012-15 Corporate Plan
FY2013
$ per Premise FTTP Customer Connect - Demand Drops Cost per Premise
NBN Co Limited
© NBN Co Limited 2013 Page 7 of 19 19 April 2013
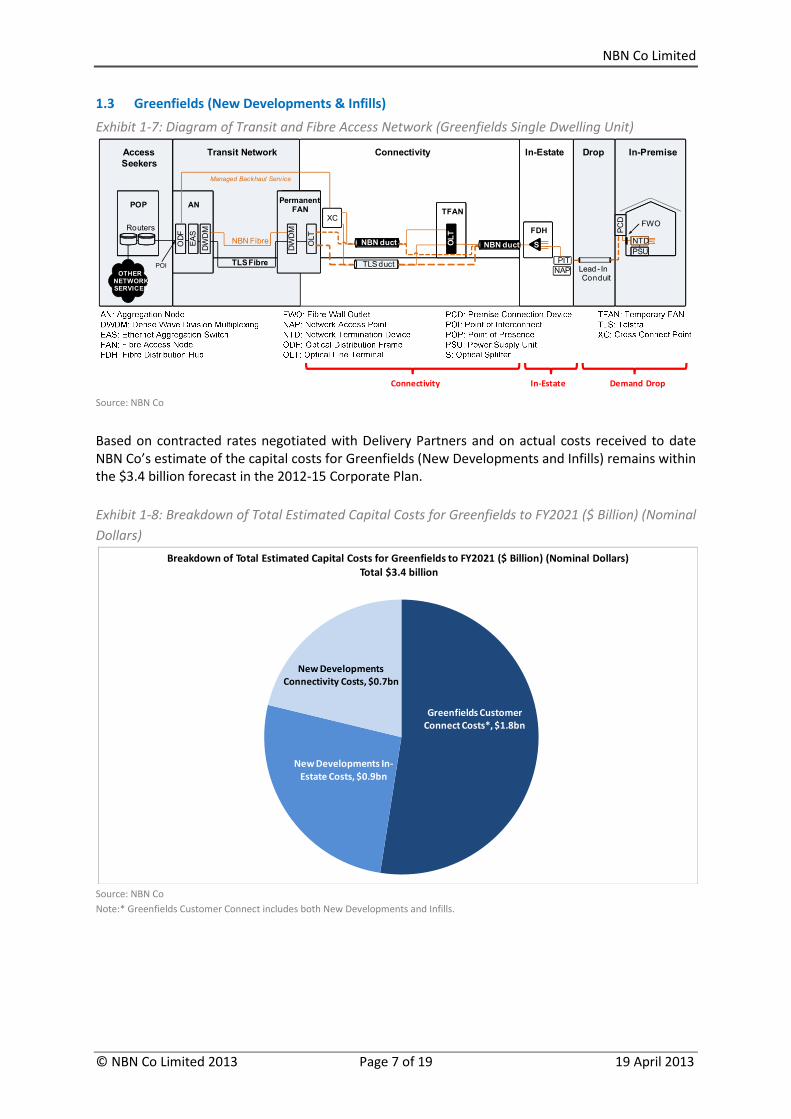
1.3 Greenfields (New Developments & Infills)
Exhibit 1-7: Diagram of Transit and Fibre Access Network (Greenfields Single Dwelling Unit)
Source: NBN Co
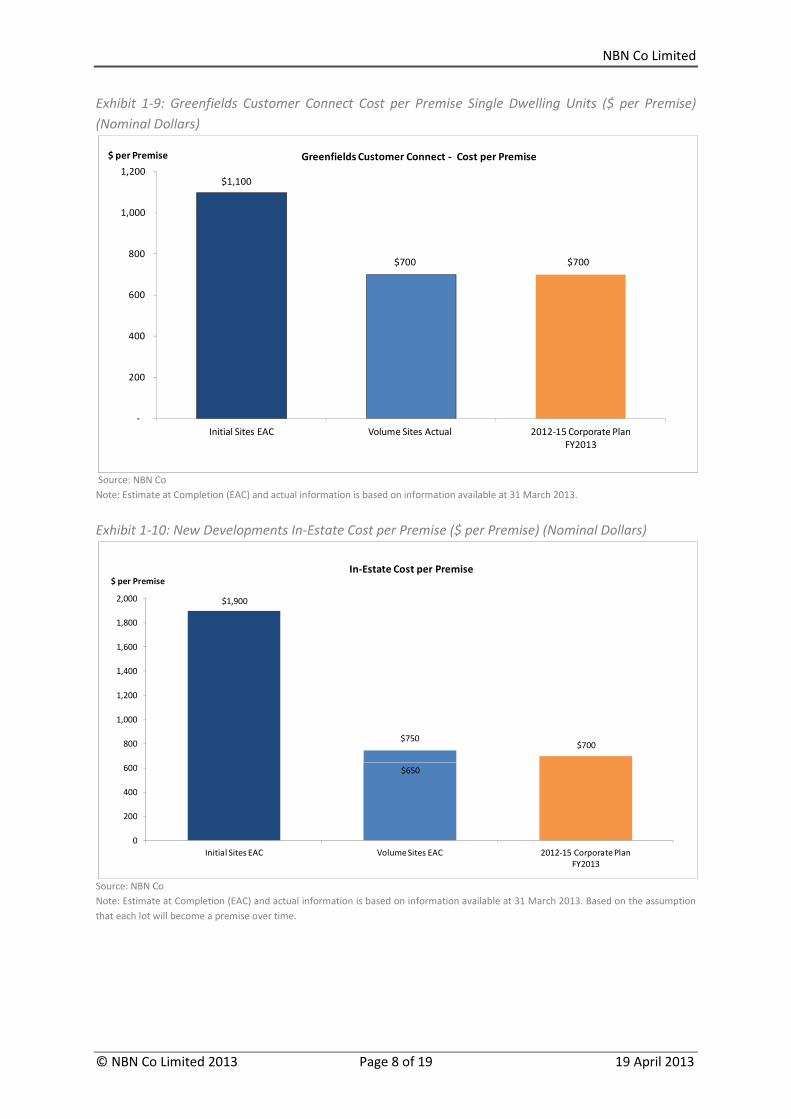
Based on contracted rates negotiated with Delivery Partners and on actual costs received to date
NBN Co’s estimate of the capital costs for Greenfields (New Developments and Infills) remains within
the $3.4 billion forecast in the 2012-15 Corporate Plan.
Exhibit 1-8: Breakdown of Total Estimated Capital Costs for Greenfields to FY2021 ($ Billion) (Nominal
Dollars)
Source: NBN Co
Note:* Greenfields Customer Connect includes both New Developments and Infills.
In-EstateAccess
Seekers
Transit Network
AN
Connectivity Drop In-Premise
PermanentFAN
PC
D
OTHERNETWORKSERVICES
Lead - In Conduit
NTD
PSU
EA
S
TLS Fibre
NBN Fibre
POP
Routers
POI
OD
F
FWOFDH
PIT
S
TFAN
DW
DM
DW
DM
OLT
XC
TLS ductNAP
NBN duct NBN ductOLT
Managed Backhaul Service
Demand DropIn-EstateConnectivity
Greenfields Customer
Connect Costs*, $1.8bn
New Developments In-
Estate Costs, $0.9bn
New Developments
Connectivity Costs, $0.7bn
Breakdown of Total Estimated Capital Costs for Greenfields to FY2021 ($ Billion) (Nominal Dollars)
Total $3.4 billion
NBN Co Limited
© NBN Co Limited 2013 Page 8 of 19 19 April 2013
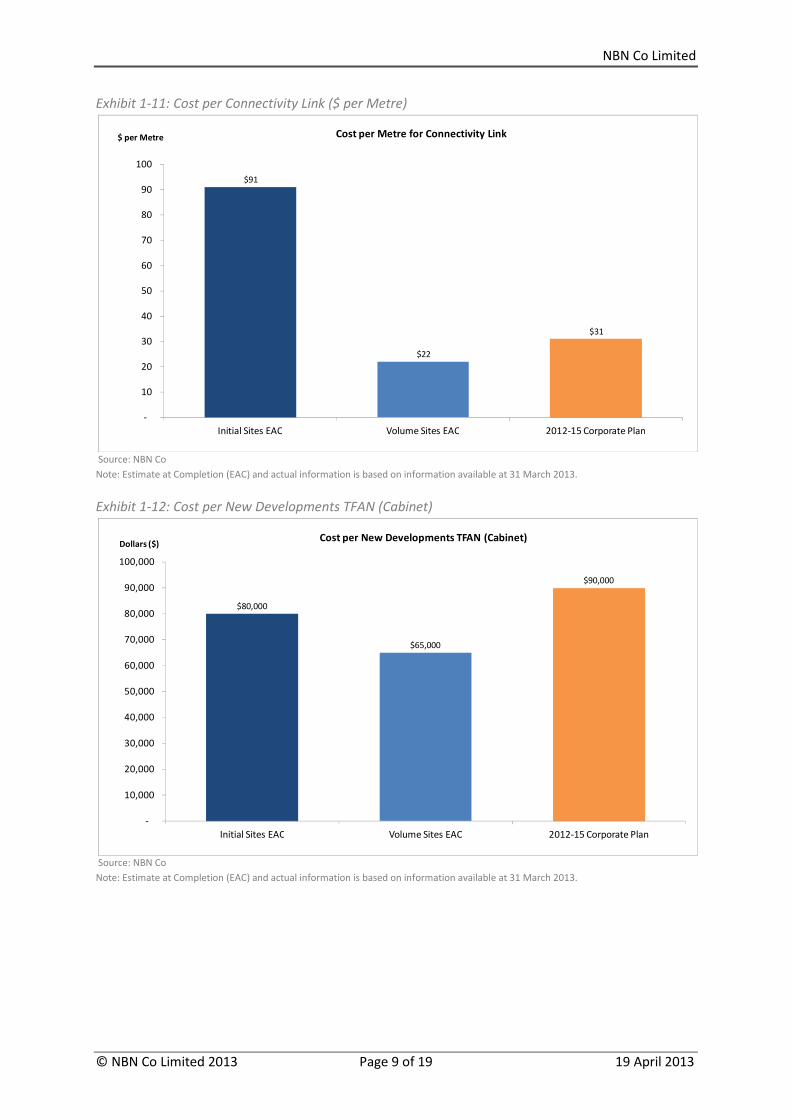
Exhibit 1-9: Greenfields Customer Connect Cost per Premise Single Dwelling Units ($ per Premise)
(Nominal Dollars)
Source: NBN Co
Note: Estimate at Completion (EAC) and actual information is based on information available at 31 March 2013.
Exhibit 1-10: New Developments In-Estate Cost per Premise ($ per Premise) (Nominal Dollars)
Source: NBN Co
Note: Estimate at Completion (EAC) and actual information is based on information available at 31 March 2013. Based on the assumption
that each lot will become a premise over time.
$1,100
$700 $700
-
200
400
600
800
1,000
1,200
Initial Sites EAC Volume Sites Actual 2012-15 Corporate Plan
FY2013
$ per Premise Greenfields Customer Connect - Cost per Premise
$650
$1,900
$750$700
0
200
400
600
800
1,000
1,200
1,400
1,600
1,800
2,000
Initial Sites EAC Volume Sites EAC 2012-15 Corporate Plan
FY2013
$ per Premise
In-Estate Cost per Premise
NBN Co Limited
© NBN Co Limited 2013 Page 9 of 19 19 April 2013
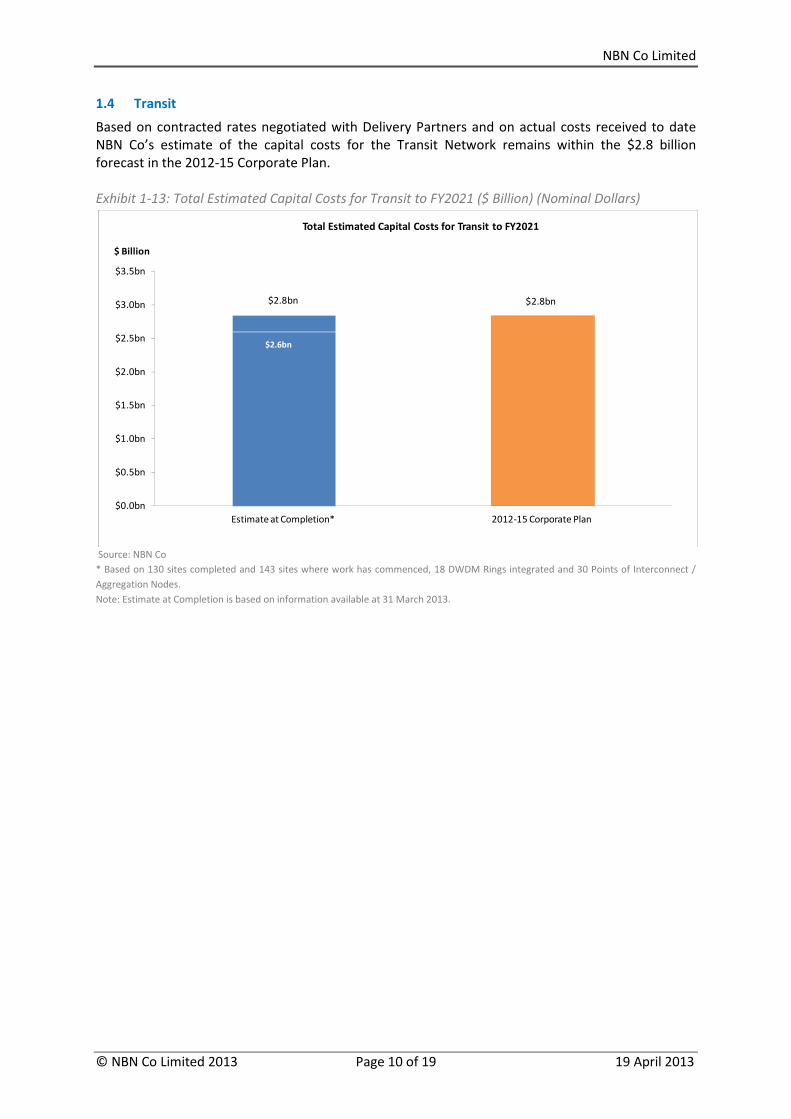
Exhibit 1-11: Cost per Connectivity Link ($ per Metre)
Source: NBN Co
Note: Estimate at Completion (EAC) and actual information is based on information available at 31 March 2013.
Exhibit 1-12: Cost per New Developments TFAN (Cabinet)
Source: NBN Co
Note: Estimate at Completion (EAC) and actual information is based on information available at 31 March 2013.
$91
$22
$31
-
10
20
30
40
50
60
70
80
90
100
Initial Sites EAC Volume Sites EAC 2012-15 Corporate Plan
$ per Metre Cost per Metre for Connectivity Link
$80,000
$65,000
$90,000
-
10,000
20,000
30,000
40,000
50,000
60,000
70,000
80,000
90,000
100,000
Initial Sites EAC Volume Sites EAC 2012-15 Corporate Plan
Dollars ($)Cost per New Developments TFAN (Cabinet)
NBN Co Limited
© NBN Co Limited 2013 Page 10 of 19 19 April 2013
1.4 Transit
Based on contracted rates negotiated with Delivery Partners and on actual costs received to date
NBN Co’s estimate of the capital costs for the Transit Network remains within the $2.8 billion
forecast in the 2012-15 Corporate Plan.
Exhibit 1-13: Total Estimated Capital Costs for Transit to FY2021 ($ Billion) (Nominal Dollars)
Source: NBN Co
* Based on 130 sites completed and 143 sites where work has commenced, 18 DWDM Rings integrated and 30 Points of Interconnect /
Aggregation Nodes.
Note: Estimate at Completion is based on information available at 31 March 2013.
$2.6bn
$2.8bn
$0.0bn
$0.5bn
$1.0bn
$1.5bn
$2.0bn
$2.5bn
$3.0bn
$3.5bn
Estimate at Completion* 2012-15 Corporate Plan
$ Billion
Total Estimated Capital Costs for Transit to FY2021
$2.8bn
NBN Co Limited
© NBN Co Limited 2013 Page 11 of 19 19 April 2013
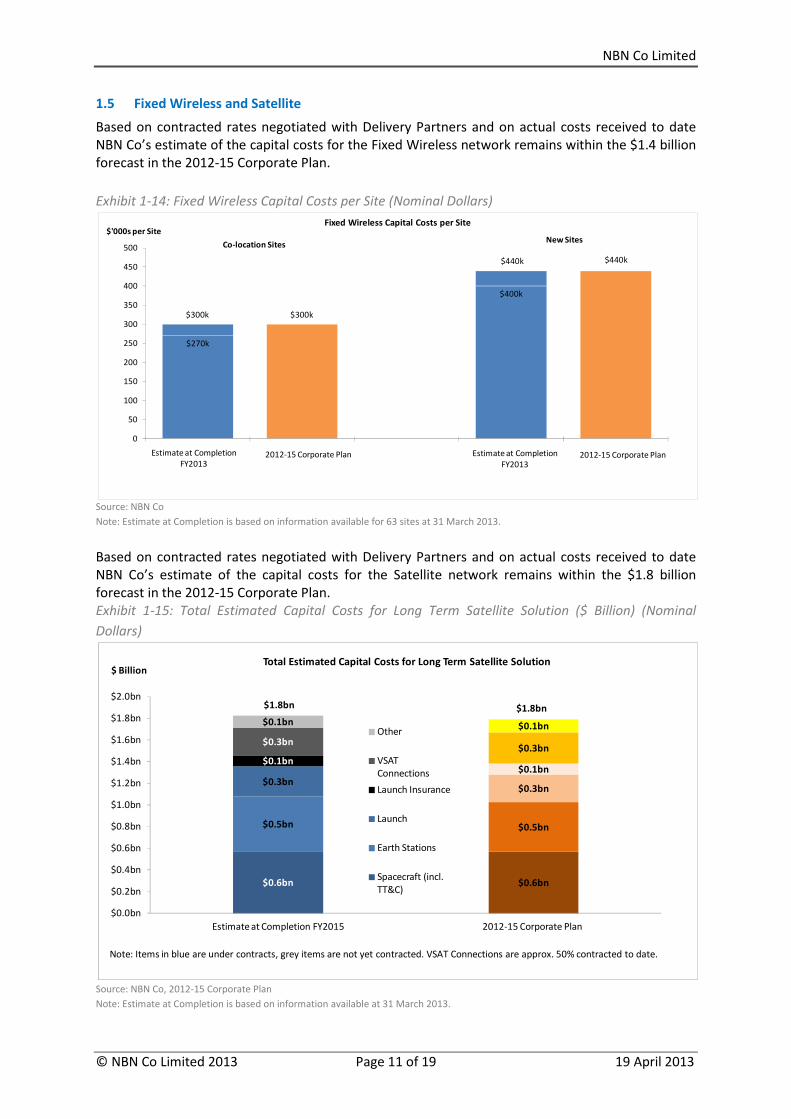
1.5 Fixed Wireless and Satellite
Based on contracted rates negotiated with Delivery Partners and on actual costs received to date
NBN Co’s estimate of the capital costs for the Fixed Wireless network remains within the $1.4 billion
forecast in the 2012-15 Corporate Plan.
Exhibit 1-14: Fixed Wireless Capital Costs per Site (Nominal Dollars)
Source: NBN Co
Note: Estimate at Completion is based on information available for 63 sites at 31 March 2013.
Based on contracted rates negotiated with Delivery Partners and on actual costs received to date
NBN Co’s estimate of the capital costs for the Satellite network remains within the $1.8 billion
forecast in the 2012-15 Corporate Plan.
Exhibit 1-15: Total Estimated Capital Costs for Long Term Satellite Solution ($ Billion) (Nominal
Dollars)
Source: NBN Co, 2012-15 Corporate Plan
Note: Estimate at Completion is based on information available at 31 March 2013.
$270k
$400k
$300k
$440k
$300k
$440k
0
50
100
150
200
250
300
350
400
450
500
$'000s per SiteFixed Wireless Capital Costs per Site
New SitesCo-location Sites
2012-15 Corporate Plan Estimate at Completion
FY20132012-15 Corporate Plan Estimate at Completion
FY2013
$0.6bn $0.6bn
$0.5bn $0.5bn
$0.3bn$0.3bn
$0.1bn$0.1bn
$0.3bn$0.3bn
$0.1bn $0.1bn
$0.0bn
$0.2bn
$0.4bn
$0.6bn
$0.8bn
$1.0bn
$1.2bn
$1.4bn
$1.6bn
$1.8bn
$2.0bn
Estimate at Completion FY2015 2012-15 Corporate Plan
$ BillionTotal Estimated Capital Costs for Long Term Satellite Solution
Other
VSAT
Connections
Launch Insurance
Launch
Earth Stations
Spacecraft (incl.
TT&C)
Note: Items in blue are under contracts, grey items are not yet contracted. VSAT Connections are approx. 50% contracted to date.
$1.8bn$1.8bn
NBN Co Limited
© NBN Co Limited 2013 Page 12 of 19 19 April 2013
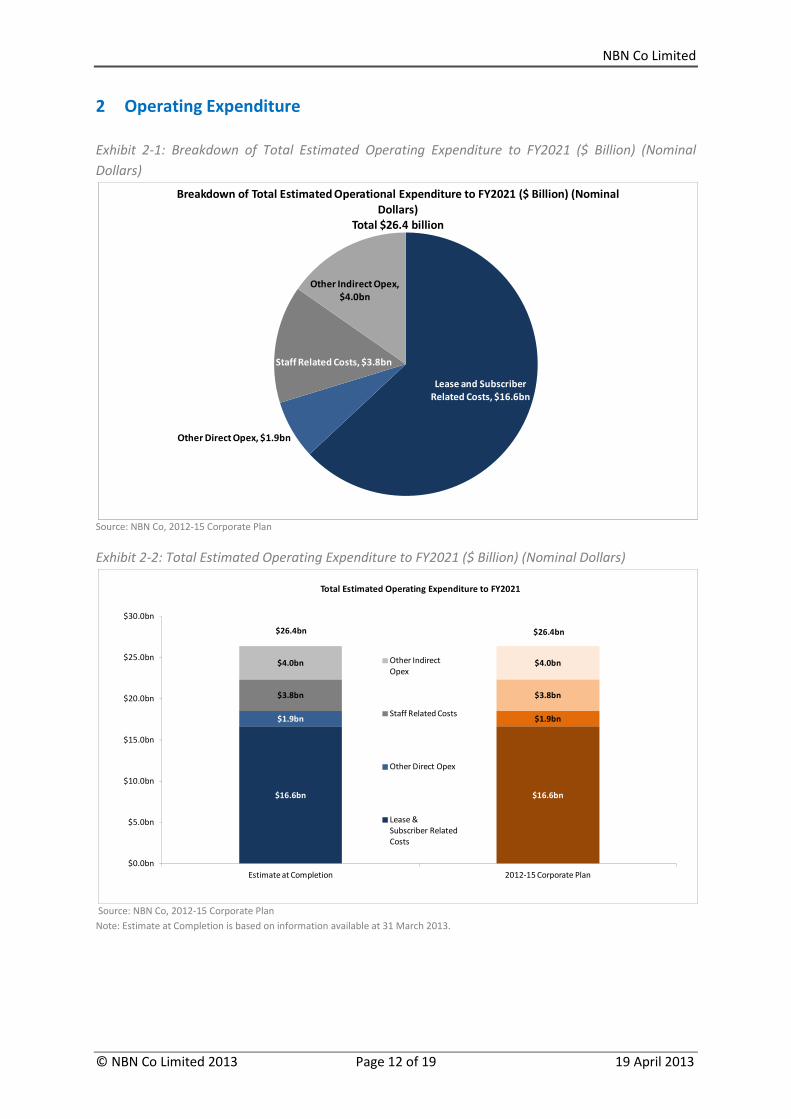
2 Operating Expenditure
Exhibit 2-1: Breakdown of Total Estimated Operating Expenditure to FY2021 ($ Billion) (Nominal
Dollars)
Source: NBN Co, 2012-15 Corporate Plan
Exhibit 2-2: Total Estimated Operating Expenditure to FY2021 ($ Billion) (Nominal Dollars)
Source: NBN Co, 2012-15 Corporate Plan
Note: Estimate at Completion is based on information available at 31 March 2013.
Lease and Subscriber
Related Costs, $16.6bn
Other Direct Opex, $1.9bn
Staff Related Costs, $3.8bn
Other Indirect Opex,
$4.0bn
Breakdown of Total Estimated Operational Expenditure to FY2021 ($ Billion) (Nominal
Dollars)
Total $26.4 billion
$16.6bn $16.6bn
$1.9bn $1.9bn
$3.8bn $3.8bn
$4.0bn $4.0bn
$0.0bn
$5.0bn
$10.0bn
$15.0bn
$20.0bn
$25.0bn
$30.0bn
Estimate at Completion 2012-15 Corporate Plan
Total Estimated Operating Expenditure to FY2021
Other Indirect
Opex
Staff Related Costs
Other Direct Opex
Lease &
Subscriber Related
Costs
$26.4bn$26.4bn
NBN Co Limited
© NBN Co Limited 2013 Page 13 of 19 19 April 2013
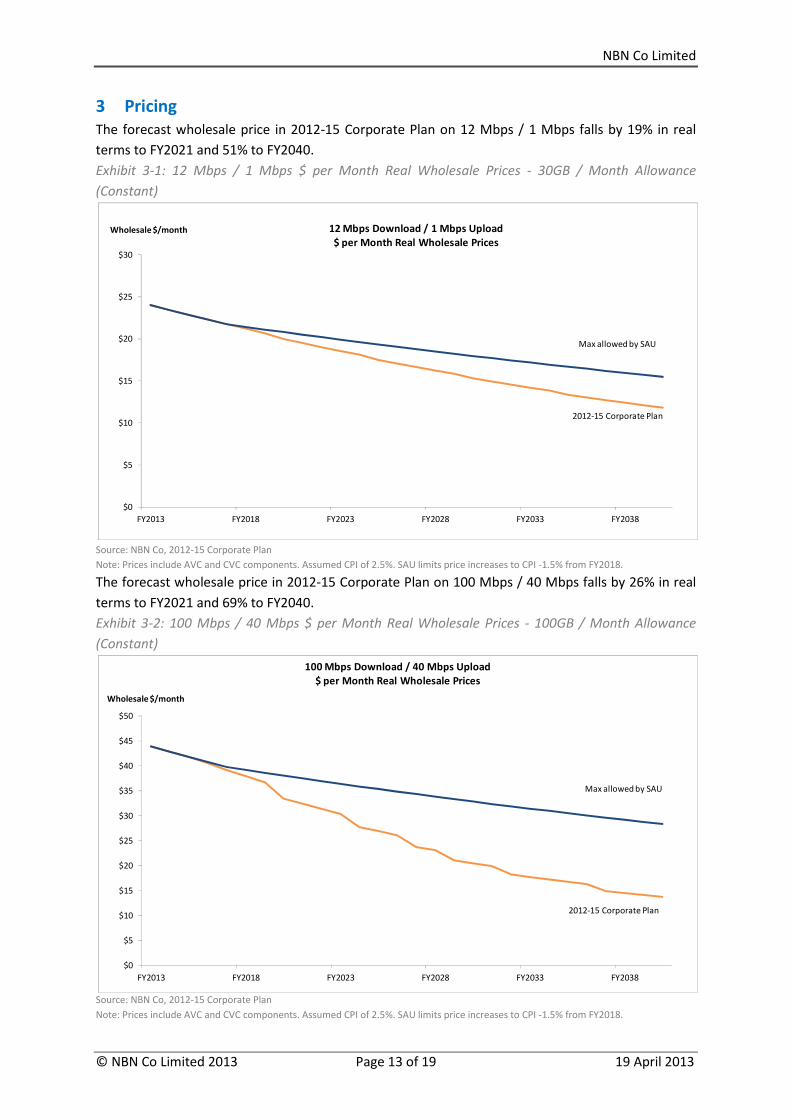
3 Pricing
The forecast wholesale price in 2012-15 Corporate Plan on 12 Mbps / 1 Mbps falls by 19% in real
terms to FY2021 and 51% to FY2040.
Exhibit 3-1: 12 Mbps / 1 Mbps $ per Month Real Wholesale Prices - 30GB / Month Allowance
(Constant)
Source: NBN Co, 2012-15 Corporate Plan
Note: Prices include AVC and CVC components. Assumed CPI of 2.5%. SAU limits price increases to CPI -1.5% from FY2018.
The forecast wholesale price in 2012-15 Corporate Plan on 100 Mbps / 40 Mbps falls by 26% in real
terms to FY2021 and 69% to FY2040.
Exhibit 3-2: 100 Mbps / 40 Mbps $ per Month Real Wholesale Prices - 100GB / Month Allowance
(Constant)
Source: NBN Co, 2012-15 Corporate Plan Note: Prices include AVC and CVC components. Assumed CPI of 2.5%. SAU limits price increases to CPI -1.5% from FY2018.
$0
$5
$10
$15
$20
$25
$30
FY2013 FY2018 FY2023 FY2028 FY2033 FY2038
Wholesale $/month 12 Mbps Download / 1 Mbps Upload
$ per Month Real Wholesale Prices
Max allowed by SAU
2012-15 Corporate Plan
$0
$5
$10
$15
$20
$25
$30
$35
$40
$45
$50
FY2013 FY2018 FY2023 FY2028 FY2033 FY2038
Wholesale $/month
100 Mbps Download / 40 Mbps Upload
$ per Month Real Wholesale Prices
2012-15 Corporate Plan
Max allowed by SAU
NBN Co Limited
© NBN Co Limited 2013 Page 14 of 19 19 April 2013
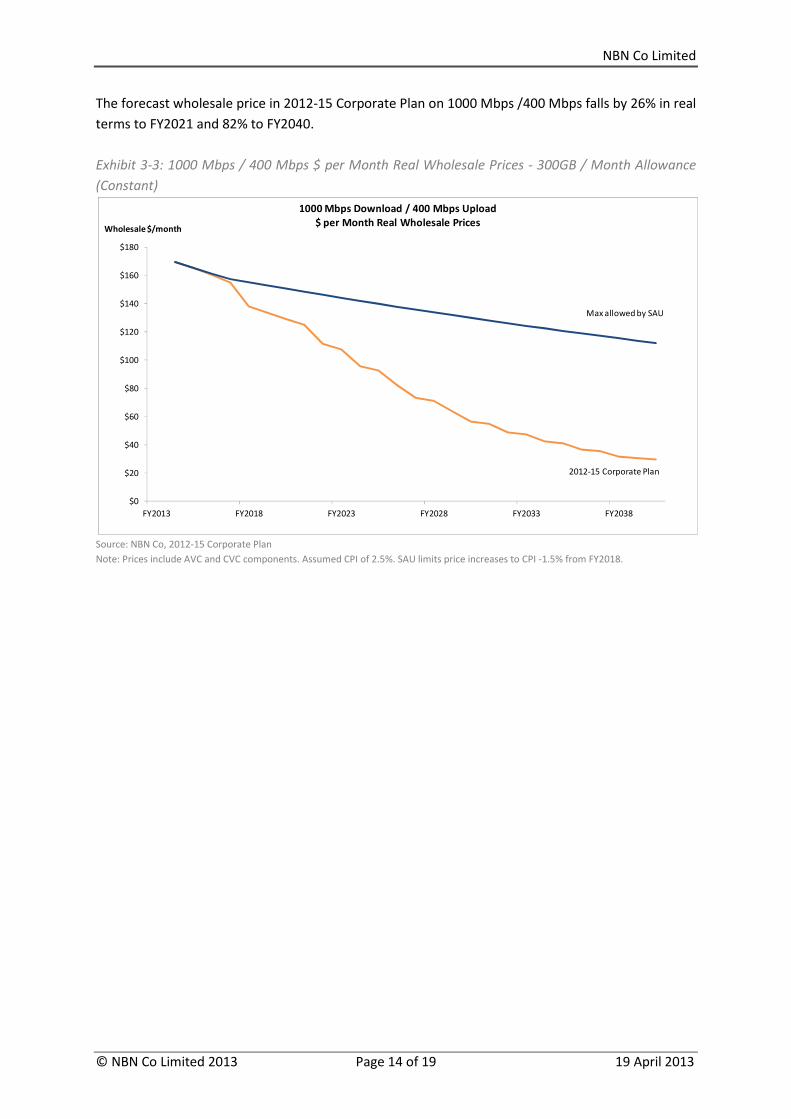
The forecast wholesale price in 2012-15 Corporate Plan on 1000 Mbps /400 Mbps falls by 26% in real
terms to FY2021 and 82% to FY2040.
Exhibit 3-3: 1000 Mbps / 400 Mbps $ per Month Real Wholesale Prices - 300GB / Month Allowance
(Constant)
Source: NBN Co, 2012-15 Corporate Plan
Note: Prices include AVC and CVC components. Assumed CPI of 2.5%. SAU limits price increases to CPI -1.5% from FY2018.
$0
$20
$40
$60
$80
$100
$120
$140
$160
$180
FY2013 FY2018 FY2023 FY2028 FY2033 FY2038
Wholesale $/month
1000 Mbps Download / 400 Mbps Upload
$ per Month Real Wholesale Prices
2012-15 Corporate Plan
Max allowed by SAU
NBN Co Limited
© NBN Co Limited 2013 Page 15 of 19 19 April 2013
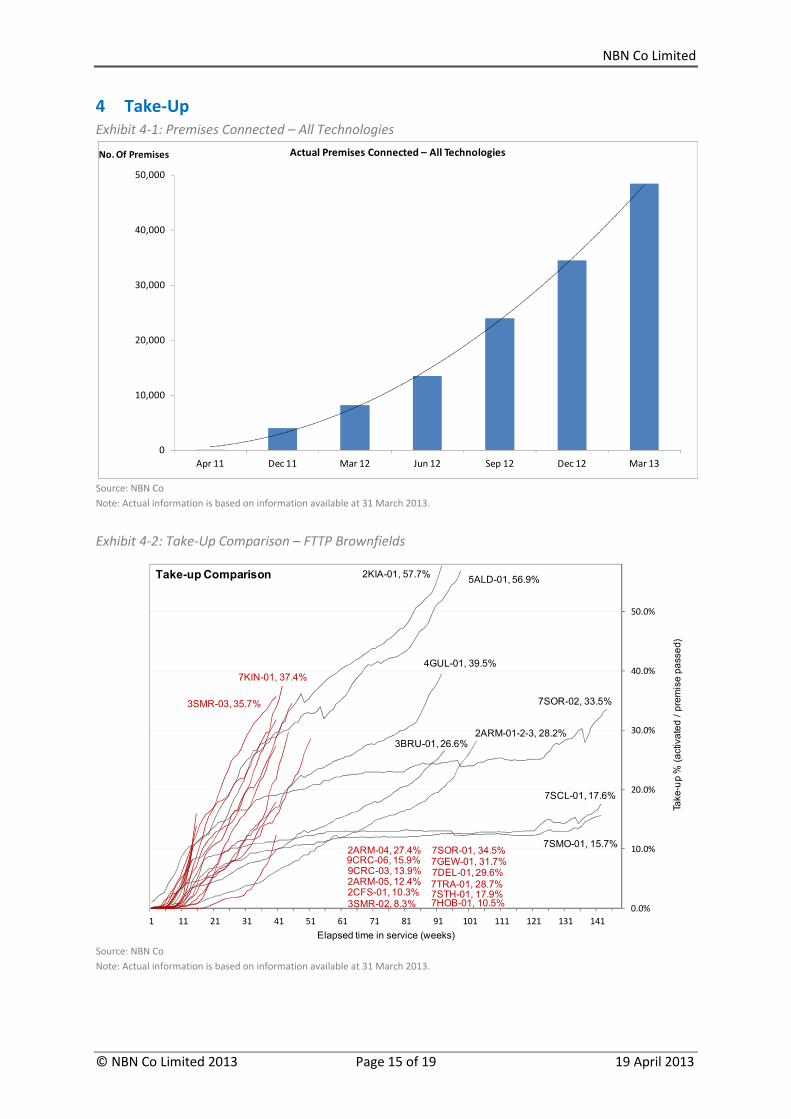
4 Take-Up
Exhibit 4-1: Premises Connected – All Technologies
Source: NBN Co
Note: Actual information is based on information available at 31 March 2013.
Exhibit 4-2: Take-Up Comparison – FTTP Brownfields
Source: NBN Co
Note: Actual information is based on information available at 31 March 2013.
0
10,000
20,000
30,000
40,000
50,000
Apr 11 Dec 11 Mar 12 Jun 12 Sep 12 Dec 12 Mar 13
No. Of Premises Actual Premises Connected – All Technologies
4GUL-01, 39.5%
7SOR-02, 33.5%
7SMO-01, 15.7%
5ALD-01, 56.9%
3BRU-01, 26.6%
2KIA-01, 57.7%
7SCL-01, 17.6%
2ARM-01-2-3, 28.2%
7SOR-01, 34.5%
7TRA-01, 28.7%
7KIN-01, 37.4%
3SMR-03, 35.7%
7GEW-01, 31.7%7DEL-01, 29.6%
7STH-01, 17.9%
2ARM-04, 27.4%
2ARM-05, 12.4%
3SMR-02, 8.3%
9CRC-03, 13.9%9CRC-06, 15.9%
7HOB-01, 10.5%2CFS-01, 10.3%
1 11 21 31 41 51 61 71 81 91 101 111 121 131 141
0.0%
10.0%
20.0%
30.0%
40.0%
50.0%
Elapsed time in service (weeks)
Take-u
p %
(a
ctiva
ted /
pre
mis
e p
asse
d)
Take-up Comparison
NBN Co Limited
© NBN Co Limited 2013 Page 16 of 19 19 April 2013
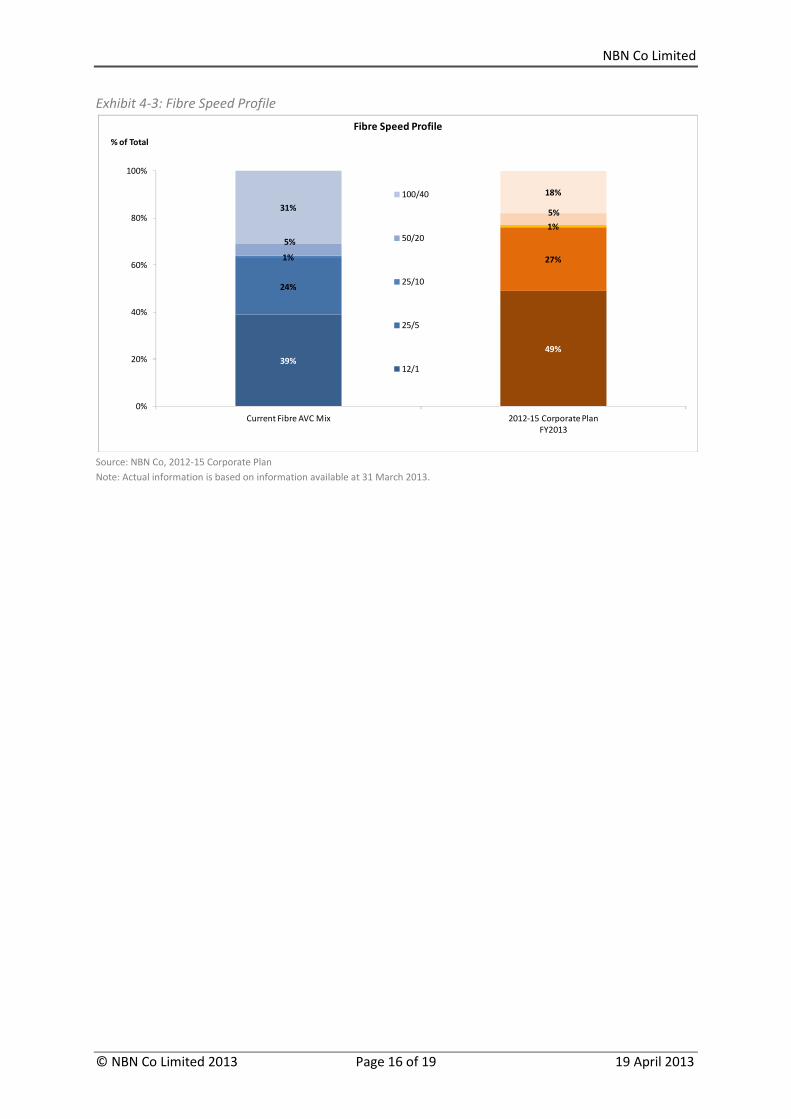
Exhibit 4-3: Fibre Speed Profile
Source: NBN Co, 2012-15 Corporate Plan
Note: Actual information is based on information available at 31 March 2013.
39%
49%
24%
27%1%
1%
5%
5%31%
18%
0%
20%
40%
60%
80%
100%
Current Fibre AVC Mix 2012-15 Corporate Plan
FY2013
% of Total
Fibre Speed Profile
100/40
50/20
25/10
25/5
12/1
NBN Co Limited
© NBN Co Limited 2013 Page 17 of 19 19 April 2013
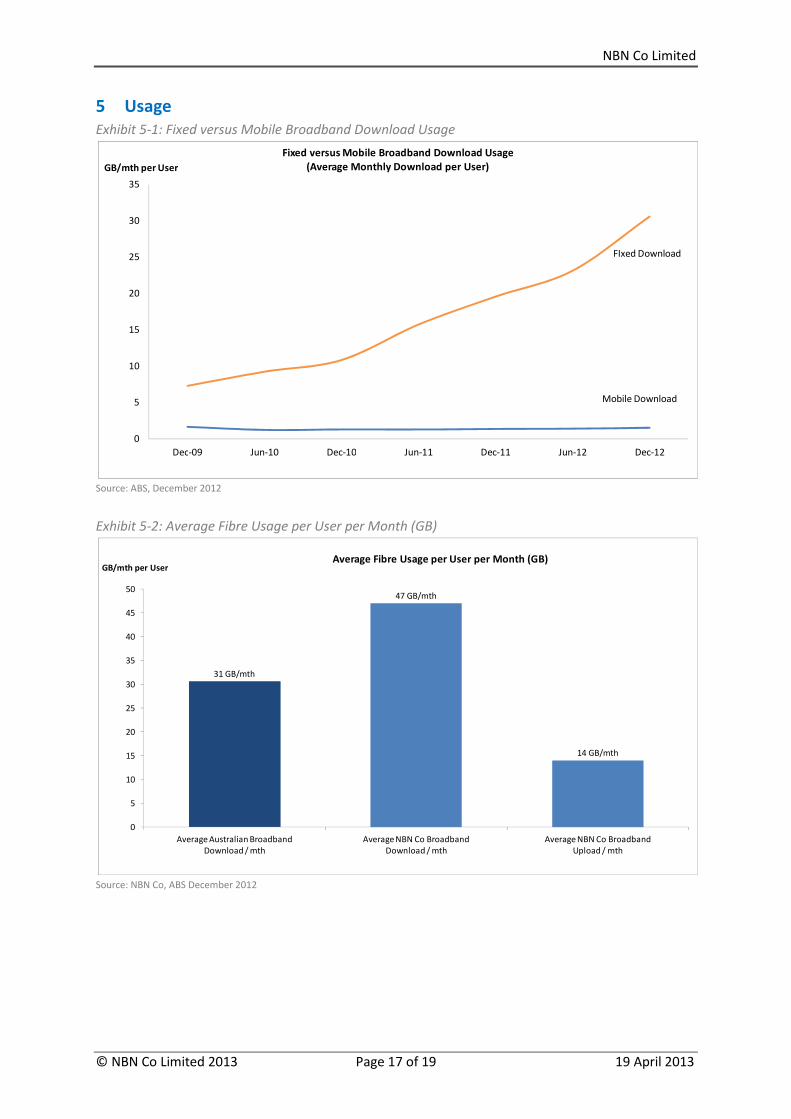
5 Usage
Exhibit 5-1: Fixed versus Mobile Broadband Download Usage
Source: ABS, December 2012
Exhibit 5-2: Average Fibre Usage per User per Month (GB)
Source: NBN Co, ABS December 2012
0
5
10
15
20
25
30
35
Dec-09 Jun-10 Dec-10 Jun-11 Dec-11 Jun-12 Dec-12
GB/mth per User
Fixed versus Mobile Broadband Download Usage
(Average Monthly Download per User)
FIxed Download
Mobile Download
31 GB/mth
47 GB/mth
14 GB/mth
0
5
10
15
20
25
30
35
40
45
50
Average Australian Broadband
Download / mth
Average NBN Co Broadband
Download / mth
Average NBN Co Broadband
Upload / mth
GB/mth per UserAverage Fibre Usage per User per Month (GB)
NBN Co Limited
© NBN Co Limited 2013 Page 18 of 19 19 April 2013
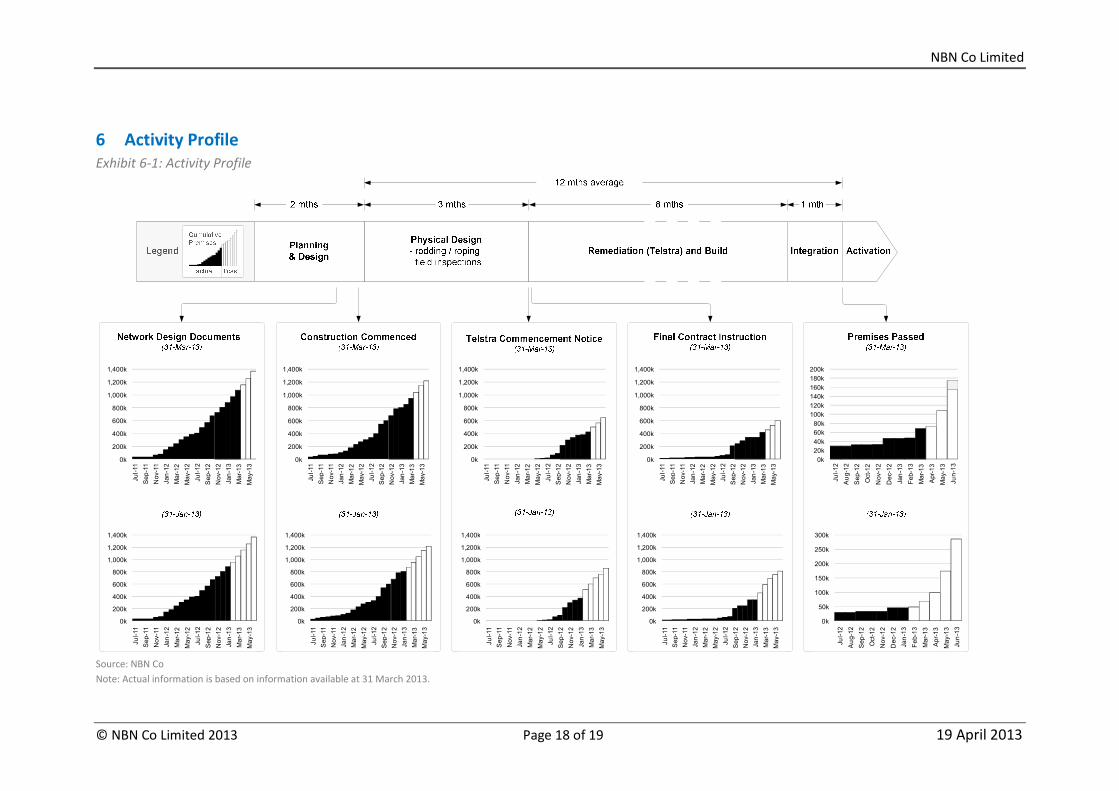
6 Activity Profile
Exhibit 6-1: Activity Profile
Source: NBN Co
Note: Actual information is based on information available at 31 March 2013.
0k
200k
400k
600k
800k
1,000k
1,200k
1,400k
Ju
l-11
Se
p-1
1
No
v-1
1
Ja
n-1
2
Ma
r-1
2
Ma
y-1
2
Ju
l-1
2
Se
p-1
2
No
v-1
2
Ja
n-1
3
Ma
r-1
3
Ma
y-1
3
0k
200k
400k
600k
800k
1,000k
1,200k
1,400k
Ju
l-11
Se
p-1
1
No
v-1
1
Ja
n-1
2
Ma
r-12
Ma
y-1
2
Ju
l-12
Se
p-1
2
No
v-1
2
Ja
n-1
3
Ma
r-13
Ma
y-1
3
0k
200k
400k
600k
800k
1,000k
1,200k
1,400k
Ju
l-11
Se
p-1
1
No
v-1
1
Ja
n-1
2
Ma
r-1
2
Ma
y-1
2
Ju
l-12
Se
p-1
2
No
v-1
2
Ja
n-1
3
Ma
r-1
3
Ma
y-1
3
0k
200k
400k
600k
800k
1,000k
1,200k
1,400k
Ju
l-11
Se
p-1
1
No
v-1
1
Ja
n-1
2
Ma
r-1
2
Ma
y-1
2
Ju
l-12
Se
p-1
2
No
v-1
2
Ja
n-1
3
Ma
r-1
3
Ma
y-1
3
0k
50k
100k
150k
200k
250k
300k
Ju
l-12
Au
g-1
2
Se
p-1
2
Oct-1
2
No
v-1
2
De
c-1
2
Ja
n-1
3
Fe
b-1
3
Ma
r-1
3
Ap
r-1
3
Ma
y-1
3
Ju
n-1
3
0k
200k
400k
600k
800k
1,000k
1,200k
1,400k
Ju
l-11
Se
p-1
1
No
v-1
1
Ja
n-1
2
Ma
r-12
Ma
y-1
2
Ju
l-12
Se
p-1
2
No
v-1
2
Ja
n-1
3
Ma
r-13
Ma
y-1
3
0k
200k
400k
600k
800k
1,000k
1,200k
1,400k
Ju
l-11
Se
p-1
1
No
v-1
1
Ja
n-1
2
Ma
r-1
2
Ma
y-1
2
Ju
l-1
2
Se
p-1
2
No
v-1
2
Ja
n-1
3
Ma
r-1
3
Ma
y-1
3
0k
200k
400k
600k
800k
1,000k
1,200k
1,400k
Ju
l-11
Se
p-1
1
No
v-1
1
Ja
n-1
2
Ma
r-1
2
Ma
y-1
2
Ju
l-1
2
Se
p-1
2
No
v-1
2
Ja
n-1
3
Ma
r-1
3
Ma
y-1
3
0k
200k
400k
600k
800k
1,000k
1,200k
1,400k
Ju
l-11
Se
p-1
1
No
v-1
1
Ja
n-1
2
Ma
r-1
2
Ma
y-1
2
Ju
l-1
2
Se
p-1
2
No
v-1
2
Ja
n-1
3
Ma
r-1
3
Ma
y-1
3
0k
20k
40k
60k
80k
100k
120k
140k
160k
180k
200k
Ju
l-1
2
Au
g-1
2
Se
p-1
2
Oct-
12
No
v-1
2
De
c-1
2
Ja
n-1
3
Fe
b-1
3
Ma
r-1
3
Ap
r-1
3
Ma
y-1
3
Ju
n-1
3
NBN Co Limited
© NBN Co Limited 2013 Page 19 of 19 19 April 2013
Forward Looking Statements
This Report to the Joint Committee of the National Broadband Network has been prepared for the
Cth by NBN Co Limited (NBN Co). This Report contains forward looking statements (Statements)
that are based on NBN Co’s best considered professional assessment of present economic and
operating conditions, present Australian Government policy, and assumptions regarding future
events and actions which, at the date of this Report, are expected to take place. These Statements
are not guarantees of future performance and involve risks, uncertainties and other important
factors, many of which are beyond NBN Co’s control. NBN Co’s officers do not give any assurance
to any third party that the results, performance or achievements expressed or implied by such
Statements will actually occur, and no third party should rely upon the Statements or consider
them as a representation of what will happen.