Embed Size (px)
Citation preview

IMPACTS OF CLIMATIC CHANGE IN SPAIN
593
13. IMPACTS ON THE ENERGY SECTOR Juan Manuel López Zafra, Luis Jesús Sánchez de Tembleque and Vicente Meneu
Ferrer
Contributing Authors
E. Ardines Tomás, R. Gimeno Nogués, R. Mateos de Cabo, A. Pardo Tornero, S. de Paz Cobo, E. Valor Micó
Reviewers
F. Ayala Carcedo, M. Fernández, X. Labandeira, G. Maganto, J. A. Moreno Delgado, I.
Pérez Arriaga, F. Sánchez Sudón, A. L. Vivar
E. Alonso Pelegrín, T. Trouve

ENERGY SECTOR
594

IMPACTS OF CLIMATIC CHANGE IN SPAIN
595
ABSTRACT
Practically all the economic sectors of the country depend on the energy sector, and it should therefore be considered as a strategic one. Spain depends greatly on international energy, that is oil and its derivatives and on natural gas, and not so much on hydroelectricity and other forms of renewable energy; furthermore, Spain traditionally has had one of the lowest levels of primary energy intensity in comparison with Europe, and also has lower energy consumption per capita. In recent years, the greatest increases in demand for electric energy have occurred in the South, the Mediterranean Coast and the Centre, and this tendency is expected to continue in the coming years. The energy sector is one of the culprits of climate change, but is also affected by it. It has been detected that consumption of natural gas (in winter) and electricity (all year round) fundamentally depend on air temperature; thus, warmer winters would cause lower levels of consumption of both, whereas hotter summers would lead to increases in demand for electricity; a growing tendency in the average demand for electricity has been observed in relation to positive (negative) variations of one degree centigrade in summer (winter). The foreseeable reduction of rainfall will affect the structure of the offer of hydroelectricity, as well as certain thermal power plants and nuclear power plants with broken circuit cooling. The cogeneration of aeolic energy and the combined cycles used by natural gas (which is a cleaner source of energy) are, to a certain extent, an alternative. The other sources of renewable energy are still at the initial stages of development. In recent years, many proposals have been presented by the Administration for the promotion both of renewable energy and of an increase in energy efficiency, such as the Promotion Plan for Renewable Energy Sources, and the Spanish Strategy for Energy Saving and Efficiency; measures have also been detected in the financial markets aimed at mitigating the effects of climatic variations on the different economic sectors. We present different indicators for the detection of climate change in relation to the energy sector; among these, we should highlight the consumption of total energy and total energy intensity, as well as those specifically referring to electricity, particularly domestic and industrial consumption for both refrigeration and heating. Certain modifications are needed, however, with regard to the information provided by the companies, along with an in-depth analysis of the factors intervening in the evolution of the indicators and the specific repercussions of climate change in each sector of economic activity.

ENERGY SECTOR
596

IMPACTS OF CLIMATIC CHANGE IN SPAIN
597
13.1. INTRODUCTION
The energy sector, understood as the sector dedicated to transforming and distributing energy, is possibly one of the key parts of the economic machine, as practically all the other ones depend on it. It is also to blame for one third of all emissions of greenhouse gasses. Indeed, according to EEA (2003), in 2001 the energy transformation sector was responsible for 33% of CO2 emissions, whereas transport represented 25%, and the use of fossil fuels as primary energy for the industry caused 17% of the emissions. It also has a certain technical flexibility to deal with these emissions, by changing the generation mix. This chapter does not deal with the causes of the emissions by this sector, but rather, the effects of possible climate change therein, both in relation to the sources of primary energy it uses, and to the processes of transformation of these into total energy (demanded by society, in the form of electricity, of oil products, natural gas and coal). Energy consumption is growing on a worldwide scale and will continue to grow in the near future. This is also occurring in Spain, at an even faster rate than in neighbouring countries. Furthermore, Spanish energy growth rates are above the growth rates of its Gross Domestic Product, which initially seems to indicate that our efficiency with regard to the energy used to generate a unit of wealth is decreasing. Although this is true, certain aspects need to be explained. On one hand, Spain country has historically had one of the lowest levels of primary energy intensity (relationship between primary energy consumption and Gross Domestic Product) in comparison to Europe, although in recent years it has reached European levels, with regard to equal purchasing power. We also have lower energy consumption per capita. On the other hand, there has been a decrease in energy intensity in industry, resulting from the better technology adopted and from the move to less intensive activities in the housing, trade and transport sectors, where there have been very high growth rates. The good health of the economy has led to an increase in employment and in income, which has made better facilities possible, as well as levels of consumption closer to European ones, both at the domestic level and in the Tertiary sector. However, the transport sector has shown spectacular growth rates, like in the rest of Europe, but even more accentuated, which has brought about one of the highest levels of energy intensity in transport, resulting from the greater use of road transport in relation to the railway, and over longer distances. This tendency has also been observed in relation to electric energy, due to its characteristics of versatility, availability and price. In recent years, the greatest increases in demand for electricity in Spain have been in the South, the Mediterranean Coast and the Centre, and this tendency is expected to continue in the coming years. Oil is the main source of primary energy in Spain, as it satisfies approximately 53% of the country's energy needs. Coal and natural gas are the other two most used sources, representing 17% and 14%, respectively, of total energy demand, with opposing evolution tendencies. However, it must be noted that the year 2002 was particularly dry and this affected negatively to hydraulicity. Apart from the inconvenience of depending mainly on one source of energy (oil), there is also the problem that Spain is an oil importer, given that national production only covers 0.4% of the country’s need for crude oil. This high degree of external dependence calls for the implementation of an energy policy fundamentally based on guaranteeing supply. Figure 13.1 shows the relative importance, both at international and national levels, of energy consumption, depending on the source.

ENERGY SECTOR
598
World consumption of primary energy. 2002
37.6%
24.2%
25.5%
6.5%6.3%
Oil
Natural Gas
Coal
Nuclear
Hydroelectricity and otherrenewable sources
Spanish Consumption of primary energy. 2002
52.5%
14.6%
17.6%
12.8%
2.2%
0.4%
Oil
Natural gas
Coal
Nuclear
Hydroelectricity and otherrenewable sources
Balance (import. minusexport.)
Fig. 13.1. Sourcess: British Petroleum (2004); DGPEM (2003) Furthermore, with regard to the relative importance of each energy source in relation to global consumption on a determined date, we must keep in mind what the evolution of consumption of each one has been in relation to the amount consumed on a given date. This enables us to know, depending on supply forecasts, the situation of Spain with regard to future supply problems, as this evolution is linked both to the world reserves of each source along with their geostrategical location and to the self-supply rate. Figure 13.2 shows, without a doubt, how Spain’s dependence on oil has increased since the year 1973 (this date has been chosen as a base for all the sources, as it was the origin of the first world energy crisis); there is a noteworthy increase, however, of other sources in the same period, particularly coal, natural gas and nuclear power. In this report we will be dealing with five main energy sources: electricity (final energy), oil, natural gas, coal and renewable sources for non-electric use (primary energy sources). Lastly, we must point out that the energy sector is a strategic one in which guaranteed supply is the key part of the system. This is why, in certain activities, the sector is regulated by the State and in which the role of Supervisor exists (National Energy Commission). 13.2. SENSITIVITY TO THE PRESENT CLIMATE
Climate change is generally detected in an increase in mean temperature, accompanied by a downward trend in rainfall and relative air humidity; in fact, it’s quite more complex, as Meteo France, for instance, has shown that variations in climate are different in the Norh than in the South of France. Furthermore, extreme atmospheric episodes can occur with greater frequency and intensity. As indicated by Ayala-Carcedo (2004), in Spain a statistically significant downward tendency has been detected with regard to wintertime rainfall in the 1947-2000 series on the Peninsula, and also an upward trend in the frequency and intensity of extreme thermal episodes. An initial question that must be dealt with when analysing the sensitivity of the energy sector to the present climate is establishing the climatic variables of greatest influence on the energy sector, this being understood as the sector dedicated to the transformation and distribution of energy. According to Lloyd’s (1999), a 3ºC temperature increase causes a 10% variation in energy consumption. It must be kept in mind that when we talk of climatic variables, a wide range of magnitudes can be taken into account: temperature (air or ground), hours of insolation, rainfall, wind speed, relative humidity, atmospheric pressure, etc. Once the most influential variables have been detected, we will attempt to analyse possible variations in their evolution, capable of affecting the energy sector in the future.

IMPACTS OF CLIMATIC CHANGE IN SPAIN
599
Variation in consumption in relation to 1973
27.3%
71.4%
0%10%20%30%40%50%60%70%80%
1979 1982 1989 1998 2002
Oil World Oil Spain
Variation in consumption in relation to 1973
112.4%
2258.9%
0%
500%
1000%
1500%
2000%
2500%
1979 1982 1989 1998 2002
Natural Gas World Natural Gas Spain
Variation in consumption in relation to 1973
44.6%
129.2%
0%
20%40%
60%
80%
100%120%
140%
1979 1982 1989 1998 2002
Coal World Coal Spain
Variation in consumption in relation to 1973
1146.5%
863.2%
0%
200%400%
600%
800%
1000%1200%
1400%
1979 1982 1989 1998 2002
Nuclear World Nuclear Spain
Variation in consumption in relation to 1973
80.2%
13.3%
-40%
-20%
0%
20%
40%
60%
80%
100%
1979 1982 1989 1998 2002
Hydroelectr. and other ren. sources WorldHydroelectr. and other ren. Sources Spain
Variation in consumption in relation to 1973
59.9%
137.7%
0%20%40%60%80%
100%120%140%160%
1979 1982 1989 1998 2002
TOTAL World TOTAL Spain
Fig. 13.2. Source: own design based on British Petroleum (2004) y DGPEM (2003) 13.2.1. Electricity
13.2.1.1. Demand for electricity
As an initial approach to the relationship between energy and climatic variables, we will take electricity as a representative energy variable. As previously mentioned, electricity is a secondary source of energy. In order to carry out studies, this energy variable has the big advantage of the availability of large databases dealing with consumption levels of very high temporal frequency (daily data, in general, and following the creation of the OMEL market, hourly data on negotiated electric energy). Figure 13.3 shows the scatter graphs relating electricity consumption (only working days) to 6 relevant climatic variables expressed as an index - air temperature ITE, wind speed IVV, relative humidity IHR, atmospheric pressure IP, rainfall IPR and insolation IHS. These indices have been obtained following procedures explained in en Valor et al. (2001a y 2001b). The colours blue and red are used to distinguish

ENERGY SECTOR
600
the days corresponding to summer and winter, as these indicate differentiated types of consumption behaviour. The most evident factor of climatolgy influencing consumption is temperature. In the first figure of Figure 13.3, there is a convex relationship, so that the data for winter and summer are clearly separated into two sub-sets: the one associated with higher temperatures corresponds to summer (red dots) and the one associated with lower winter temperatures (blue dots). A minimum value appears which separates both sets by approximately 18ºC corresponding to the temperature usually known as comfort temperature (or comfort interval, when a range of temperatures around a mean value is used). The interpretation of this result is that at 18ºC electric energy consumption is minimum, and increases with greater and lesser temperatures due to the activation of air conditioning machines (in summer) and heating (in winter). The other climatic variables have a lower, practically negligible influence on electricity consumption, as can be seen on the other scatter Figures, and they will therefore not be taken into account in this section of the study. In any case, the combination of some of them could be of certain relevance, for example, temperature and wind speed –windchill-, or temperature and relative humidity –discomfort index-. It should be observed that in all cases temperature forms part of both combinations, and its role as a climatic variable of maximum influence in electricity consumption is reinforced in this sense. In order to insist even more upon the relationship between electricity demand and temperature, in the summer of 2003 the heat wave caused big increases in demand for electricity in Spain. Thus, according to the web page of Red Eléctrica de España, electricity consumption in the first twelve days of June surpassed 10.5% of that recorded for the same period in the previous year. The Advance of the 2003 Annual Report by Red Eléctrica de España, relating to the month of August, also showed a 12.6% increase in electricity demand compared with the same month of the previous year; in the same organism’s Monthly report for August, it was shown that the mean temperature in this month was 4ºC higher than in August 2002, and that both maximums and minimums were both clearly higher than in the same month of the previous year. Likewise, temperature decreases cause an increase in energy demand; on March 2nd 2004, the energy demand peak in Spain was registered at a value of 38.040 MW at 19:47, and a maximum of mean hourly power of 37.724 MW between 20 and 21 hours. On the same day, the aggregated energy demand was 759 GWh. The previous maximum was registered on February 18th, 2003 between 19 and 20 hours, with a value of 37.212 MW, and the aggregate energy demand of the following day was also the highest in history up to that point in time, with 753 GWh (Red Eléctrica de España. Advance of the Annual Report for 2003); these records coincide with particularly low temperatures in the month of February, 1.5 degrees Celsius lower than the average for the same month in the previous year 2002; specifically, the average minimum temperature on February 18th, was lower than 0ºC, according to the data provided by the Red Eléctrica de España (Monthly Report, February, 2003). Furthermore, on March 2nd 2004, coinciding with low temperatures, the maximum historic demand for natural gas was reached at1.246 GWh.

IMPACTS OF CLIMATIC CHANGE IN SPAIN
601
275000
325000
375000
425000
475000
0 5 10 15 20 25 30
ITE (ºC)
E (M
Wh)
275000
325000
375000
425000
475000
960 970 980 990 1000 1010 1020
IP (hPa)
E (M
Wh)
275000
325000
375000
425000
475000
30 50 70 90 110
IHR (%)
E (M
Wh)
275000
325000
375000
425000
475000
0 2 4 6 8 10 12 14
IHS (horas)
E (M
Wh)
275000
325000
375000
425000
475000
0 5 10 15 20 25 30
IPR (mm)
E (M
Wh)
Fig. 13.3. Scatter graphs of the demand for electricity and climatic variables (temperature ITE, wind speed IVV, Atmospheric pressure IP, relative humidity IHR, hours of insolation IHS, precipitations IPR). Daily data on working days from 1983 to 1999; in the data on electricity demand, the general economic tendency has been eliminated. Source: own design based on data from REE, INM and INE. We must insist on this relationship, taking into account the double effect of temperatures on electricity consumption. To this end, we calculated the variables derived from the ITE denominated heating degree days (HDD) and cooling degree days (CDD). Following the methodology described in the literature, the calculation of the degree days was based on:
HDDt = (ITEREF – ITEt)+
CDDt = (ITEt – ITEREF)+ ITEREF being the index value taken as a reference and ITE the index value in t (t= 1,2,3,…). In the case of Spain, the reference value of the index to be used is 18ºC, which is the previously analysed comfort temperature. The interpretation of the heating degree days is the number of
275000
325000
375000
425000
475000
10 30 50 70
IVV (km/h)
E (M
Wh)

ENERGY SECTOR
602
degrees for which it would be necessary to use energy resources during the winter days in order to reach the comfort environmental temperature. The cooling degree days would be the degrees necessary, using energy resources, to bring the temperature down to the comfort level. That is to say, they are a measure of the duration and intensity of the cold in winter and of the heat in summer. Figure 13.5 presents the evolution of the cooling and heating degree days from 1970 to 2003. Each variable represents the annual sum of the degree days obtained, applying day by day, the previous relationships. Simple observation of the Figure provides information on the clear downward tendency of the annual heating degree days, as well as the evident upward trend of the cooling degree days, both of them the consequence of a rise in mean temperature in the last thirty three years.
300
500
700
900
1100
1300
1500
1700
1970
1972
1974
1976
1978
1980
1982
1984
1986
1988
1990
1992
1994
1996
1998
2000
2002
Gra
dos-
día
anua
les
(ºC
)
CDDHDD
Fig. 13.5. Evolution of the annual sum of cooling (CDD) and heating (HDD) degree days from 1970 to 2003. Source: own design based on data from the INM Once the cooling degree days and heating degree days have been obtained, it is possible to determine in an approximate manner the response of mean daily demand for electricity in summer and in winter to a temperature variation of one degree. Table 13.1 shows the result of this approximation, and this response is detailed for the years 1983, 1993 and 2003. The growing trend in summer is notable. Table 13.1. Percentage variation of mean daily electricity demand caused by a variation in temperature of ±1º C. Source: Own design based on data from REE and INM
Year Winter Summer 1983 1,85 % 0,47 % 1993 2,06 % 1,07 % 2003 1,80 % 1,61 %
13.2.1.2. Electricity supply
But it is not only the demand for electricity that is affected by temperature variations. The generation of electricity itself is also sensitive, to a greater or lesser degree, to variations in

IMPACTS OF CLIMATIC CHANGE IN SPAIN
603
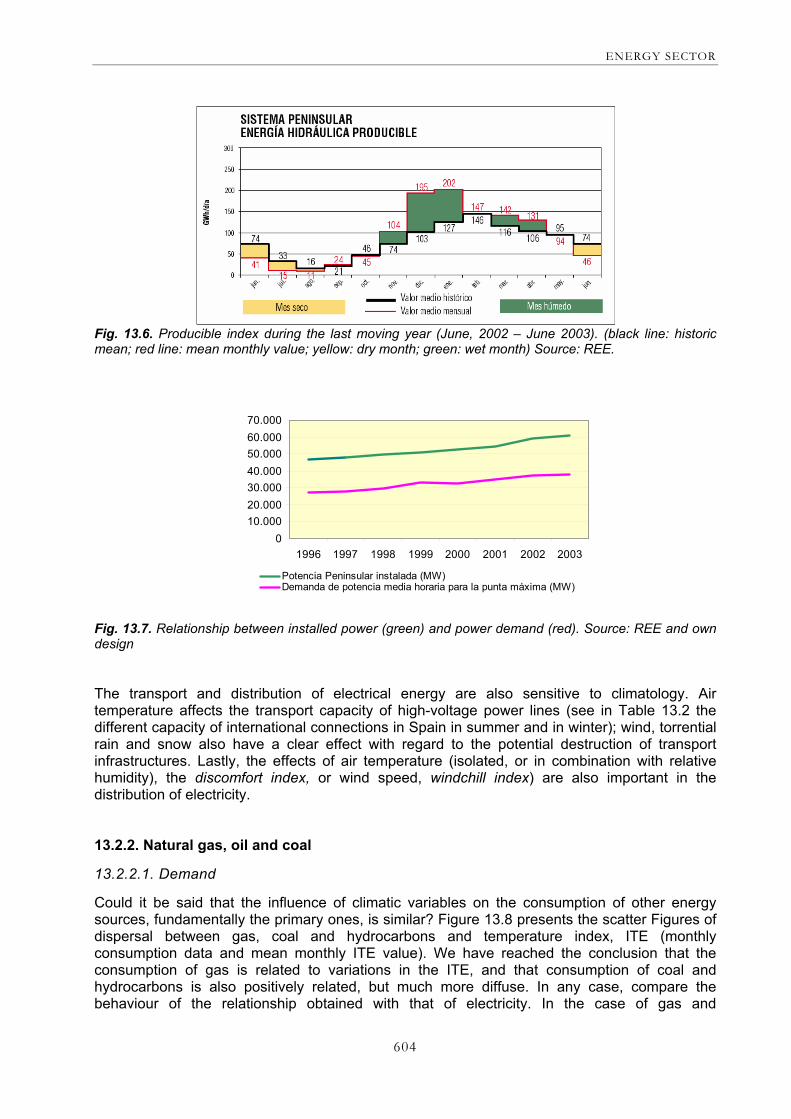
climate. Thus, directly related to rainfall and to the capacity of the reservoirs, it affects the price of electricity. For instance, the month of August, 2003, was particularly dry, with a hydraulic producible energy 7 GWh below a standard August. This, combined with the heat wave, caused the average electricity price to rise up to 4 cents of a Euro per KWh during this month, 25.3% higher than that of the previous year, and the maximum in the previous thirteen months, according to the Electricity Market Operator, OMEL (information by Reuters, August 29th, 2003). The previous maximum price had been in July, 2002, at the time 4.72 cents of a Euro per KWh, in a particularly dry year. The hydraulic producible energy shows the maximum amount of electrical energy that could be produced in theory, considering hydrualic production recorded in a given period of time, once the water use has been calculated for irrigation or other uses different from the production of electrical energy; with regard to the producible index, this shows the ratio between producible energy and mean producible energy, both of these referring to the same time period and to one same hydro power equipment. This index therefore correctly shows the temporal hydrological cycle, and a unitary value of this indicates a normal period with regard to hydraulic yield; lower values of the unit, however, reflect dry periods, whereas values higher than the unit reflect humid periods (see their evolution from June, 2002 to June, 2003 in Figure 13.6). It is precisely the year 2002 that presents a producible index of 0.73, according to data from the Red Eléctrica de España (Advance of the 2003 Annual Report), compared to one of 1.16 for 2003, which probably explains the average price of electricity in July of that year. And the same thing happens to electricity prices in August, 2003, with a producible index of 0.56. As we can see, the combination of heat and little hydraulicity has clear effects on prices. Furthermore, we are also aware of the effects of temperature on the different performance levels of thermal and nuclear power plants, an on the ones dedicated to cogeneration, high-temperature thermal solar energy and on biomass. The Rankine cycle reduces their thermodynamic performance when the cool focus is lower. Besides, the thermal impact is increased, as happened, for example, in France, a country with a huge production of nuclear generated electricity, when the nuclear power plants in Bugey (Ain, east), Golfech (Tarn-et-Garonne, south) and Tricastin (Drome, southeast) received authorisation in August, 2003, to dump into rivers the water used for cooling reactors, at temperatures higher than what is permitted by the regulations in force. Wind energy is clearly affected by anticyclonic conditions and with extreme instability episodes (very high winds). In the case of photovoltaic and of thermal solar energy, strong winds raise dust (dirtying panels and heliostats), and production has to be stopped. The biggest problem at present for these facilities is heat dissipation. Cell performance decreases with temperature. In the case of those made of single crystal silicon this is a decrease of 4.41% each 10º C, above 25º C. These cells also have maximum functioning temperatures in the range of 70º C, which cannot be exceeded. However, the effect of the hours of insolation is very positive in these technologies.
Furthermore, temperature increases give rise to much milder winters and to much hotter summers (figure 13. 5). Increased demand, combined with this temperature effect, leads to an increase in summertime demand for electricity. This effect can be seen year after year in the approximation of the peak power demand in summer to the values demanded in winter.
ENERGY SECTOR
604
Fig. 13.6. Producible index during the last moving year (June, 2002 – June 2003). (black line: historic mean; red line: mean monthly value; yellow: dry month; green: wet month) Source: REE.
010.00020.00030.00040.00050.00060.00070.000
1996 1997 1998 1999 2000 2001 2002 2003
Potencia Peninsular instalada (MW)Demanda de potencia media horaria para la punta máxima (MW)
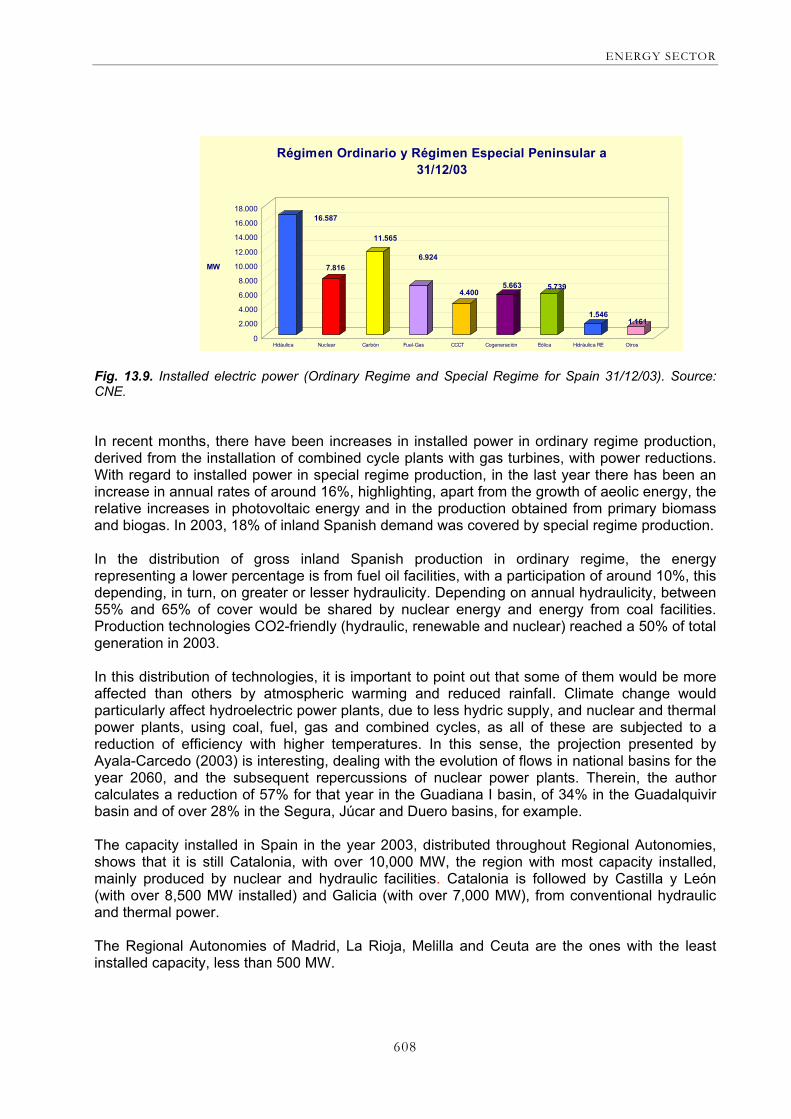
Fig. 13.7. Relationship between installed power (green) and power demand (red). Source: REE and own design The transport and distribution of electrical energy are also sensitive to climatology. Air temperature affects the transport capacity of high-voltage power lines (see in Table 13.2 the different capacity of international connections in Spain in summer and in winter); wind, torrential rain and snow also have a clear effect with regard to the potential destruction of transport infrastructures. Lastly, the effects of air temperature (isolated, or in combination with relative humidity), the discomfort index, or wind speed, windchill index) are also important in the distribution of electricity. 13.2.2. Natural gas, oil and coal
13.2.2.1. Demand
Could it be said that the influence of climatic variables on the consumption of other energy sources, fundamentally the primary ones, is similar? Figure 13.8 presents the scatter Figures of dispersal between gas, coal and hydrocarbons and temperature index, ITE (monthly consumption data and mean monthly ITE value). We have reached the conclusion that the consumption of gas is related to variations in the ITE, and that consumption of coal and hydrocarbons is also positively related, but much more diffuse. In any case, compare the behaviour of the relationship obtained with that of electricity. In the case of gas and

IMPACTS OF CLIMATIC CHANGE IN SPAIN
605
hydrocarbons, we do not find the ascending branch corresponding to high temperatures (summer), due to the fact that air conditioning systems are not activated with these energy sources. No relationship for coal is detected, either in summer or in winter. It could be considered that the indirect influence of these high temperatures on the consumption of gas, coal and hydrocarbons through the generation of electricity does not appear to be relevant at present. Table 13.2. Maximun nominal capacity per interconnecting power lines on December 31st, 2002 (Voltaje, kV; in summer; in winter) Source: REE.
300
350
400
450
500
550
600
650
700
750
5 10 15 20 25 30
ITE (ºC)
G (k
tep.
)
800
1000
1200
1400
1600
1800
2000
2200
5 10 15 20 25 30
ITE (ºC)
C (k
tep.
)
3500
3700
3900
4100
4300
4500
4700
5 10 15 20 25 30
ITE (ºC)
P (k
tep.
)
Fig. 13.8. Scatter Figures of the monthly primary demand for gas (G), coal (C) and hydrocarbons (P) and temperature from 1987 to 1998; the general economic trend has been eliminated from the energy series. Source: own design based on data from de MINER, INM and INE. 13.2.2.2. Supply
Incidents in the supply of natural gas by sea in methane tankers, clearly depend on the state of the sea. Regasification (a process by which gas is regasified, as it is usually transported in a liquid state) may be favoured by an increase in environmental temperature, just as transport and distribution through open air gas pipelines are favoured. But, in a symmetrical way,
Capacidad nominal máxima de las interconexiones internacionales (MW)tension (kV) En verano En invierno
Con FranciaIrún – Errondenia 132 111 133Arkale – Argia 220 410 460Hernani – Argia 400 1430 1620Biescas - Pragnéres 220 270 330Benos - Lac Dóo 150 100 140Vic – Baixas 400 1510 1750Con AndorraAdrall – Escalades 1 y 2* 110 60 85Con PortugalCartelle - Lindoso 400 1040 1330Conchas – Lindoso 132 132 105 140Aldeadávila - Bemposta 220 270 340Aldeadávila - Pocinho 220 270 340Saucelle - Pocinho 220 270 340Cedillo - Falagueira 400 790 1410Santa Marina - Elvas 1 y 2* 66 40 70Con MarruecosPinar - Melloussa 400 730 730* Valores por circuito

ENERGY SECTOR
606
liquification at the point of origin will be negatively affected by a temperature increase, and, although this type of facilities do not exist in Spain, this effect, above a certain threshold, could have negative repercussions for the international supply of gas. . The oil industry is equally sensitive to climate variations. The quality of refinery products, for example, will necessarily vary with air temperature. Distribution and marketing also depend on climatological conditions, fundamentally when oil tankers and trucks are used. With regard to coal, this depends on climatology in the extraction and preparation, storage and distribution phases, depending on intended uses. The first phase is clearly affected by rainfall, which, when excessively abundant, can cause problems both in quarries and in underground mines. During storage of coal, air temperature can cause spontaneous combustion, with the accompanying risks. Wind speed can cause fugitive emissions, reducing the final amount of mineral available. Likewise, runoff can cause a serious reduction of the amount of mineral stored. Lastly, the marketing of coal will be affected by hydraulicity (dry years will lead to greater use of thermal power plants) and by air temperature, which will obviously cause greater heating demand or less demand in the domestic use of coal for heating. 13.2.3. Non electrical use renewable energy sources
With regard to the sources of renewable energy of non electrical use demand, these also present evident sensitivity to climatology. Low temperature thermal solar energy logically depends on the insolation received, and biomass shows real characteristics and seasonal cycles depending both on the type of soil and water availability. Indeed, climate is a variable that determines the type of crop possible in a determined area. With regard to biocarburants, tropical crops of sugar cane allow for an average production per Ha of 6,000 litres of bioethanol in Brazil, whereas in Europe, as cereals are used, this performance is limited to less than half this amount. Furthermore, in Europe a large amount of biodiesel is produced from rapeseed oil, mainly in Germany and France. We now indicate how an alteration of meteorological variations affects crops, fundamentally in the case of Spain and in relation to biethanol from cereals, currently the most commonly used biocarburant in the country. Increase of rainfall: In general very positive, although this should occur in its natural periods. Increase of hours of insolation: Positive Increase of relative humidity: Positive Increase of temperature: Very high or very low ones harmful. Slightly high ones, favourable. 13.3. FORESEEABLE IMPACTS OF CLIMATE CHANGE
This epiFigure shows the possible effects of climate change on the energy sector. Obviously, no attempt will be made here to quantify these effects, but we will try to make a qualitative appraisal of them. We attempted to distinguish three levels: positive, negative and neutral. Where necessary, the effects have been distinguished according to the type of energy. Table 13.3 summarised the main results. 13.4. MOST VULNERABLE ZONES
We now provide a series of maps showing the physical distribution of transformer stations (electricity power plants, facilities for the regasification of liquefied natural gas and refineries) as well as their permanent transport networks, based on electricity, oil and gas.

IMPACTS OF CLIMATIC CHANGE IN SPAIN
607
Table 13.3. Main impacts of climate change. Source: own design
Rainfall Temperature Wind Increase Decrease Increase Decrease Increase Decrease
Others
Generation Positive (hydraulicity) Negative Negative* Positive* Positive
in aeolic Negative in aeolic Solar: insolación positiva
Transport and Distribution Negative Positive Negative Positive
Negative if it is very high
Neutral
Ele
ctric
ity
Marketing/demand Neutral Neutral Negative **
Negative ** Neutral Neutral
Combination Temperature/Humidity and Temperature/Wind:
Joint increase causes negative effect
Supply Negative Positive Neutral Neutral Negative(boat) Neutral
Regasification Neutral Neutral Positive Negative Neutral Neutral
Transport and distribution Negative Positive
Positive (open air oil pipelines)
Negative (open air gas pipelines)
Neutral Neutral
Storage Neutral Neutral Negative
(open air storage
Neutral Neutral Neutral
Nat
ural
Gas
Marketing/ Demand Neutral Neutral Negative
** Negative
** Neutral Neutral
Combination Temperature/Humidity and Temperature/Wind:
Joint increase causes negative effect
Refinery Neutral Neutral Negative Positive Neutral Neutral Transport and distribution Negative Positive Negative Negative Neutral Neutral Oil
Demand Neutral Neutral Negative **
Negative ** Neutral Neutral
Extraction Negative Positive Negative Positive Neutral Neutral Storage Negative Positive Negative Positive Negative Neutral Coal Demand Negative Positive Negative
** Negative
** Neutral Neutral
Renewable – non-electric use Production
Positive in
biomass
Negative in
biomass
Negative in
biomass
Negative in biomass Neutral Neutral Low intensity solar:
positive insolation
* Affects performance of theromoelectric plants, nuclear power plants, cogeneration, biomass, thermal solar energy, etc. Likewise, it is more difficult for photovoltaic solar energy to dissipate heat. ** considered negative on presuming greater demand of the resource Note: increases or decreases in the climatic parameter considered should be taken as significant.
13.4.1. Electricity
13.4.1.1. Electricity generation
The generation stations generate around 64.000 MW, of which approximately 51.000 MW correspond to the ordinary regime, the rest pertaining to the special regime (see distribution on Figure 13.9).
ENERGY SECTOR
608
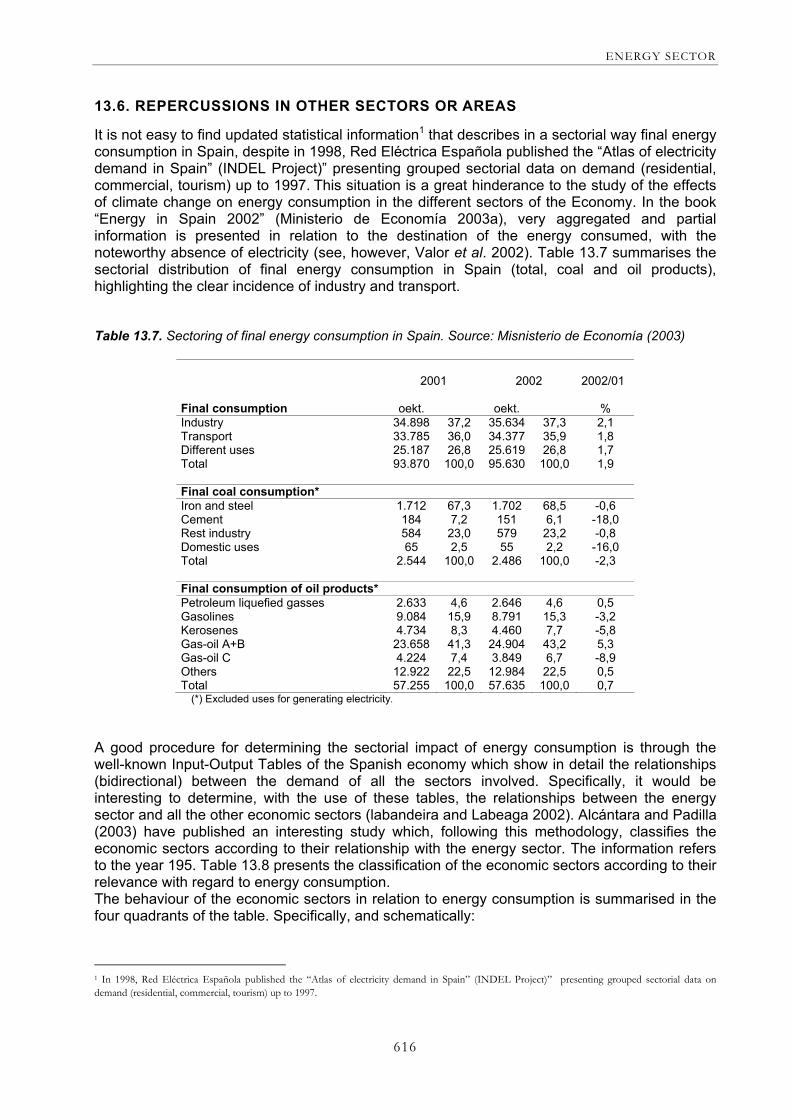
Fig. 13.9. Installed electric power (Ordinary Regime and Special Regime for Spain 31/12/03). Source: CNE.
In recent months, there have been increases in installed power in ordinary regime production, derived from the installation of combined cycle plants with gas turbines, with power reductions. With regard to installed power in special regime production, in the last year there has been an increase in annual rates of around 16%, highlighting, apart from the growth of aeolic energy, the relative increases in photovoltaic energy and in the production obtained from primary biomass and biogas. In 2003, 18% of inland Spanish demand was covered by special regime production. In the distribution of gross inland Spanish production in ordinary regime, the energy representing a lower percentage is from fuel oil facilities, with a participation of around 10%, this depending, in turn, on greater or lesser hydraulicity. Depending on annual hydraulicity, between 55% and 65% of cover would be shared by nuclear energy and energy from coal facilities. Production technologies CO2-friendly (hydraulic, renewable and nuclear) reached a 50% of total generation in 2003. In this distribution of technologies, it is important to point out that some of them would be more affected than others by atmospheric warming and reduced rainfall. Climate change would particularly affect hydroelectric power plants, due to less hydric supply, and nuclear and thermal power plants, using coal, fuel, gas and combined cycles, as all of these are subjected to a reduction of efficiency with higher temperatures. In this sense, the projection presented by Ayala-Carcedo (2003) is interesting, dealing with the evolution of flows in national basins for the year 2060, and the subsequent repercussions of nuclear power plants. Therein, the author calculates a reduction of 57% for that year in the Guadiana I basin, of 34% in the Guadalquivir basin and of over 28% in the Segura, Júcar and Duero basins, for example. The capacity installed in Spain in the year 2003, distributed throughout Regional Autonomies, shows that it is still Catalonia, with over 10,000 MW, the region with most capacity installed, mainly produced by nuclear and hydraulic facilities. Catalonia is followed by Castilla y León (with over 8,500 MW installed) and Galicia (with over 7,000 MW), from conventional hydraulic and thermal power. The Regional Autonomies of Madrid, La Rioja, Melilla and Ceuta are the ones with the least installed capacity, less than 500 MW.
16.587
7.816
11.565
6.924
4.4005.663 5.739
1.5461.161
0
2.000
4.000
6.000
8.000
10.000
12.000
14.000
16.000
18.000
MW
Hidáulica Nuclear Carbón Fuel-Gas CCCT Cogeneración Eólica Hidráulica RE Otros
Régimen Ordinario y Régimen Especial Peninsular a 31/12/03

IMPACTS OF CLIMATIC CHANGE IN SPAIN
609
The new systems of generation are generally located in the zones showing a deficit, like the Central Zone, the Mediterranean Coast and the South. However, with regard to this correlation trend of the existing imbalances between generation and demand, tendencies in the opposite direction can be observed. Thus, it must be said that there are zones that traditionally show a surplus in production, and big increases in new generation are predicted, like the regions of Galicia and Aragón. Figures 13.10 and 13.11 show the distribution in Spain of the different electricity power stations.
Fig. 13.10. Thermoelectric and nuclear power plants. Source: REE. 13.4.1.2. The transport of electricity
The electric energy transport network should be designed and planned in such a way that, in the operation of the electrical system, the continuity of the supply is guaranteed in the necessary conditions. With regard to the development needs of the transport network, it has already been shown that the biggest increases occurred in the South, Mediterranean Coast and Centre, and this trend is expected to continue in the next few years.
Table 13.4. Evolution of the transport system, in km. Source: REE, Advance of the Report 2003.
Year 400 kV 220 kV 1999 14.538 15.900 2000 14.918 16.003 2001 15.180 16.178 2002 16.031 16.205 2003 16.560 16.242

ENERGY SECTOR
610
Plantas de cogeneración:
AÑO 2001 AÑO 20025 MW
25 MW
100 MW
Plantas de cogeneración:
AÑO 2001 AÑO 20025 MW
25 MW
100 MW Año 2001
Año 2002 1. Cogeneration 2. Photovoltaic
Año
2002
Año
2001
Año
2002
Año
2001
Año 2001 Año 2002
P < 10MW
P > 10MW
Año 2001 Año 2002
P < 10MW
P > 10MW
3. Aeolic 4. Small hydro power stations
Año 2001
Año 2002
Año 2001
Año 2002
5. Biomass 6. Waste Fig. 13.11. Special regime production facilities. 1) Cogeneration; 2) Photovoltaic; 3) Aeolic; 4) Small hydropower station; 5) Biomass; 6) Waste. Source: CNE.

IMPACTS OF CLIMATIC CHANGE IN SPAIN
611
Fig. 13.12. Electric energy transport network. Source: REE. 13.4.2. Natural gas
13.4.2.1. The supply of natural gas
The supply of natural gas is done by means of the regasification plants and the connections by gas pipeline with Morocco, France and Portugal. There is also a small level of domestic production. Table 13.5. Production capacity of Spain’s gas deposits. Source: ENAGAS
Production capacity Deposit m3 (n)/h TWh/year
Marshes (Guadalquivir valley) 4.600 0,47 Aznalcazar (Guadalquivir valley) 1.141 0,12
Poseidón (Gulf of Cádiz) 53.000 0,54
TOTAL 58.741 3,65
Table 13.6. Current capacity of Spain’s regasification plants. Source: ENAGAS

ENERGY SECTOR
612
Regasification
plant Storage capacity m3(n)/h
Vaporisation capacity m3(n)/h
maximum days
autonomy (*)
Docking capacity m3
LNG
Load capacity tanker
trucks/day 2 x 40.000 600.000 (72 bar) 1 x 80.000 2 x 80.000 600.000 (45 bar) 1 x 140.000 Barcelona
Total 240.000 Total 1.200.000 4.5
50
100.000 400.000 (72 bar) 60.000 50.000 (45 bar) Huelva
Total 160.000 Total 450.000 8 140.000 50
55.000 105.000 Cartagena
Total 160.000 450.000 8 140.000 50
2 x 150.000 Bilbao Total 300.000 400.000 16.8 140.000 15
TOTAL 860.000 2.500.000 7.7 165 (*) The days of autonomy are calculated as the days needed, regasifying to maximum capacity, to consume the gas from the full tanks, discounting minimum filling capacity (10%).
13.4.2.2. Network of gas pipelines
Gasification in Spain is in the expansion phase. The situation of the transport network in November, 2003, is shown in table 13.7.
Table 13.7. Gas pipeline network in Spain. Source: CNE.
Company Km of gas pipeline
ENAGAS 5.904
AL-ÁNDALUS (ENAGAS +TRANSGAS) 277 GASODUCTO DE EXTREMADURA (ENAGAS +TRANSGAS)
250
GAS NATURAL SDG 209
GAS EUSKADI TRANSPORTE SAU 152
TRANSPORTISTA REGIONAL DEL GAS 41 INFRAESTRUCTURAS GASISTAS DE NAVARRA
13
TOTAL 6.846

IMPACTS OF CLIMATIC CHANGE IN SPAIN
613
CT MEIRAMA
105
80
OviedoSantander
Palencia
Valladolid
Burgos
A Coruña
8040 40
55
Zamora
LeónPontevedra
Ourense
Salamanca
Bilbao
Madrid
Lugo
ZaragozaSoria
Cuenca
Jaén
PLANTA DE HUELVA
POSEIDON
PALANCARES
Granada
Málaga
Córdoba
Cádiz
HuelvaSevilla
Algeciras
Jerez Arcos
Estepona
Motril
Puente Genil48”
Badajoz
Cáceres
Almendralejo
ToledoTalavera
AASS GAVIOTA
C.I. MARRUECOS
Pamplona
S. Sebastián
Vitoria Lumbier
Huesca
Lérida Barcelona
Castellón
Valencia
Alicante
Murcia
Ciudad Real
Cartagena
Lorca
Caudete
PLANTA DE BARCELONA
AASS SERRABLO
32”
28”
20”
26”
Villar de Arnedo
Haro
Aranda
Algete Guadalajara
GetafeTarancón
Alcalá
Puertollano
Aranjuez26”
26”
26”
26”
20”
30”
20”
20”
20”
20”
12”
12”
16”
Ponferrada
12”8”
8”
6”20”
26”26”
26”
26”
12”
30”
24”
24”
30”
Mérida
Plasencia
Linares
Osuna
16”
10”
12”
12”10”
8”
Monzón
Tivissa
Manresa
Igualada 12”
10” Montmeló
Mataró
10”
780
Larrau
Sariñena 16”
20”
12”16”
Alfarrás
Subirats
8”
14”
Ferrol
Villalba
Vigo
Curtis
Santiago
Caldas de Reis
Puentecesures
Tuy
AstorgaVillamañan
Benavente
AvilésGijón
Luarca
Langreo
Reinosa
Castro U.
BriviescaMiranda
Vergara
Irún
Lerma
Aguilar de Campoo
Toro
Tordesillas
Tudela
Lesaka
Sangüesa
8”
4”
6”
12”10”
Castellnou
Tamarite de LiteraVillanueva G.Zuera
Torrijos
Alameda de la SagraLos
Yébenes
Tortosa
Villafames
ChilchesSagunto
16”
12”
10”
8”
8”
4”
10”
10”
10”
16”12”
8”
12”
14”
10”
Santovenia
16/10/8”
PaternaPuzol
Lliria
Cheste6”
Carlet
Agullent
Elche
10”16”
Logroño4”
6”
GuardaViseu
PortalegreCampomaior
AASS DE CARRIZO
26”
20”
20”
26” 12”
Teruel
26”
20”
Villamayor
C.I. FRANCIA
10060
450
1200
450
Almería
OlmedoMedina delCampo
12”Segorbe
12”
Alcudia de Crespins
MARISMAS
30”
TarragonaBañeras
Ávila
30”
16”
12”
30”
16”
24”
635
12”
Mouro
30”
Lisboa
105
Sines
Braga
Oporto
Leiria
PLANTA DE SINES
28”28”
32”
20”
28”
105
450
Caspe
Treto
LlaneraAbegondo
Mugardos
Arrigorriaga
SanturtziLaredoGajano
Alsasua
Izurzun
20”Lloret Del Mar
Gerona
El Grado
SuecaCarcaixent
Ontinyent
Oliva
Ejido
Ubeda
Villanueva de Algaida
Rincón de la Victoria
Aguilar de la F.
Carpio
Pinto
Villalba
Almazan
ArevaloSegovia
PLANTA DE CARTAGENA
20”
20”
10”
20”
Albacete
26”
Rivas
Nules
BorriolAlcora
Planta de regasificación en construcción (en miles de m3 de GNL)
Capacidad de regasificación(en miles de m3(n)/h)
Yacimiento
Conexión internacional
Almacenamiento subterraneo
Estación de compresión
Gasoducto de transporte
Gasoducto en construcción
Gasoducto de Portugal
105
150150800
Planta de regasificación en construcción (en miles de m3 de GNL)
PLANTA DE BILBAO
CT MEIRAMA
105105
8080
OviedoSantander
Palencia
Valladolid
Burgos
A Coruña
80804040 4040
5555
Zamora
LeónPontevedra
Ourense
Salamanca
Bilbao
Madrid
Lugo
ZaragozaSoria
Cuenca
Jaén
PLANTA DE HUELVA
POSEIDON
PALANCARES
Granada
Málaga
Córdoba
Cádiz
HuelvaSevilla
Algeciras
Jerez Arcos
Estepona
Motril
Puente Genil48”
Badajoz
Cáceres
Almendralejo
ToledoTalavera
AASS GAVIOTA
C.I. MARRUECOS
Pamplona
S. Sebastián
Vitoria Lumbier
Huesca
Lérida Barcelona
Castellón
Valencia
Alicante
Murcia
Ciudad Real
Cartagena
Lorca
Caudete
PLANTA DE BARCELONA
AASS SERRABLO
32”
28”
20”
26”
Villar de Arnedo
Haro
Aranda
Algete Guadalajara
GetafeTarancón
Alcalá
Puertollano
Aranjuez26”
26”
26”
26”
20”
30”
20”
20”
20”
20”
12”
12”
16”
Ponferrada
12”8”
8”
6”20”
26”26”
26”
26”
12”
30”
24”
24”
30”
Mérida
Plasencia
Linares
Osuna
16”
10”
12”
12”10”
8”
Monzón
Tivissa
Manresa
Igualada 12”
10” Montmeló
Mataró
10”
780
Larrau
Sariñena 16”
20”
12”16”
Alfarrás
Subirats
8”
14”
Ferrol
Villalba
Vigo
Curtis
Santiago
Caldas de Reis
Puentecesures
Tuy
AstorgaVillamañan
Benavente
AvilésGijón
Luarca
Langreo
Reinosa
Castro U.
BriviescaMiranda
Vergara
Irún
Lerma
Aguilar de Campoo
Toro
Tordesillas
Tudela
Lesaka
Sangüesa
8”
4”
6”
12”10”
Castellnou
Tamarite de LiteraVillanueva G.Zuera
Torrijos
Alameda de la SagraLos
Yébenes
Tortosa
Villafames
ChilchesSagunto
16”
12”
10”
8”
8”
4”
10”
10”
10”
16”12”
8”
12”
14”
10”
Santovenia
16/10/8”
PaternaPuzol
Lliria
Cheste6”
Carlet
Agullent
Elche
10”16”
Logroño4”
6”
GuardaViseu
PortalegreCampomaior
AASS DE CARRIZO
26”
20”
20”
26” 12”
Teruel
26”
20”
Villamayor
C.I. FRANCIA
10060
450
1001006060
450
1200
450
Almería
OlmedoMedina delCampo
12”Segorbe
12”
Alcudia de Crespins
MARISMAS
30”
TarragonaBañeras
Ávila
30”
16”
12”
30”
16”
24”
635
12”
Mouro
30”
Lisboa
105
Sines
Braga
Oporto
Leiria
PLANTA DE SINES
28”28”
32”
20”
28”
105105
450
Caspe
Treto
LlaneraAbegondo
Mugardos
Arrigorriaga
SanturtziLaredoGajano
Alsasua
Izurzun
20”Lloret Del Mar
Gerona
El Grado
SuecaCarcaixent
Ontinyent
Oliva
Ejido
Ubeda
Villanueva de Algaida
Rincón de la Victoria
Aguilar de la F.
Carpio
Pinto
Villalba
Almazan
ArevaloSegovia
PLANTA DE CARTAGENA
20”
20”
10”
20”
Albacete
26”
Rivas
Nules
BorriolAlcora
Planta de regasificación en construcción (en miles de m3 de GNL)
Capacidad de regasificación(en miles de m3(n)/h)
Yacimiento
Conexión internacional
Almacenamiento subterraneo
Estación de compresión
Gasoducto de transporte
Gasoducto en construcción
Gasoducto de Portugal
105
150150150150800
Planta de regasificación en construcción (en miles de m3 de GNL)
PLANTA DE BILBAO
Fig. 13.13. Map of gas infrastructures. Source: CNE
13.4.3. Oil and derivatives
13.4.3.1. Network of multi-fuel pipelines, refineries and deposits.
Fig. 13.14. Network of multi-fuel pipelines, refineries and deposits of oil products. Source: CLH.

ENERGY SECTOR
614
13.5. MAIN ADAPTATIONAL OPTIONS
Depending on the scenario considered, there are certain possibilities for adaptation. In Spain’s energy policy certain measures exist, and others are being adopted, in an attempt to avoid or mitigate the effects of climate change. These measures are reflected in the different documents intended either to promote or improve determined instruments aimed at environmental protection – like, among others, renewable energy or energy efficiency – or with this type of objectives in mind but which also incorporate environmental improvements. The most relevant actions are now indicated, with a brief description of each one. Plan de Fomento de las Energías Renovables (PFER) – plan for the promotion of renewable energies-, approved by the government on December 30th, 1999. It established the necessary growth objectives in each one of the technologies considered as renewable in order for their production to represent 12% of Spain’s consumption of primary energy in the year 2010.
Estrategia Española de Ahorro y Eficiencia Energética 2004-2012 (E4) – Spanish strategy for energy saving and efficiency-. Started in October, 2002, and approved by the Council of Ministers on November 28th, 2003. Aimed at promoting energy saving and efficiency and, indirectly, at guaranteeing the energy supply, by reducing imports, increasing the competitiveness of the production sectors and by helping to reach environmental objectives, which is compatible and in line with the main vectors of Spanish energy policy. This document analysed the possibilities for energy saving and efficiency in different sectors, such as construction, transport, public services, industry, tertiary and residential, the energy transformation sector (refinery, electricity production and cogeneration) and the agriculture sector.
Estrategia Española de Lucha contra el Cambio Climático (EECC) – Spanish strategy for climate change-: this is the oldest, as it was initially drafted in 2001, with the creation of the Oficina Española de Lucha contra el Cambio Climático – Spanish office for climate change- and the redefinition of the Consejo Nacional del Clima –national council on climate-. It was approved on February 5th, 2004 at the Plenary Meeting of the National Council on Climate, pending approval by the Council of Ministers. Its general objective is to contribute to fulfilling the compromises derived from the Kyoto Protocol, specifically the one related to the limitation of the growth of net greenhouse gas emissions to 15%. The Strategy enumerates over 400 measures to be applied in different sectors, such as energy production and transformation, industry, transport, the residential, commercial and institutional sectors, agriculture, livestock farming and waste. It also proposes a series of measures for the promotion of sinks. Lastly, the strategy contemplates Directive 2003/87/CE on the emission trading allowances, which affects almost half the emissions of greenhouse gasses in our country.
Estrategia Española de Desarrollo Sostenible (EEDS) – Spanish strategy for sustainable development-, the drafting of which began in November, 2001, can be considered as the most important of all, because it encompasses the others, due to the fact that it must jointly analyse the economic, social and environmental vectors of society. There is an Advisory Document which appears to make a good diagnosis of the situation (innovation, technology, population ageing, territorial imbalances, sustainable water management, poverty and social exclusion). The document also established measures and instruments such as follow-up and evaluation indexes. It is still in the draft phase, however, and their is no set date for final approval, and it can therefore only be considered as a framework of intentions.
Documento de Planificación de los Sectores de Electricidad y del Gas Natural – planning document for the electricity and natural gas sectors- Development of the transport networks

IMPACTS OF CLIMATIC CHANGE IN SPAIN
615
2002-2011, approved by the Government on September 13th, 2002. It includes, among others, forecasts of the future behaviour of demand, the resources necessary to satisfy this, the evolution of market conditions in order to guarantee supply and the criteria for environmental protection. These forecasts are part of the indicative planning, specified in the Electricity Sector Law, which established the exception of transport facilities, in which planning is of a binding nature. With regard to environmental protection, on one hand, it integrates the objectives of electricity production of the PFER, and extends these, and on the other, assumes the need to reduce final energy consumption, leaving the measures to be applied to the drafting of a specific document, which was finally drawn up In the previous E4.
Fig. 13.15. Forecast of reduction of CO2 emissions (red: Kyoto Objective; grey: tendency scenario; green: promotion plan of renewable energy sources; yellow: planning electricity and gas sectors; blue: strategy for energy saving and efficiency). Source: E4 Economic Report. Economy Ministry. Beyond the regulatory options described, another, equally important one could be considered, developed on an international level for the last few years by the risk managers of companies exposed to climatic hazards. It involves the introduction into the financial markets of products related in some way to climatic parameters, such as wind, temperature, rainfall, etc., or any combination of these. Thus, de Paz Cobo (2003) points out that in the 1996-2001 period, over 4,700 contract were signed, to an accumulated total of 7,500 million US dollars. Their main characteristic is the cover of risks associated with climate, for example, a decrease in electricity consumption owing to an excessively warm winter. Obviously, the electricity companies are the main parties interested in this type of operations, which, although they are very new in Spain, should not be ruled out as an instrument of cover. There should also be more actions for the improvement of bioclimatic housing development, in order to construct buildings and entire cities based on a substantial improvement with regard to energy efficiency.
0
100
200
300
400
500
1990 2002 2012
Mt C
O2
Reducción de emisiones de CO2
Objetivo Kioto Escenario Tendencial Plan de Fomento de las Energías Renovables Planificación Sectores Electricidad y Gas Estrategia de Ahorro y Eficiencia Energética
0
100
200
300
400
500
1990 2002 2012
Mt C
O2
Reducción de emisiones de CO2
Objetivo Kioto Escenario Tendencial Plan de Fomento de las Energías Renovables Planificación Sectores Electricidad y Gas Estrategia de Ahorro y Eficiencia Energética
Objetivo Kioto Escenario Tendencial Plan de Fomento de las Energías Renovables Planificación Sectores Electricidad y Gas Estrategia de Ahorro y Eficiencia Energética
ENERGY SECTOR
616
13.6. REPERCUSSIONS IN OTHER SECTORS OR AREAS
It is not easy to find updated statistical information1 that describes in a sectorial way final energy consumption in Spain, despite in 1998, Red Eléctrica Española published the “Atlas of electricity demand in Spain” (INDEL Project)” presenting grouped sectorial data on demand (residential, commercial, tourism) up to 1997. This situation is a great hinderance to the study of the effects of climate change on energy consumption in the different sectors of the Economy. In the book “Energy in Spain 2002” (Ministerio de Economía 2003a), very aggregated and partial information is presented in relation to the destination of the energy consumed, with the noteworthy absence of electricity (see, however, Valor et al. 2002). Table 13.7 summarises the sectorial distribution of final energy consumption in Spain (total, coal and oil products), highlighting the clear incidence of industry and transport. Table 13.7. Sectoring of final energy consumption in Spain. Source: Misnisterio de Economía (2003)
2001
2002
2002/01
Final consumption oekt. oekt. % Industry 34.898 37,2 35.634 37,3 2,1 Transport 33.785 36,0 34.377 35,9 1,8 Different uses 25.187 26,8 25.619 26,8 1,7 Total 93.870 100,0 95.630 100,0 1,9 Final coal consumption* Iron and steel 1.712 67,3 1.702 68,5 -0,6 Cement 184 7,2 151 6,1 -18,0 Rest industry 584 23,0 579 23,2 -0,8 Domestic uses 65 2,5 55 2,2 -16,0 Total 2.544 100,0 2.486 100,0 -2,3 Final consumption of oil products* Petroleum liquefied gasses 2.633 4,6 2.646 4,6 0,5 Gasolines 9.084 15,9 8.791 15,3 -3,2 Kerosenes 4.734 8,3 4.460 7,7 -5,8 Gas-oil A+B 23.658 41,3 24.904 43,2 5,3 Gas-oil C 4.224 7,4 3.849 6,7 -8,9 Others 12.922 22,5 12.984 22,5 0,5 Total 57.255 100,0 57.635 100,0 0,7
(*) Excluded uses for generating electricity. A good procedure for determining the sectorial impact of energy consumption is through the well-known Input-Output Tables of the Spanish economy which show in detail the relationships (bidirectional) between the demand of all the sectors involved. Specifically, it would be interesting to determine, with the use of these tables, the relationships between the energy sector and all the other economic sectors (labandeira and Labeaga 2002). Alcántara and Padilla (2003) have published an interesting study which, following this methodology, classifies the economic sectors according to their relationship with the energy sector. The information refers to the year 195. Table 13.8 presents the classification of the economic sectors according to their relevance with regard to energy consumption. The behaviour of the economic sectors in relation to energy consumption is summarised in the four quadrants of the table. Specifically, and schematically:
1 In 1998, Red Eléctrica Española published the “Atlas of electricity demand in Spain” (INDEL Project)” presenting grouped sectorial data on demand (residential, commercial, tourism) up to 1997.

IMPACTS OF CLIMATIC CHANGE IN SPAIN
617
- The sectors appearing in quadrant B are those that have an energy consumption and, in turn, give rise to a high consumption rate by the other sectors.
- Quadrant C presents the opposite extreme, that is to say, it encompasses the sectors that are irrelevant or negligible with regard to energy consumption, both as a result of their own activity and of their influence in the energy consumption of the other economic sectors.
- Quadrant A includes the sectors whose energy consumption is sensitive to increases in demand by the economy, but which, in turn, do not affect the energy consumption of the other sectors.
- Finally, quadrant D presents sectors whose activity clearly affects the country’s final energy consumption, but which do not respond with an increase in energy consumption along with an increase in general economic activity.
Table 13.8. Relevance of economic sectors in relation to energy consumption (data from 1995) Source: Alcántara and Padilla (2003) and own design
A) Sectors with energy consumption sensitive to increases in the final demand of the economy
B) Very relevant sectors (they consume more energy with increases in final demand by the economy; with increases in their own demand, the cause the other sectors to consume more energy)
Non-metal products Energy Agriculture
Internal transport Chemicals Construction Iron and steel and non-iron metallurgy Other transport
C) Non-relevant sectors (with little effect on final energy consumption, and, in turn, not very sensitive to changes in the final demand of the economy)
D) Sectors whose activity clearly affects the final energy consumption of the economy
Paper and printing Textiles and footwear Trade Metal products Other manufactured products Other services on sale
Foodstuffs(*) Transport equipment Other non-sale services Restaurants and hostelry
(*) The Foodstuffs sector is situated on the boundary between quadrants B and D. 13.7. MAIN UNCERTAINTIES AND KNOWLEDGE GAPS
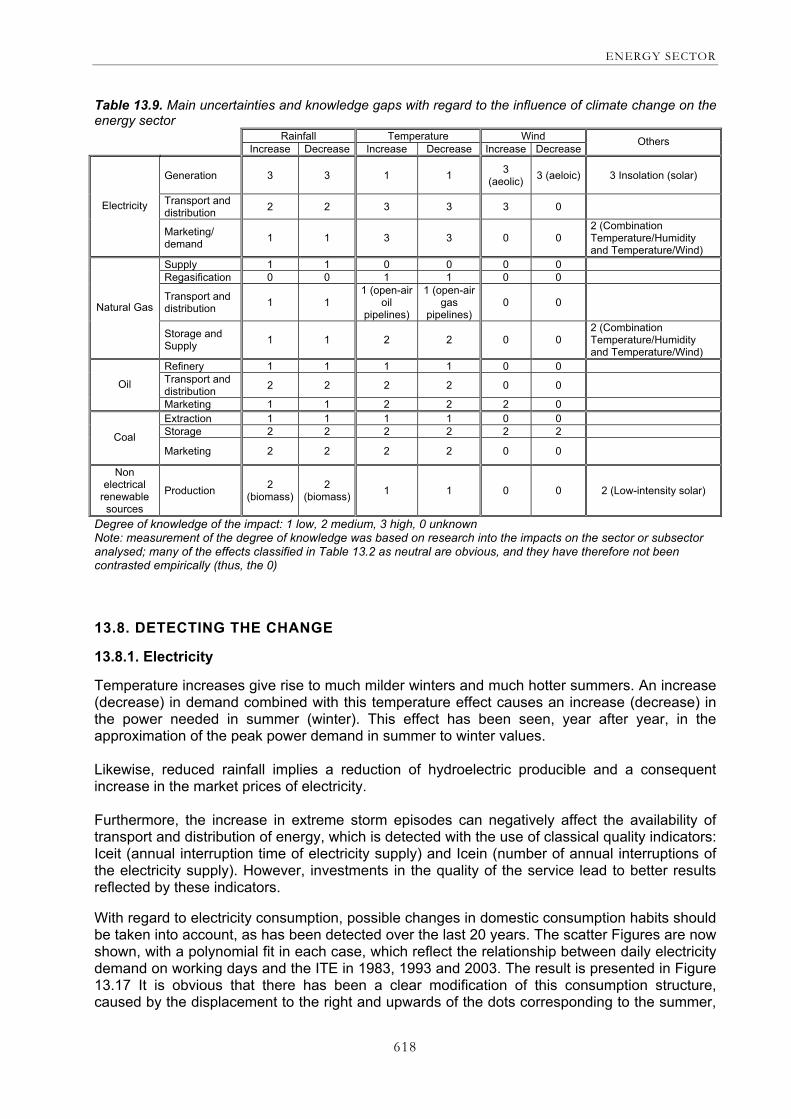
This epigraph attempts to indicate the elements that are currently unknown to the researchers. A synoptic table was designed which attempts to summarise the degree of knowledge of the impact of a change in a given climatic parameter on the different energy sources. We should highlight an interesting aspect here, which is the relationship existing between the degree of knowledge of the impact and the importance of the energy source (and the use made of it) considered. So, for example, everything related to the generation of electricity, using hydraulic or aeolic methods, entails a high degree of knowledge, whereas the effect of wind on the marketing of natural gas is totally unknown, beyond speculation.
ENERGY SECTOR
618
Table 13.9. Main uncertainties and knowledge gaps with regard to the influence of climate change on the energy sector
Rainfall Temperature Wind Increase Decrease Increase Decrease Increase Decrease
Others
Generation
3 3 1 1 3 (aeolic) 3 (aeloic) 3 Insolation (solar)
Transport and distribution 2 2 3 3 3 0 Electricity
Marketing/ demand 1 1 3 3 0 0
2 (Combination Temperature/Humidity and Temperature/Wind)
Supply 1 1 0 0 0 0 Regasification 0 0 1 1 0 0
Transport and distribution 1 1
1 (open-air oil
pipelines)
1 (open-air gas
pipelines) 0 0 Natural Gas
Storage and Supply 1 1 2 2 0 0
2 (Combination Temperature/Humidity and Temperature/Wind)
Refinery 1 1 1 1 0 0 Transport and distribution 2 2 2 2 0 0 Oil
Marketing 1 1 2 2 2 0 Extraction 1 1 1 1 0 0 Storage 2 2 2 2 2 2 Coal Marketing 2 2 2 2 0 0
Non electrical
renewable sources
Production 2 (biomass)
2 (biomass) 1 1 0 0 2 (Low-intensity solar)
Degree of knowledge of the impact: 1 low, 2 medium, 3 high, 0 unknown Note: measurement of the degree of knowledge was based on research into the impacts on the sector or subsector analysed; many of the effects classified in Table 13.2 as neutral are obvious, and they have therefore not been contrasted empirically (thus, the 0) 13.8. DETECTING THE CHANGE
13.8.1. Electricity
Temperature increases give rise to much milder winters and much hotter summers. An increase (decrease) in demand combined with this temperature effect causes an increase (decrease) in the power needed in summer (winter). This effect has been seen, year after year, in the approximation of the peak power demand in summer to winter values. Likewise, reduced rainfall implies a reduction of hydroelectric producible and a consequent increase in the market prices of electricity. Furthermore, the increase in extreme storm episodes can negatively affect the availability of transport and distribution of energy, which is detected with the use of classical quality indicators: Iceit (annual interruption time of electricity supply) and Icein (number of annual interruptions of the electricity supply). However, investments in the quality of the service lead to better results reflected by these indicators. With regard to electricity consumption, possible changes in domestic consumption habits should be taken into account, as has been detected over the last 20 years. The scatter Figures are now shown, with a polynomial fit in each case, which reflect the relationship between daily electricity demand on working days and the ITE in 1983, 1993 and 2003. The result is presented in Figure 13.17 It is obvious that there has been a clear modification of this consumption structure, caused by the displacement to the right and upwards of the dots corresponding to the summer,

IMPACTS OF CLIMATIC CHANGE IN SPAIN
619
an effect that should be attributed to the increasingly generalised use of air conditioning machines, according to data supplied by the Asociación de Fabricantes Españoles de Climatizadores (AFEC) which also responds to an increase in the standard of living.
Fig. 13.16. Evolution of forecasted hourly power demand (blue: winter; red: summer). Source: CNE Thus, the indicators related to electricity proposed for the possible detection of climate change are the following, but we must keep in mind that there are other components that can affect these. • Demand peaks in summer. Relationship between the winter/summer demand peak • Degree of utilisation of hydraulic energy in generation • Price of electricity (spot price and forward price) • Iceit, annual interruption time of electricity supply • Icein, number of annual interruptions of the electricity supply • Domestic electricity consumption:
• In cooling • In heating
• Industrial electricity consumption • Used for cooling • Used for heating • Used for energy in the processes
It should be pointed out here, however, that these detectors should be contrasted. Thus, for example, in relation to the Iceit, it will only be effective if the causes therein are broken down. Simple saturation of the lines by new uses or by higher standards of living leading to greater consumption can give rise to higher values of this indicator, without being directly associated with higher temperature. Therefore, the Iceit, considered globally, would be of no use without a disaggregation of its different components. It should also be pointed out that increased incomes can lead to a modification of the habits of society in that it can afford more comfort. It would therefore be necessary to analyse the combined effects of Temperature*facilities*power of use (economic) in order to reach a truly definitive conclusion. In this sense, it must be pointed out that greater use of air conditioning in the big urban nuclei leads to greater growth of demand for air conditioning, in that these apparatuses generate heat which is expelled outwards, contributing to an increase in external temperature. This same consideration is also valid for automobiles.
Evolución de la demada de potencia horaria
34.000
36.000
38.000
40.000
42.000
44.000
2003 2004 2005 2006 2007
MW Invierno
Verano

ENERGY SECTOR
620
200
300
400
500
600
700
800
0 5 10 15 20 25 30 35
ITE (ºC)
E (G
Wh)
1983
1993
2003
Fig. 13.17. Scatter Figures of electricity consumption and of ITE 1983, 1993 and 2003 and polynomial fit. Each scatter Figure is similar to the one in the upper, left hand figure in Figure 13.3. Source: own design based on data from INM, INE and REE.
13.8.2. Global energy demand
The primary energy intensity of the European Union decreased, in accumulated terms, from 1990 to 2000, at a faster rate during the second half of the decade. In Spain, however, this indicator shows the opposite tendency. In Spain, in the year 2000, primary intensity slightly exceeded the average of the EU member states, due to equal purchasing power. In the case of total energy intensity (consumption of total energy per GDP unit), represented in Figure 13.18, the tendencies recorded are qualitatively similar (upward in the case of Spain and downward in the case of the EU). Since 1990, the average annual growth rate of final intensity in Spain has been 0.8%. Part of this growth is due to a higher electricity consumption rate as a consequence of greater use of air conditioning systems. Some possible general energy indicators of climate change could therefore be the following: • Total energy consumption • Total energy intensity • Current number of air conditioning systems sold.
In this sense, it should be mentioned that the increase in annual sales of air conditioning systems does not only respond to a temperature increase, but also to a progressive reduction of the prices of these and to the higher standard of living of the Spanish, which can be seen in an increased desire for comfort.

IMPACTS OF CLIMATIC CHANGE IN SPAIN
621
Fig. 13.18. Evolution of total intensity in Spain and in the EU 1985-2001. Purchasing power parity (the GNP referred to constant prices in 1995). Source: Ministerio de Economía (2003). 13.9. IMPLICATIONS FOR POLICIES
Up to now, the European commission has proven to be the most effective administration for defining environmental objectives, and recently, objectives related to energy, too. In this sense, we must remember that the Rome Treaty, in section 2, establishes that “the community will have the mission of promoting (...) a high level of protection and improvement of environmental quality, (...)”, and section 174.2 states that “community policy in the environmental sphere must aim to reach a high level of protection, keeping in mind the diversity of existing situations in the different regions of the Community. The principles of caution and preventive action will be used as a base, (….)” . Likewise, section II-37 of the future European Constitution stipulates that “Union policies, based on the principle of sustainable development, will integrate and guarantee a high level of protection of the environment and an improvement in quality thereof”. In this sense, the European Commission, concerned about energy efficiency and environmental questions, promotes the liberalisation of the energy sector without any delay in the adoption of Directives of an environmental nature, in order to attain the sustainable development of the energy sector within its sphere. Recently, very important Directives have been approved, such as: Directive 2001/80/CE, from October 23rd, by the European Parliament and the Council, on
the limitation of emissions into the atmosphere of determined contaminating agents from large combustion facilities. This Directive revises Directive 88/609/CEE, imposing more demanding limits on the emission of SO2, NOx and particles, affecting both existing and new facilities, in this last case, after the year 2008. Its objective is to reduce emissions of SO2 by 63% and NOx by 21% in the EU. This Directive also establishes limits for gas turbines and for biomass.
Directive 2001/81/CE, from October 23rd, by the European Parliament and the Council, on
national thresholds for the emission of determined atmospheric pollutants, the aim of which is to fight against acidification, tropospheric ozone and eutrophication in each country, taking into account the concept of critical load. It establishes for each country maximum emissions of SO2 and NOx from 2010 onwards.
Directive 2001/77/CE, from September 27th, by the European Parliament and the Council,
related to the promotion of electricity based on sources of renewable energy on the internal
ENERGY SECTOR
622
electricity market, aimed at reaching 12% of gross national energy consumption in 2010, and specifically reaching 22.1% of electricity based on renewable sources with regard to the total electricity consumption in the Community for this same year.
Directive 2002/91/CE, by the European Parliament and the Council, from December 16th,
2002, related to energy efficiency in buildings, affecting both new and old buildings and aimed at promoting performance in relation to energy in buildings in the EU, attempting to reach a high level of cost effectiveness. To this end, it establishes an efficiency calculation methodology, certain minimum requirements, energy certification and the inspection of certain integrated elements of the air conditioning systems in buildings.
Directive 2003/30/CE from May 8th, 2003, by the European Parliament and the Council,
relating to the promotion of the use of biocarburants and other renewable fuels in transport, aimed at substituting diesel and gasoline sold for transport by a minimum percentage of biocarburants, 2% for 2005 and 5.75% for 2010.
Council Directive 2003/96/CE, from October 27th, 2003, aimed at restructuring the
community taxation systems for energy and electricity products, defining a general taxation system for energy products, in order to improve the functioning of the internal market, to favour the protection of the environment and to promote better use of labour.
Directive 2003/87/CE by the European Parliament and the Council, from October 13th, 2003,
which establishes a system for greenhouse gas emissions trading in the Community, modifying Council Directive 96/61/CE. This regulation introduces a market mechanism for facilitating the fulfilment of the compromises derived from the Kyoto Protocol at Community level, to be initiated in 2005 and intended to be fully operative by 2008.
Directive 2004/8/CE, by the European Parliament and the Council, related to the promotion
of cogeneration, based on the demand for useful heat on the internal energy market, promoting this technology and establishing the need to guarantee the origin of electricity from cogeneration.
At the same time, the European commission is concerned about the security and sustainability of the energy supply, and therefore inaugurated, at the end of 2002, a debate on the subject with the use of a Green Book. The European Commission analyses separately the two facets of energy provision, supply and consumption, both of which must form part of the common energy policy, aimed at sustainable energy supply and consumption. It is in the consumption aspect, however, -control of energy demand- in which the Green Book considers that there is greater potential for the establishment of efficient strategies. To this end, it recommends several actions, among which are highlighted a strengthening of the liberalisation processes – in order to inform the consumer of the price signal-, the establishment of mechanisms to ensure that these prices reflect real costs, and the promotion of energy saving. Lastly, it suggests the intensification of efforts in two increasingly developing and intensive energy sectors, which, however, have great potential for improvement: transport and construction. The Green Book suggests changes in means of transport along with the adoption of additional measures aimed at increasing energy saving in buildings. The EU’s energy policy therefore seems to be the correct one with regard to attaining sustainable energy development. With regard to Spain, a series of positive measures has been adopted to date aimed at making our energy development more sustainable. Spain’s energy policy, in accordance with the sectorial Laws on electricity and hydrocarbons, coincides with that of the EU in relation to the following three objectives:

IMPACTS OF CLIMATIC CHANGE IN SPAIN
623
1. Security of the supply 2. Liberalisation and competitive markets 3. Protection of the environment
To date, this energy policy has led to the following regulation: - Total liberalisation of the electricity and gas supply in 2003. Wholesale markets have been
created (organised and free), along with retail markets (based on contracts with suppliers). All consumers have been given the capacity to choose their electricity supplier. All this is intended to lead to improved economic efficiency, and in the case of the electricity sector, given our current generation structure, to improved energy and environmental efficiency.
- The Plan de Fomento de las Energías Renovables –promotion plan for renewable energy
sources- the objective of which is to provide, through these sources, 12% of the primary energy consumed in 2010.
- The Documento de Planificación de los Sectores de Electricidad y del Gas Natural 2002-
2011–planning document for the electricity and natural gas sectors-, analysing the cover of the supply over ten years, with the fulfilment of the environmental objectives (with regard to renewable energy and cogeneration).
- The regulation of the electricity sector aimed at supporting renewable energy and
cogeneration; this has proven to be efficient up to now, taking into account the huge development of aeolic energy, energy from small hydropower stations and cogeneration. The promotion system is based on giving these technologies a relevant premium above electricity market prices. The amount of the equivalent premium can be evaluated in 2003 at almost € 1.000 millions, which is an average surcharge for the electricity consumer of 7%, which is a solid backup for the new generation of clean and efficient technologies.This regulation, however, has not yet managed to develop biomass and thermal solar energy. The recent RD 436/2004, from March 12th, attempts to improve this situation.
- Liberalisation of the generation activity. As a consequence of this, of technological
development and of the new environmental Directives, new combined cycle plants are being incorporated, which make use of natural gas, and the global energy performance of electricity generation is therefore improving, and specific emissions are being reduced.
- Integral rates and rate aids that quantitatively modify consumption habits (the hourly power
rate and complements for hourly and curtailability discrimination). The experience of the system operator in the application of these regulatory elements during the episodes of extreme demand and partial power cuts on December 17th, 2001, was very positive. The current rates structure, however, contains inefficiencies that can be improved.
- - In the Royal Decrees on rates in the years 1995, 1997 and 1998 an approximate allowance
of around 32 million Euros (5,300 million pesetas) was destined to the demand management programmes. The experience was generally positive, because with most of the actions, based on economically encouraging the penetration of new consumption-efficient technologies (like low-consumption bulbs, class A type domestic appliances, motor regulation systems or heat pumps) certain energy savings were made that paid off these incentives in very few years. These programmes, however, were interrupted, and it was not until 2004 that the Royal Decree on rates once again considered an allowance for this concept of 10 million Euros, one third of what was previously established.
ENERGY SECTOR
624
Nevertheless, it is still necessary to consider the current regulation system in order to develop the policies in force. Among other aspects, we should: - Develop the specific rules for the connection and operation of the production facilities in the
special regime. - Incorporate the Directives on cogeneration and emissions trading. - Establish specific mechanisms for the implementation of actions provided for in the E4. In short, it seems that we are on the right path with regard to energy policies, both in the EU and in Spain, but our energy development system, however, is far from being sustainable. We therefore must study these policies more profoundly in order to adopt additional and specific measures to implement strategies, aimed at making our energy development system sustainable; in the case of Spain, it seems that the nuclear option should be at least studied to help reaching the target, complemented with other CO2 free strategies. 13.10. MAIN RESEARCH NEEDS
Whereas the effects of energy consumption on the emissions of greenhouse gasses and on global warming have been subjected to countless studies, as indicated by the IPCC (2001), there have been very few studies that have dealt more deeply with the effects of climate change on energy demand. The relationships between climatological variables and energy use have been studied by different authors (Quayle and Diaz (1979); Le Comte and Warren (1981); Warren and LeDuc (1981); Badri (1992); Yan (1998); Lam (1998); or Pardo et al (2002), among others), but, as Ruth and Amato (2002) pointed out, there are few analyses to date dealing with the long-term implications of climate change in the behaviour patterns of energy use and the consequences for the associated investment decisions. The biblioFigureic review reveals multiple foreseeable effects, but also great variability with regard to consequences; thus, for example, Segar et al (1992) estimate that energy demand during summer peaks will rise in Israel by 10% as a result of temperature increases of 4º C, whereas Cartalis et al (2001), in the case of Greece, estimate that a 1ºC increase would cause a decrease in the demand for heating of 10%, compared with 28.4% in the demand for cooling. Sailor (2001), quoted in Ruth and Amato (2002), states that a 2º C temperature increase would cause an increase in electricity consumption per capita of 11.6% in Florida compared to a decrease of 7.2% in Washington; Warren and LeDuc (1981) made an estimate of the consumption and prices of natural gas in new areas of the USA, finding significant differences between them. This series of quotes leads us to a fundamental conclusion, perhaps the most important one of this epiFigure: we need to learn more about the effect of climate change on energy demand at regional level and according to economic sectors. All of this is due to different reasons: 1. Generalist scenarios of climate change can lead to big losses of information; thus, in Spain,
we should learn whether the foreseable mean temperature increase will be homogeneous, or whether it will affect some regions more than others;
2. It is not only important to learn of the effect of mean temperature, but also of the effect of maximums and minimums;
3. Local infrastructures are different at regional level; increased maximums on the Cantabrian Coast would have a different impact than on the Mediterranean Coast, due to differences in the facilities. In this sense the EIA Report (1999) is interesting, and points out that only 8% of family residences in New England have air conditioning, compared with a national average of 47%;
IMPACTS OF CLIMATIC CHANGE IN SPAIN
625
4. With regard to the series to the indicators proposed for the detection of climate change in relation to the energy sector, there is a need to design models that make a disaggregation of the different elements affecting the evolution of these.
5. Specifically, we need to discern between the income/wealth effect and the temperature effect in the summer period, according to regions, in order to correctly identify the possible effect of climate change.
It is therefore vital, on one hand, to generate medium and small scale scenarios of climate change, in order to simulate the effects on energy demand, and on the other, these scenarios will provide estimates of supply and the structure of this, basically related hidraulicity, wind and rainfall. From the first two will come the direct components of the supply structure, whereas the third one (subtracting the effects on hidraulicity) will provide estimates of the form of energy distribution. It is also very important, considering that one of the effects of an increase in the mean temperature of the earth is a rise in sea level, to study the possible effects on energy demand of the construction of centres for the mitigation of these effects. In a country like Spain, with three quarters of our territory surrounded by sea, these effects could be very serious. We require a more in-depth study of the effects of climatological variables on energy demand at national level; thus, to date, only the articles by Pardo et al (2002), Torró et al (2001), Valor et al (2001a)(2001b) and Climent et al (2003) have dealt with the question. And always from an average and global perspective, that is to say, using the medium temperature value as an indicator, and at national level, using four local weather stations (Madrid, Valencia, Bilbao and Seville); The main reason given by the authors (for example Climent et al (2003)) was the non-disaggregation of energy demand at regional and sectorial level. This is precisely one of the main demands by Spanish researchers, because the existing disaggregation, according to regions and sectors of activity is, to say the least, deficient. 13.11. BIBLIOGRAPHY
Alcántara Y V. and Padilla E. 2003. Key sectors in final energy consumption: an input-output application to the Spanish case. Energy Policy 31.
Ayala-Carcedo F.J. 2003. Impactos del Cambio Climático sobre los recursos hídricos en España y viabilidad física y ecológica del Plan Hidrológico Nacional 2001. En: Arrojo and Del Moral (eds.). La Directiva Marco del Agua: Realidades y Futuros. Fundación Nueva Cultura del Agua, Zaragoza. Pgs. 253-271.
Ayala-Carcedo F.J. 2004. La realidad del Cambio Climático en España y sus principales impactos ecológicos y socioeconómicos. Industria y Minería (en prensa).
Badri M. A. 1992. Analysis of Demand for Electricity in the United States. Energy 177. British Petroleum. 2004. Statistical Review of World Energy. Cartalis C., Synodinou A., Proedrou M., Tsangrassoulis A. and Santamouris M. 2001.
Modifications in energy demand in urban areas as a result of climate changes: an assessment for the southeast Mediterranean region. Journal of Energy Conversion and Management 42.
Climent F., Valor E., Torró H. and Caselles V. 2003. Incidencia de la temperatura en el consumo de gas y electricidad en España. Información Comercial Española. Revista de Economía 808
De Paz Cobo S. 2003. La transferencia alternativa de riesgos: aportaciones desde el mercado de reaseguros. Tesis doctoral. Madrid.
DGPEM. 2003. Boletín Trimestral de Coyuntura Energética. Tercer Trimestre. Dirección General de Política Energética y Minas, Ministerio de Economía.

ENERGY SECTOR
626
EEA. 2003. Annual European Community greenhouse gas inventory 1990-2001 and inventory report 2003. European Environment Agency, Technical Report nº 95.
EIA. 1999. A Look at Residential Energy Consumption in 1997. Washington, D.C., Energy Information Administration.
IPCC. 2001. Climate Change 2001. Impacts, Adaptation and Vulnerability. Ginebra. Intergovernmental Panel on Climate Change.
Labandeira X. and Labeaga J.M. 2002. Estimation and control of Spanish energy-related CO2 emissions: an input-output approach. Energy Policiy 30 (7)
Lam J. C. 1998. Climatic and Economic Influences on Residential Electricity Consumption. Energy Conversion and Management 397.
Le Comte D. and Warren H. 1981. Modeling the Impact of Summer Temperatures on National Electricity Consumption. Journal of Applied Meteorology 20.
Lloyd's. 1999. Hedging your bets to beat weather. Lloyd's list insurance. Ministerio de Economía. 2003a. La energía en España 2002 Ministerio de Economía. 2003b: Memoria Económica del Proyecto de Real Decreto de la
Estrategia de Ahorro y Eficiencia Energética en España E4. Quayle R. and Díaz H. 1979. Heating Degree Day Data Applied to Residential Heating Energy
Consumption. Journal of Applied Meteorology 19. Pardo A., Meneu V. and Valor E. 2002. Temperature and Seasonality Influences on the Spanish
Electricity Load. Energy Economics 241. Red Eléctrica de España. 1998. Atlas de la demanda eléctrica española (Proyecto INDEL). Red Eléctrica de España. 2004. Avance del informe anual 2003. Ruth M. and Amato A. 2002. Regional Energy Demand Responses to Climate Change:
Methodology and Application to the Commonwealth of Massachusetts, North American Meeting, Regional Science Association International, San Juan, Puerto Rico, 14-18 Noviembre.
Sailor D. 2001. Relating residential and commercial sector electricity loads to climate - evaluating state level sensitivities and vulnerabilities. Energy 26.
Segal M., Shafir H., Alpert P., Mandel M. and Balmor Y. 1992. Climatic-related Evaluations of the Summer Peak-Hours' Electric Load in Israel. Journal of Applied Meteorology 31(12).
Torró H., Meneu V. and Valor E. 2003. Single factor stochastic models with seasonality applied to underlying weather derivatives variables. Journal of Risk Finance, Summer
Valor E., Meneu, V. and Caselles V. 2001a. Daily air temperature and electricity load in Spain, Journal of Applied Meteorology 40(8).
Valor E., Pardo A., Meneu V. and Caselles V. 2001b. Consumo eléctrico y meteorología. Revista Española de Física 154
Valor E., Climent F.J., Meneu V. and Caselles V. 2002. El modelo español de consumo sectorial de electricidad. Revista Española de Física 16(3)
Warren H. and LeDuc S. 1981. Impact of Climate on Energy Sector in Economic Analysis. Journal of Applied Meteorology 20.
Yan Y. 1998. Climate and Residential Electricity Consumption in Hong Kong. Energy 23 (1).