Embed Size (px)
Citation preview
SRP DRAFT September 2012
Appendix D1 1 Butadiene
1,3-Butadiene Reference Exposure Levels (butadiene; buta-1,3-diene; biethylene; bivinyl; divinyl; vinylethylene
CAS 106-99-0
1 Summary
The Office of Environmental Health Hazard Assessment (OEHHA) is required to develop guidelines for conducting health risk assessments under the Air Toxics Hot Spots Program (Health and Safety Code Section 44360 (b) (2)). In response to this statutory requirement OEHHA developed a Technical Support Document (TSD), adopted in December 2008, that describes acute, 8-hour and chronic RELs. The TSD presents methodology that explicitly includes consideration of possible differential effects on the health of infants, children and other sensitive subpopulations, in accordance with the mandate of the Children’s Environmental Health Protection Act (Senate Bill 25, Escutia, chapter 731, statutes of 1999, Health and Safety Code Sections 39669.5 et seq.). These guidelines have been used to develop the following RELs for butadiene; this document will be added to Appendix D of the TSD.
Butadiene is a major commodity product of the petrochemical industry. Workers acutely exposed to butadiene during rubber manufacturing experienced irritation of the eyes, nasal passages, throat, and lung. Some workers also experienced coughing, fatigue, and drowsiness. Inhalation of butadiene is mildly narcotic at low concentrations. Exposure to very high concentrations can result in narcosis, respiratory paralysis, and even death. Repeated exposure can damage human sperm cells and increase ovarian atrophy in mice. The studies reviewed for this document include those published through August 2012.
Although butadiene is a carcinogen (IARC Group 2B), this document does not discuss issues related to the cancer potency factor. That has been previously derived and is available at www.oehha.ca.gov/air/hot_spots/index.html.
1.1 Butadiene Acute REL
Inhalation reference exposure level 0.66 mg/m3 (297 ppb) Critical effect(s) Lowered male fetal weight Hazard Index target(s) Development
1.2 Butadiene 8-Hour REL
Inhalation reference exposure level 28 µg/m3 (13 ppb) Critical effect(s) Increased incidence of ovarian atrophy in mice Hazard Index target Female reproductive system

SRP DRAFT September 2012
Appendix D1 2 Butadiene
1.3 Butadiene Chronic REL
Inhalation reference exposure level 7 µg/m3 (3 ppb) Critical effect Increased incidence of ovarian atrophy in mice Hazard Index target Female reproductive system
2 Physical & Chemical Properties
Description Colorless gas Molecular formula C4H6 Molecular weight 54.09 g/mol Density 0.6211 g/ml at 20 ºC Boiling point -4.4 ºC Melting point -108.9 ºC Vapor pressure 2100 mm Hg at 25 ºC Flashpoint - 76 ºC Flammability limits Extremely flammable Solubility Very slightly soluble in water (735 mg/L); soluble in
ethanol, ether, acetone, benzene and organic solvents Odor threshold 0.0014 mg/l; mildly aromatic with slight petroleum
odor Octanol-water partition coefficient
Log Kow = 1.99
Henry’s Law constant 0.074 atm m3/mole (HSDB, 2011) Conversion factor 1 ppm = 2.21 mg/m3 at 20 ºC
1 mg/m3 = 0.445 ppm at 20 ºC
3 Occurrence and Exposure
1,3-Butadiene (butadiene) is a major commodity product of the petrochemical industry. The largest quantities are used in the production of styrene-butadiene rubber copolymers for car and truck tire manufacturing. Butadiene polymers are also used in a variety of other industrial applications, including the production and synthesis of certain latex products, resins, and nitrile rubbers. Most environmental releases of butadiene (78.8%) are associated with non-point or mobile sources such as motor vehicles. About 1.6% of butadiene releases are fugitive or accidental emissions during manufacture, use, transport, storage, or disposal. The remainder comes from other sources including direct volatilization from gasoline, stack emissions from incinerators, cigarette smoke, and the burning of plastics (U.S. EPA, 2002; HSDB, 2004).
Butadiene is subject to rapid destruction by reactions in the atmosphere in the presence of O3, OH radical, and NOx from which a number of reactive electrophiles are formed, including acrolein, formaldehyde, epoxybutene, and other aldehydes (Tuazon et al., 1999; Baker et al.,
SRP DRAFT September 2012
Appendix D1 3 Butadiene
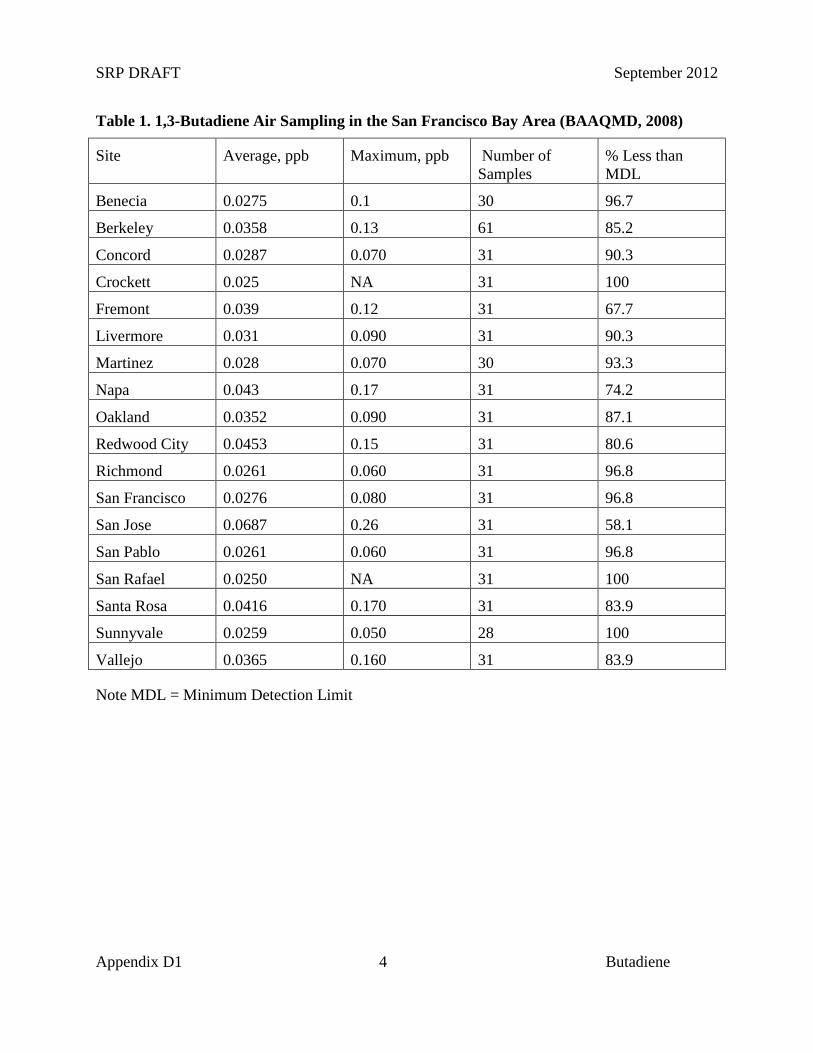
2005; Doyle et al., 2007). Nonetheless, butadiene is almost always present at very low concentrations in US cities and large suburban areas, with average air concentrations approximately equal to 0.3 parts per billion (ppb). Elevated concentrations have been measured in the vicinity of heavily trafficked areas, refineries, chemical manufacturing plants, and plastic and rubber factories (ATSDR 1992). Statewide levels throughout California have consistently dropped from an annual average high of 0.41 ppb in 1990 to approximately 0.1 ppb in 2007. Approximately 26 percent of butadiene emissions in California can be attributed to on-road motor vehicles, with an additional 27 percent attributed to other mobile sources, such as recreational boats, off-road recreational vehicles, and aircraft. Area-wide combustion sources contribute approximately 21 percent and include agricultural waste burning, open burning associated with forest management, and woodstoves and fireplaces. Stationary sources contribute less than one percent of the statewide 1,3-butadiene emissions. The primary stationary sources with reported 1,3-butadiene emissions are petroleum refining, manufacturing of man-made materials, and oil and gas extraction. The primary natural sources of 1,3-butadiene emissions are wildfires. The total statewide emission inventory for butadiene was estimated at 3,754 tons for 2008 (CARB 2009). More detailed sampling results for the San Francisco Bay area are presented in Table 1 (BAAQMD, 2008).
Investigators in the US, Europe, and China report similar average exposures to butadiene in the workplace. However, approaches to exposure assessment vary. Because butadiene monomer production and extraction are generally operated currently as closed processes, exposures tend to be low. However, with certain tasks, or with accidents and engineering failures, there can be transiently high exposures that are brief and intense. Air measurement may not accurately reflect these peaks. Historical levels of butadiene exposure in the workplace are thought to have been much higher than present values (Lynch 2001). Few data are available for butadiene concentrations prior to the 1970s. However, exposure modeling suggests that levels in the 1940s – 1950s were considerably higher, and estimated to be approximately 20 ppm (Lynch et al., 2001). There has been an annual trend of an approximate 6% drop in butadiene concentrations over time, with large decreases in the late 1950s and the early 1980s (Lynch 2001). More current measurements of butadiene in the workplace were provided by Chan et al. (2006), who measured worker exposure to air toxics in an 11-plant petrochemical complex in Taiwan. For the years 1997-1999, only 15.2% of the measurements were above the limit of detection, with a mean low concentration of 7.7 ppb, a mean high concentration of 36.7 ppb, and a maximum concentration of 3080 ppb butadiene.
Sapkota and colleagues evaluated butadiene exposure of tollbooth workers in the Baltimore Harbor Tunnel during the summer of 2001. Mean ambient butadiene concentrations outside the tollbooths varied by shift, with the morning levels (19.8 µg/m3) exceeding afternoon levels (14.9 µg/m3). The lowest concentrations were measured at night, and averaged 4.9 µg/m3. Considerable protection was offered by the tollbooth itself, within which ambient concentrations even in the height of traffic only measured 6.7 µg/m3 butadiene (Sapkota et al., 2005).
SRP DRAFT September 2012
Appendix D1 4 Butadiene
Table 1. 1,3-Butadiene Air Sampling in the San Francisco Bay Area (BAAQMD, 2008)
Site Average, ppb Maximum, ppb Number of Samples
% Less than MDL
Benecia 0.0275 0.1 30 96.7
Berkeley 0.0358 0.13 61 85.2
Concord 0.0287 0.070 31 90.3
Crockett 0.025 NA 31 100
Fremont 0.039 0.12 31 67.7
Livermore 0.031 0.090 31 90.3
Martinez 0.028 0.070 30 93.3
Napa 0.043 0.17 31 74.2
Oakland 0.0352 0.090 31 87.1
Redwood City 0.0453 0.15 31 80.6
Richmond 0.0261 0.060 31 96.8
San Francisco 0.0276 0.080 31 96.8
San Jose 0.0687 0.26 31 58.1
San Pablo 0.0261 0.060 31 96.8
San Rafael 0.0250 NA 31 100
Santa Rosa 0.0416 0.170 31 83.9
Sunnyvale 0.0259 0.050 28 100
Vallejo 0.0365 0.160 31 83.9
Note MDL = Minimum Detection Limit
SRP DRAFT September 2012
Appendix D1 5 Butadiene
One recent study measured butadiene concentrations prior to and after the Ireland Public Health Tobacco Act of 2002 ban on smoking in pubs (McNabola et al., 2006). The average ambient concentration of butadiene measured inside pubs prior to the ban was 4.15 μg/m3 (± 1.61 μg/m3). This is compared to average ambient outside measurement of 0.12 μg/m3 and an average indoor measurement of 0.22 μg/m3 following the smoking ban.
The TEACH (Toxic Exposure Assessment, Columbia/Harvard) study characterized personal exposures to urban air toxics among high school students living in inner city neighborhoods of New York City (Kinney et al., 2002). Exposure to air toxics was analyzed in 46 high school students using 48-hr personal monitoring, outdoor ambient monitoring, and in-home ambient monitoring. The students were mainly African American and Hispanic, and were required to be non-smokers from non-smoking families. The subjects ranged in age from 12.5 to 19.6 years old, with 42% male and 58% female. Investigators measured levels of particulates and concentrations of 17 volatile organic compounds (VOCs). Butadiene levels tended to be higher in the home and from personal exposures than what was measured in ambient outdoor air. The mean outdoor concentrations of butadiene were 0.13 μg/m3 (winter) and 0.14 μg/m3 (summer), versus in-home ambient concentrations of 1.18 μg/m3 in winter and 1.01 μg/m3 in summer. Mean personal concentrations were 0.87 μg/m3 in winter and 1.16 μg/m3 in summer (Kinney et al., 2002).
A qualitatively similar difference between personal/indoor air and outdoor air concentrations was observed in metropolitan Mexico City (Serrano-Trespalacios et al., 2004). Personal exposures to 34 VOCs were measured for adolescents and their families living close to one of five central monitoring stations over the period of one year. Simultaneous 24-hr indoor, outdoor and central site measurements were also taken. Indoor butadiene concentrations (mean = 2.5 μg/m3) were 2 to 6 times higher than outdoors measurements (mean 0.9 μg/m3). Personal exposures for all participants including adolescents (mean = 2.9 μg/m3) were also significantly higher than ambient outdoor concentrations (Serrano-Trespalacios et al., 2004).
Additional exposure analyses were conducted by Nazaroff and Singer (2004), who studied hazardous air pollutants including butadiene within US residences. The authors found that the population inhalation intake of butadiene was dominated by residential environmental tobacco smoke (ETS). Mean individual intake of butadiene was also dominated by residential ETS. Data analyses indicated that some 16 million US juveniles (2 months to 16 years old) are exposed to ETS in the home. Assuming between 4-20 cigarettes smoked per day in each residence, with an average of 515 μg butadiene/cigarette, the resulting daily intake of butadiene for juveniles was 16 – 37 μg. The total mean individual inhalation intake for juveniles was estimated to be approximately 10 mg butadiene/year from residential ETS, far exceeding the exposure to butadiene from ambient sources, estimated at approximately 0.3 mg/year (Nazaroff and Singer 2004).
SRP DRAFT September 2012
Appendix D1 6 Butadiene
4 Metabolism
Common routes of exposure to butadiene include inhalation and dermal exposure. For eyes and skin, direct contact with liquid butadiene can cause burns similar to frostbite, while vapors or fumes may be irritating to the eyes. Inhalation can cause cough, drowsiness, blurred vision, nausea, and respiratory paralysis.
The absorption of butadiene is dependent on its partition coefficient (log Kow = 1.99) and Henry’s Law constant (0.074 atm m3/mole). Butadiene is expected to be absorbed very quickly into the lungs. Physiological modeling uses blood/air partition coefficients of about 1 for butadiene (e.g., blood/air = 0.65 in humans, Pery & Bois, 2009). The absorbed dose as a proportion of total dose is expected to be high.
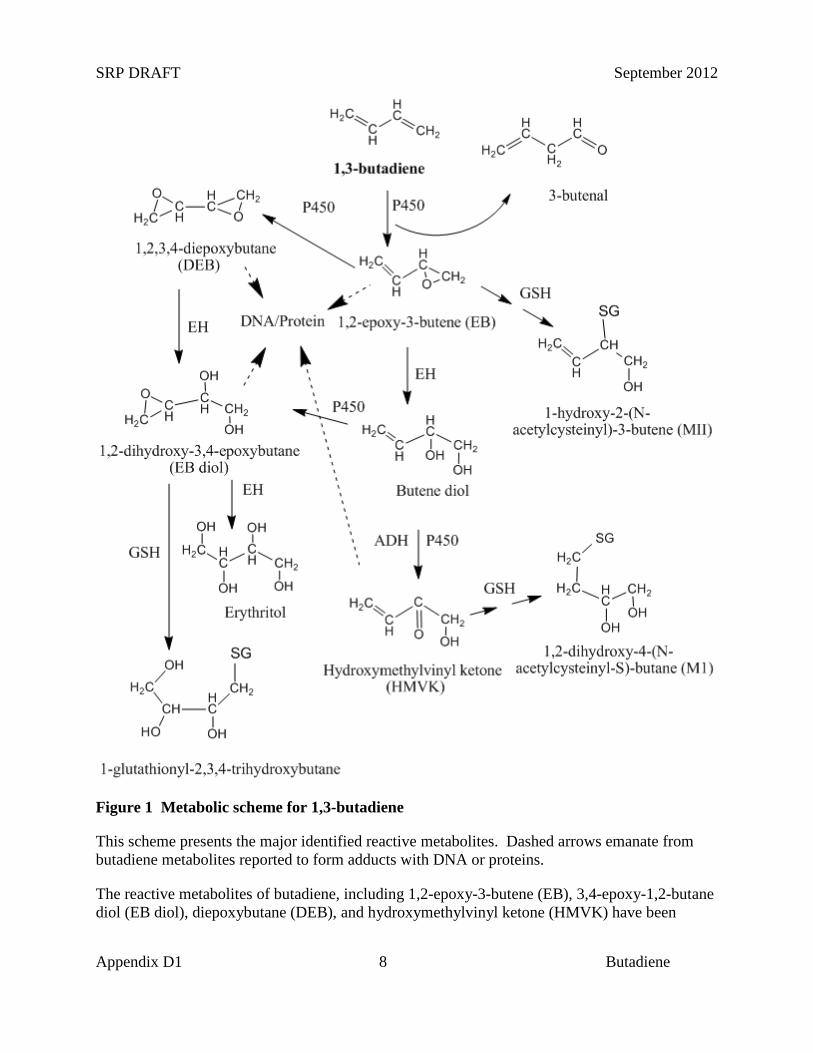
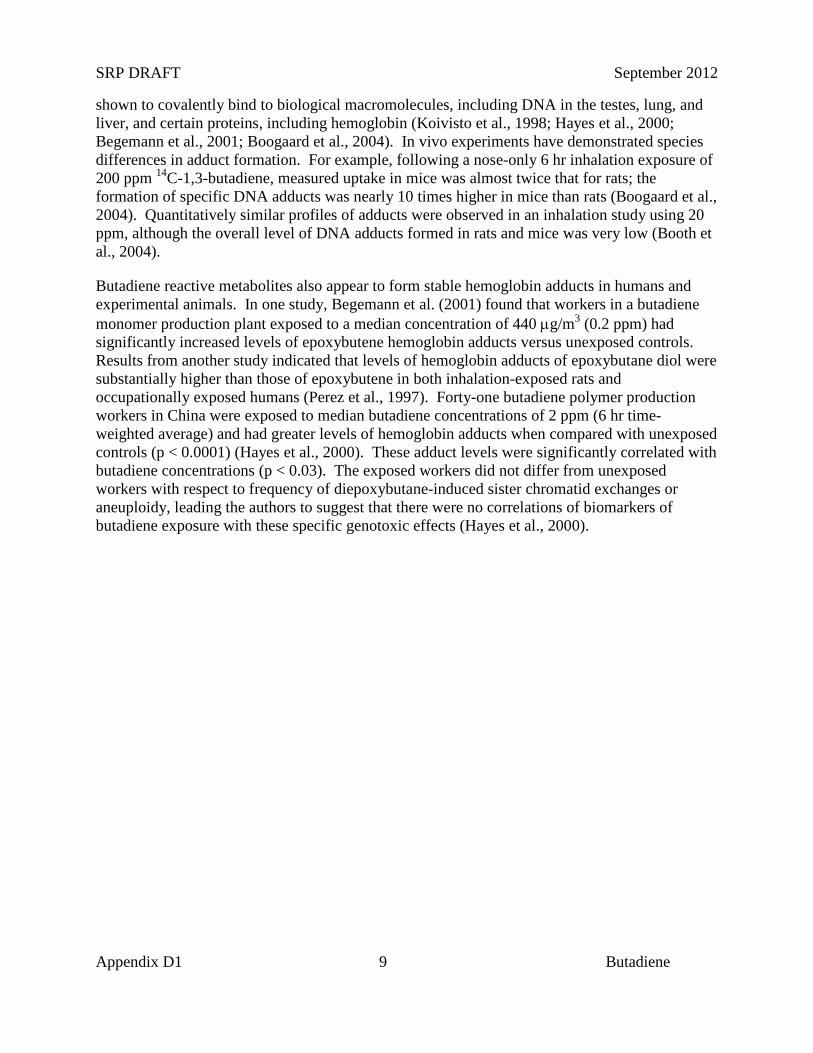
Once in the body, butadiene is activated, creating the toxic metabolite(s) associated with adverse effects. Activation of butadiene typically occurs in liver microsomes via P450-mediated oxidative metabolism in mammals (Bond and Medinsky 2001). Epoxybutene is the major oxidative metabolite, which is further oxidized to diepoxybutane and hydrolyzed to epoxybutane diol by microsomal epoxide hydrolase (Bond and Medinsky 2001; Elfarra et al., 2001) (Figure 1).
Available data indicate that metabolism is qualitatively similar among all species studied, although the rates of metabolite formation differ. Mice form the initial oxidative metabolite, epoxybutene, approximately 6 to 8 times faster than rats or humans (Csanady et al., 1992) and produce a greater proportion of active epoxide metabolites than rats (Bond et al., 1986; Himmelstein et al., 1994; Thornton-Manning et al., 1995; Csanady et al., 2011).
SRP DRAFT September 2012
Appendix D1 7 Butadiene
This may be related to differences in the amino acid composition of the binding pocket of CYP2E1 in rodents that facilitate hydrogen bonding and increase the probability of a second epoxidation. Compared to the rat, mouse CYP2E1 has an additional methylene group in the active site that binds epoxybutene more tightly, thus further enhancing formation of the second epoxide (Lewis et al., 1997). This observed difference in the quantity of epoxides formed correlates with the observed sensitivity and higher overall toxic response in mice versus rats. In vitro data from adult liver samples indicate that humans form epoxides of butadiene at rates (Vmax/Km) similar to mice but less than rats (Duescher and Elfarra 1994; Krause and Elfarra 1997), although it is unclear how this relates to in vivo toxicity in humans. Other authors, notably Csanady et al. (1992), reported that the Vmax/Km ratio obtained with mouse liver microsomes was 5.6- and 8.2-fold higher than the ratios obtained with human or rat liver microsomes, respectively. The observed differences in human butadiene oxidation rates between the studies may be attributed to variability in the expression of P450 2E1, 2A6 or other P450 enzymes in the human liver samples (Duescher and Elfarra, 1994). Detoxification of butadiene epoxides also varies across species, with human tissues preferentially detoxifying the derived epoxides through microsomal epoxide hydrolase to form butane diol followed by conjugation with GSH, whereas detoxification in mice occurs through glutathione-S-transferase (Boogaard and Bond 1996; Kemper et al., 2001). As a result, mice predominantly excrete 1-hydroxy-2-(N-acetylcysteinyl)-3-butene (MII), while adult humans excrete mainly 1,2-dihydroxy-4-(N-acetylcysteinyl-S)-butane (MI) (Figure 1).
SRP DRAFT September 2012
Appendix D1 8 Butadiene
Figure 1 Metabolic scheme for 1,3-butadiene
This scheme presents the major identified reactive metabolites. Dashed arrows emanate from butadiene metabolites reported to form adducts with DNA or proteins.
The reactive metabolites of butadiene, including 1,2-epoxy-3-butene (EB), 3,4-epoxy-1,2-butane diol (EB diol), diepoxybutane (DEB), and hydroxymethylvinyl ketone (HMVK) have been
SRP DRAFT September 2012
Appendix D1 9 Butadiene
shown to covalently bind to biological macromolecules, including DNA in the testes, lung, and liver, and certain proteins, including hemoglobin (Koivisto et al., 1998; Hayes et al., 2000; Begemann et al., 2001; Boogaard et al., 2004). In vivo experiments have demonstrated species differences in adduct formation. For example, following a nose-only 6 hr inhalation exposure of 200 ppm 14C-1,3-butadiene, measured uptake in mice was almost twice that for rats; the formation of specific DNA adducts was nearly 10 times higher in mice than rats (Boogaard et al., 2004). Quantitatively similar profiles of adducts were observed in an inhalation study using 20 ppm, although the overall level of DNA adducts formed in rats and mice was very low (Booth et al., 2004).
Butadiene reactive metabolites also appear to form stable hemoglobin adducts in humans and experimental animals. In one study, Begemann et al. (2001) found that workers in a butadiene monomer production plant exposed to a median concentration of 440 µg/m3 (0.2 ppm) had significantly increased levels of epoxybutene hemoglobin adducts versus unexposed controls. Results from another study indicated that levels of hemoglobin adducts of epoxybutane diol were substantially higher than those of epoxybutene in both inhalation-exposed rats and occupationally exposed humans (Perez et al., 1997). Forty-one butadiene polymer production workers in China were exposed to median butadiene concentrations of 2 ppm (6 hr time-weighted average) and had greater levels of hemoglobin adducts when compared with unexposed controls (p < 0.0001) (Hayes et al., 2000). These adduct levels were significantly correlated with butadiene concentrations (p < 0.03). The exposed workers did not differ from unexposed workers with respect to frequency of diepoxybutane-induced sister chromatid exchanges or aneuploidy, leading the authors to suggest that there were no correlations of biomarkers of butadiene exposure with these specific genotoxic effects (Hayes et al., 2000).
SRP DRAFT September 2012
Appendix D1 10 Butadiene
5 Acute Toxicity of 1,3-Butadiene
5.1 Acute Toxicity to Adult Humans
There is a paucity of data on acute human exposure to butadiene. Some early occupational health studies indicated that workers exposed to butadiene during rubber manufacturing experienced irritation of the eyes, nasal passages, throat, and lung (Wilson 1944). Some workers also experienced coughing, fatigue and drowsiness, although the symptoms diminished after the exposure ceased. Inhalation of butadiene is mildly narcotic at low concentrations, and may result in a feeling of lethargy and drowsiness (Sandmeyer, 1981). Exposure to very high concentrations of butadiene can result in narcosis, respiratory paralysis, and even death. The first signs of acute exposure to high concentrations are blurred vision, nausea, paresthesia, and dryness of the mouth, throat, and nose. This may be followed by fatigue, headache, vertigo, hypotension, slowed pulse rate, and unconsciousness (ATSDR, 1992).
In more recent occupational health studies, while there were significant differences in short-term inhaled concentrations of butadiene between exposed workers (mean 1.5 µg/m3, range 0.2 – 69.0 µg/m3) and unexposed workers (mean 0.4 µg/m3, range < 0.1 – 3.8 µg/m3), biomarkers of effect, such as sister chromatid exchanges, were not different between groups of workers (Lovreglio et al., 2005). A study of 437 full-shift and 14 short-term samples indicated that exposure to butadiene in the polymer industry ranged from < 0.005 – 43.2 ppm for 8 hr samples, and 0.088 – 210 ppm for acute (15 – 120 min) exposures (Fajen et al., 1990). Data on potential adverse effects from acute exposure were not reported. Since the workers in many of these studies were exposed to mixtures of chemicals, the relationship of acute butadiene exposure and adverse effects remains unclear.
In an acute study of human physiological factors, 133 adult subjects (both male and female) were exposed to 2 ppm butadiene for 20 minutes (Lin et al., 2001), and measured absorbed dose. The total butadiene concentration inhaled was significantly higher in males than in females; however there was no significant difference in the respiratory uptake fraction of the total concentration inhaled, which ranged from 18-74% for all participants. Females had larger body burdens per kilogram of body weight than males. Additionally, both age and smoking were negatively associated with butadiene uptake. The authors suggested that the wide range of butadiene uptake values indicates that administered dose is a poor estimator of absorbed dose or body burden (Lin et al., 2001).
5.2 Acute Toxicity to Infants and Children
The exposures most infants and children have to butadiene tend to be chronic and low level. However, by correlating changes in health effects with short-term changes in ongoing measurements of butadiene, it may be possible to discern the potential toxicity associated with acute exposures. This is the approach taken below to determine the effects of air pollutants on asthma exacerbation in children.
SRP DRAFT September 2012
Appendix D1 11 Butadiene
Delfino and colleagues studied the relationship between asthma symptoms in children and concentrations of ambient VOCs and criteria air pollutants, including butadiene (Delfino et al., 2003). To be eligible to participate, children were required to have a minimum 1-year history of physician diagnosed asthma and at least two symptomatic days per week that required use of a β-agonist inhaler. Twenty-two Hispanic children, aged 10 – 16, who were living within the Los Angeles air basin and who were nonsmokers from nonsmoking households, were enrolled in the study. The children kept daily symptom diaries from November 1999 through January 2000 and the severity of their symptoms was analyzed for association with ambient concentrations of particulates, ozone, and VOCs. Regression analysis examined air pollution concentrations on the same day or up to 4 days prior to the reported asthma symptoms, thereby allowing the analysis of the lag between the measured concentrations and the onset of health effects.
Butadiene was detected in 74 daily air pollution measurements with a mean concentration of 0.51 ppb (range 0.05 – 1.50 ppb). This study presented an OR of 1.32 (95% CI = 0.97-1.80) for the association between asthma symptoms and ambient butadiene concentrations on the previous day, and an OR of 1.16 (95% CI = 0.90-1.49) for the association between asthma symptoms and same-day butadiene levels. While these estimates are elevated, the confidence intervals included no effect. Thus, the authors interpreted these results as suggestive of an increased risk of asthma symptoms in children with butadiene exposure. However, the study was limited by small numbers, as only seven subjects reported symptom scores >2 and only 16 with scores >1. Also, associations for scores >2 were strongly influenced by one subject with moderate persistent asthma (Delfino et al., 2003). Results for elemental carbon and organic carbon were based on sampling over only 24 days. Similarly, particle associations in other periods were unavailable. Misclassification of VOC exposures may have occurred for some chemicals such as formaldehyde with important indoor sources but data from other studies support the view that motor vehicle emissions strongly influence the exposures to other VOCs such as benzene, ethylbenzene, toluene, xylenes and probably butadiene.
5.3 Acute Toxicity to Experimental Animals and In Vitro Toxicity
Few studies have reported the acute or short-term effects of butadiene. The lethal concentration resulting in 50% mortality in a population (LC50) was measured in an acute inhalation study using 2 hr exposures for mice and 4 hr exposures for rats (Shugaev 1969). The mouse LC50 was determined to be 122,000 ppm, and the rat LC50 was 129,000 ppm; no other effects were reported. In a National Toxicology Program study, male and female B6C3F1 mice were exposed to 0, 625, 1,250, 2,500, 5,000, or 8000 ppm butadiene in air for 15 days (NTP, 1984). Survival rates were unaffected by dosing, and no respiratory effects, cardiovascular lesions, or hepatic/gastrointestinal histopathology were noted even at the highest concentration. There was, however, a non-significant decrease in mean body weight at 8000 ppm butadiene when compared with controls (NTP 1984). No severe immunological changes were noted in humoral or cell-mediated immunity in mice exposed to 1250 ppm butadiene for 6 weeks (Thurmond et al., 1986).
The effects of butadiene inhalation (12.5 and 1250 ppm) on birth outcomes following a single acute 6-hr exposure of male mice were reported by Anderson et al. (1996). The mean number of implants per female was reduced at both concentrations compared to controls, but statistically
SRP DRAFT September 2012
Appendix D1 12 Butadiene
significant only at the higher level (p < 0.05). A dominant lethal effect (see Section 7.2) was not evident with the acute exposure, and there was no significant increase in post-implantation losses or fetal abnormalities.
In contrast to the parent compound, short-term studies of butadiene metabolites have shown acute effects, some of which were severe. Henderson and colleagues investigated the acute and sub-acute toxicity of the oxidative metabolite butadiene diepoxide in female B6C3F1 mice and in Sprague Dawley rats. Examination of the organs, including the liver, kidney, marrow, heart, and ovaries revealed that a single 6 hr inhalation exposure to 18 ppm butadiene diepoxide (3 to 4/group) induced no clinical signs of toxicity. However, the mice showed a slight increase in the number of alveolar macrophages and focal necrosis of the olfactory epithelium that started to reverse 7 days after exposure (Henderson et al., 1999). In the sub-acute portion of the study, mice (15/group) were exposed to either 2.5 or 5 ppm butadiene diepoxide for 6 hr/day for 5 days. The animals showed no body weight changes and no histopathology of the nose, larynx, or lung. However, in an earlier part of the study there was significant toxicity when mice and rats (56/group) were exposed to either 10 or 20 ppm butadiene diepoxide for 6 hr/day for 7 days. Both mice and rats experienced significant weight loss, corneal opacity, labored breathing, ruffled coats and hunched posture, as well as nasal mucosa degeneration, necrosis, inflammation, and ulceration. Additionally there were individual instances of focal hepatic necrosis and bone marrow atrophy in the mice. All but one of 56 mice from the high dose group were dead by the end of 12 days (98.2 %); by comparison, mortality in the low dose group was only 29% at 10 days of the 21 day study duration.
In a study of the butadiene metabolite 3-butene-1,2-diol, male B6C3F1 mice (4 to 5/group) were given a one-time intraperitoneal (i.p.) dose of 250 mg/kg and male Sprague Dawley rats (4 to 5/group) were given either 125, 200, or 250 mg/kg 3-butene-1,2-diol i.p. (Sprague et al., 2004). Two of the four rats dosed with 250 mg/kg died within 24 hours. Prior to death, the rats were lethargic and experienced seizures. At necropsy, it was evident that rats dosed at the highest level experienced severe hepatic necrosis and hemorrhage. The rats dosed with 200 mg/kg also showed indications of hepatic necrosis, inflammation, and hemorrhage. No other rat organ examined showed consistent dose-related lesions, although dosed rats exhibited significant hematological differences and significantly lower hepatic levels of glutathione when compared with controls (Sprague et al., 2004). Mice necropsied 4 hrs after treatment with 250 mg/kg 3-butene-1,2-diol did not exhibit any lesions, or any significant hematological changes. However, the mice did have significantly lower levels of hepatic glutathione 1 hr after treatment when compared to controls (Sprague et al., 2004). Half-lives for 3-butene-1,2-diol were calculated to be 2.12 hr in the rat and 0.44 hr in the mouse, which may partially account for the observed differences in acute toxicity between the two species (Sprague et al., 2004).
5.3.1 Toxicity In Vitro
Results from a human embryonic lung fibroblast study suggest that in vitro exposure to the butadiene metabolite 1,2:3,4-diepoxybutane (100 µM for 1 hr) is associated with substantial inhibition of cell proliferation and cell cycle arrest at G1 (Schmiederer et al., 2005). The authors suggested that cell proliferation was inhibited by a diepoxybutane-mediated alteration to cell division (Schmiederer et al., 2005). Another in vitro study found that products from the
SRP DRAFT September 2012
Appendix D1 13 Butadiene
incomplete combustion of butadiene were differentially taken up and retained by human bronchial epithelial cells (Penn et al., 2005). Investigators found that the combustion-generated ultrafine particles migrated from culture medium through the cell membrane, but not into the cell interior. The organic chemicals bound to the particles, however, were found to migrate from the particle surface, through the cell membrane into the cytosol, and into cellular vesicles. The authors suggested that toxicants, including butadiene, may transfer into cells directly without the cellular uptake of the carrier particles (Penn et al., 2005).
6 Developmental and Reproductive Toxicity
6.1 Developmental Effects
Many investigators have studied the potential for butadiene and its metabolites to cause reproductive or developmental toxicity. Earlier studies focused on overall reproductive fitness following short-term exposures, while more recent studies have focused on specific effects and mechanisms of toxicity.
Some of the first studies on the reproductive and developmental toxicity of butadiene were nested within chronic studies (Owen et al., 1987; Melnick et al., 1990). The National Toxicology Program developed the first series of short-term studies to evaluate developmental and reproductive toxicity of inhaled butadiene in mice and rats (Morrissey et al. 1990). In a three-part study, Sprague Dawley rats (24-28/group), and B6C3F1 and Swiss (CD-1) mice (18-22/group) were exposed to 0, 40, 200, or 1000 ppm butadiene on gestation days 6-15 for 6 hr/day and examined for teratological effects. A separate set of male mice was exposed to 0, 200, 1000, or 5000 ppm for 6 hr/day for 5 days for a sperm morphology study. Pregnant rats exhibited toxicity at 1000 ppm in the form of reduced extragestational weight gain and, during the first week of treatment, decreased body weight gain; there were no other differences in fertility or developmental parameters between exposed and control groups. In mice, however, there were increased numbers of fetal variations (supernumerary ribs, reduced ossification) in litters from dams exposed to 200 and 1000 ppm butadiene. These teratogenic effects occurred in the presence of maternal toxicity and fetal weight gain reductions. Male mice treated with 1000 or 5000 ppm butadiene showed significant increases in abnormal sperm 5 wks after exposure, consistent with an effect of butadiene on mature spermatozoa and spermatids (Morrissey et al., 1990).
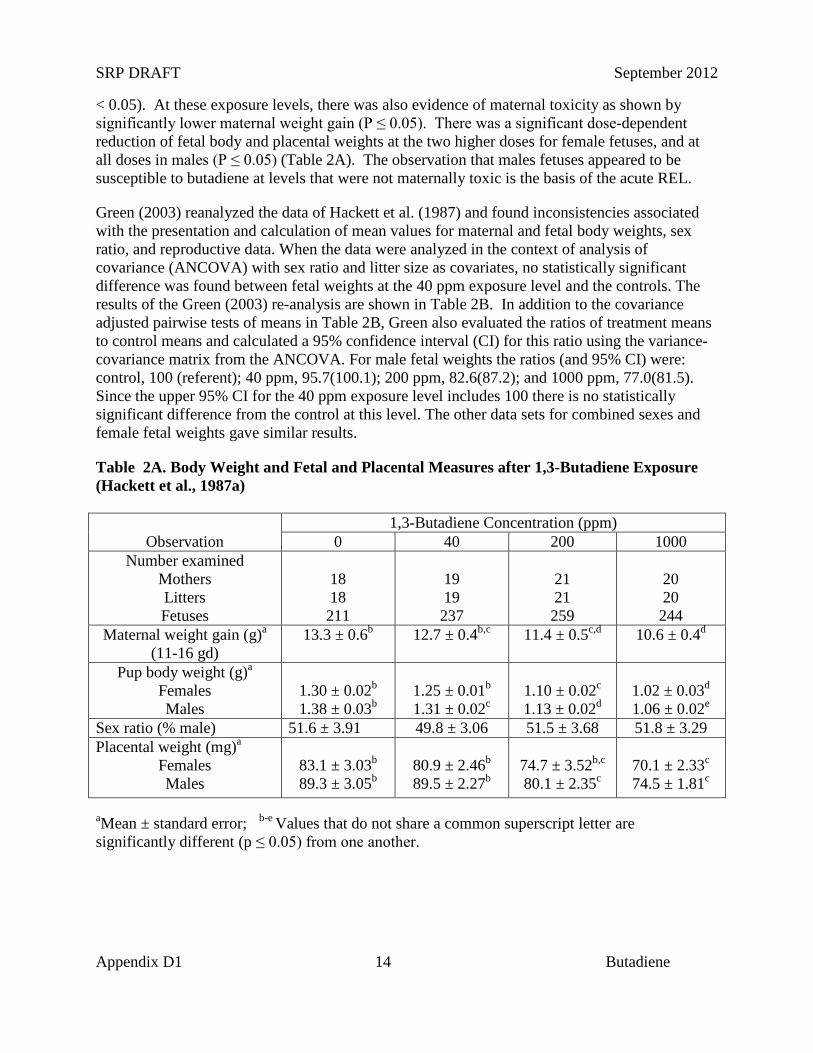
Teratological effects at maternal butadiene exposures of 200 ppm and higher were also observed by Hackett et al. (1987a), along with signs of maternal toxicity. However, in their study of reproductive performance, and maternal and fetal toxicity, Hackett et al. included a lower dose of 40 ppm. For this study, 78 pregnant female CD-1 mice received whole-body exposure to 0, 40, 200, or 1000 ppm butadiene for 6 hr/day on gestation days (gd) 6-15, with necropsy on gd 18. Mice were weighed prior to mating and repeatedly during gestation. They were observed for signs of toxicity during exposure and examined for gross tissue abnormalities at necropsy. Reproductive parameters included numbers of implantations sites, resorptions, and live and dead fetuses. Live fetuses were examined for signs of morphological anomalies and growth retardation. The incidences of fetal variations (supernumerary ribs and reduced ossification of the sternebrae) were significantly elevated in litters from mice exposed to 200 and 1000 ppm (P
SRP DRAFT September 2012
Appendix D1 14 Butadiene
< 0.05). At these exposure levels, there was also evidence of maternal toxicity as shown by significantly lower maternal weight gain (P ≤ 0.05). There was a significant dose-dependent reduction of fetal body and placental weights at the two higher doses for female fetuses, and at all doses in males (P ≤ 0.05) (Table 2A). The observation that males fetuses appeared to be susceptible to butadiene at levels that were not maternally toxic is the basis of the acute REL.
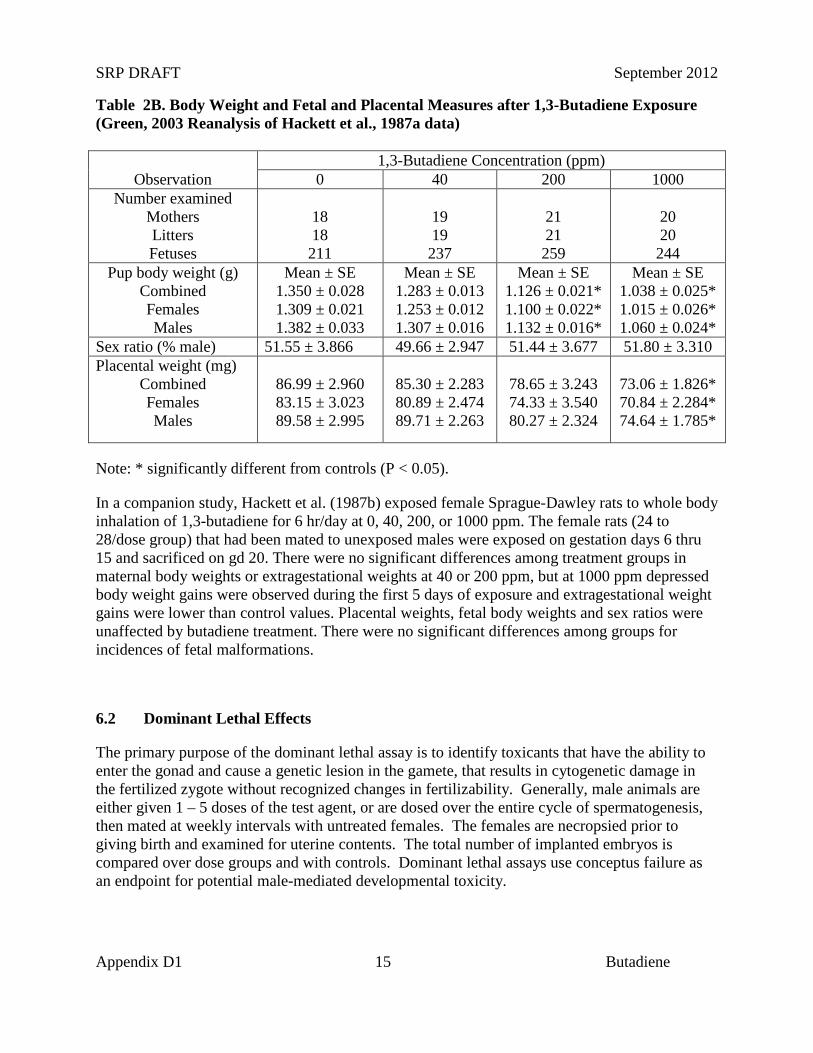
Green (2003) reanalyzed the data of Hackett et al. (1987) and found inconsistencies associated with the presentation and calculation of mean values for maternal and fetal body weights, sex ratio, and reproductive data. When the data were analyzed in the context of analysis of covariance (ANCOVA) with sex ratio and litter size as covariates, no statistically significant difference was found between fetal weights at the 40 ppm exposure level and the controls. The results of the Green (2003) re-analysis are shown in Table 2B. In addition to the covariance adjusted pairwise tests of means in Table 2B, Green also evaluated the ratios of treatment means to control means and calculated a 95% confidence interval (CI) for this ratio using the variance-covariance matrix from the ANCOVA. For male fetal weights the ratios (and 95% CI) were: control, 100 (referent); 40 ppm, 95.7(100.1); 200 ppm, 82.6(87.2); and 1000 ppm, 77.0(81.5). Since the upper 95% CI for the 40 ppm exposure level includes 100 there is no statistically significant difference from the control at this level. The other data sets for combined sexes and female fetal weights gave similar results.
Table 2A. Body Weight and Fetal and Placental Measures after 1,3-Butadiene Exposure (Hackett et al., 1987a)
Observation 1,3-Butadiene Concentration (ppm)
0 40 200 1000 Number examined
Mothers Litters Fetuses
18 18 211
19 19 237
21 21 259
20 20 244
Maternal weight gain (g)a (11-16 gd)
13.3 ± 0.6b 12.7 ± 0.4b,c 11.4 ± 0.5c,d 10.6 ± 0.4d
Pup body weight (g)a Females Males
1.30 ± 0.02b 1.38 ± 0.03b
1.25 ± 0.01b 1.31 ± 0.02c
1.10 ± 0.02c 1.13 ± 0.02d
1.02 ± 0.03d 1.06 ± 0.02e
Sex ratio (% male) 51.6 ± 3.91 49.8 ± 3.06 51.5 ± 3.68 51.8 ± 3.29 Placental weight (mg)a
Females Males
83.1 ± 3.03b 89.3 ± 3.05b
80.9 ± 2.46b 89.5 ± 2.27b
74.7 ± 3.52b,c 80.1 ± 2.35c
70.1 ± 2.33c 74.5 ± 1.81c
aMean ± standard error; b-e Values that do not share a common superscript letter are significantly different (p ≤ 0.05) from one another.
SRP DRAFT September 2012
Appendix D1 15 Butadiene
Table 2B. Body Weight and Fetal and Placental Measures after 1,3-Butadiene Exposure (Green, 2003 Reanalysis of Hackett et al., 1987a data)
Observation 1,3-Butadiene Concentration (ppm)
0 40 200 1000 Number examined
Mothers Litters Fetuses
18 18 211
19 19 237
21 21 259
20 20 244
Pup body weight (g)
Combined Females Males
Mean ± SE 1.350 ± 0.028 1.309 ± 0.021 1.382 ± 0.033
Mean ± SE 1.283 ± 0.013 1.253 ± 0.012 1.307 ± 0.016
Mean ± SE 1.126 ± 0.021* 1.100 ± 0.022* 1.132 ± 0.016*
Mean ± SE 1.038 ± 0.025* 1.015 ± 0.026* 1.060 ± 0.024*
Sex ratio (% male) 51.55 ± 3.866 49.66 ± 2.947 51.44 ± 3.677 51.80 ± 3.310 Placental weight (mg)
Combined Females Males
86.99 ± 2.960 83.15 ± 3.023 89.58 ± 2.995
85.30 ± 2.283 80.89 ± 2.474 89.71 ± 2.263
78.65 ± 3.243 74.33 ± 3.540 80.27 ± 2.324
73.06 ± 1.826* 70.84 ± 2.284* 74.64 ± 1.785*
Note: * significantly different from controls (P < 0.05).
In a companion study, Hackett et al. (1987b) exposed female Sprague-Dawley rats to whole body inhalation of 1,3-butadiene for 6 hr/day at 0, 40, 200, or 1000 ppm. The female rats (24 to 28/dose group) that had been mated to unexposed males were exposed on gestation days 6 thru 15 and sacrificed on gd 20. There were no significant differences among treatment groups in maternal body weights or extragestational weights at 40 or 200 ppm, but at 1000 ppm depressed body weight gains were observed during the first 5 days of exposure and extragestational weight gains were lower than control values. Placental weights, fetal body weights and sex ratios were unaffected by butadiene treatment. There were no significant differences among groups for incidences of fetal malformations.
6.2 Dominant Lethal Effects
The primary purpose of the dominant lethal assay is to identify toxicants that have the ability to enter the gonad and cause a genetic lesion in the gamete, that results in cytogenetic damage in the fertilized zygote without recognized changes in fertilizability. Generally, male animals are either given 1 – 5 doses of the test agent, or are dosed over the entire cycle of spermatogenesis, then mated at weekly intervals with untreated females. The females are necropsied prior to giving birth and examined for uterine contents. The total number of implanted embryos is compared over dose groups and with controls. Dominant lethal assays use conceptus failure as an endpoint for potential male-mediated developmental toxicity.
SRP DRAFT September 2012
Appendix D1 16 Butadiene
Nested within the larger National Toxicology Program study discussed above, dominant lethality was studied in litters sired from male mice exposed to 70, 200, 1000, or 5000 ppm butadiene for 6 hr/day for 5 days (Morrissey et al., 1990). There was no mortality noted in the male mice even at the highest butadiene concentrations, and body weights were unaffected. One week following exposure to 1000 ppm, investigators observed a significant increase in dead implants as a percentage of total implants (p ≤ 0.05). There were non-significant increases in dead implants at 200 and 5000 ppm. During the second week following exposure, there were significant increases in dead implants in both the 200 and 1000 ppm groups (p ≤ 0.05). The investigators noted that the dose-dependency of the effects weakens at higher dose levels, but the effect in week 1 and 2 is consistent with an effect of butadiene on mature spermatids and spermatozoa. The authors suggested that because of the effects noted in sperm morphology and dominant lethality, butadiene might act as a germ cell mutagen in mice (Morrisey et al., 1990).
In 1993, Anderson and colleagues considered dominant lethality in a more focused study of male-mediated reproductive toxicity following acute and short-term butadiene exposure. In the acute study, male CD-1 mice were exposed to 0 (n = 25), 1250 (n = 25), or 6250 (n = 50) ppm butadiene one time for 6 hr, then mated with untreated females. In the short-term study, male CD-1 mice were also exposed to 0, 12.5, or 1250 ppm butadiene for 6 hr/day 5 days/wk for 10 weeks prior to mating, then mated with untreated females. The necropsied dams were examined for the number of live fetuses, the number of early and late post-implantation deaths, and the number and type of fetal gross malformation. A single 6 hr exposure did not elicit a dominant lethal effect, although there was a non-significant reduction in the mean number of implants in the 1250 and 6250 ppm dose groups. Such findings may indicate germ cell toxicity or pre-implantation losses, which are generally not associated with heritable changes (Anderson et al., 1993). Subchronic exposures to 12.5 ppm butadiene were associated with increased congenital malformations and late fetal deaths. In addition, there was a significant incidence of dominant lethality at 1250 ppm butadiene. The authors concluded that butadiene is mutagenic and teratogenic following subchronic exposures (Anderson et al., 1993).
To further elucidate the dominant lethality of butadiene, Adler and Anderson (1994) exposed CD-1 male mice to 1250 ppm for 6 hr/day, 5 day/week for 10 weeks prior to mating, and then mated the exposed males with unexposed females for 4 successive weeks. There was a total (summed) incidence of 23.1% dominant lethality over 3 weeks of mating. The highest weekly incidence of dominant lethality was 12.4% after week 2 of mating. No other fertility differences were noted between exposed and control animals. From the timing of the dominant lethal effect, the authors suggested that spermatozoa and late spermatids were the most sensitive germ cell types to butadiene inhalation (Adler and Anderson, 1994). Most of these results were duplicated in another report by Anderson and colleagues (Anderson et al., 1996) and are consistent with dominant lethal findings by Morrisey et al. (1990).
In 1994, Adler and colleagues designed a cross-bred (102/E1 x C3H/E1) mouse study to consider not only dominant lethality but teratogenicity in pregnancies allowed to come to term. Male mice (20 per group) were exposed to 0 or 1300 ppm butadiene for 6 hr/day for 5 days, and then mated with unexposed females for 4 consecutive weeks. Groups of pregnant dams were sacrificed at gestation day 14 following successive weeks of mating. The percentage of dead implants and dominant lethals was elevated in litters that were sired during weeks 1, 2, and 3
SRP DRAFT September 2012
Appendix D1 17 Butadiene
following butadiene exposure in the males. The effect, however, was highly significant (p ≤ 0.01) in week 2. All other fertility parameters were similar to controls (Adler et al., 1994). From the timing of effects, the authors concluded that dominant lethal mutations were induced in spermatozoa and late spermatids, suggesting that butadiene may induce heritable translocations in these germ cell stages (Adler et al., 1994), consistent with their previous work in CD-1 mice (Adler and Anderson 1994).
Two other recent studies have demonstrated a positive association between inhalation of low concentrations of butadiene and dominant lethality, with mice being more susceptible than rats (Anderson et al., 1998; Brinkworth et al., 1998). Brinkworth and colleagues exposed male CD-1 mice to 0, 12.5 or 125 ppm butadiene for 6 hrs/day for 5 days a week for 10 weeks followed by mating with untreated females. A significant increase in dominant lethality was noted, but only in the 125 ppm group. Anderson and colleagues exposed male CD-1 mice to 0, 12.5, 65, or 130 ppm butadiene for 6 hr/day, 5 days/week for four weeks and groups of male Sprague Dawley rats to 0, 65, 400, or 1250 ppm butadiene for 6 hr/day, 5 days/week for 10 weeks. There was a significant increase in dominant lethality in mice in the 65 and 130 ppm dose groups, although the effect was not dose-related. Male-specific effects in the rats were not observed at any exposure level (Anderson et al., 1998). Additionally, one study showed that the butadiene metabolite diepoxybutane is also associated with dominant lethality. Male mice were given either 0 or 54 mg/kg diepoxybutane (DEB), and mated for up to 16 days after treatment with untreated females. A single dose of 54 mg/kg DEB was toxic to mature spermatozoa; therefore, there was a low number of total implants in the first 8 days after treatment. However, there was an increase in dominant lethals throughout all mating intervals. The authors suggested that diepoxybutane is likely a late spermatid mutagen (Adler et al., 1995).
Accumulated data appear to suggest that inhalation exposure of butadiene is associated with an increase in dominant lethal effects even at concentrations below the threshold for acute toxicity. There is evidence of species and strains difference in susceptibility, with mice being more susceptible than rats, and outbred CD-1 mice appearing to show dominant lethality at lower butadiene concentrations than other strains of mice. Regardless of the length of pre-mating dosing (i.e., a single 6 hr, 5 day, or 4-10 week exposures), dominant lethal effects were associated with butadiene effects in the more mature male germ cells, specifically mature sperm and late spermatids.
6.3 Germ Cell Mutagenicity
Results from dominant lethal experiments suggest that butadiene exposure may be associated with germ cell mutagenicity. As such, several researchers investigated the potential for butadiene to induce heritable mutations. In one study, C3H/E1 male mice were exposed to 1300 ppm butadiene for 6 hr/day for 5 days and mated with untreated females. Half the offspring were examined for dominant lethality while the other half were allowed to mature in order to study heritable effects in subsequent generations (Adler et al., 1995). There was a non-significant increase in dominant lethal mutations in F1 litters sired from butadiene-exposed males. However, when the F1 males were allowed to mature and mate, the resulting F2 litters were approximately half as large as litters sired by control F1 mice. Additionally, there was a 2.7%
SRP DRAFT September 2012
Appendix D1 18 Butadiene
translocation frequency in F2 pups following F0 paternal butadiene exposure compared with a 0.05% translocation frequency from historical controls (Adler et al., 1995).
In a follow-up study, mice exposed to 0, 130, or 500 ppm butadiene for 6 hr/day for 5 days were mated for 4 consecutive weeks with untreated females. A positive dominant lethal effect was observed for 130 and 500 ppm during week one of mating (a sperm effect) and for 500 ppm during week two of mating (a late spermatid effect). Among 434 F1 offspring from butadiene-exposed F0 sires, there was a 1.15% incidence of translocation when compared with 0.05% translocation in historical controls (p < 0.001) (Adler et al., 1998). The heritable mutation was identified as a reciprocal translocation with insertion of the central portion of chromosome 9 into chromosome 19 (Adler et al., 1998). The genetic risk from butadiene exposure was calculated using data from these two studies with a linear dose-response model [Y = 0.05 + 6.9 x 10⁻⁵ X]. Results from the calculations suggest that butadiene has the potential to cause heritable mutations in mouse sperm that can be transmitted to subsequent generations with a doubling dose of 725 ppm-h butadiene (Adler et al., 1998).
Pacchierotti et al. (1998) investigated the paternal transmission of butadiene-induced chromosomal aberrations to one cell embryos. Male mice (102/E1 x C3H/E1) were exposed to 0, 130, 500, or 1300 ppm butadiene for 6 hr/day for 5 days then mated 1:2 with untreated B6C3F1 females. The resulting zygotes were arrested at first cleavage and analyzed for chromosomal aberrations in each of the first three weeks of mating following paternal exposure. Zygotes conceived in weeks one and two of mating were produced from oocytes from untreated females fertilized with either mature sperm or late spermatids. Zygotes conceived in week three of mating were the product of oocyte-early spermatid or oocyte-late prophase spermatocyte unions. Investigators found a dose-dependent increase in structural chromosomal aberrations in first-cleavage embryos conceived in week one of mating, with significance (p < 0.005) achieved at 500 ppm butadiene. Embryos conceived during week two also showed dose-dependent increases in chromosomal aberrations, with significance achieved at 1300 ppm butadiene (p < 0.025). The authors concluded that the male germ cells associated with the observed embryo mutations were likely the same types as those associated with male-mediated dominant lethality in other studies, and that sperm in the final stages of maturation were most susceptible to the mutagenic effects of butadiene.
Anderson et al. (1997) evaluated the effects of 1,2-epoxybutene (BMO) and three other chemicals (β-estradiol, daidzein, dibromochloropropane) on human sperm using the alkaline Comet assay for DNA damage in vitro. Fresh and frozen samples from two fertile donors each and frozen samples from two infertile donors were analyzed. All the chemicals induced significant effects in all exposed samples (P < 0.01). For BMO exposures of 0, 80, 160, and 320 µM, significant dose-response model fits were obtained only with frozen samples. Using the continuous Hill and polynomial models, BMCL05 values ranged from 0.6 to 24.2 µM with an arithmetic mean of 12.3 µM and a geometric mean of 4.64 µM. The effects seen with BMO were comparable to those seen with dibromochloropropane, a known male reproductive toxicant, at 20 to 200 µM. Internal exposure estimates obtained with human PBPK models based on Kohn and Melnick (2001) indicate that BMO blood concentrations in the range of BMCL05’s might be achieved by acute occupational exposures to butadiene (e.g., 200 ppm BD x 2 hr = 6.8 to 15.6 µM BMO Cmax in venous blood). Alternatively, the human PBPK model of Brochot et al.
SRP DRAFT September 2012
Appendix D1 19 Butadiene
(2007) predicts lower blood and tissue concentrations of BMO for the same exposure scenario (i.e., 0.1 to 0.7 µM).
The majority of acute reproductive toxicity studies of butadiene have focused on male animals. No similar studies were found for female animals. However, one study by Tiveron and colleagues (1997) considered the acute female reproductive toxicity of the butadiene metabolite diepoxybutane. Female B6C3F1 mice received a single intraperitoneal injection of 26, 34, 43, or 52 mg/kg diepoxybutane, and then mated with unexposed males. The embryos were arrested at first-cleavage metaphase and examined for chromosomal aberrations. There were no consistent diepoxybutane-associated effects on mating, fertilization, or cell-cycle progression of the fertilized oocytes, although there was a decrease in the average number of zygotes harvested from each female. There was, however, a significant increase in frequency and number of chromosomal aberrations in exposed zygotes when compared with controls in all dose groups (p < 0.05-0.001).
When comparing the sensitivity of male and female gametes to pre-conception exposures, it appears that zygotes produced from exposed sperm-nonexposed oocytes are many times more likely to contain chromosomal aberrations (Adler et al., 1995) than zygotes conceived with exposed oocytes (Tiveron et al., 1997). While chromosomal damage may be transmitted via female germ cells (Adler et al., 1995), sperm appear to be at much higher risk of the mutagenic effects of butadiene and butadiene metabolites.
6.4 Ovarian Atrophy
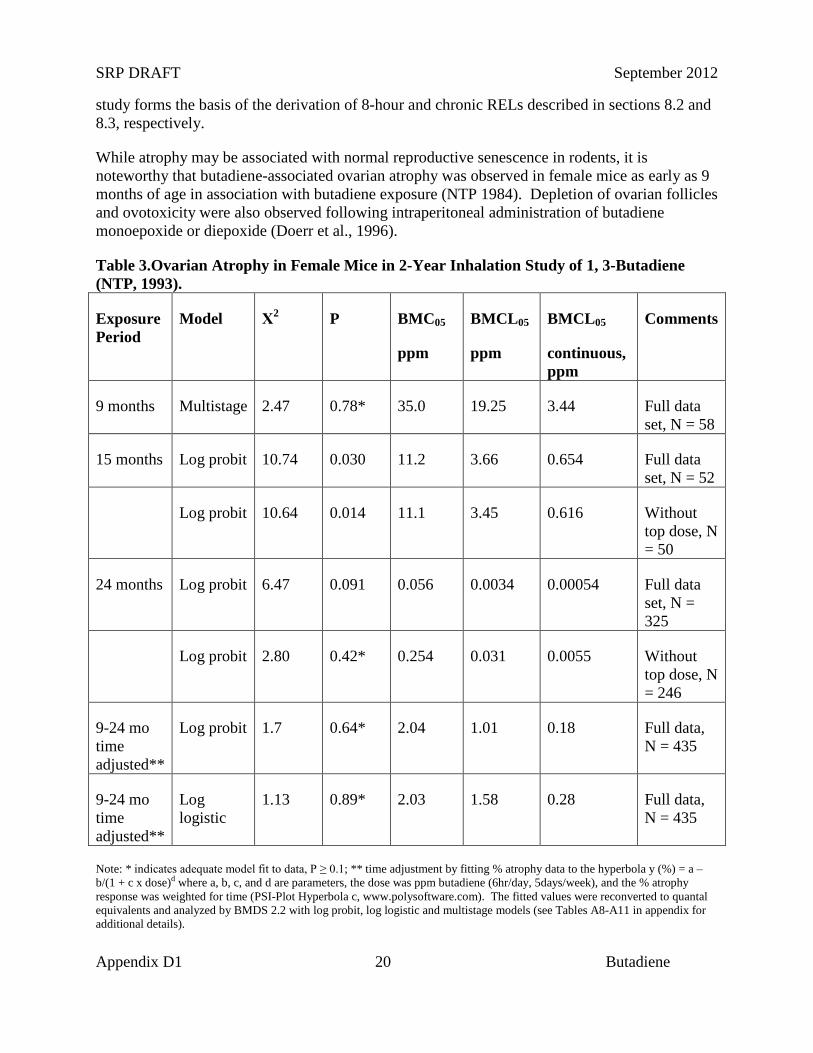
Reproductive organs appear to be critical targets of chronic butadiene exposure, and ovotoxicity is the basis of the chronic and 8-hour RELs. Effects in the female reproductive tract were identified in an NTP chronic study, where B6C3F1 mice were exposed to 0, 625, or 1250 ppm butadiene for 6 hr/day, 5 days/wk for a planned period up to 103 weeks (NTP, 1984). Significant ovarian atrophy was observed in female mice in both dose groups (40 of 45 females at 625 ppm; 40 of 48 females at 1250 ppm). NTP investigators identified a chronic LOAEL of 625 ppm, based on the observed gonadal effects (NTP, 1984). In an effort to further elucidate the reproductive toxicity, NTP investigators conducted a study in B6C3F1 mice with lower butadiene concentrations (Melnick et al., 1990; NTP 1993). The animals were exposed to 0, 6.25, 20, 62.5, 200, or 625 ppm for 6 hr/day, 5 days/wk for up to 65 weeks. While there was significant mortality, a concentration-related increase in ovarian atrophy was also observed. At 40 weeks, ovarian atrophy was present in females exposed to 200 and 625 ppm butadiene. At 65 weeks, ovarian atrophy was present in all groups exposed to ≥ 20 ppm butadiene, and female mice exposed to the lowest concentrations of butadiene (6.25 ppm) exhibited atrophy at the end of the study at 105 weeks (Melnick et al., 1990; NTP, 1993). Based on these results, NTP investigators identified a chronic LOAEL of 6.25 ppm for reproductive toxicity (NTP, 1993). The 9-, 15- and 24-month ovarian atrophy data from NTP (1993) were subjected to benchmark dose analysis as summarized in Table 3. Only the 9-month interim sacrifice data were adequately fit by the multistage model (Χ2 = 2.47, P = 0.78, BMCL05 = 19.2 ppm). The 24-month data were adequately fit by the log probit model if the top dose was excluded. If the data were included in a time-adjusted model all of the data could be fit. Using the log probit model a BMCL05 of 1.01 ppm butadiene was obtained with a Χ2 of 1.7, P = 0.64 (BMDS v 2.2). This
SRP DRAFT September 2012
Appendix D1 20 Butadiene
study forms the basis of the derivation of 8-hour and chronic RELs described in sections 8.2 and 8.3, respectively.
While atrophy may be associated with normal reproductive senescence in rodents, it is noteworthy that butadiene-associated ovarian atrophy was observed in female mice as early as 9 months of age in association with butadiene exposure (NTP 1984). Depletion of ovarian follicles and ovotoxicity were also observed following intraperitoneal administration of butadiene monoepoxide or diepoxide (Doerr et al., 1996).
Table 3.Ovarian Atrophy in Female Mice in 2-Year Inhalation Study of 1, 3-Butadiene (NTP, 1993).
Exposure Period
Model Χ2 P BMC05
ppm
BMCL05
ppm
BMCL05
continuous, ppm
Comments
9 months Multistage 2.47 0.78* 35.0 19.25 3.44 Full data set, N = 58
15 months Log probit 10.74 0.030 11.2 3.66 0.654 Full data set, N = 52
Log probit 10.64 0.014 11.1 3.45 0.616 Without top dose, N = 50
24 months Log probit 6.47 0.091 0.056 0.0034 0.00054 Full data set, N = 325
Log probit 2.80 0.42* 0.254 0.031 0.0055 Without top dose, N = 246
9-24 mo time adjusted**
Log probit 1.7 0.64* 2.04 1.01 0.18 Full data, N = 435
9-24 mo time adjusted**
Log logistic
1.13 0.89* 2.03 1.58 0.28 Full data, N = 435
Note: * indicates adequate model fit to data, P ≥ 0.1; ** time adjustment by fitting % atrophy data to the hyperbola y (%) = a – b/(1 + c x dose)d where a, b, c, and d are parameters, the dose was ppm butadiene (6hr/day, 5days/week), and the % atrophy response was weighted for time (PSI-Plot Hyperbola c, www.polysoftware.com). The fitted values were reconverted to quantal equivalents and analyzed by BMDS 2.2 with log probit, log logistic and multistage models (see Tables A8-A11 in appendix for additional details).
SRP DRAFT September 2012
Appendix D1 21 Butadiene
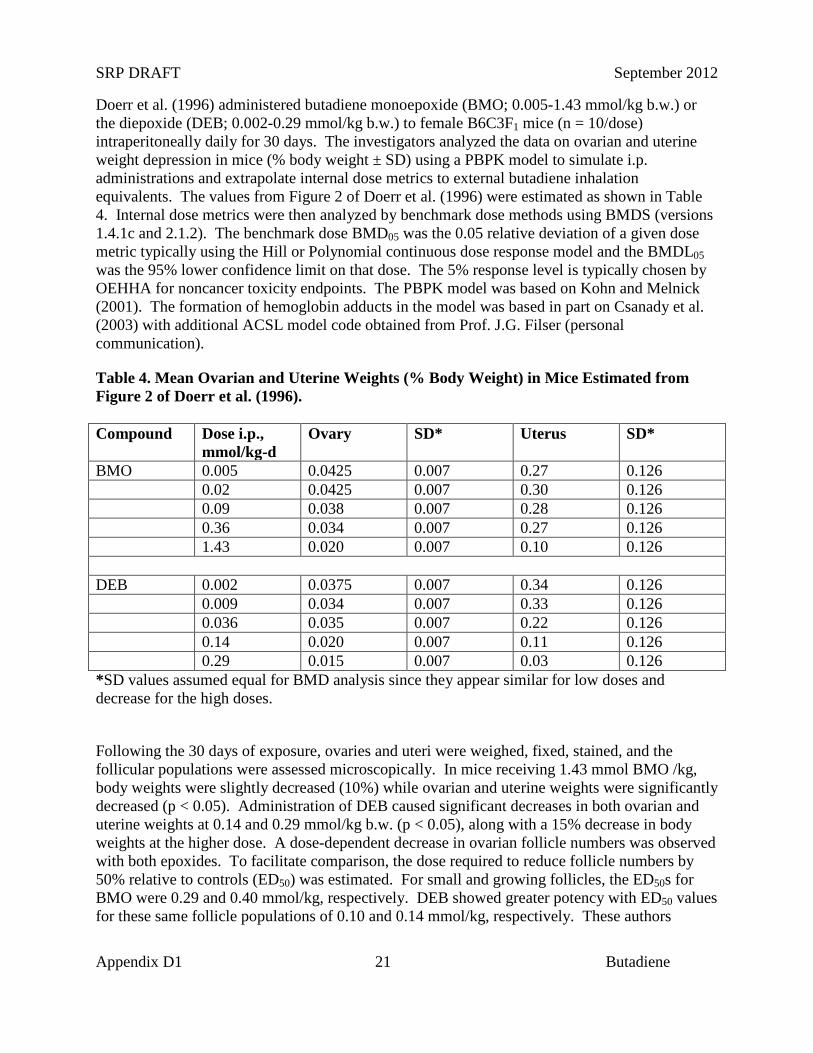
Doerr et al. (1996) administered butadiene monoepoxide (BMO; 0.005-1.43 mmol/kg b.w.) or the diepoxide (DEB; 0.002-0.29 mmol/kg b.w.) to female B6C3F1 mice (n = 10/dose) intraperitoneally daily for 30 days. The investigators analyzed the data on ovarian and uterine weight depression in mice (% body weight ± SD) using a PBPK model to simulate i.p. administrations and extrapolate internal dose metrics to external butadiene inhalation equivalents. The values from Figure 2 of Doerr et al. (1996) were estimated as shown in Table 4. Internal dose metrics were then analyzed by benchmark dose methods using BMDS (versions 1.4.1c and 2.1.2). The benchmark dose BMD05 was the 0.05 relative deviation of a given dose metric typically using the Hill or Polynomial continuous dose response model and the BMDL05 was the 95% lower confidence limit on that dose. The 5% response level is typically chosen by OEHHA for noncancer toxicity endpoints. The PBPK model was based on Kohn and Melnick (2001). The formation of hemoglobin adducts in the model was based in part on Csanady et al. (2003) with additional ACSL model code obtained from Prof. J.G. Filser (personal communication).
Table 4. Mean Ovarian and Uterine Weights (% Body Weight) in Mice Estimated from Figure 2 of Doerr et al. (1996). Compound Dose i.p.,
mmol/kg-d Ovary SD* Uterus SD*
BMO 0.005 0.0425 0.007 0.27 0.126 0.02 0.0425 0.007 0.30 0.126 0.09 0.038 0.007 0.28 0.126 0.36 0.034 0.007 0.27 0.126 1.43 0.020 0.007 0.10 0.126 DEB 0.002 0.0375 0.007 0.34 0.126 0.009 0.034 0.007 0.33 0.126 0.036 0.035 0.007 0.22 0.126 0.14 0.020 0.007 0.11 0.126 0.29 0.015 0.007 0.03 0.126 *SD values assumed equal for BMD analysis since they appear similar for low doses and decrease for the high doses.
Following the 30 days of exposure, ovaries and uteri were weighed, fixed, stained, and the follicular populations were assessed microscopically. In mice receiving 1.43 mmol BMO /kg, body weights were slightly decreased (10%) while ovarian and uterine weights were significantly decreased (p < 0.05). Administration of DEB caused significant decreases in both ovarian and uterine weights at 0.14 and 0.29 mmol/kg b.w. (p < 0.05), along with a 15% decrease in body weights at the higher dose. A dose-dependent decrease in ovarian follicle numbers was observed with both epoxides. To facilitate comparison, the dose required to reduce follicle numbers by 50% relative to controls (ED50) was estimated. For small and growing follicles, the ED50s for BMO were 0.29 and 0.40 mmol/kg, respectively. DEB showed greater potency with ED50 values for these same follicle populations of 0.10 and 0.14 mmol/kg, respectively. These authors
SRP DRAFT September 2012
Appendix D1 22 Butadiene
suggested that butadiene ovotoxicity may be associated with metabolism of the parent compound to reactive diepoxides in situ.
Perez et al. (1997) measured N-(2,3,4-trihydroxybutyl)valine (THBV) adducts of hemoglobin in rats exposed to 1,3-butadiene or butadiene epoxides. Sprague-Dawley rats (2 to 3/group) were treated with single i.p. doses of either epoxybutene (78.3 mg/kg), epoxybutanediol (30 mg/kg), or diepoxybutane (16,7, 33.4, 60 mg/kg). The animals were sacrificed and blood was collected after 48 hr. Rats (3/group) were exposed to 1,3-butadiene by inhalation for 6 hr/d for 5 days at concentrations of 0, 50, 200 or 500 ppm. Two humans occupationally exposed to 1 ppm butadiene were also analyzed. The HBI (hemoglobin binding index, pmol THBV adduct/g/µmol/kg for epoxides, or /ppm-hr for butadiene exposures) for rats was 0.07 for epoxybutene, 3.4 for epoxybutanediol, and 4.0 to 9.3 for diepoxybutane. For butadiene exposures in rats, THBV adducts ranged from 0.04 to 0.5 pmol/g/ppm-hr. For the exposed human subjects, the THBV adduct levels were 0.15 and 0.20 pmol/g. The results indicate that epoxybutanediol is comparable to DEB in it adduct forming ability and considerably more active than BMO.
The reproductive toxicity of butadiene in female rats is not as apparent. In the Hazelton Laboratories study, Sprague Dawley rats were exposed to 0, 1000, or 8000 ppm butadiene for 6 hr/day, 5 day/week, for 105 weeks. Although investigators reported tumors in certain reproductive organs, there was no clear statement on the presence or absence of ovarian atrophy, or any other reproductive effect in females (Owen et al., 1987).
Male reproductive effects have also been observed in relation to chronic butadiene exposure, although generally at concentrations greater than those that elicited effects in female animals. In the NTP study, investigators observed a significant concentration-related decrease in testis weight at weeks 40 and 65 for males exposed to ≥ 62.5 ppm butadiene (Melnick et al., 1990). In addition, testicular atrophy (measured at weeks 40 and 60) was observed in males exposed to 625 ppm butadiene (Melnick et al., 1990). In the later NTP study (1993), investigators once again observed testicular atrophy at 625 ppm, and reduced testicular weights in the 200 ppm and 625 ppm exposure groups at the end of the study. However, no effect was seen at the lower butadiene concentrations, as noted in female mice (NTP 1993). In the Hazelton Laboratories study, there was no clear statement of the presence or absence of testicular atrophy in male rats exposed to up to 8000 ppm butadiene. However Leydig cell tumors were observed in 3 males in the 1000 ppm group and 8 males in the 8000 ppm group (Owen et al., 1987).
SRP DRAFT September 2012
Appendix D1 23 Butadiene
7 Chronic Toxicity of 1,3-Butadiene
7.1 Chronic Toxicity to Adult Humans
Studies on the chronic effects of butadiene have been centered in the styrene-butadiene rubber manufacturing industry and the butadiene monomer industry. The Occupational Health Studies Group at the University of North Carolina, Chapel Hill, organized one of the earliest retrospective epidemiological studies conducted in the rubber industry. Investigators observed rubber workers during the period of 1964 – 1972 and reported an increase in overall mortality, emphysema, and cardiovascular diseases (chronic rheumatic and atherosclerotic heart disease) among the subjects (McMichael et al., 1976).
Johns Hopkins University and the National Institute for Occupational Safety and Health initiated two large cohort studies of North American synthetic rubber industry workers (Meinhardt et al., 1982; Matanoski et al., 1990). Investigators studied male workers at eight synthetic rubber plants and two plant complexes in Texas, Louisiana, Kentucky, and Ontario, and included men who began their employment as far back as 1943. Results from these studies were the first to report increased risk of hematologic neoplasms from workplace exposure to butadiene. The University of Alabama designed a series of follow-up epidemiological studies, and has since reported an excess of leukemia among hourly workers with long duration of employment and high butadiene exposure (Delzell et al., 1996), as well as a positive association between cumulative exposure to butadiene and leukemia risk (Macaluso et al., 1996). More recently, University of Alabama investigators evaluated all-cause mortality for the same synthetic rubber industry workers from 1944 – 1998 (Sathiakumar et al., 2005). The subjects had an overall mortality rate 14% lower than expected, including lower rates of cardiovascular, digestive, and genitourinary deaths than the general population. However, the total group of 17,924 subjects had 16% more leukemia deaths than expected. While this increase was not limited to a single form of leukemia, it was concentrated in long-term hourly workers particularly those in polymerization, coagulation, and maintenance positions (Sathiakumar et al., 2005).
Results from studies of the genotoxic outcomes in workers exposed to butadiene have not been consistent. Begemann et al. (2001) analyzed blood samples from 17 workers in butadiene monomer production and 19 controls from a heat plant in the Czech Republic. Butadiene exposure was assessed by personal monitoring, with a median exposure concentration of 440 µg/m3 for exposed workers and < 6 µg/m3 for control subjects. The hemoglobin adduct HBVal, which is formed by a reaction of the N-terminal valine with the carbon-1 of epoxybutene, was measured with a limit of detection of 0.2 pmol/g globin. Results showed that the median butadiene-hemoglobin adduct level in monomer production workers was significantly higher than that of controls, with no consistent correlation with any other parameter except smoking (Begemann et al., 2001).
Hayes et al. (2000) also measured a spectrum of genotoxic outcomes, including aneuploidy and sister chromatid exchange, in 41 butadiene polymer production workers and 38 non-exposed controls in China. Full-shift personal exposure varied widely, and short-term breathing zone grab samples showed even greater extremes (median 6.5 ppm, range 0 – 1078 ppm). Hemoglobin adducts were significantly more common in butadiene exposed workers than
SRP DRAFT September 2012
Appendix D1 24 Butadiene
controls (p < 0.0001). In addition, butadiene exposed workers had greater lymphocyte and platelet counts than controls. However, the frequency of total aneuploidy (chromosomes 1, 7, 8, 12) did not differ significantly between exposed and non-exposed workers, nor did structural or numerical chromosomal abnormalities. The authors found no correlation between hemoglobin adducts and any genotoxic markers, nor did they find a positive correlation between butadiene concentrations in air and sister chromatid exchanges (Hayes et al., 2000).
Lovreglio and colleagues (2005) conducted personal monitoring throughout an 8 hr work shift at a petrochemical plant where butadiene was produced and polymerized. Personal monitoring was conducted 3 to 4 times over a 6-week period, with the last session followed by blood sampling of the subjects. Twenty-seven healthy petroleum plant workers were matched with 26 controls not occupationally exposed. Results indicated significantly higher airborne butadiene levels for exposed workers when compared with controls, ranging from 0.2 to 69 µg/m3. Blood samples were analyzed for sister chromatid exchange and percent chromosomal aberrations in peripheral blood lymphocytes. After correcting for cigarette smoking, the investigators found no genetic marker differences between butadiene exposed and control workers. In their conclusion, the authors stated that there was a lack of genotoxicity in workers exposed to very low concentrations of butadiene similar to ambient levels currently characterized in the general population (Lovreglio et al., 2005).
The Health Effects Institute recently reported on a genetic epidemiology study of Czech workers exposed to butadiene (Albertini et al., 2003). The study was designed to determine whether biomarkers of exposure could be correlated with in situ levels of butadiene and personal workplace exposure. Blood and urine samples were collected from males, working in either a butadiene monomer production plant or in a butadiene-styrene polymerization facility. Samples were also collected from male administrative workers who had very limited occupational exposure to butadiene, and served as controls. In addition, full-shift personal monitoring was conducted on each of 10 days over a 60-day period for both groups of workers, including the days on which biological samples were collected. The mean concentrations ranged from 0.026 mg/m3 for controls to 1.76 mg/m3 for polymer workers, with maximum concentrations of 0.125 mg/m3 and 39 mg/m3, respectively (Albertini et al., 2003). Cytogenetic assays included chromosomal aberrations, breaks, translocations, and sister chromatid exchanges. No significant relations could be identified between group mean chromosomal aberrations, determined by the conventional method or by fluorescent in situ hybridization, and butadiene exposure levels after adjusting for age and smoking. In addition, there was no relationship found between butadiene exposure and aberrations associated with glutathione-S-transferase genotypes. Regression analyses showed no significant effect of butadiene exposure on sister chromatid exchanges, although the effect of smoking on sister chromatid exchanges was significant after adjusting for age and occupational butadiene exposure. Hemoglobin adducts of butadiene (to the valine residue) were analyzed as biomarkers for butadiene exposure. There was a significant correlation between the individual subject’s exposure levels and two types of hemoglobin adducts. However, the authors cautioned that one adduct, trihydroxybutyl valine (THBVal), also appeared to be formed by an endogenous material other than butadiene and its metabolites, indicating relatively high natural background levels. Overall conclusions from the authors indicate that the cytogenetic endpoints did not prove to be sensitive indicators of butadiene exposure at the levels encountered in these facilities (Albertini et al., 2003).
SRP DRAFT September 2012
Appendix D1 25 Butadiene
7.2 Chronic Toxicity to Infants and Children
Infants and children are rarely exposed to butadiene alone but rather experience long-term exposure to butadiene as one of the combustion products in vehicle exhaust, environmental tobacco smoke (ETS), and other combustion processes. As can be expected with many toxic air contaminants, it is difficult to elucidate the effects of one particular pollutant when it exists in the presence of multiple co-pollutants. Studies of the chronic effects of butadiene in children primarily focus on carcinogenesis as the endpoint. Butadiene has been associated with asthma exacerbation and increased respiratory tract infections, but only in the presence of other pollutants. While some recent studies have aimed to quantify children’s exposure to butadiene, ascribing chronic respiratory effects to butadiene alone remains problematic (see discussion of TEACH study in section 3 above).
7.3 Chronic Toxicity to Experimental Animals
Butadiene is considered a multi-site carcinogen in all identified long-term studies in mice and rats, although there appear to be strain and species differences in sensitivity and severity of effect (NTP 1984; Owen et al., 1987; Melnick et al., 1990; NTP 1993). Instances of tumors include malignant lymphomas, histiocytic sarcomas, cardiac hemangiosarcomas, as well as neoplasms of the liver, lung, mammary gland, ovary, and forestomach (NTP, 1993).
Far fewer data are available for the non-cancerous effects of long-term exposure to butadiene. However, based on these limited data, sensitivity to non-neoplastic events appears to be consistent with species variations in metabolism of butadiene and quantitative differences in the formation of butadiene metabolites (Hughes et al., 2001). For mice, National Toxicology Program (NTP) investigators exposed B6C3F1 males and females to 0, 625, or 1250 ppm butadiene for 6 hrs/day, 5 days/week, for up to 61 weeks (NTP 1984). Liver necrosis was observed in male mice at both doses and in female mice at 1250 ppm. At the highest dose, adverse changes were observed in the nasal cavity, including non-neoplastic lesions, chronic inflammation, fibrosis, cartilaginous metaplasia, osseous metaplasia, and atrophy of the sensory epithelium. In a later study, investigators studied the effects of lower concentrations of butadiene in mice exposed for 6 hrs/day, 5 days/week, for up to 2 years (Melnick et al., 1990; NTP 1993). Two-year survival was significantly decreased in mice exposed to ≥ 20 ppm, which the investigators attributed to butadiene-induced malignant neoplasms. Beyond the neoplastic changes, there were increased incidences of angiectasis, alveolar epithelial hyperplasia, forestomach epithelial hyperplasia, and cardiac endothelial hyperplasia.
Chronic effects in rats were studied by Hazelton Laboratories and reported later by Owen and colleagues (1987; 1990). Groups of 110 male and female Sprague Dawley rats were exposed to 0, 1000, or 8000 ppm butadiene for 6 hrs/day, 5 days/week, for up to 2 years. After the first 52 weeks, investigators euthanized multiple female rats in both dose groups because of the high incidence of large subcutaneous masses. Increased mortality in males was observed in the highest dose group and associated with increased nephropathy. Body weight decreases were observed in the first twelve weeks in the high dose males and females, along with liver and kidney organ weight changes. Although there were minor clinical effects, including slight ataxia, no major changes in neuromuscular function could be definitively associated with
SRP DRAFT September 2012
Appendix D1 26 Butadiene
butadiene exposure (Owen et al., 1987). Further reporting on this 2-year chronic investigation indicated that there were decreased survival rates at 105 weeks for females and 111 weeks for males (Owen and Glaister 1990). There were no effects on hematology, blood chemistry, and urinalysis, although changes in body and organs weights continued until study termination. Although somewhat equivocal, the rats displayed both common and uncommon tumor types, leading the investigators to suggest that butadiene might be a rat oncogen (Owen and Glaister 1990).
Other studies have identified hematological effects following chronic exposure to butadiene at concentrations at or below those that were associated with systemic toxicity (Irons et al., 1986a; Irons et al., 1986b; NTP 1993). Such hematotoxicity may be associated with the observed changes in organ weights (NTP, 1993). Butadiene exposure has also been associated with bone marrow changes, including bone marrow atrophy, bone marrow toxicity (regenerative anemia), and decreased cellularity as observed in mice exposed to ≥ 62.5 ppm (Melnick et al., 1990; NTP, 1993). Owen and colleagues (1987), however, found no hematological effects in rats exposed to as much as 8000 ppm butadiene in a 2-yr bioassay.
SRP DRAFT September 2012
Appendix D1 27 Butadiene
8 Derivation of Reference Exposure Levels
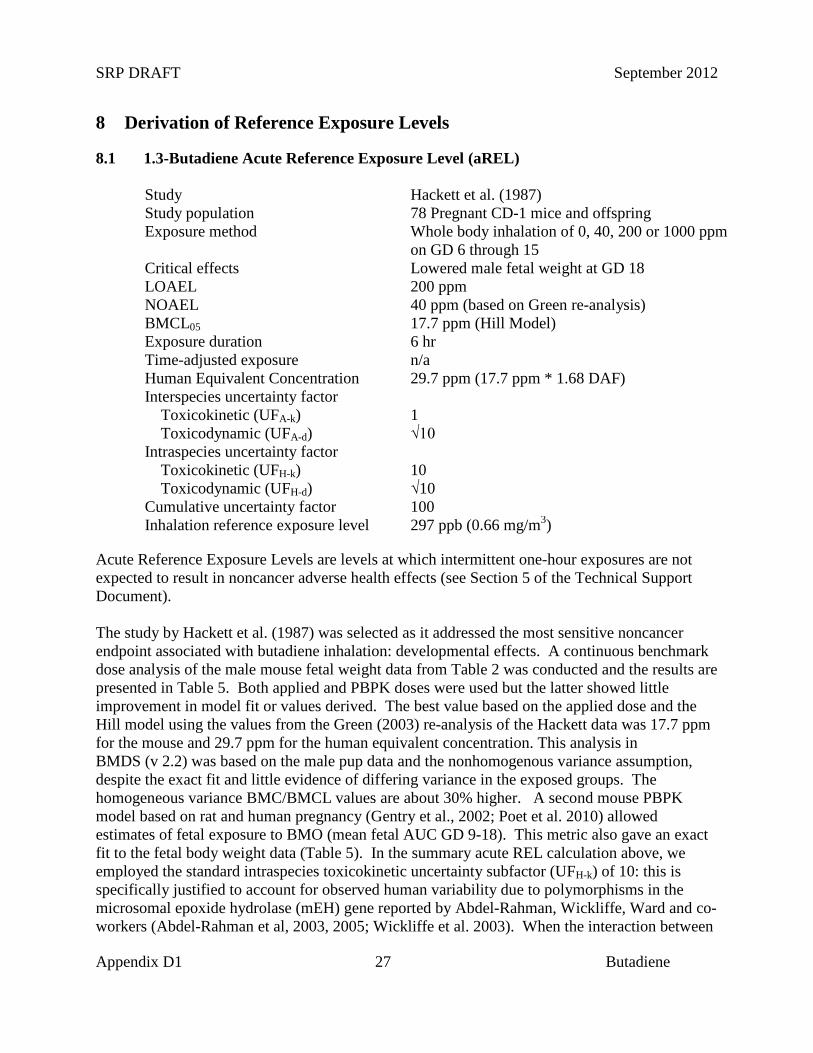
8.1 1.3-Butadiene Acute Reference Exposure Level (aREL)
Study Hackett et al. (1987) Study population 78 Pregnant CD-1 mice and offspring Exposure method Whole body inhalation of 0, 40, 200 or 1000 ppm
on GD 6 through 15 Critical effects Lowered male fetal weight at GD 18 LOAEL 200 ppm NOAEL 40 ppm (based on Green re-analysis) BMCL05 17.7 ppm (Hill Model) Exposure duration 6 hr Time-adjusted exposure n/a Human Equivalent Concentration 29.7 ppm (17.7 ppm * 1.68 DAF) Interspecies uncertainty factor Toxicokinetic (UFA-k) 1 Toxicodynamic (UFA-d) √10 Intraspecies uncertainty factor Toxicokinetic (UFH-k) 10 Toxicodynamic (UFH-d) √10 Cumulative uncertainty factor 100 Inhalation reference exposure level 297 ppb (0.66 mg/m3)
Acute Reference Exposure Levels are levels at which intermittent one-hour exposures are not expected to result in noncancer adverse health effects (see Section 5 of the Technical Support Document).
The study by Hackett et al. (1987) was selected as it addressed the most sensitive noncancer endpoint associated with butadiene inhalation: developmental effects. A continuous benchmark dose analysis of the male mouse fetal weight data from Table 2 was conducted and the results are presented in Table 5. Both applied and PBPK doses were used but the latter showed little improvement in model fit or values derived. The best value based on the applied dose and the Hill model using the values from the Green (2003) re-analysis of the Hackett data was 17.7 ppm for the mouse and 29.7 ppm for the human equivalent concentration. This analysis in BMDS (v 2.2) was based on the male pup data and the nonhomogenous variance assumption, despite the exact fit and little evidence of differing variance in the exposed groups. The homogeneous variance BMC/BMCL values are about 30% higher. A second mouse PBPK model based on rat and human pregnancy (Gentry et al., 2002; Poet et al. 2010) allowed estimates of fetal exposure to BMO (mean fetal AUC GD 9-18). This metric also gave an exact fit to the fetal body weight data (Table 5). In the summary acute REL calculation above, we employed the standard intraspecies toxicokinetic uncertainty subfactor (UFH-k) of 10: this is specifically justified to account for observed human variability due to polymorphisms in the microsomal epoxide hydrolase (mEH) gene reported by Abdel-Rahman, Wickliffe, Ward and co-workers (Abdel-Rahman et al, 2003, 2005; Wickliffe et al. 2003). When the interaction between
SRP DRAFT September 2012
Appendix D1 28 Butadiene
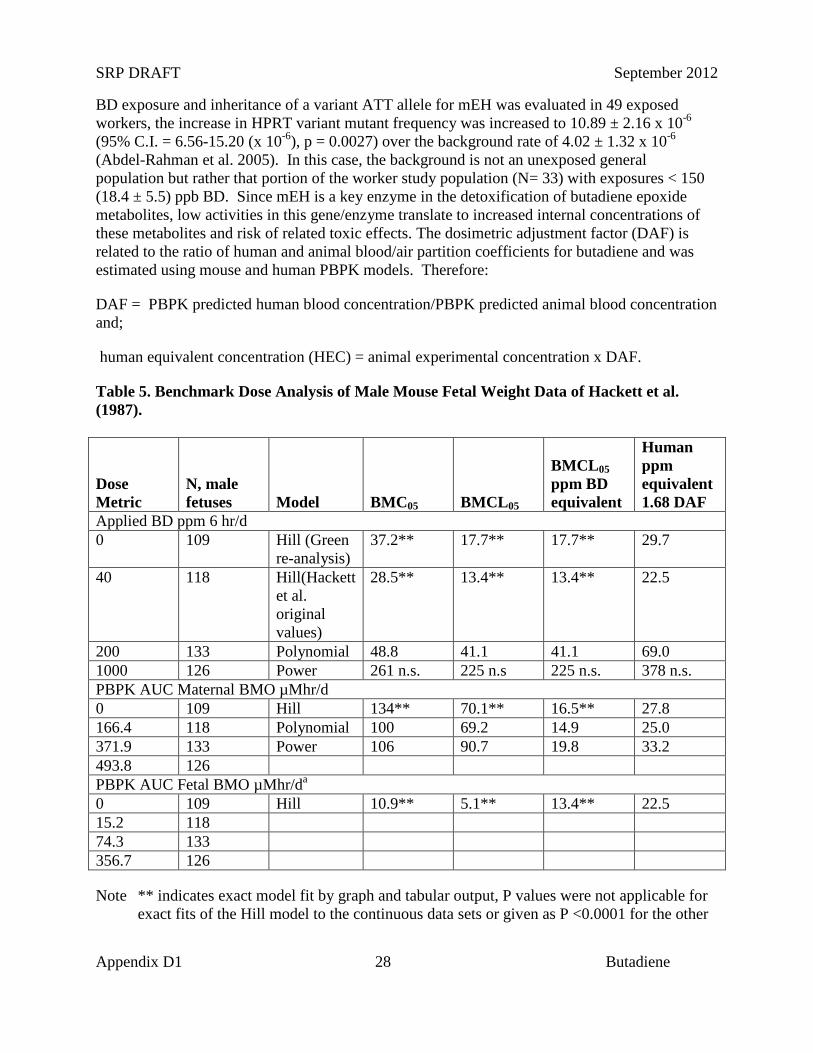
BD exposure and inheritance of a variant ATT allele for mEH was evaluated in 49 exposed workers, the increase in HPRT variant mutant frequency was increased to 10.89 ± 2.16 x 10⁻⁶ (95% C.I. = 6.56-15.20 (x 10-6), p = 0.0027) over the background rate of 4.02 ± 1.32 x 10⁻⁶ (Abdel-Rahman et al. 2005). In this case, the background is not an unexposed general population but rather that portion of the worker study population (N= 33) with exposures < 150 (18.4 ± 5.5) ppb BD. Since mEH is a key enzyme in the detoxification of butadiene epoxide metabolites, low activities in this gene/enzyme translate to increased internal concentrations of these metabolites and risk of related toxic effects. The dosimetric adjustment factor (DAF) is related to the ratio of human and animal blood/air partition coefficients for butadiene and was estimated using mouse and human PBPK models. Therefore:
DAF = PBPK predicted human blood concentration/PBPK predicted animal blood concentration and;
human equivalent concentration (HEC) = animal experimental concentration x DAF.
Table 5. Benchmark Dose Analysis of Male Mouse Fetal Weight Data of Hackett et al. (1987).
Dose Metric
N, male fetuses Model BMC05 BMCL05
BMCL05 ppm BD equivalent
Human ppm equivalent 1.68 DAF
Applied BD ppm 6 hr/d 0 109 Hill (Green
re-analysis) 37.2** 17.7** 17.7** 29.7
40 118 Hill(Hackett et al. original values)
28.5** 13.4** 13.4** 22.5
200 133 Polynomial 48.8 41.1 41.1 69.0 1000 126 Power 261 n.s. 225 n.s 225 n.s. 378 n.s. PBPK AUC Maternal BMO µMhr/d 0 109 Hill 134** 70.1** 16.5** 27.8 166.4 118 Polynomial 100 69.2 14.9 25.0 371.9 133 Power 106 90.7 19.8 33.2 493.8 126 PBPK AUC Fetal BMO µMhr/da 0 109 Hill 10.9** 5.1** 13.4** 22.5 15.2 118 74.3 133 356.7 126
Note ** indicates exact model fit by graph and tabular output, P values were not applicable for exact fits of the Hill model to the continuous data sets or given as P <0.0001 for the other
SRP DRAFT September 2012
Appendix D1 29 Butadiene
models despite obvious high degrees of fit visually and by tabular output of observed and predicted values; n.s. indicates insignificant model fit (P < 0.1) a based on average fetal BMO AUC during gestation days 9-18.
8.2 1,3-Butadiene 8-Hour Reference Exposure Level
Study NTP (1993) supported by Doerr et al. (1996) Study population B6C3F1 mice Exposure method Daily inhalation Exposure continuity 6 hr/d, 5d/wk Exposure duration 9-24 months Critical effects Increased incidence of ovarian atrophy BMCL05 1.01 ppm Time-adjusted exposure 758 ppb (1.01 ppm x 6/8 hr/d) Human Equivalent Concentration 1.27 ppm (0.758 ppm x1.68 DAF) Subchronic uncertainty factor (UFs) 1 Interspecies uncertainty factor Toxicokinetic (UFA-k) 1 Toxicodynamic (UFA-d) √10 Intraspecies uncertainty factor Toxicokinetic (UFH-k) 10 Toxicodynamic (UFH-d) √10 Cumulative uncertainty factor 100 Reference Exposure Level 12.7 ppb (28 µg/m3)
The 8-hour Reference Exposure Level is a concentration at or below which adverse non-cancer health effects would not be anticipated for repeated 8-hour exposures (see Section 6 in the TSD). The study of NTP (1993) and the endpoint of ovarian atrophy was selected as the basis of both the 8 hr and chronic RELs. The benchmark concentration analysis of this study is summarized in Table 3 above. We selected the value of 1.01 ppm for the BMCL05 based on the full data sets of 9, 15 and 24 months exposures as the best basis for the derivations. This study is supported by that of Doerr et al. (1996). The Doerr study involves PBPK modeling (Table 6) to estimate internal dose metrics for ovarian effects resulting from i.p. doses of mono- or diepoxide metabolites of BD. Dose-response modeling (BMDS v.2.1.2) was used to estimate BMDL05’s for the various dose metrics evaluated.
The selected best point of departure, 1.27 ppm, is the BMCL05 adjusted for time and human equivalent exposure. The interspecies uncertainty subfactor for toxicokinetics (UFA-K) was reduced from √10 to 1 because we think that the mouse is more active in metabolizing butadiene to reactive epoxide metabolites than either the rat or human, thus reducing the uncertainty in the interspecies toxicokinetic extrapolation.
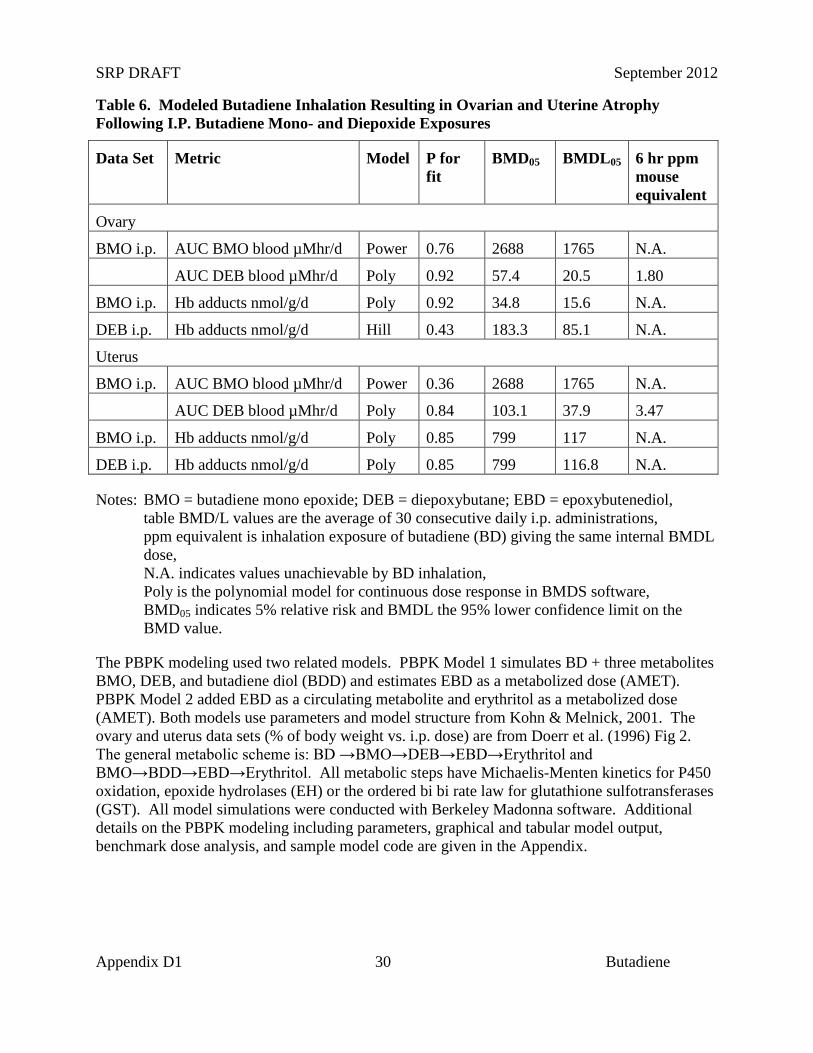
SRP DRAFT September 2012
Appendix D1 30 Butadiene
Table 6. Modeled Butadiene Inhalation Resulting in Ovarian and Uterine Atrophy Following I.P. Butadiene Mono- and Diepoxide Exposures
Data Set Metric Model P for fit
BMD05 BMDL05 6 hr ppm mouse equivalent
Ovary
BMO i.p. AUC BMO blood µMhr/d Power 0.76 2688 1765 N.A.
AUC DEB blood µMhr/d Poly 0.92 57.4 20.5 1.80
BMO i.p. Hb adducts nmol/g/d Poly 0.92 34.8 15.6 N.A.
DEB i.p. Hb adducts nmol/g/d Hill 0.43 183.3 85.1 N.A.
Uterus
BMO i.p. AUC BMO blood µMhr/d Power 0.36 2688 1765 N.A.
AUC DEB blood µMhr/d Poly 0.84 103.1 37.9 3.47
BMO i.p. Hb adducts nmol/g/d Poly 0.85 799 117 N.A.
DEB i.p. Hb adducts nmol/g/d Poly 0.85 799 116.8 N.A.
Notes: BMO = butadiene mono epoxide; DEB = diepoxybutane; EBD = epoxybutenediol, table BMD/L values are the average of 30 consecutive daily i.p. administrations, ppm equivalent is inhalation exposure of butadiene (BD) giving the same internal BMDL dose, N.A. indicates values unachievable by BD inhalation, Poly is the polynomial model for continuous dose response in BMDS software, BMD05 indicates 5% relative risk and BMDL the 95% lower confidence limit on the BMD value.
The PBPK modeling used two related models. PBPK Model 1 simulates BD + three metabolites BMO, DEB, and butadiene diol (BDD) and estimates EBD as a metabolized dose (AMET). PBPK Model 2 added EBD as a circulating metabolite and erythritol as a metabolized dose (AMET). Both models use parameters and model structure from Kohn & Melnick, 2001. The ovary and uterus data sets (% of body weight vs. i.p. dose) are from Doerr et al. (1996) Fig 2. The general metabolic scheme is: BD →BMO→DEB→EBD→Erythritol and BMO→BDD→EBD→Erythritol. All metabolic steps have Michaelis-Menten kinetics for P450 oxidation, epoxide hydrolases (EH) or the ordered bi bi rate law for glutathione sulfotransferases (GST). All model simulations were conducted with Berkeley Madonna software. Additional details on the PBPK modeling including parameters, graphical and tabular model output, benchmark dose analysis, and sample model code are given in the Appendix.
SRP DRAFT September 2012
Appendix D1 31 Butadiene
8.3 1,3-Butadiene Chronic Reference Exposure Level (cREL)
Study NTP (1993) supported by Doerr et al. (1996), Study population B6C3F1 mice Exposure method Daily inhalation Exposure continuity 6 hr/d, 5d/wk Exposure duration 9-24 months Critical effects Increased incidence of ovarian atrophy BMCL05 1.01 ppm Time-adjusted exposure 180 ppb (1.01 ppm x 6/24h x 5/7d) Human Equivalent Concentration 302 ppb (180 ppb x 1.68 DAF) Subchronic uncertainty factor (UFs) 1 Interspecies uncertainty factor Toxicokinetic (UFA-k) 1 Toxicodynamic (UFA-d) √10 Intraspecies uncertainty factor Toxicokinetic (UFH-k) 10 Toxicodynamic (UFH-d) √10 Cumulative uncertainty factor 100 Reference Exposure Level 3.0 ppb (6.7 µg/m3)
The chronic Reference Exposure Level is a concentration at which adverse noncancer health effects would not be expected from continuous chronic exposures (see Section 8 in the Technical Support Document). In the derivation of the chronic REL above, the BMCL05 is the same as the 8-hour REL but the time adjustment is for potentially continuous exposure rather than 8 hours/day. The uncertainty factors applied are the same in both cases and the proposed RELs are similar to those derived from the supporting study of Doerr et al. (1996), namely 23 ppb and 8 ppb for 8-hour and chronic RELs , respectively. This latter study uses the same toxicity endpoint but with parenteral administration of the butadiene epoxide metabolites BMO and DEB.
Butadiene causes non-cancer effects following chronic exposure, the most important of which appears to be reproductive toxicity. Inhalation exposure to relatively low concentrations of butadiene over a lifetime is associated with adverse effects in the reproductive organs of female and male mice (NTP, 1984; Melnick et al., 1990; NTP, 1993; Doerr et al., 1996). A PBPK model was developed to model the disposition of butadiene and its metabolites based on a rodent model described by Kohn and Melnick (2001), and data on the ovarian toxicity of 1,3-butadiene epoxide in rats and mice (Doerr et al.,1996).
As reported earlier, ovarian atrophy was observed at all concentrations in the NTP chronic bioassays (NTP, 1984; Melnick et al., 1990; NTP, 1993), and showed a dose-dependent effect associated with increased inhalation exposure. In all exposure groups, ovarian atrophy was associated with what might be considered premature reproductive senescence. It is noteworthy that such senescence was observed as early as nine months in female mice exposed to 200 or 625 ppm, and after 15 months in female mice exposed to ≥20 ppm butadiene(NTP, 1984; NTP, 1993). It is currently unknown how ovarian atrophy in rodents relates to human reproductive senescence. Reproductive senescence is a general term referring to the loss of reproductive
SRP DRAFT September 2012
Appendix D1 32 Butadiene
function with age. In the female, this involves a loss of normal ovarian, and hypothalamic or pituitary function (Valdez and Petroff, 2004). The correlation between the loss of oocytes and declining fertility with age is well characterized, and it is generally accepted that depletion of follicles results in the final loss of fertility. The actual end of ovarian activity is preceded by a period of irregular reproductive cycles and subfertility in both women and rodents (Valdez and Petroff, 2004). Age-related changes in the rodent hypothalamus and pituitary appear to bring about the final cessation of ovarian cyclicity before follicular depletion occurs (Wise et al., 2002). However, exhaustion of ovarian follicular reserves appears to drive menopause in women (vom Saal et al., 1994). Despite these apparent differences in final reproductive senescence, the biological mechanisms leading to prolonged cycles and aberrant endocrinology appear similar in primates and rodents (Wise et al., 2002; Bellino and Wise 2003).
Currently, there are few data detailing the potential role of butadiene on the etiology of ovotoxicity and late-stage infertility (Hughes et al., 2001). Potential mechanisms might involve the in situ formation of butadiene reactive intermediates, which may have a direct effect on ovarian function (Doerr et al., 1995; Hughes et al., 2001), or a more general role on the hypothalamic-pituitary-gonadal axis. Available data seem to suggest that humans potentially form qualitatively similar metabolites to experimental rodent species, although the rates of formation and the quantities of specific metabolites differ (Bond et al., 1986;Csanady, 1992 ). Mice appear to produce a greater proportion of active epoxide metabolites than rats (Bond et al., 1986; Himmelstein et al., 1994; Thornton-Manning et al., 1995). However there are conflicting in vitro data that suggest humans may form epoxides of butadiene at comparable rates to mice or at rates several fold less than mice (Csanady et al., 1992; Duescher and Elfarra 1994; Krause and Elfarra 1997). Dahl et al. (1991) reported that following equivalent inhalation exposures, the concentrations of total butadiene metabolites in blood were 5-50 times lower in monkeys than in mice, and 4-14 times lower than in rats. Humans may more closely resemble the monkey than the mouse or the rat in their formation of epoxides from butadiene, and several models adjust for species differences in butadiene pharmacokinetics (Sweeney et al., 1997). In view of the fact that we have used a pharmacokinetic model to assess relevant dosimetry and the weight of published evidence that mice are more active butadiene metabolizers than other species studied, we used a UF of 1 to account for interspecies kinetic differences. However, an interspecies pharmacodynamic adjustment for ovarian atrophy endpoint with butadiene is still needed. Therefore OEHHA used an interspecies uncertainty factor of √10 to account for pharmacodynamic differences between mice and women. We applied an intraspecies uncertainty factor of 30, 10 for toxicokinetics and √10 for toxicodynamics. The overall uncertainty factor was 100, and the cREL is 3.0 ppb.
For comparison, the US EPA’s RfC is 0.9 ppb. This value is based on a benchmark concentration (BMC) and a Weibull time-to response model for the ovarian atrophy endpoint in mice in the NTP 2-year inhalation study (NTP, 1993; U.S.EPA, 2002). U.S.EPA (2002) calculated a BMC10 of 1.05 ppm and a BMCL10 of 0.88 ppm (continuous) without the top dose. They applied an overall uncertainty factor (UF) of 1000 to derive a final value of 0.88 ppb or 0.9 ppb rounded. The composite UFs included √10 for interspecies, 10 for effect level, 10 for intraspecies, and √10 for data deficiencies.

SRP DRAFT September 2012
Appendix D1 33 Butadiene
The Texas Commission on Environmental Quality (TCEQ) used a similar analysis employing the top dose in the same data set to calculate a BMCL05 of 462 ppb. Their chronic reference value of 15 ppb employs an overall UF of 30, which includes 10 for intraspecies differences and √10 for data deficiencies (Grant et al., 2010).
SRP DRAFT September 2012
Appendix D1 34 Butadiene
9 References
Abdel-Rahman, S.Z., R.A. El-Zein, M.M. Ammenheuser, Z. Yang., T.H. Stock, M. Morandi and J.B.Ward Jr. (2003). Variability in human sensitivity to1,3-butadiene:Influence of the allelic variants of the microsomal epoxide hydrolase gene. Environ Mol Mutagen 41(2): 140-6.
Abdel-Rahman, S.Z., M.M. Ammerheuser, C.J. Omiecinski, J.K. Wickliffe J.L. Rosenblatt and J.B.Ward Jr. (2005). Variability in human sensitivity to 1,3-butadiene:influence of polymorphisms in the 5’-flanking region of the microsomal epoxide hydrolase gene (EPHX1). Toxicol Sci 85(1): 624-31.
Adler, I. D. and D. Anderson (1994). Dominant lethal effects after inhalation exposure to 1,3-butadiene. Mutat Res 309(2): 295-7.
Adler, I. D., J. Cao, J. G. Filser, P. Gassner, W. Kessler, U. Kliesch, A. Neuhauser-Klaus and M. Nusse (1994). Mutagenicity of 1,3-butadiene inhalation in somatic and germinal cells of mice. Mutat Res 309(2): 307-14.
Adler, I. D., J. Filser, H. Gonda and G. Schriever-Schwemmer (1998). Dose response study for 1,3-butadiene-induced dominant lethal mutations and heritable translocations in germs cells of male mice. Mutat Res 397(1): 85-92.
Adler, I. D., J. G. Filser, P. Gassner, W. Kessler, J. Schoeneich and G. Schriever-Schwemmer (1995). Heritable translocations induced by inhalation exposure of male mice to 1,3-butadiene. Mutation Research 347(3,4): 121-7.
Adler, I. D., U. Kliesch, C. Tiveron and F. Pacchierotti (1995). Clastogenicity of diepoxybutane in bone marrow cells and male germ cells of mice. Mutagenesis. Vol. 10(6): 535-541.
Albertini, R.J. (1999). 1,3-Butadiene: Evidence for Genotoxicity. In. A Partnership to Examine Emerging Health Effects:EC/HEI Workshop on 1,3-Butadiene. Brussels 29-30 June, 1998. HEI Communications Number 6, pp 53-84. Health Effects Institute, Cambridge, MA.
Albertini, R. J., R. J. Sram, P. M. Vacek, J. Lynch, J. A. Nicklas, N. J. van Sittert, P. J. Boogaard, R. F. Henderson, J. A. Swenberg, A. Tates, J. B. J. Ward. and M. Wright (2003). Biomarkers in Czech Workers Exposed to 1,3-Butadiene: A Transitional Epidemiologic Study. H. E. Institute.
Anderson, D., A. J. Edwards and M. H. Brinkworth (1993). Male-mediated F1 effects in mice exposed to 1,3-butadiene. IARC Sci Publ(127): 171-81.
Anderson, D., A. J. Edwards, M. H. Brinkworth and J. A. Hughes (1996). Male-mediated F1 effects in mice exposed to 1,3-butadiene. Toxicology 113(1-3): 120-7.
Anderson, D., M.M. Dobrzynska, T.W. Yu, L. Gandini, E. Cordelli and M. Spano (1997). DNA integrity in human sperm. Teratog Carcinog Mutagen 17: 97-102.
SRP DRAFT September 2012
Appendix D1 35 Butadiene
Anderson, D., J. A. Hughes, A. J. Edwards and M. H. Brinkworth (1998). A comparison of male-mediated effects in rats and mice exposed to 1,3-butadiene. Mutat Res 397(1): 77-84.
ATSDR (1992). Toxicological Profile for 1,3-butadiene, Clement International Corp.,Ruston,LA,USA.: 136 pp.
BAAQMD (2008). Toxic Air Contaminant Air Monitoring Data for 2008. Bay Area Air Quality Management District.
Baker, J., J. Arey and R. Atkinson (2005). Formation and reaction of hydroxycarbonyls from the reaction of OH radicals with 1,3-butadiene and isoprene. Environ Sci Technol 39(11): 4091-9.
Begemann, P., R. J. Sram and H. G. Neumann (2001). Hemoglobin adducts of epoxybutene in workers occupationally exposed to 1,3-butadiene. Arch Toxicol 74(11): 680-7.
Bellino, F. L. and P. M. Wise (2003). Nonhuman primate models of menopause workshop. Biol Reprod 68(1): 10-8.
Bond, J. A., A. R. Dahl, R. F. Henderson, J. S. Dutcher, J. L. Mauderly and L. S. Birnbaum (1986). Species differences in the disposition of inhaled butadiene. Toxicology and Applied Pharmacology 84(3): 617-27.
Bond, J. A. and M. A. Medinsky (2001). Insights into the toxicokinetics and toxicodynamics of 1,3-butadiene. Chem Biol Interact 135-136: 599-614.
Boogaard, P. J. and J. A. Bond (1996). The role of hydrolysis in the detoxification of 1,2:3,4-diepoxybutane by human, rat, and mouse liver and lung in vitro. Toxicol Appl Pharmacol 141(2): 617-27.
Boogaard, P. J., K. P. de Kloe, E. D. Booth and W. P. Watson (2004). DNA adducts in rats and mice following exposure to [4-14C]-1,2-epoxy-3-butene and to [2,3-14C]-1,3-butadiene. Chem Biol Interact 148(1-2): 69-92.
Booth, E. D., J. D. Kilgour, S. A. Robinson and W. P. Watson (2004). Dose responses for DNA adduct formation in tissues of rats and mice exposed by inhalation to low concentrations of 1,3-[2,3-[(14)C]-butadiene. Chem Biol Interact 147(2): 195-211.
Brinkworth, M. H., D. Anderson, J. A. Hughes, L. I. Jackson, T. W. Yu and E. Nieschlag (1998). Genetic effects of 1,3-butadiene on the mouse testis. Mutat Res 397(1): 67-75.
Brochot, C., T.J.Smith and F.Y. Bois (2007). Development of a physiologically based toxicokinetic model for butadiene and four major metabolites in humans: Global sensitivity analysis for experimental design issues. Chem-Biol Interact 167:168-183.
CARB (2009). The California Almanac of Emissions and Air Quality - 2009 Edition, California Air Resources Board.
SRP DRAFT September 2012
Appendix D1 36 Butadiene
Carmical, J.R,, L.V. Nechev, C.M. Harris, T.M. Harris and R.S. Lloyd (2000). Mutagenic potential of adenine N6 adducts of monoepoxide and diolepoxide derivatives of butadiene. Environ Mol Mutagen 35: 48-56.
Chan, C. C., R. H. Shie, T. Y. Chang and D. H. Tsai (2006). Workers' exposures and potential health risks to air toxics in a petrochemical complex assessed by improved methodology. Int Arch Occup Environ Health 79(2): 135-42.
Cooke, M.S., R. Olinski and M.D. Evans (2006). Does measurement of oxidative damage to DNA have clinical significance? Clin Chim Acta 365(1-2): 30-49.
Csanady, G. A., F. P. Guengerich and J. A. Bond (1992). Comparison of the biotransformation of 1,3-butadiene and its metabolite, butadiene monoepoxide, by hepatic and pulmonary tissues from humans, rats and mice. Carcinogenesis 13(7): 1143-53.
Csanady, G.A., W. Kessler, H.D.Hoffmann and J.G.Filser (2003). A toxicokinetic model for styrene and its metabolite styrene 7,8-oxide in mouse, rat and human with special emphaisis on the lung. Toxicol Lett 138:75-102.
Csanady, G.A, R. Steinhoff, M.B.Riester, B.Semder,C.Putz,Q.Li, N.Richter,W.Kessler,D.Klein,and J.G.Filser. (2011). 1,2:3,4-Diepoxybutane in blood of male B6C3F1 mice and male Sprague-Dawley rats exposed to butadiene. Toxicol Lett 207:286-290.
Dahl, A. R., J. D. Sun, L. S. Birnbaum, J. A. Bond, W. C. Griffith, Jr., J. L. Mauderly, B. A. Muggenburg, P. J. Sabourin and R. F. Henderson (1991). Toxicokinetics of inhaled 1,3-butadiene in monkeys: comparison to toxicokinetics in rats and mice. Toxicol Appl Pharmacol 110(1): 9-19.
Delfino, R. J., H. Gong, Jr., W. S. Linn, E. D. Pellizzari and Y. Hu (2003). Asthma symptoms in Hispanic children and daily ambient exposures to toxic and criteria air pollutants. Environ Health Perspect 111(4): 647-56.
Delzell, E., N. Sathiakumar, M. Hovinga, M. Macaluso, J. Julian, R. Larson, P. Cole and D. C. Muir (1996). A follow-up study of synthetic rubber workers. Toxicology 113(1-3): 182-9.
Doerr, J. K., E. A. Hollis and I. G. Sipes (1996). Species difference in the ovarian toxicity of 1,3-butadiene epoxides in B5C3F1 mice and Sprague-Dawley rats. Toxicology 113(1-3): 128-136.
Doerr, J. K., S. B. Hooser, B. J. Smith and I. G. Sipes (1995). Ovarian toxicity of 4-vinylcyclohexene and related olefins in B6C3F1 mice: role of diepoxides. Chem Res Toxicol 8(7): 963-9.
Doyle, M., K. G. Sexton, H. Jeffries and I. Jaspers (2007). Atmospheric photochemical transformations enhance 1,3-butadiene-induced inflammatory responses in human epithelial cells: The role of ozone and other photochemical degradation products. Chem Biol Interact 166(1-3): 163-9.
SRP DRAFT September 2012
Appendix D1 37 Butadiene
Duescher, R. J. and A. A. Elfarra (1994). Human liver microsomes are efficient catalysts of 1,3-butadiene oxidation: evidence for major roles by cytochromes P450 2A6 and 2E1. Arch Biochem Biophys 311(2): 342-9.
Elfarra, A. A., T. S. Moll, R. J. Krause, R. A. Kemper and R. R. Selzer (2001). Reactive metabolites of 1,3-butadiene: DNA and hemoglobin adduct formation and potential roles in carcinogenicity. Biological Reactive Intermediates Vi 500: 93-103.
Evans, M.D. and M.S. Cooke (2006). Oxidative damage to DNA in non-malignant disease: biomarker or biohazard? Genome Dyn 1: 53-66.
Fajen, J. M., D. R. Roberts, L. J. Ungers and E. R. Krishnan (1990). Occupational exposure of workers to 1,3-butadiene. Environ Health Perspect 86: 11-8.
Gentry,P.R.,T.R. Covington, M.E.Andersen and H.J.Clewell III (2002).Application of a physiologically based pharmacokinetic model for isopropanol in the derivation of a reference dose and reference concentration. Regul Toxicol Pharmacol 36: 51-68.
Grant R. L. , J. Hanley, A. L. Curry and M. Honeycutt. (2010). A chronic reference value for 1,3-butadiene based on an updated noncencer toxicity assessment. J Toxicol Environ Health B 13:460-475.
Green, J.W. (2003). Statistical Analysis of Butadiene Mouse Data from Hackett et al. (1987). Haskell Laboratory for Health and Environmental Sciences, E.I. Dupont de Nemours & Co., Newark, DE, USA: 151 pp.
Hackett, P. L., M. R. Sikov, T. J. Mast, M. G. Brown, R. L. Buschbom, M. L. Clark, J. R. Decker, J. J. Evanoff, R. L. Rommereim and S. E. Rowe (1987a). Inhalation developmental toxicology studies: teratology study of 1,3-butadiene in mice: final report, Pac. Northwest Lab.,Richland,WA,USA.: 92 pp.
Hackett, P. L., M. R. Sikov, T. J. Mast, M. G. Brown, R. L. Buschbom, M. L. Clark, J. R. Decker, J. J. Evanoff, R. L. Rommereim, S. E. Rowe and R.B. Westerberg (1987b). Inhalation developmental toxicology studies of 1,3-butadiene in the rat: final report, Pac. Northwest Lab.,Richland,WA,USA.: 22 pp.Hayes, R. B., L. Zhang, S. Yin, J. A. Swenberg, L. Xi, J. Wiencke, W. E. Bechtold, M. Yao, N. Rothman, R. Haas, J. P. O'Neill, D. Zhang, J. Wiemels, M. Dosemeci, G. Li and M. T. Smith (2000). Genotoxic markers among butadiene polymer workers in China. Carcinogenesis 21(1): 55-62.
Henderson, R. F., F. F. Hahn, J. M. Benson, E. B. Barr, W. E. Bechtold, D. G. Burt and A. R. Dahl (1999). Dosimetry and acute toxicity of inhaled butadiene diepoxide in rats and mice. Toxicol Sci 51(1): 146-52.
Himmelstein, M. W., M. J. Turner, B. Asgharian and J. A. Bond (1994). Comparison of blood concentrations of 1,3-butadiene and butadiene epoxides in mice and rats exposed to 1,3-butadiene by inhalation. Carcinogenesis 15(8): 1479-86.
SRP DRAFT September 2012
Appendix D1 38 Butadiene
HSDB. (2004). "Hazardous Substances Data Bank." 2009, from http://toxnet.nlm.nih.gov.
HSDB. (2011). "Hazardous Substances Data Bank." 2011, from http://toxnet.nlm.nih.gov.
Hughes, K., M. E. Meek and M. Walker (2001). Health risk assessment of 1,3-butadiene as a Priority Substance in Canada. Chem Biol Interact 135-136: 109-35.
Irons, R. D., C. N. Smith, W. S. Stillman, R. S. Shah, W. H. Steinhagen and L. J. Leiderman (1986a). Macrocytic-megaloblastic anemia in male B6C3F1 mice following chronic exposure to 1,3-butadiene. Toxicol Appl Pharmacol 83(1): 95-100.
Irons, R. D., C. N. Smith, W. S. Stillman, R. S. Shah, W. H. Steinhagen and L. J. Leiderman (1986b). Macrocytic-megaloblastic anemia in male NIH Swiss mice following repeated exposure to 1,3-butadiene. Toxicol Appl Pharmacol 85(3): 450-5.
Kemper, R. A., R. J. Krause and A. A. Elfarra (2001). Metabolism of butadiene monoxide by freshly isolated hepatocytes from mice and rats: different partitioning between oxidative, hydrolytic, and conjugation pathways. Drug Metab Dispos 29(6): 830-6.
Kinney, P. L., S. N. Chillrud, S. Ramstrom, J. Ross and J. D. Spengler (2002). Exposures to multiple air toxics in New York City. Environ Health Perspect 110 Suppl 4: 539-46.
Kohn, M. C. and R. L. Melnick (2001). Physiological modeling of butadiene disposition in mice and rats. Chem Biol Interact 135-136: 285-301.
Koivisto, P., I. D. Adler, F. Pacchierotti and K. Peltonen (1998). DNA adducts in mouse testis and lung after inhalation exposure to 1,3-butadiene. Mutat Res 397(1): 3-10.
Krause, R. J. and A. A. Elfarra (1997). Oxidation of butadiene monoxide to meso- and (+/-)-diepoxybutane by cDNA-expressed human cytochrome P450s and by mouse, rat, and human liver microsomes: evidence for preferential hydration of meso-diepoxybutane in rat and human liver microsomes. Arch Biochem Biophys 337(2): 176-84.
Lewis, D.F.V, M.G.Bird and D.V.Parke (1997). Molecular modelling of CYP2E1 enzymes from rat, mouse and man: An explanation for species differences in butadiene metabolism and potential carcinogenicity, and rationalization of CYP2E1 substrate specificity. Toxicology 118(2-3):93-113.
Lin, Y. S., T. J. Smith, K. T. Kelsey and D. Wypij (2001). Human physiologic factors in respiratory uptake of 1,3-butadiene. Environ Health Perspect 109(9): 921-6.
Lovreglio, P., N. Bukvic, S. Fustinoni, A. Ballini, I. Drago, V. Foa, G. Guanti and L. Soleo (2005). Lack of genotoxic effect in workers exposed to very low doses of 1,3-butadiene. Arch Toxicol: 1-4.
Lynch, J. (2001). Occupational exposure to butadiene, isoprene and chloroprene. Chem Biol Interact 135-136: 207-14.
SRP DRAFT September 2012
Appendix D1 39 Butadiene
Macaluso, M., R. Larson, E. Delzell, N. Sathiakumar, M. Hovinga, J. Julian, D. Muir and P. Cole (1996). Leukemia and cumulative exposure to butadiene, styrene and benzene among workers in the synthetic rubber industry. Toxicology 113(1-3): 190-202.
Matanoski, G. M., C. Santos-Burgoa and L. Schwartz (1990). Mortality of a cohort of workers in the styrene-butadiene polymer manufacturing industry (1943-1982). Environ Health Perspect 86: 107-17.
McMichael, A., R. Spirtas, J. Gamble and P. Tousey (1976). Mortality among rupper workers: Relationship to specific jobs. Journal of Occupational Medicine 18(3).
McNabola, A., B. Broderick, P. Johnston and L. Gill (2006). Effects of the smoking ban on benzene and 1,3-butadiene levels in pubs in Dublin. J Environ Sci Health A Tox Hazard Subst Environ Eng 41(5): 799-810.
Meinhardt, T. J., R. A. Lemen, M. S. Crandall and R. J. Young (1982). Environmental epidemiologic investigation of the styrene-butadiene rubber industry. Mortality patterns with discussion of the hematopoietic and lymphatic malignancies. Scand J Work Environ Health 8(4): 250-9.
Melnick, R. L., J. Huff, B. J. Chou and R. A. Miller (1990). Carcinogenicity of 1,3-butadiene in C57BL/6 x C3H F1 mice at low exposure concentrations. Cancer Res 50(20): 6592-9.
Melnick, R. L., J. E. Huff, J. H. Roycroft, B. J. Chou and R. A. Miller (1990). Inhalation toxicology and carcinogenicity of 1,3-butadiene in B6C3F1 mice following 65 weeks of exposure. Environ Health Perspect 86: 27-36.
Meng, Q., D. L. Redetzke, L. C. Hackfeld, R. P.,Hodge, D. M. Walker and V. E. Walker (2007). Mutagenicity of stereochemical configurations of 1,2-epoxybutene and 1,2:3,4-diepoxybutane in human lymphoblastoid cells. Chem Biol Interact 166(1-3): 207-18.
Morrissey, R. E., B. A. Schwetz, P. L. Hackett, M. R. Sikov, B. D. Hardin, B. J. McClanahan, J. R. Decker and T. J. Mast (1990). Overview of reproductive and developmental toxicity studies of 1,3-butadiene in rodents. Environ Health Perspect 86: 79-84.
Nazaroff, W. W. and B. C. Singer (2004). Inhalation of hazardous air pollutants from environmental tobacco smoke in US residences. J Expo Anal Environ Epidemiol 14 Suppl 1: S71-7.
NTP, N. T. P. (1984). Toxicology and carcinogenesis studies of 1,3-butadiene (CAS No. 106-99-0) in B6C3F1 mice (inhalation studies). N. T. Program, U.S. DEPARTMENT OF HEALTH AND HUMAN SERVICES Public Health Service National Institutes of Health.
NTP, N. T. P. (1993). NTP Toxicology and Carcinogenesis Studies of 1,3-Butadiene (CAS No. 106-99-0) in B6C3F1 Mice (Inhalation Studies). Natl Toxicol Program Tech Rep Ser 434: 1-389.
SRP DRAFT September 2012
Appendix D1 40 Butadiene
Owen, P. E. and J. R. Glaister (1990). Inhalation toxicity and carcinogenicity of 1,3-butadiene in Sprague-Dawley rats. Environ Health Perspect 86: 19-25.
Owen, P. E., J. R. Glaister, I. F. Gaunt and D. H. Pullinger (1987). Inhalation toxicity studies with 1,3-butadiene. 3. Two year toxicity/carcinogenicity study in rats. Am Ind Hyg Assoc J 48(5): 407-13.
Pacchierotti, F., I. D. Adler, D. Anderson, M. Brinkworth, N. A. Demopoulos, J. Lahdetie, S. Osterman-Golkar, K. Peltonen, A. Russo, A. Tates and R. Waters (1998). Genetic effects of 1,3-butadiene and associated risk for heritable damage. Mutat Res 397(1): 93-115.
Penn, A., G. Murphy, S. Barker, W. Henk and L. Penn (2005). Combustion-derived ultrafine particles transport organic toxicants to target respiratory cells. Environ Health Perspect 113(8): 956-63.
Perez, H. L., J. Lahdetie, H. Landin, I. Kilpelainen, P. Koivisto, K. Peltonen and S. Osterman-Golkar (1997). Haemoglobin adducts of epoxybutanediol from exposure to 1,3-butadiene or butadiene epoxides. Chem Biol Interact 105(3): 181-98.
Pery, A. R. R. and F. Y. Bois (2009). Stochasticity in physiological based kinetics models:implications for cancer risk assessment. Risk Anal 29(8):1182-1191.
Poet, T.S., C.R. Kirman, M. Bader, C.van Thriel, M.L.Gargas and P.M.Hinderliter (2010).Quantitative risk analysis for N-methyl pyrrolidone using physiologically based pharmacokinetic and benchmark dose modeling.Toxicol Sci 113(2):468-482.
Sandmeyer, E.E. (1981). Apiphatic Hydrocarbons: Butadiene. In: Clayton, G.D. and F.E. Clayton eds. Patty's Industrial Hygiene and Toxicology. Vol 2B, 3rd Revised Edition, J. Wiley and Sons, New York, N.Y.
Sapkota, A., D. Williams and T. J. Buckley (2005). Tollbooth workers and mobile source-related hazardous air pollutants: how protective is the indoor environment? Environ Sci Technol 39(9): 2936-43.
Sathiakumar, N., J. Graff, M. Macaluso, G. Maldonado, R. Matthews and E. Delzell (2005). An updated study of mortality among North American synthetic rubber industry workers. Occup Environ Med 62(12): 822-9.
Schmiederer, M., E. Knutson, P. Muganda and T. Albrecht (2005). Acute exposure of human lung cells to 1,3-butadiene diepoxide results in G1 and G2 cell cycle arrest. Environ Mol Mutagen 45(4): 354-64.
Serrano-Trespalacios, P. I., L. Ryan and J. D. Spengler (2004). Ambient, indoor and personal exposure relationships of volatile organic compounds in Mexico City Metropolitan Area. J Expo Anal Environ Epidemiol 14 Suppl 1: S118-32.
SRP DRAFT September 2012
Appendix D1 41 Butadiene
Shugaev, B. B. (1969). Concentrations of hydrocarbons in tissues as a measure of toxicity. Arch Environ Health 18(6): 878-82.
Sprague, C. L., L. A. Phillips, K. M. Young and A. A. Elfarra (2004). Species and tissue differences in the toxicity of 3-butene-1,2-diol in male Sprague-Dawley rats and B6C3F1 mice. Toxicol Sci 80(1): 3-13.
Sweeney, L. M., P. M. Schlosser, M. A. Medinsky and J. A. Bond (1997). Physiologically based pharmacokinetic modeling of 1,3-butadiene, 1,2-epoxy-3-butene, and 1,2:3,4-diepoxybutane toxicokinetics in mice and rats. Carcinogenesis 18(4): 611-25.
Thornton-Manning, J. R., A. R. Dahl, W. E. Bechtold, W. C. Griffith, Jr. and R. F. Henderson (1995). Disposition of butadiene monoepoxide and butadiene diepoxide in various tissues of rats and mice following a low-level inhalation exposure to 1,3-butadiene. Carcinogenesis 16(8): 1723-31.
Thurmond, L. M., L. D. Lauer, R. V. House, W. S. Stillman, R. D. Irons, W. H. Steinhagen and J. H. Dean (1986). Effect of short-term inhalation exposure to 1,3-butadiene on murine immune functions. Toxicol Appl Pharmacol 86(2): 170-9.
Tiveron, C., R. Ranaldi, B. Bassani and F. Pacchierotti (1997). Induction and transmission of chromosome aberrations in mouse oocytes after treatment with butadiene diepoxide. Environ Mol Mutagen 30(4): 403-9.
Tuazon, E. C., A. Alvarado, S. M. Aschmann, R. Atkinson and J. Arey (1999). Products of the gas-phase reactions of 1,3-butadiene with OH and NO3 radicals. Environmental Science & Technology 33(20): 3586-3595.
U.S. EPA. (2002). Health assessment of 1,3-butadiene. EPA/600/P-98/001F. National Center for Environmental Assessment , Office of Research and Development, U.S. Environmental Protection Agency, Washington, DC.
Valdez, K. E. and B. K. Petroff (2004). Potential roles of the aryl hydrocarbon receptor in female reproductive senescence. Reprod Biol 4(3): 243-58.
vom Saal, F. S., C. E. Finch and J. F. Nelson (1994). Natural history and mechanisms of reproductive aging in humans, laboratory rodents and other selected vertebrates. The Physiology of Reproduction pp 1213-1314. Eds Knobil E Neill JD. Raven Press, New York. K. E. and N. J.D. New York, Raven Press: 1213-1314.
Wickliffe, J. K., M. M. Ammenheuser, J. J. Salazar, S. Z. Abdel-Rahman, D. A. Hastings-Smith, E. M. Postlethwait, R. S. Lloyd and J. B. Ward Jr. (2003). A model of sensitivity: 1,3-butadiene increases mutant frequencies and genomic damage in mice lacking a functional microsomal epoxide hydrolase gene. Environ Mol Mutagen 42(2):106-10.
SRP DRAFT September 2012
Appendix D1 42 Butadiene
Wickliffe, J. K., M. M. Ammenheuser, P. J.Adler, S. Z. Abdel-Rahman and J. B.Ward Jr. (2009). Evaluation of frequencies of HPRT mutant lymphocytes in butadiene polymer workers in a Southeast Texas facility. Environ Mol Mutagen 50(2):82-7.
Wilson, R. (1944). Health hazards encountered in the manufacture of synthetic rubber. JAMA 124(11): 701-703.
Wise, P. M., M. J. Smith, D. B. Dubal, M. E. Wilson, S. W. Rau, A. B. Cashion, M. Bottner and K. L. Rosewell (2002). Neuroendocrine modulation and repercussions of female reproductive aging. Recent Prog Horm Res 57: 235-56.
SRP DRAFT September 2012
Appendix D1 43 Butadiene
Appendix A
This appendix includes information on genotoxicity of butadiene, except discussion of dominant lethal mutations and germ cell mutagenicity, which are covered in the developmental and reproductive toxicity section of the main document. An overview of the genotoxicity of butadiene and its metabolites is presented in Table A1. Also included are data on PBPK modeling of butadiene employed in the derivation of the BMCL05 and the 8-hr and chronic RELs. Table A2 gives a historical overview of the PBPK and related models that were more or less available for use.
A.1 Genetic Toxicity: Introduction
This section includes information on genetic toxicity. Albertini et al. (2010) have provided a comprehensive review of 1, 3-butadiene genotoxicity. As noted above, the metabolism of butadiene produces the major electrophilic metabolites EB, EBD, and DEB. These epoxide metabolites are responsible both for the mutagenicity and carcinogenicity of 1, 3-butadiene. They are DNA reactive forming a variety of adducts, and all are genotoxic in vitro and in vivo. Also butadiene epoxide metabolites form adducts with proteins notably hemoglobin and may exert or influence noncancer endpoints. In general genotoxicity, specifically oxidative DNA damage, may influence a number of chronic diseases and aging in addition to cancer (Cooke et al., 2006; Evans & Cooke, 2006).
A.2 Microbial test systems
Butadiene has induced mutagenic responses in all microbial systems that were provided with exogenous microsomal activation (S-9) that allowed the formation of oxidative metabolites. The purified metabolites epoxybutene (EB) and diepoxybutane (DEB) have also been shown to be mutagenic in all microbial systems without exogenous activation (Albertini, 1999). Carmical et al. (2000) found evidence of stereospecific mutagenicity of diolepoxide derived adducts in an E.coli system. The BDE R,R isomer induced a mutantion frequency of 0.14% (A→G mutations exclusively), whereas the S,S isomer induced 0.25% (A→C mutations exclusively). The mutation frequencies induced by BMO isomers were not significantly different from controls (<0.05%). Curiously, a recent report by Cho et al. (2010) demonstrated the mutagenicity in S. typhimurium TA1535 of the glutathione conjugate of DEB, S-(2-hydroxy-3,4-epoxybutyl)GSH. In general GSH conjugates are regarded as detoxification products but in this case the conjugate was reported to have higher mutagenic potency than DEB.
A.3 Higher organism test systems
Butadiene and its diepoxide have been tested in the fruit fly Drosophila melanogaster. BD was negative in sex-linked recessive lethal mutations and the spot wing test whereas DEB was positive in these tests. Studies in mammalian cell systems parallel those in microbial systems with BD, EB, DEB and epoxybutane diol (EBD) showing positive results in systems provided with exogenous activation. In these systems the rank order of mutagenic potency was generally DEB> EB (BMO)>EBD>BD. DEB was generally 40 to 100-fold more potent than EDB. DEB
SRP DRAFT September 2012
Appendix D1 44 Butadiene
is more likely to cause deletions, whereas all the epoxides induce base substitutions with a preference for A:T base pairs (Albertini, 1999). Both EB and DEB occur in different stereochemical configurations, which have been evaluated in the TK6 human lymphoblastoid cell line for increases in hypoxanthine-guanine phosphoribosyltransferase (HPRT) and thymidine kinase (TK) mutant frequencies. Meng et al. (2007) found no differences in cytotoxicity or mutagenicity among three isomers of DEB or the two isomers of EB. Thus, stereochemistry seems likely to play little role in the mutagenicity of BD. These findings were consistent with in vivo results, which showed little difference in the mutagenic efficiencies of racemic-DEB or meso-DEB in rodents. However, the results seem somewhat at odds with those of Carmical et al. (2000) above, where S,S-EBD derived adducts preferentially induced mutagenicity in E.coli.
Mutagenic studies in whole mammals have generally given positive responses when the animals (mice or rats) were exposed to butadiene by inhalation (Albertini et al., 2010). The tests included the mouse spot test, which involves in utero exposure of a developing embryo, which results in mutations in hair coloring in the offspring. Most of the assays were for mutations in the hprt locus in lymphocytes of exposed rodents.
A.4 Genotoxicity in humans
Genotoxicity in humans is usually assessed by the molecular epidemiology of exposed populations via the monitoring of genetic endpoints, including mutations. Several specific biomarkers of BD exposure are available which allow measurement of internal dosimetry of different BD metabolites. Two BD urinary metabolites: M1 (1, 2-dihydroxy-4-[N-acetylcysteinyl]-butane) and M2 (an isomeric mixture of 1-hydroxy-2-[N-acetylcisteinyl]-3-butene and 2-hydroxy-1-[N-acetylcisteinyl]-3-butene have frequently been used as measures of BD exposure (Albertini et al., 2010). N-terminal valine adducts of hemoglobin have also been used as in vivo BD dosimeters (Perez et al., 1997; Boogaard et al., 2001).
There have been several small studies involving one or more biomarkers of exposure and nine populations that have been subjected to comprehensive studies with biomarkers of BD exposure and specific genotoxicity endpoints including somatic gene mutations and chromosome aberrations (Albertini et.al., 2010). Overall the results of these investigations have been mixed. With respect to mutational endpoints, only studies of BD-exposed workers in Texas have reported significantly increased frequencies of hprt gene mutations in peripheral blood lymphocytes determined by autoradiography (Albertini et al., 2010; Wickliffe et al., 2009).
Albertini et al. (2007) conducted a molecular epidemiological study of 53 BD-exposed Czech workers and 51 controls. The mean 8-hr time weighted average (TWA) concentrations of BD were 0.008 mg/m3 (3.5 ppb) and 0.397 mg/m3 (180 ppb) for female controls and exposed, respectively, with individual 8-hr TWA values up to 9.8 mg/m3 (4.45 ppm). For male workers, mean TWA values for control and exposed workers were 3.2 and 370 ppb, respectively with single individual values up to 5.72 ppm. For both sexes, the urinary BD metabolites M1 and M2 were elevated in exposed vs. control subjects, reaching statistical significance in males. HPRT mutations, via cloning assays, and multiple measures of chromosome level changes (SCEs) were not associated with BD exposures.
SRP DRAFT September 2012
Appendix D1 45 Butadiene
Wickliffe et al. (2009) evaluated the frequencies of HPRT mutant lymphocytes in BD polymer workers in a Southeast Texas facility. Thirty workers were exposed to BD concentrations of 93.5 ppb (mean and 2.5 ppb (median) with only one individual’s exposure estimate (1684 ppb) exceeding the OSHA PEL of 1.0 ppm. The minimum detection level was 2.5 ppb and 50% of exposures were below this level. HPRT mutant frequencies by autoradiographic lymphocyte assay were not significantly associated with current exposures or age (N = 29). However HPRT mutant frequencies were significantly associated with occupational longevity (≥ 30 yr, N = 29, R2 = 0.107, P < 0.046). The authors speculate that chronic or past high-level BD exposures may have produced retention of mutant long-term memory T-cells.
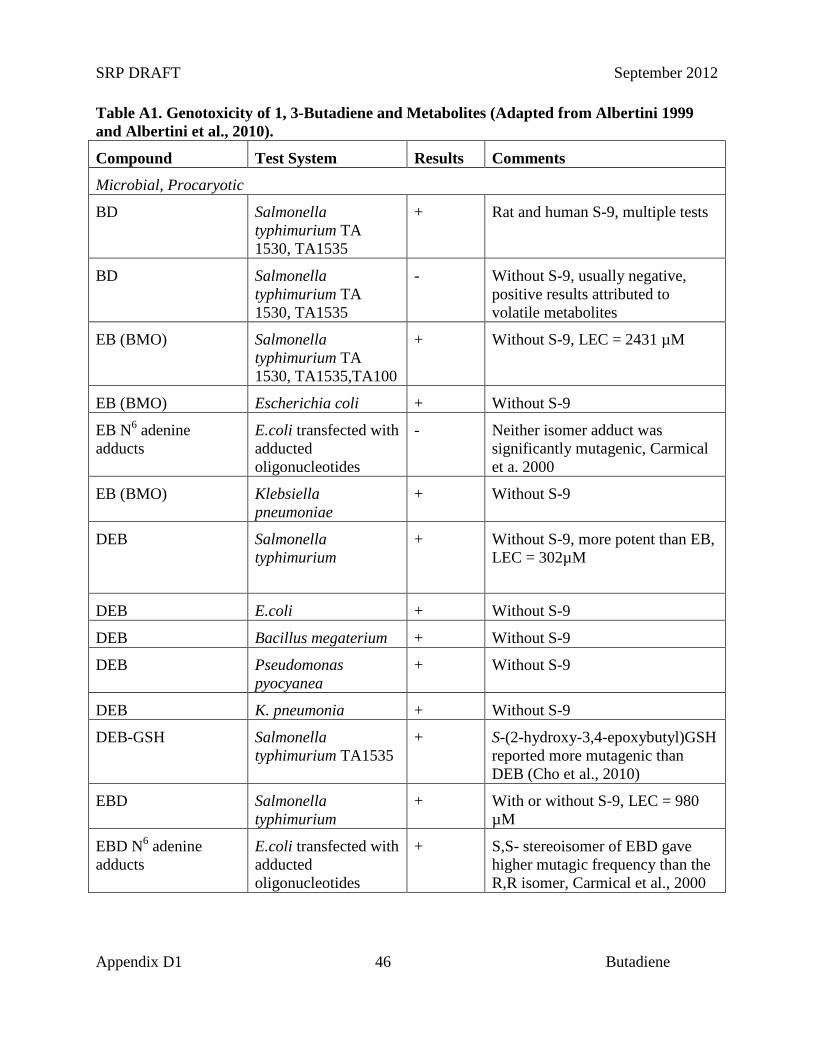
SRP DRAFT September 2012
Appendix D1 46 Butadiene
Table A1. Genotoxicity of 1, 3-Butadiene and Metabolites (Adapted from Albertini 1999 and Albertini et al., 2010).
Compound Test System Results Comments
Microbial, Procaryotic
BD Salmonella typhimurium TA 1530, TA1535
+ Rat and human S-9, multiple tests
BD Salmonella typhimurium TA 1530, TA1535
- Without S-9, usually negative, positive results attributed to volatile metabolites
EB (BMO) Salmonella typhimurium TA 1530, TA1535,TA100
+ Without S-9, LEC = 2431 µM
EB (BMO) Escherichia coli + Without S-9
EB N6 adenine adducts
E.coli transfected with adducted oligonucleotides
- Neither isomer adduct was significantly mutagenic, Carmical et a. 2000
EB (BMO) Klebsiella pneumoniae
+ Without S-9
DEB Salmonella typhimurium
+ Without S-9, more potent than EB, LEC = 302µM
DEB E.coli + Without S-9
DEB Bacillus megaterium + Without S-9
DEB Pseudomonas pyocyanea
+ Without S-9
DEB K. pneumonia + Without S-9
DEB-GSH Salmonella typhimurium TA1535
+ S-(2-hydroxy-3,4-epoxybutyl)GSH reported more mutagenic than DEB (Cho et al., 2010)
EBD Salmonella typhimurium
+ With or without S-9, LEC = 980 µM
EBD N6 adenine adducts
E.coli transfected with adducted oligonucleotides
+ S,S- stereoisomer of EBD gave higher mutagic frequency than the R,R isomer, Carmical et al., 2000
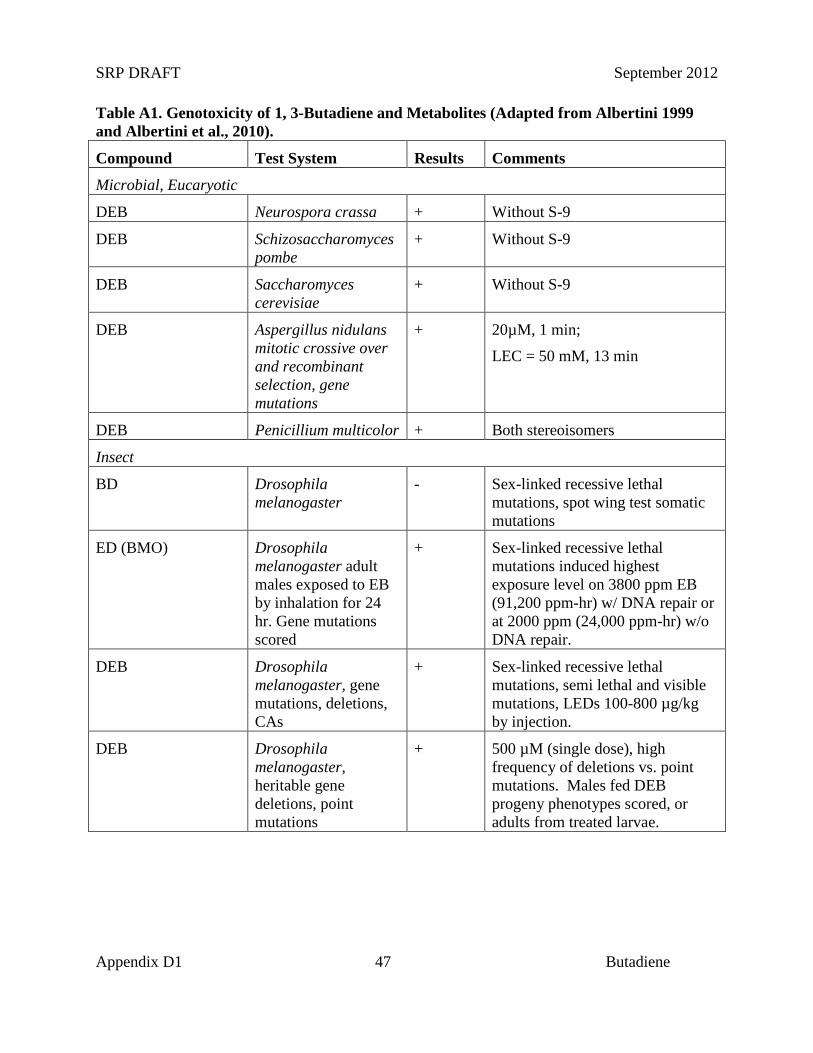
SRP DRAFT September 2012
Appendix D1 47 Butadiene
Table A1. Genotoxicity of 1, 3-Butadiene and Metabolites (Adapted from Albertini 1999 and Albertini et al., 2010).
Compound Test System Results Comments
Microbial, Eucaryotic
DEB Neurospora crassa + Without S-9
DEB Schizosaccharomyces pombe
+ Without S-9
DEB Saccharomyces cerevisiae
+ Without S-9
DEB Aspergillus nidulans mitotic crossive over and recombinant selection, gene mutations
+ 20µM, 1 min;
LEC = 50 mM, 13 min
DEB Penicillium multicolor + Both stereoisomers
Insect
BD Drosophila melanogaster
- Sex-linked recessive lethal mutations, spot wing test somatic mutations
ED (BMO) Drosophila melanogaster adult males exposed to EB by inhalation for 24 hr. Gene mutations scored
+ Sex-linked recessive lethal mutations induced highest exposure level on 3800 ppm EB (91,200 ppm-hr) w/ DNA repair or at 2000 ppm (24,000 ppm-hr) w/o DNA repair.
DEB Drosophila melanogaster, gene mutations, deletions, CAs
+ Sex-linked recessive lethal mutations, semi lethal and visible mutations, LEDs 100-800 µg/kg by injection.
DEB Drosophila melanogaster, heritable gene deletions, point mutations
+ 500 µM (single dose), high frequency of deletions vs. point mutations. Males fed DEB progeny phenotypes scored, or adults from treated larvae.
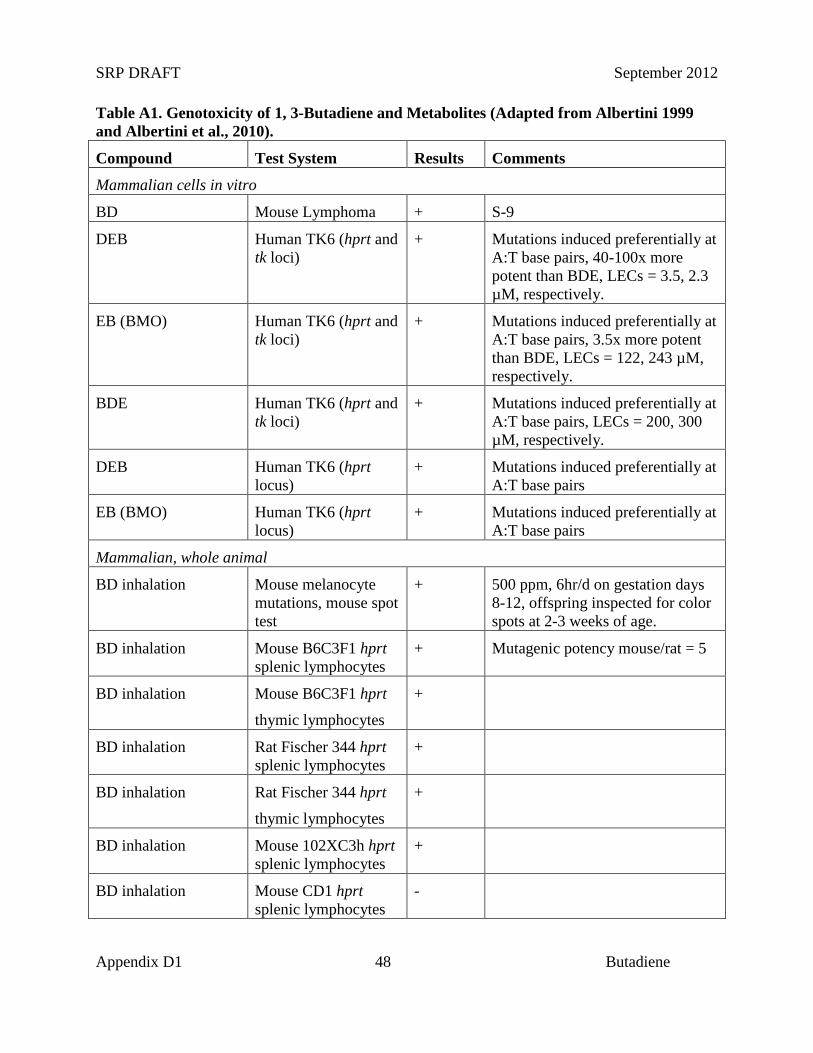
SRP DRAFT September 2012
Appendix D1 48 Butadiene
Table A1. Genotoxicity of 1, 3-Butadiene and Metabolites (Adapted from Albertini 1999 and Albertini et al., 2010).
Compound Test System Results Comments
Mammalian cells in vitro
BD Mouse Lymphoma + S-9
DEB Human TK6 (hprt and tk loci)
+ Mutations induced preferentially at A:T base pairs, 40-100x more potent than BDE, LECs = 3.5, 2.3 µM, respectively.
EB (BMO) Human TK6 (hprt and tk loci)
+ Mutations induced preferentially at A:T base pairs, 3.5x more potent than BDE, LECs = 122, 243 µM, respectively.
BDE Human TK6 (hprt and tk loci)
+ Mutations induced preferentially at A:T base pairs, LECs = 200, 300 µM, respectively.
DEB Human TK6 (hprt locus)
+ Mutations induced preferentially at A:T base pairs
EB (BMO) Human TK6 (hprt locus)
+ Mutations induced preferentially at A:T base pairs
Mammalian, whole animal
BD inhalation Mouse melanocyte mutations, mouse spot test
+ 500 ppm, 6hr/d on gestation days 8-12, offspring inspected for color spots at 2-3 weeks of age.
BD inhalation Mouse B6C3F1 hprt splenic lymphocytes
+ Mutagenic potency mouse/rat = 5
BD inhalation Mouse B6C3F1 hprt thymic lymphocytes
+
BD inhalation Rat Fischer 344 hprt splenic lymphocytes
+
BD inhalation Rat Fischer 344 hprt thymic lymphocytes
+
BD inhalation Mouse 102XC3h hprt splenic lymphocytes
+
BD inhalation Mouse CD1 hprt splenic lymphocytes
-
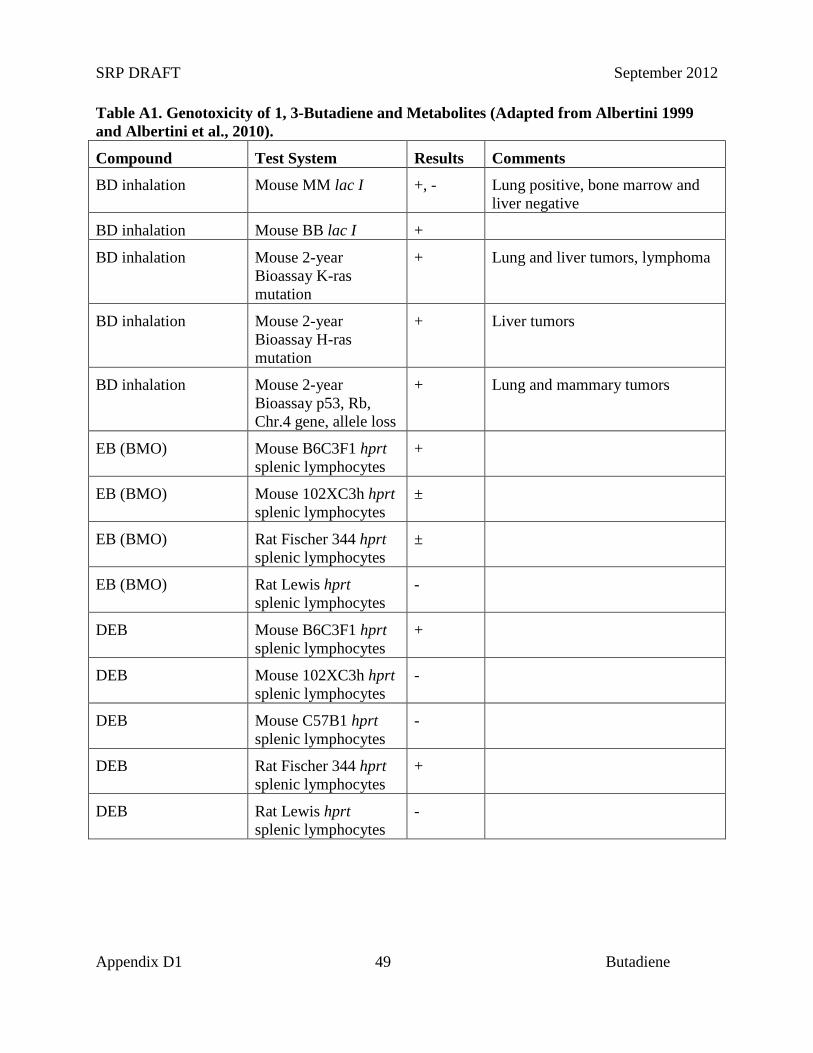
SRP DRAFT September 2012
Appendix D1 49 Butadiene
Table A1. Genotoxicity of 1, 3-Butadiene and Metabolites (Adapted from Albertini 1999 and Albertini et al., 2010).
Compound Test System Results Comments
BD inhalation Mouse MM lac I +, - Lung positive, bone marrow and liver negative
BD inhalation Mouse BB lac I +
BD inhalation Mouse 2-year Bioassay K-ras mutation
+ Lung and liver tumors, lymphoma
BD inhalation Mouse 2-year Bioassay H-ras mutation
+ Liver tumors
BD inhalation Mouse 2-year Bioassay p53, Rb, Chr.4 gene, allele loss
+ Lung and mammary tumors
EB (BMO) Mouse B6C3F1 hprt splenic lymphocytes
+
EB (BMO) Mouse 102XC3h hprt splenic lymphocytes
±
EB (BMO) Rat Fischer 344 hprt splenic lymphocytes
±
EB (BMO) Rat Lewis hprt splenic lymphocytes
-
DEB Mouse B6C3F1 hprt splenic lymphocytes
+
DEB Mouse 102XC3h hprt splenic lymphocytes
-
DEB Mouse C57B1 hprt splenic lymphocytes
-
DEB Rat Fischer 344 hprt splenic lymphocytes
+
DEB Rat Lewis hprt splenic lymphocytes
-
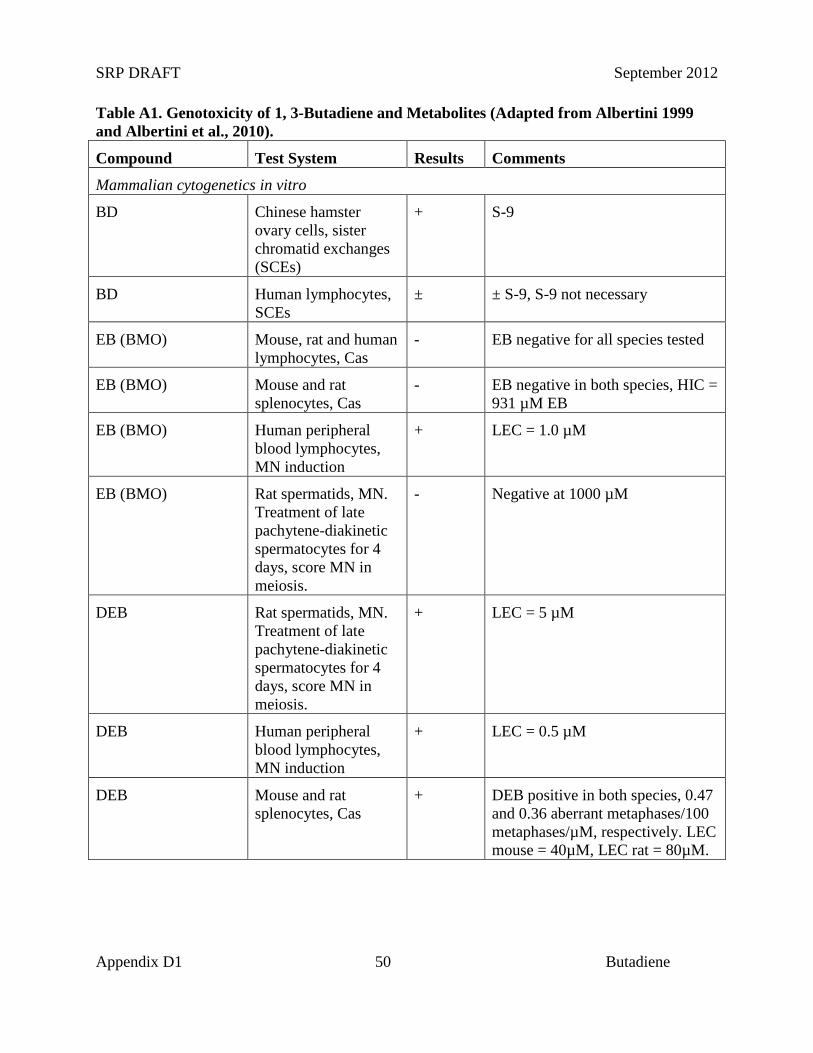
SRP DRAFT September 2012
Appendix D1 50 Butadiene
Table A1. Genotoxicity of 1, 3-Butadiene and Metabolites (Adapted from Albertini 1999 and Albertini et al., 2010).
Compound Test System Results Comments
Mammalian cytogenetics in vitro
BD Chinese hamster ovary cells, sister chromatid exchanges (SCEs)
+ S-9
BD Human lymphocytes, SCEs
± ± S-9, S-9 not necessary
EB (BMO) Mouse, rat and human lymphocytes, Cas
- EB negative for all species tested
EB (BMO) Mouse and rat splenocytes, Cas
- EB negative in both species, HIC = 931 µM EB
EB (BMO) Human peripheral blood lymphocytes, MN induction
+ LEC = 1.0 µM
EB (BMO) Rat spermatids, MN. Treatment of late pachytene-diakinetic spermatocytes for 4 days, score MN in meiosis.
- Negative at 1000 µM
DEB Rat spermatids, MN. Treatment of late pachytene-diakinetic spermatocytes for 4 days, score MN in meiosis.
+ LEC = 5 µM
DEB Human peripheral blood lymphocytes, MN induction
+ LEC = 0.5 µM
DEB Mouse and rat splenocytes, Cas
+ DEB positive in both species, 0.47 and 0.36 aberrant metaphases/100 metaphases/µM, respectively. LEC mouse = 40µM, LEC rat = 80µM.
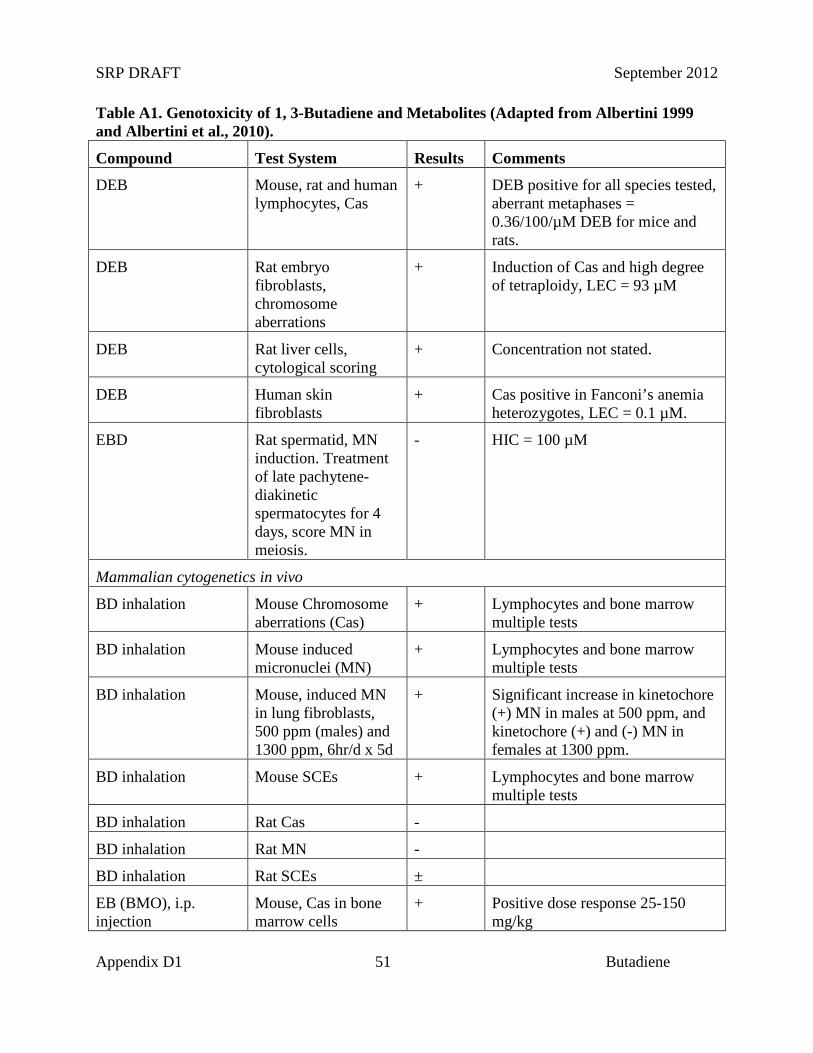
SRP DRAFT September 2012
Appendix D1 51 Butadiene
Table A1. Genotoxicity of 1, 3-Butadiene and Metabolites (Adapted from Albertini 1999 and Albertini et al., 2010).
Compound Test System Results Comments
DEB Mouse, rat and human lymphocytes, Cas
+ DEB positive for all species tested, aberrant metaphases = 0.36/100/µM DEB for mice and rats.
DEB Rat embryo fibroblasts, chromosome aberrations
+ Induction of Cas and high degree of tetraploidy, LEC = 93 µM
DEB Rat liver cells, cytological scoring
+ Concentration not stated.
DEB Human skin fibroblasts
+ Cas positive in Fanconi’s anemia heterozygotes, LEC = 0.1 µM.
EBD Rat spermatid, MN induction. Treatment of late pachytene-diakinetic spermatocytes for 4 days, score MN in meiosis.
- HIC = 100 µM
Mammalian cytogenetics in vivo
BD inhalation Mouse Chromosome aberrations (Cas)
+ Lymphocytes and bone marrow multiple tests
BD inhalation Mouse induced micronuclei (MN)
+ Lymphocytes and bone marrow multiple tests
BD inhalation Mouse, induced MN in lung fibroblasts, 500 ppm (males) and 1300 ppm, 6hr/d x 5d
+ Significant increase in kinetochore (+) MN in males at 500 ppm, and kinetochore (+) and (-) MN in females at 1300 ppm.
BD inhalation Mouse SCEs + Lymphocytes and bone marrow multiple tests
BD inhalation Rat Cas -
BD inhalation Rat MN -
BD inhalation Rat SCEs ±
EB (BMO), i.p. injection
Mouse, Cas in bone marrow cells
+ Positive dose response 25-150 mg/kg
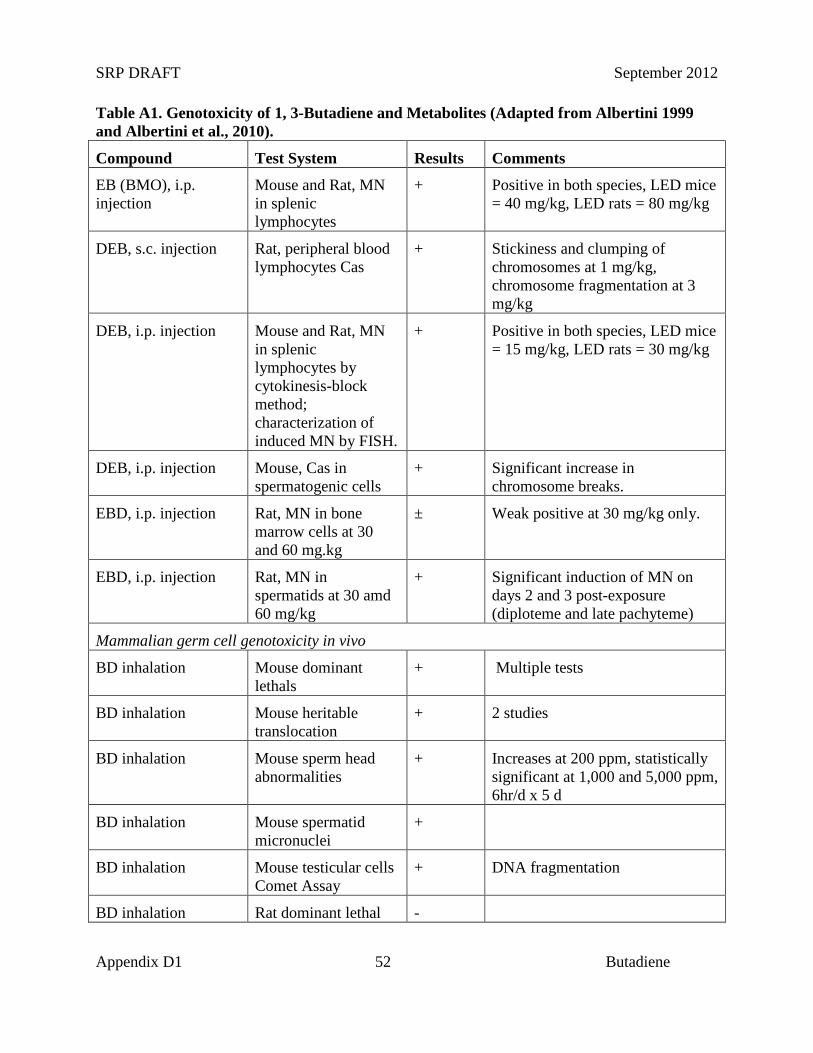
SRP DRAFT September 2012
Appendix D1 52 Butadiene
Table A1. Genotoxicity of 1, 3-Butadiene and Metabolites (Adapted from Albertini 1999 and Albertini et al., 2010).
Compound Test System Results Comments
EB (BMO), i.p. injection
Mouse and Rat, MN in splenic lymphocytes
+ Positive in both species, LED mice = 40 mg/kg, LED rats = 80 mg/kg
DEB, s.c. injection Rat, peripheral blood lymphocytes Cas
+ Stickiness and clumping of chromosomes at 1 mg/kg, chromosome fragmentation at 3 mg/kg
DEB, i.p. injection Mouse and Rat, MN in splenic lymphocytes by cytokinesis-block method; characterization of induced MN by FISH.
+ Positive in both species, LED mice = 15 mg/kg, LED rats = 30 mg/kg
DEB, i.p. injection Mouse, Cas in spermatogenic cells
+ Significant increase in chromosome breaks.
EBD, i.p. injection Rat, MN in bone marrow cells at 30 and 60 mg.kg
± Weak positive at 30 mg/kg only.
EBD, i.p. injection Rat, MN in spermatids at 30 amd 60 mg/kg
+ Significant induction of MN on days 2 and 3 post-exposure (diploteme and late pachyteme)
Mammalian germ cell genotoxicity in vivo
BD inhalation Mouse dominant lethals
+ Multiple tests
BD inhalation Mouse heritable translocation
+ 2 studies
BD inhalation Mouse sperm head abnormalities
+ Increases at 200 ppm, statistically significant at 1,000 and 5,000 ppm, 6hr/d x 5 d
BD inhalation Mouse spermatid micronuclei
+
BD inhalation Mouse testicular cells Comet Assay
+ DNA fragmentation
BD inhalation Rat dominant lethal -
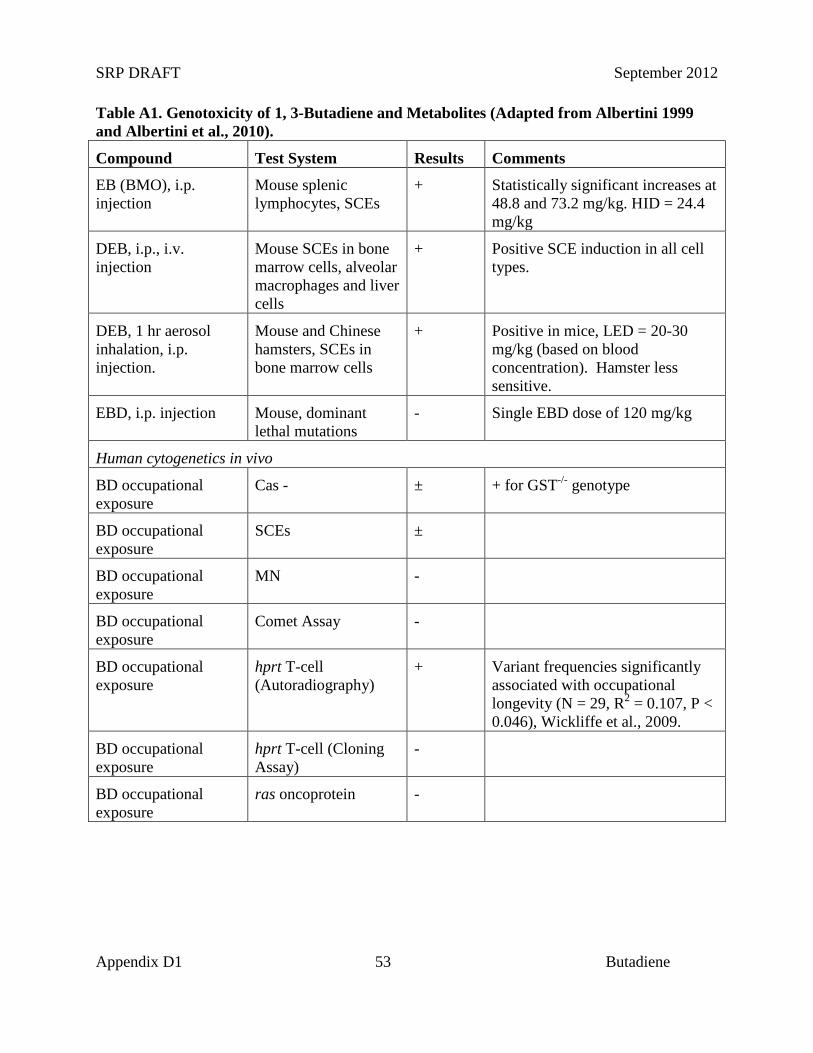
SRP DRAFT September 2012
Appendix D1 53 Butadiene
Table A1. Genotoxicity of 1, 3-Butadiene and Metabolites (Adapted from Albertini 1999 and Albertini et al., 2010).
Compound Test System Results Comments
EB (BMO), i.p. injection
Mouse splenic lymphocytes, SCEs
+ Statistically significant increases at 48.8 and 73.2 mg/kg. HID = 24.4 mg/kg
DEB, i.p., i.v. injection
Mouse SCEs in bone marrow cells, alveolar macrophages and liver cells
+ Positive SCE induction in all cell types.
DEB, 1 hr aerosol inhalation, i.p. injection.
Mouse and Chinese hamsters, SCEs in bone marrow cells
+ Positive in mice, LED = 20-30 mg/kg (based on blood concentration). Hamster less sensitive.
EBD, i.p. injection Mouse, dominant lethal mutations
- Single EBD dose of 120 mg/kg
Human cytogenetics in vivo
BD occupational exposure
Cas - ± + for GST-/- genotype
BD occupational exposure
SCEs ±
BD occupational exposure
MN -
BD occupational exposure
Comet Assay -
BD occupational exposure
hprt T-cell (Autoradiography)
+ Variant frequencies significantly associated with occupational longevity (N = 29, R2 = 0.107, P < 0.046), Wickliffe et al., 2009.
BD occupational exposure
hprt T-cell (Cloning Assay)
-
BD occupational exposure
ras oncoprotein -
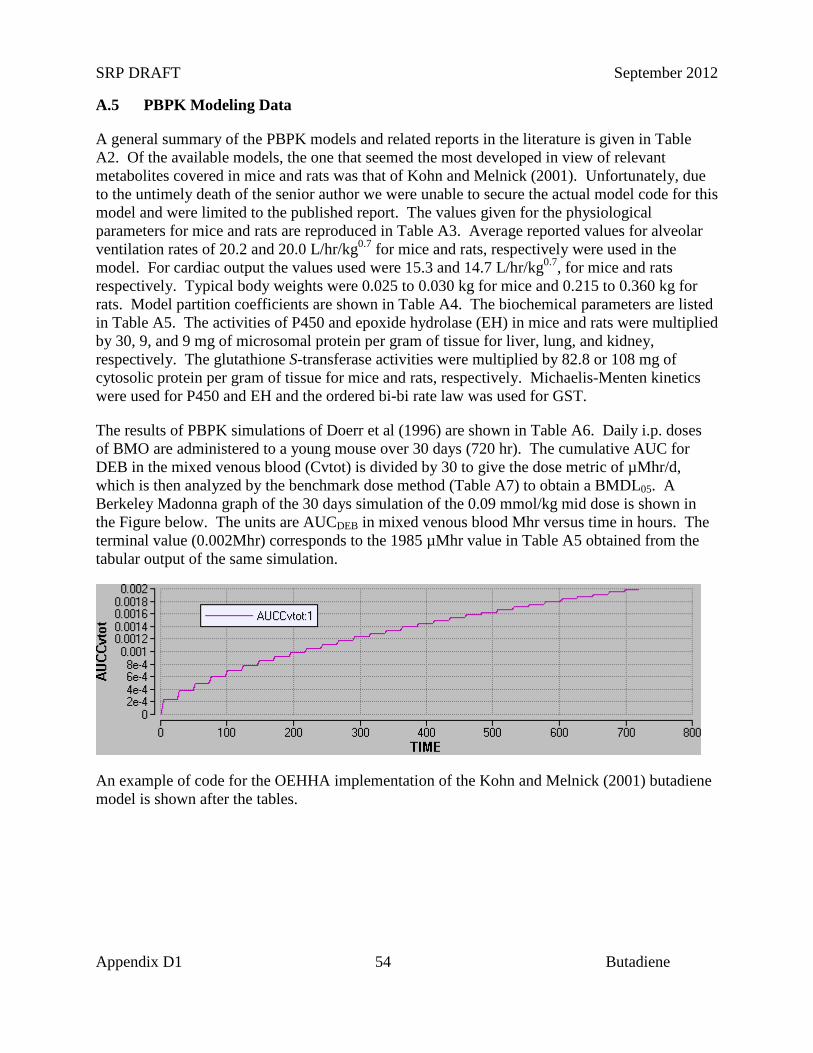
SRP DRAFT September 2012
Appendix D1 54 Butadiene
A.5 PBPK Modeling Data
A general summary of the PBPK models and related reports in the literature is given in Table A2. Of the available models, the one that seemed the most developed in view of relevant metabolites covered in mice and rats was that of Kohn and Melnick (2001). Unfortunately, due to the untimely death of the senior author we were unable to secure the actual model code for this model and were limited to the published report. The values given for the physiological parameters for mice and rats are reproduced in Table A3. Average reported values for alveolar ventilation rates of 20.2 and 20.0 L/hr/kg0.7 for mice and rats, respectively were used in the model. For cardiac output the values used were 15.3 and 14.7 L/hr/kg0.7, for mice and rats respectively. Typical body weights were 0.025 to 0.030 kg for mice and 0.215 to 0.360 kg for rats. Model partition coefficients are shown in Table A4. The biochemical parameters are listed in Table A5. The activities of P450 and epoxide hydrolase (EH) in mice and rats were multiplied by 30, 9, and 9 mg of microsomal protein per gram of tissue for liver, lung, and kidney, respectively. The glutathione S-transferase activities were multiplied by 82.8 or 108 mg of cytosolic protein per gram of tissue for mice and rats, respectively. Michaelis-Menten kinetics were used for P450 and EH and the ordered bi-bi rate law was used for GST.
The results of PBPK simulations of Doerr et al (1996) are shown in Table A6. Daily i.p. doses of BMO are administered to a young mouse over 30 days (720 hr). The cumulative AUC for DEB in the mixed venous blood (Cvtot) is divided by 30 to give the dose metric of µMhr/d, which is then analyzed by the benchmark dose method (Table A7) to obtain a BMDL05. A Berkeley Madonna graph of the 30 days simulation of the 0.09 mmol/kg mid dose is shown in the Figure below. The units are AUCDEB in mixed venous blood Mhr versus time in hours. The terminal value (0.002Mhr) corresponds to the 1985 µMhr value in Table A5 obtained from the tabular output of the same simulation.
An example of code for the OEHHA implementation of the Kohn and Melnick (2001) butadiene model is shown after the tables.
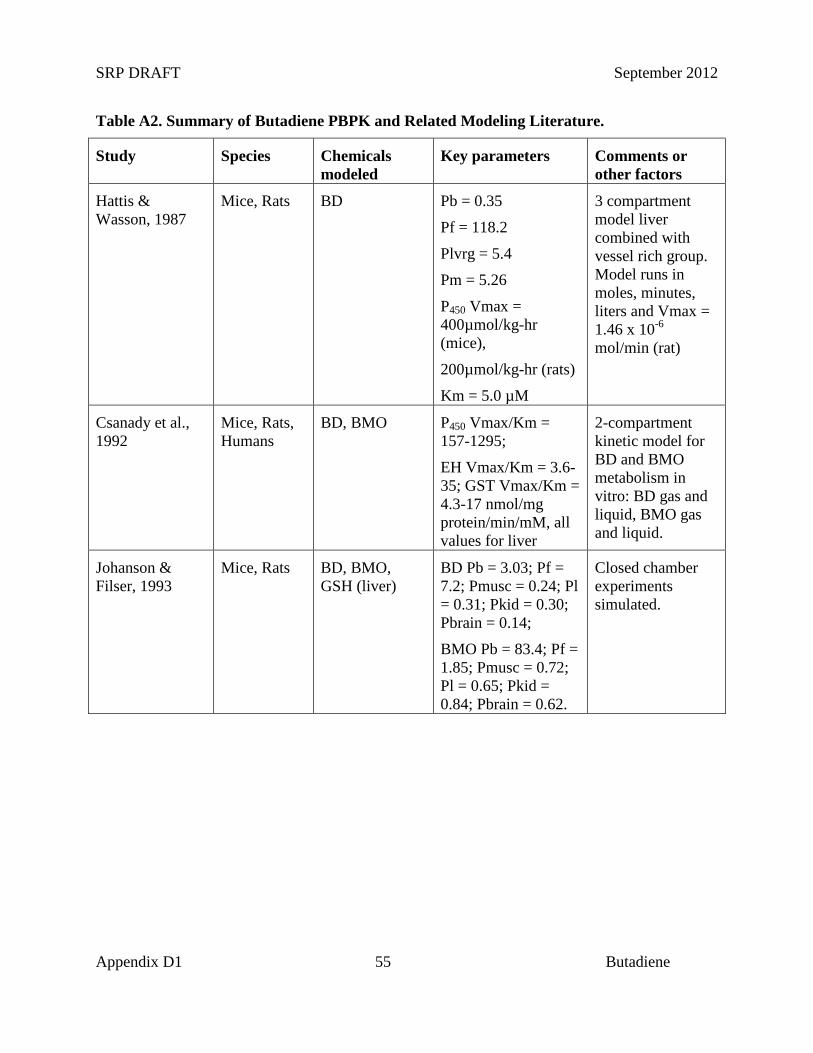
SRP DRAFT September 2012
Appendix D1 55 Butadiene
Table A2. Summary of Butadiene PBPK and Related Modeling Literature.
Study Species Chemicals modeled
Key parameters Comments or other factors
Hattis & Wasson, 1987
Mice, Rats BD Pb = 0.35
Pf = 118.2
Plvrg = 5.4
Pm = 5.26
P450 Vmax = 400µmol/kg-hr (mice),
200µmol/kg-hr (rats)
Km = 5.0 µM
3 compartment model liver combined with vessel rich group. Model runs in moles, minutes, liters and Vmax = 1.46 x 10⁻⁶ mol/min (rat)
Csanady et al., 1992
Mice, Rats, Humans
BD, BMO P450 Vmax/Km = 157-1295;
EH Vmax/Km = 3.6-35; GST Vmax/Km = 4.3-17 nmol/mg protein/min/mM, all values for liver
2-compartment kinetic model for BD and BMO metabolism in vitro: BD gas and liquid, BMO gas and liquid.
Johanson & Filser, 1993
Mice, Rats BD, BMO, GSH (liver)
BD Pb = 3.03; Pf = 7.2; Pmusc = 0.24; Pl = 0.31; Pkid = 0.30; Pbrain = 0.14;
BMO Pb = 83.4; Pf = 1.85; Pmusc = 0.72; Pl = 0.65; Pkid = 0.84; Pbrain = 0.62.
Closed chamber experiments simulated.
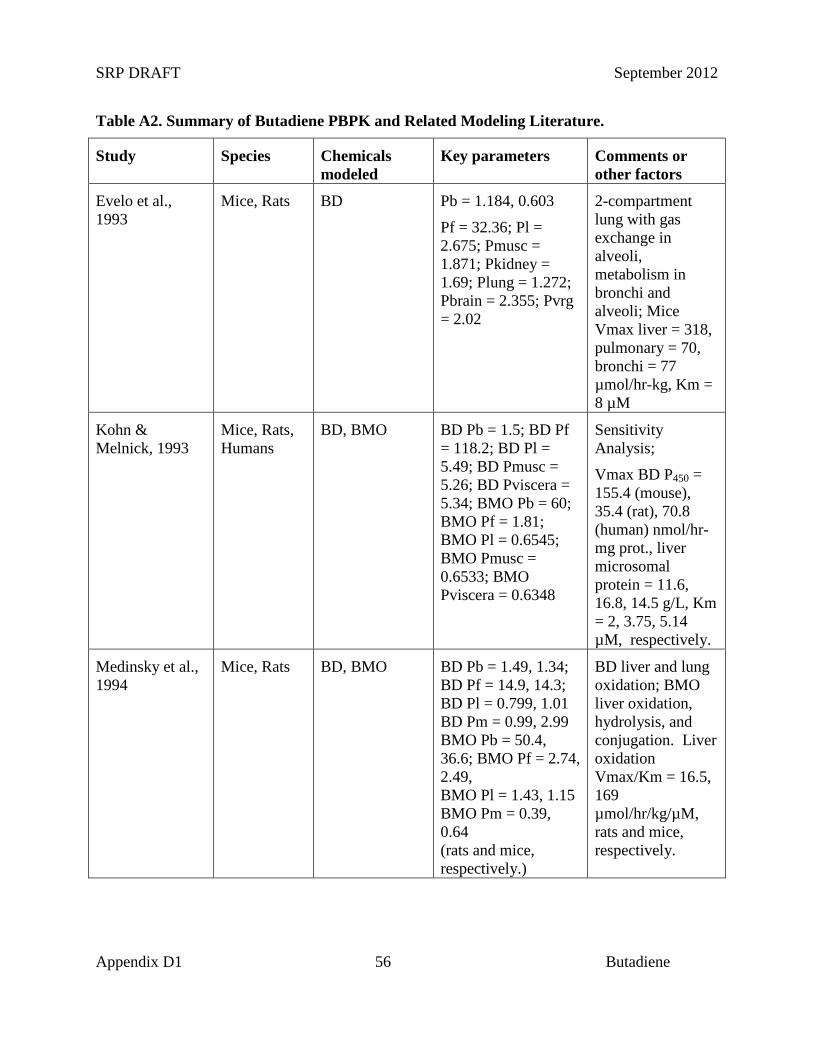
SRP DRAFT September 2012
Appendix D1 56 Butadiene
Table A2. Summary of Butadiene PBPK and Related Modeling Literature.
Study Species Chemicals modeled
Key parameters Comments or other factors
Evelo et al., 1993
Mice, Rats BD Pb = 1.184, 0.603
Pf = 32.36; Pl = 2.675; Pmusc = 1.871; Pkidney = 1.69; Plung = 1.272; Pbrain = 2.355; Pvrg = 2.02
2-compartment lung with gas exchange in alveoli, metabolism in bronchi and alveoli; Mice Vmax liver = 318, pulmonary = 70, bronchi = 77 µmol/hr-kg, Km = 8 µM
Kohn & Melnick, 1993
Mice, Rats, Humans
BD, BMO BD Pb = 1.5; BD Pf = 118.2; BD Pl = 5.49; BD Pmusc = 5.26; BD Pviscera = 5.34; BMO Pb = 60; BMO Pf = 1.81; BMO Pl = 0.6545; BMO Pmusc = 0.6533; BMO Pviscera = 0.6348
Sensitivity Analysis;
Vmax BD P450 = 155.4 (mouse), 35.4 (rat), 70.8 (human) nmol/hr-mg prot., liver microsomal protein = 11.6, 16.8, 14.5 g/L, Km = 2, 3.75, 5.14 µM, respectively.
Medinsky et al., 1994
Mice, Rats BD, BMO BD Pb = 1.49, 1.34; BD Pf = 14.9, 14.3; BD Pl = 0.799, 1.01 BD Pm = 0.99, 2.99 BMO Pb = 50.4, 36.6; BMO Pf = 2.74, 2.49, BMO Pl = 1.43, 1.15 BMO Pm = 0.39, 0.64 (rats and mice, respectively.)
BD liver and lung oxidation; BMO liver oxidation, hydrolysis, and conjugation. Liver oxidation Vmax/Km = 16.5, 169 µmol/hr/kg/µM, rats and mice, respectively.
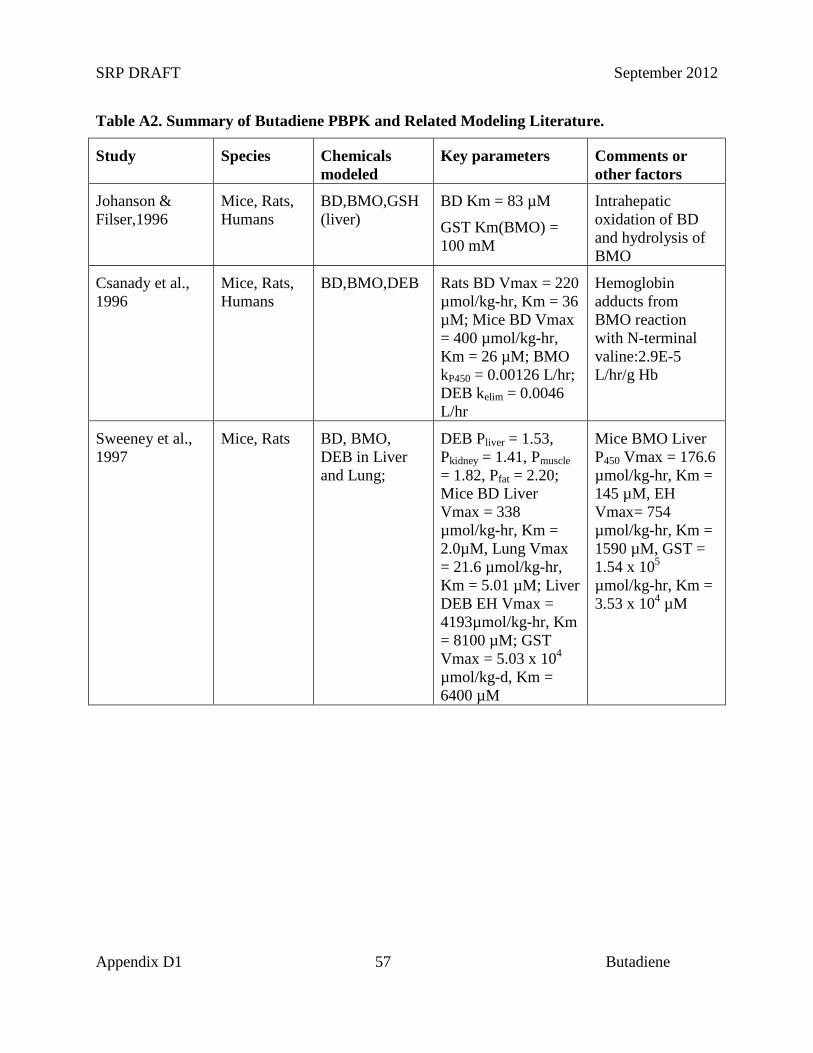
SRP DRAFT September 2012
Appendix D1 57 Butadiene
Table A2. Summary of Butadiene PBPK and Related Modeling Literature.
Study Species Chemicals modeled
Key parameters Comments or other factors
Johanson & Filser,1996
Mice, Rats, Humans
BD,BMO,GSH (liver)
BD Km = 83 µM
GST Km(BMO) = 100 mM
Intrahepatic oxidation of BD and hydrolysis of BMO
Csanady et al., 1996
Mice, Rats, Humans
BD,BMO,DEB Rats BD Vmax = 220 µmol/kg-hr, Km = 36 µM; Mice BD Vmax = 400 µmol/kg-hr, Km = 26 µM; BMO kP450 = 0.00126 L/hr; DEB kelim = 0.0046 L/hr
Hemoglobin adducts from BMO reaction with N-terminal valine:2.9E-5 L/hr/g Hb
Sweeney et al., 1997
Mice, Rats BD, BMO, DEB in Liver and Lung;
DEB Pliver = 1.53, Pkidney = 1.41, Pmuscle = 1.82, Pfat = 2.20; Mice BD Liver Vmax = 338 µmol/kg-hr, Km = 2.0µM, Lung Vmax = 21.6 µmol/kg-hr, Km = 5.01 µM; Liver DEB EH Vmax = 4193µmol/kg-hr, Km = 8100 µM; GST Vmax = 5.03 x 10⁴ µmol/kg-d, Km = 6400 µM
Mice BMO Liver P450 Vmax = 176.6 µmol/kg-hr, Km = 145 µM, EH Vmax= 754 µmol/kg-hr, Km = 1590 µM, GST = 1.54 x 10⁵ µmol/kg-hr, Km = 3.53 x 10⁴ µM
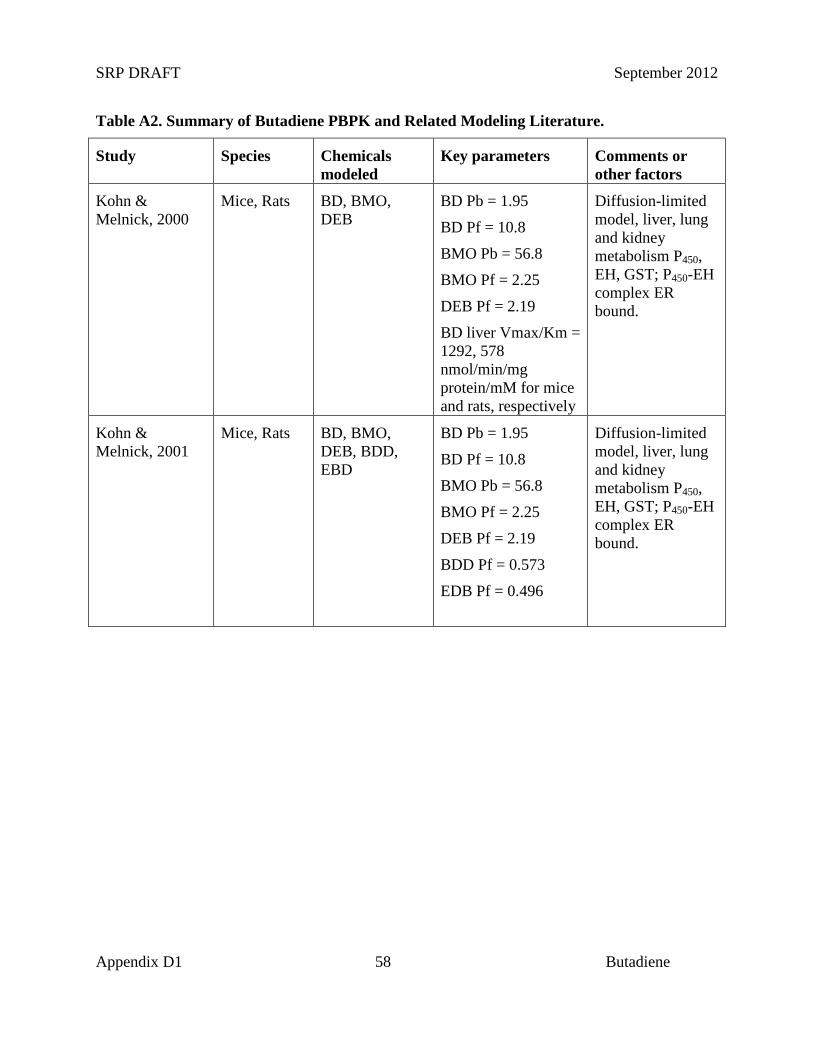
SRP DRAFT September 2012
Appendix D1 58 Butadiene
Table A2. Summary of Butadiene PBPK and Related Modeling Literature.
Study Species Chemicals modeled
Key parameters Comments or other factors
Kohn & Melnick, 2000
Mice, Rats BD, BMO, DEB
BD Pb = 1.95
BD Pf = 10.8
BMO Pb = 56.8
BMO Pf = 2.25
DEB Pf = 2.19
BD liver Vmax/Km = 1292, 578 nmol/min/mg protein/mM for mice and rats, respectively
Diffusion-limited model, liver, lung and kidney metabolism P450, EH, GST; P450-EH complex ER bound.
Kohn & Melnick, 2001
Mice, Rats BD, BMO, DEB, BDD, EBD
BD Pb = 1.95
BD Pf = 10.8
BMO Pb = 56.8
BMO Pf = 2.25
DEB Pf = 2.19
BDD Pf = 0.573
EDB Pf = 0.496
Diffusion-limited model, liver, lung and kidney metabolism P450, EH, GST; P450-EH complex ER bound.
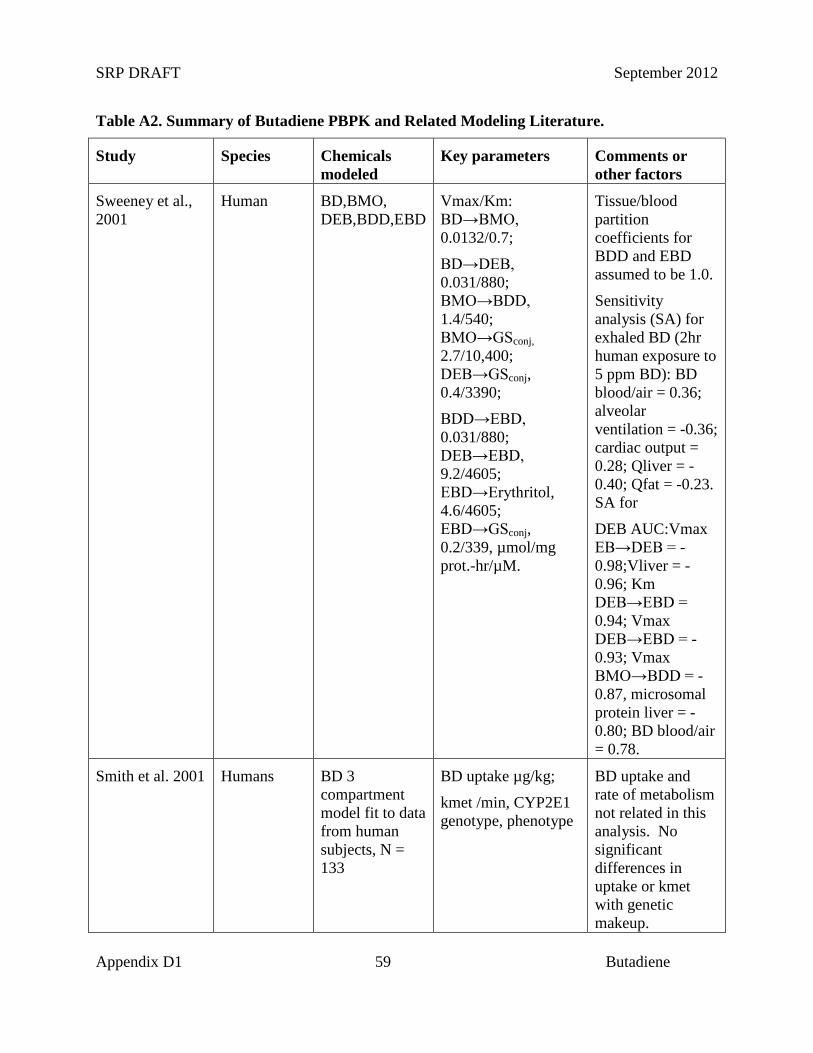
SRP DRAFT September 2012
Appendix D1 59 Butadiene
Table A2. Summary of Butadiene PBPK and Related Modeling Literature.
Study Species Chemicals modeled
Key parameters Comments or other factors
Sweeney et al., 2001
Human BD,BMO, DEB,BDD,EBD
Vmax/Km: BD→BMO, 0.0132/0.7;
BD→DEB, 0.031/880; BMO→BDD, 1.4/540; BMO→GSconj, 2.7/10,400; DEB→GSconj, 0.4/3390;
BDD→EBD, 0.031/880; DEB→EBD, 9.2/4605; EBD→Erythritol, 4.6/4605; EBD→GSconj, 0.2/339, µmol/mg prot.-hr/µM.
Tissue/blood partition coefficients for BDD and EBD assumed to be 1.0.
Sensitivity analysis (SA) for exhaled BD (2hr human exposure to 5 ppm BD): BD blood/air = 0.36; alveolar ventilation = -0.36; cardiac output = 0.28; Qliver = -0.40; Qfat = -0.23. SA for
DEB AUC:Vmax EB→DEB = -0.98;Vliver = -0.96; Km DEB→EBD = 0.94; Vmax DEB→EBD = -0.93; Vmax BMO→BDD = -0.87, microsomal protein liver = -0.80; BD blood/air = 0.78.
Smith et al. 2001 Humans BD 3 compartment model fit to data from human subjects, N = 133
BD uptake µg/kg;
kmet /min, CYP2E1 genotype, phenotype
BD uptake and rate of metabolism not related in this analysis. No significant differences in uptake or kmet with genetic makeup.
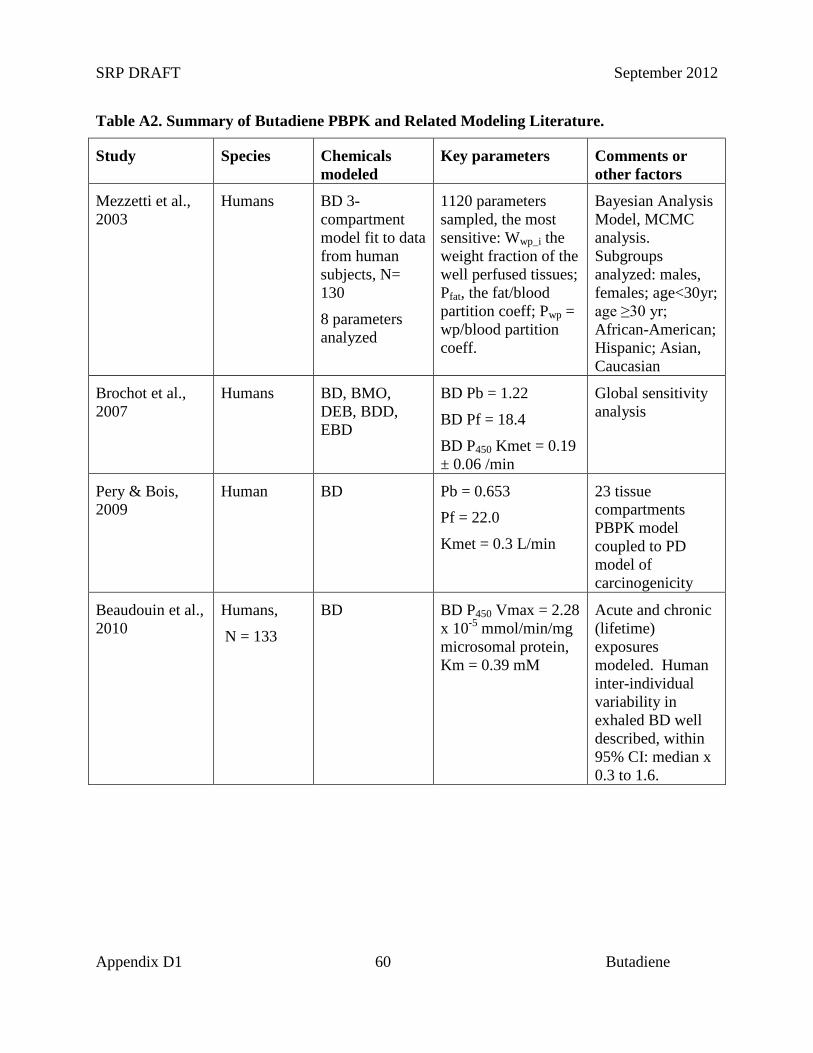
SRP DRAFT September 2012
Appendix D1 60 Butadiene
Table A2. Summary of Butadiene PBPK and Related Modeling Literature.
Study Species Chemicals modeled
Key parameters Comments or other factors
Mezzetti et al., 2003
Humans BD 3-compartment model fit to data from human subjects, N= 130
8 parameters analyzed
1120 parameters sampled, the most sensitive: Wwp_i the weight fraction of the well perfused tissues; Pfat, the fat/blood partition coeff; Pwp = wp/blood partition coeff.
Bayesian Analysis Model, MCMC analysis. Subgroups analyzed: males, females; age<30yr; age ≥30 yr; African-American; Hispanic; Asian, Caucasian
Brochot et al., 2007
Humans BD, BMO, DEB, BDD, EBD
BD Pb = 1.22
BD Pf = 18.4
BD P450 Kmet = 0.19 ± 0.06 /min
Global sensitivity analysis
Pery & Bois, 2009
Human BD Pb = 0.653 Pf = 22.0
Kmet = 0.3 L/min
23 tissue compartments PBPK model coupled to PD model of carcinogenicity
Beaudouin et al., 2010
Humans,
N = 133
BD BD P450 Vmax = 2.28 x 10⁻⁵ mmol/min/mg microsomal protein, Km = 0.39 mM
Acute and chronic (lifetime) exposures modeled. Human inter-individual variability in exhaled BD well described, within 95% CI: median x 0.3 to 1.6.
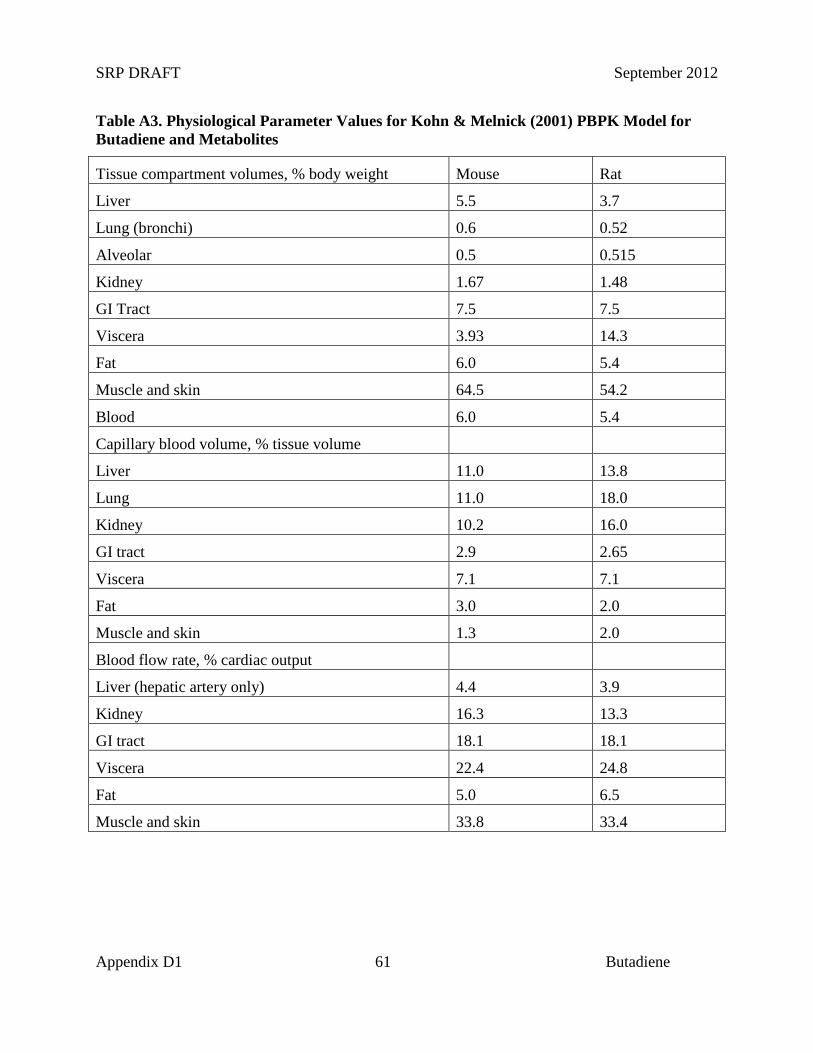
SRP DRAFT September 2012
Appendix D1 61 Butadiene
Table A3. Physiological Parameter Values for Kohn & Melnick (2001) PBPK Model for Butadiene and Metabolites
Tissue compartment volumes, % body weight Mouse Rat
Liver 5.5 3.7
Lung (bronchi) 0.6 0.52
Alveolar 0.5 0.515
Kidney 1.67 1.48
GI Tract 7.5 7.5
Viscera 3.93 14.3
Fat 6.0 5.4
Muscle and skin 64.5 54.2
Blood 6.0 5.4
Capillary blood volume, % tissue volume
Liver 11.0 13.8
Lung 11.0 18.0
Kidney 10.2 16.0
GI tract 2.9 2.65
Viscera 7.1 7.1
Fat 3.0 2.0
Muscle and skin 1.3 2.0
Blood flow rate, % cardiac output
Liver (hepatic artery only) 4.4 3.9
Kidney 16.3 13.3
GI tract 18.1 18.1
Viscera 22.4 24.8
Fat 5.0 6.5
Muscle and skin 33.8 33.4
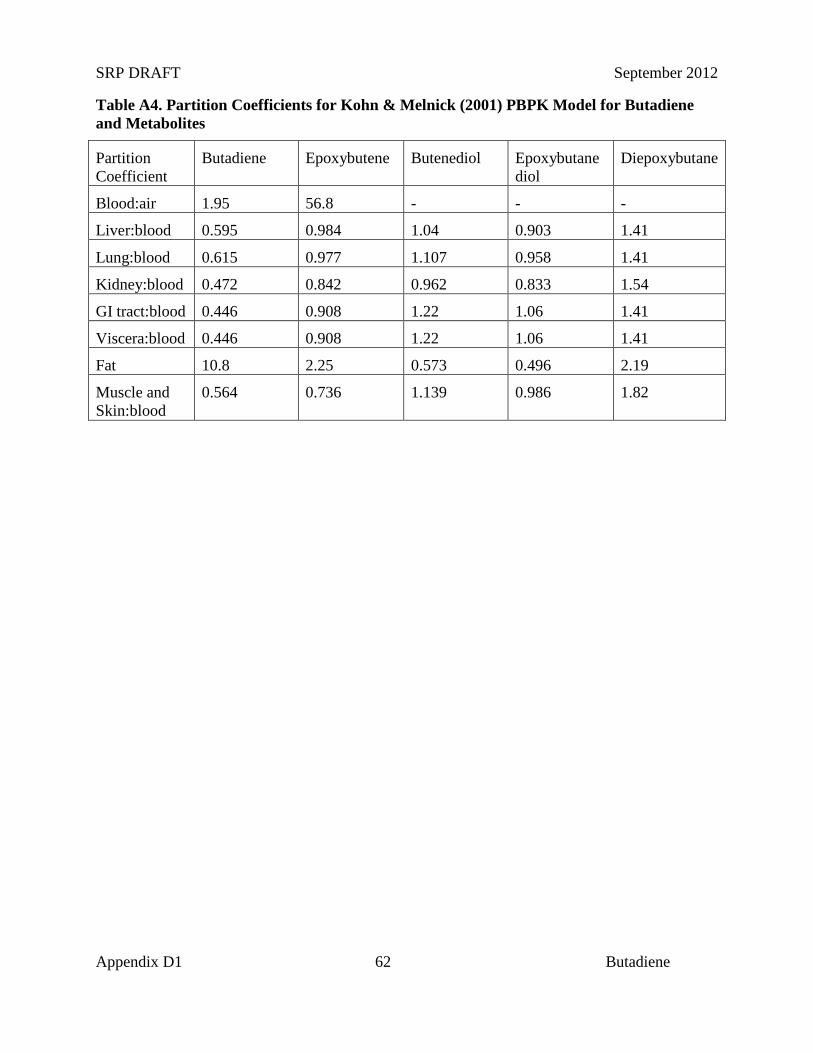
SRP DRAFT September 2012
Appendix D1 62 Butadiene
Table A4. Partition Coefficients for Kohn & Melnick (2001) PBPK Model for Butadiene and Metabolites
Partition Coefficient
Butadiene Epoxybutene Butenediol Epoxybutane diol
Diepoxybutane
Blood:air 1.95 56.8 - - -
Liver:blood 0.595 0.984 1.04 0.903 1.41
Lung:blood 0.615 0.977 1.107 0.958 1.41
Kidney:blood 0.472 0.842 0.962 0.833 1.54
GI tract:blood 0.446 0.908 1.22 1.06 1.41
Viscera:blood 0.446 0.908 1.22 1.06 1.41
Fat 10.8 2.25 0.573 0.496 2.19
Muscle and Skin:blood
0.564 0.736 1.139 0.986 1.82
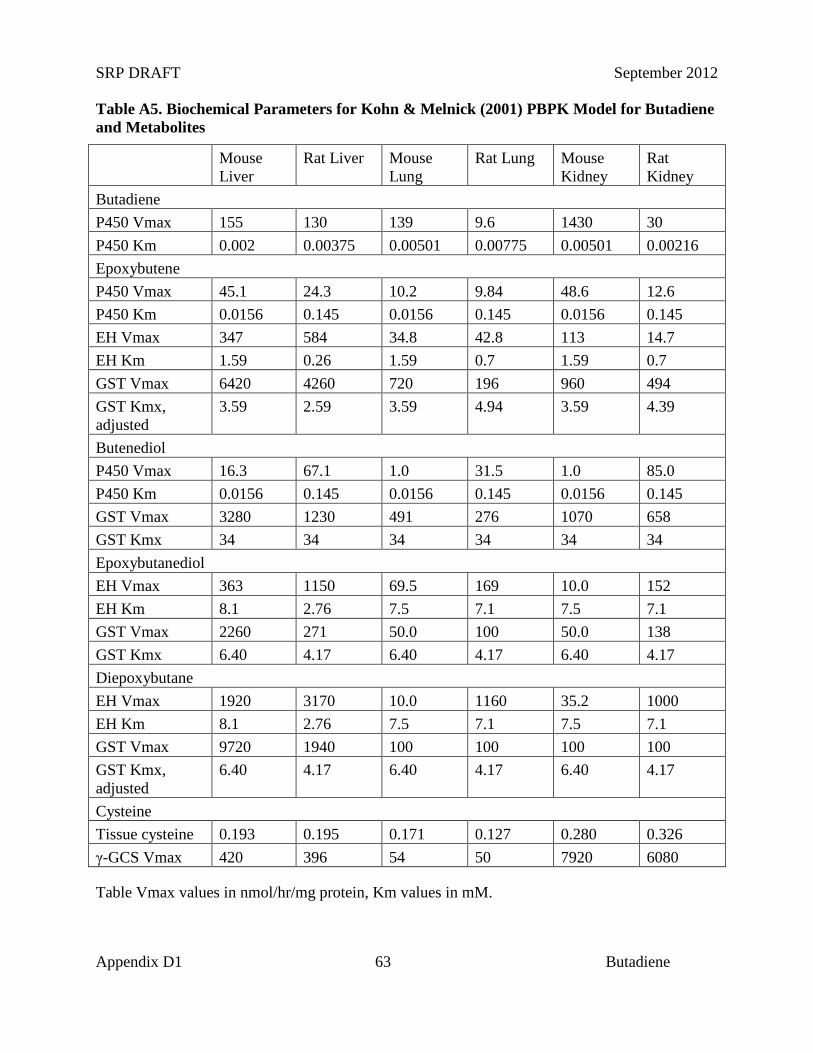
SRP DRAFT September 2012
Appendix D1 63 Butadiene
Table A5. Biochemical Parameters for Kohn & Melnick (2001) PBPK Model for Butadiene and Metabolites
Mouse Liver
Rat Liver Mouse Lung
Rat Lung Mouse Kidney
Rat Kidney
Butadiene P450 Vmax 155 130 139 9.6 1430 30 P450 Km 0.002 0.00375 0.00501 0.00775 0.00501 0.00216 Epoxybutene P450 Vmax 45.1 24.3 10.2 9.84 48.6 12.6 P450 Km 0.0156 0.145 0.0156 0.145 0.0156 0.145 EH Vmax 347 584 34.8 42.8 113 14.7 EH Km 1.59 0.26 1.59 0.7 1.59 0.7 GST Vmax 6420 4260 720 196 960 494 GST Kmx, adjusted
3.59 2.59 3.59 4.94 3.59 4.39
Butenediol P450 Vmax 16.3 67.1 1.0 31.5 1.0 85.0 P450 Km 0.0156 0.145 0.0156 0.145 0.0156 0.145 GST Vmax 3280 1230 491 276 1070 658 GST Kmx 34 34 34 34 34 34 Epoxybutanediol EH Vmax 363 1150 69.5 169 10.0 152 EH Km 8.1 2.76 7.5 7.1 7.5 7.1 GST Vmax 2260 271 50.0 100 50.0 138 GST Kmx 6.40 4.17 6.40 4.17 6.40 4.17 Diepoxybutane EH Vmax 1920 3170 10.0 1160 35.2 1000 EH Km 8.1 2.76 7.5 7.1 7.5 7.1 GST Vmax 9720 1940 100 100 100 100 GST Kmx, adjusted
6.40 4.17 6.40 4.17 6.40 4.17
Cysteine Tissue cysteine 0.193 0.195 0.171 0.127 0.280 0.326 γ-GCS Vmax 420 396 54 50 7920 6080
Table Vmax values in nmol/hr/mg protein, Km values in mM.
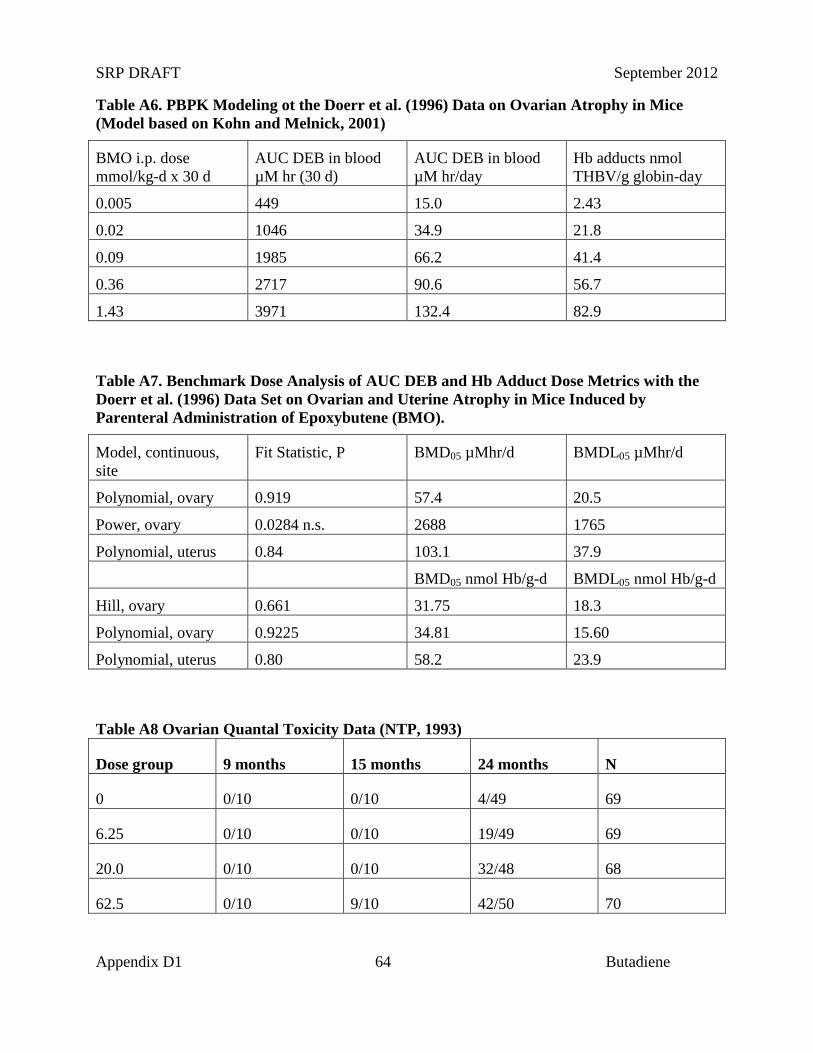
SRP DRAFT September 2012
Appendix D1 64 Butadiene
Table A6. PBPK Modeling ot the Doerr et al. (1996) Data on Ovarian Atrophy in Mice (Model based on Kohn and Melnick, 2001)
BMO i.p. dose mmol/kg-d x 30 d
AUC DEB in blood µM hr (30 d)
AUC DEB in blood µM hr/day
Hb adducts nmol THBV/g globin-day
0.005 449 15.0 2.43
0.02 1046 34.9 21.8
0.09 1985 66.2 41.4
0.36 2717 90.6 56.7
1.43 3971 132.4 82.9
Table A7. Benchmark Dose Analysis of AUC DEB and Hb Adduct Dose Metrics with the Doerr et al. (1996) Data Set on Ovarian and Uterine Atrophy in Mice Induced by Parenteral Administration of Epoxybutene (BMO).
Model, continuous, site
Fit Statistic, P BMD05 µMhr/d BMDL05 µMhr/d
Polynomial, ovary 0.919 57.4 20.5
Power, ovary 0.0284 n.s. 2688 1765
Polynomial, uterus 0.84 103.1 37.9
BMD05 nmol Hb/g-d BMDL05 nmol Hb/g-d
Hill, ovary 0.661 31.75 18.3
Polynomial, ovary 0.9225 34.81 15.60
Polynomial, uterus 0.80 58.2 23.9
Table A8 Ovarian Quantal Toxicity Data (NTP, 1993)
Dose group 9 months 15 months 24 months N
0 0/10 0/10 4/49 69
6.25 0/10 0/10 19/49 69
20.0 0/10 0/10 32/48 68
62.5 0/10 9/10 42/50 70
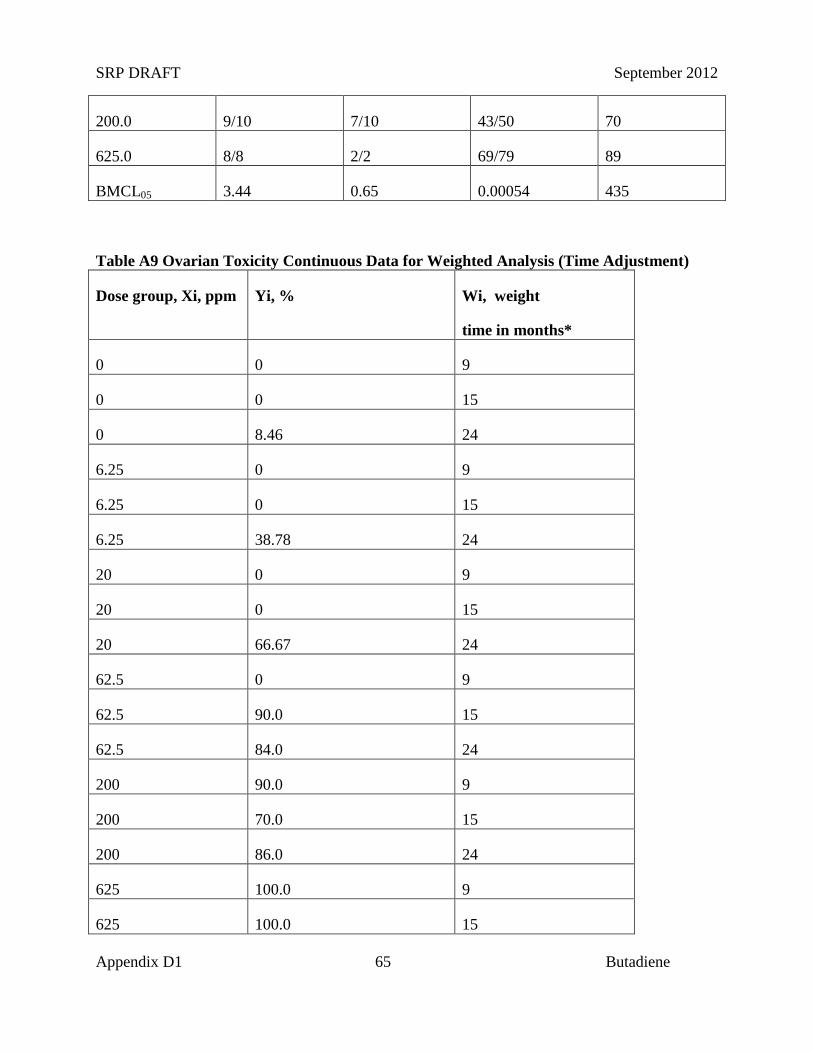
SRP DRAFT September 2012
Appendix D1 65 Butadiene
200.0 9/10 7/10 43/50 70
625.0 8/8 2/2 69/79 89
BMCL05 3.44 0.65 0.00054 435
Table A9 Ovarian Toxicity Continuous Data for Weighted Analysis (Time Adjustment)
Dose group, Xi, ppm Yi, % Wi, weight
time in months*
0 0 9
0 0 15
0 8.46 24
6.25 0 9
6.25 0 15
6.25 38.78 24
20 0 9
20 0 15
20 66.67 24
62.5 0 9
62.5 90.0 15
62.5 84.0 24
200 90.0 9
200 70.0 15
200 86.0 24
625 100.0 9
625 100.0 15
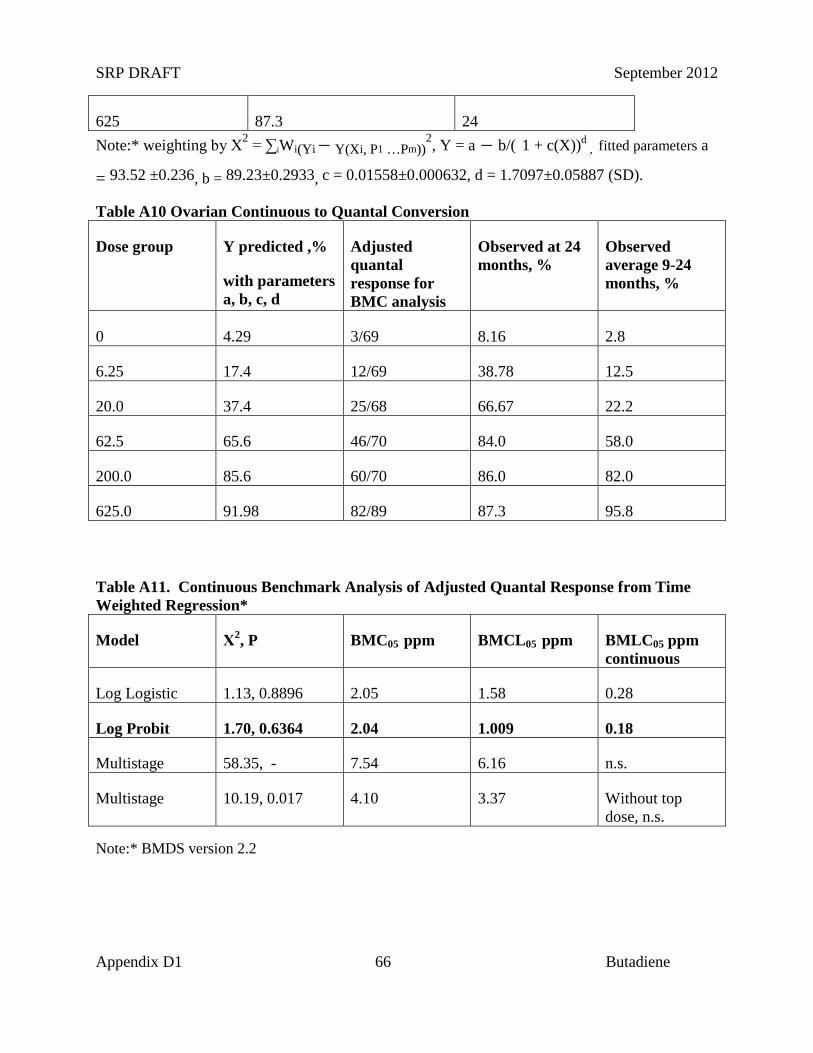
SRP DRAFT September 2012
Appendix D1 66 Butadiene
625 87.3 24 Note:* weighting by Χ2 = ∑iWi(Yi – Y(Xi, P1 …Pm))
2, Y = a – b/( 1 + c(X))d , fitted parameters a
= 93.52 ±0.236, b = 89.23±0.2933, c = 0.01558±0.000632, d = 1.7097±0.05887 (SD).
Table A10 Ovarian Continuous to Quantal Conversion
Dose group Y predicted ,%
with parameters a, b, c, d
Adjusted quantal response for BMC analysis
Observed at 24 months, %
Observed average 9-24 months, %
0 4.29 3/69 8.16 2.8
6.25 17.4 12/69 38.78 12.5
20.0 37.4 25/68 66.67 22.2
62.5 65.6 46/70 84.0 58.0
200.0 85.6 60/70 86.0 82.0
625.0 91.98 82/89 87.3 95.8
Table A11. Continuous Benchmark Analysis of Adjusted Quantal Response from Time Weighted Regression*
Model Χ2, P BMC05 ppm BMCL05 ppm BMLC05 ppm
continuous
Log Logistic 1.13, 0.8896 2.05 1.58 0.28
Log Probit 1.70, 0.6364 2.04 1.009 0.18
Multistage 58.35, - 7.54 6.16 n.s.
Multistage 10.19, 0.017 4.10 3.37 Without top dose, n.s.
Note:* BMDS version 2.2
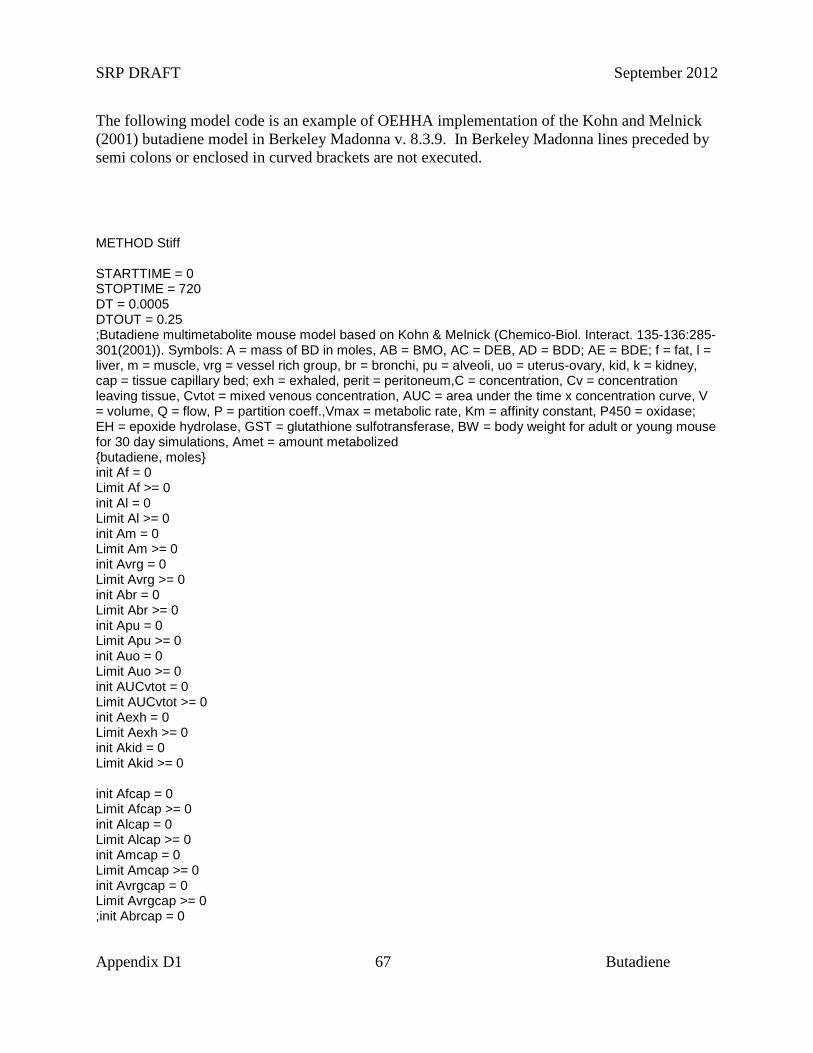
SRP DRAFT September 2012
Appendix D1 67 Butadiene
The following model code is an example of OEHHA implementation of the Kohn and Melnick (2001) butadiene model in Berkeley Madonna v. 8.3.9. In Berkeley Madonna lines preceded by semi colons or enclosed in curved brackets are not executed.
METHOD Stiff STARTTIME = 0 STOPTIME = 720 DT = 0.0005 DTOUT = 0.25 ;Butadiene multimetabolite mouse model based on Kohn & Melnick (Chemico-Biol. Interact. 135-136:285-301(2001)). Symbols: A = mass of BD in moles, AB = BMO, AC = DEB, AD = BDD; AE = BDE; f = fat, l = liver, m = muscle, vrg = vessel rich group, br = bronchi, pu = alveoli, uo = uterus-ovary, kid, k = kidney, cap = tissue capillary bed; exh = exhaled, perit = peritoneum,C = concentration, Cv = concentration leaving tissue, Cvtot = mixed venous concentration, AUC = area under the time x concentration curve, V = volume, Q = flow, P = partition coeff.,Vmax = metabolic rate, Km = affinity constant, P450 = oxidase; EH = epoxide hydrolase, GST = glutathione sulfotransferase, BW = body weight for adult or young mouse for 30 day simulations, Amet = amount metabolized {butadiene, moles} init Af = 0 Limit Af >= 0 init Al = 0 Limit Al >= 0 init Am = 0 Limit Am >= 0 init Avrg = 0 Limit Avrg >= 0 init Abr = 0 Limit Abr >= 0 init Apu = 0 Limit Apu >= 0 init Auo = 0 Limit Auo >= 0 init AUCvtot = 0 Limit AUCvtot >= 0 init Aexh = 0 Limit Aexh >= 0 init Akid = 0 Limit Akid >= 0 init Afcap = 0 Limit Afcap >= 0 init Alcap = 0 Limit Alcap >= 0 init Amcap = 0 Limit Amcap >= 0 init Avrgcap = 0 Limit Avrgcap >= 0 ;init Abrcap = 0

SRP DRAFT September 2012
Appendix D1 68 Butadiene
;init Apucap = 0 init Auocap = 0 Limit Auocap >= 0 init Akidcap = 0 Limit Akidcap >= 0 {butadienemonoxide moles} init ABperit = 0 init ABf = 0 Limit ABf >= 0 init ABl = 0 Limit ABl >= 0 init ABlfree = 0 init ABm = 0 Limit ABm >= 0 init ABvrg = 0 Limit ABvrg >= 0 init ABbr = 0 Limit ABbr >= 0 init ABbrfree = 0 init ABpu = 0 Limit ABpu >= 0 init ABpufree = 0 init ABuo = 0 Limit ABuo >= 0 init AUCBuo = 0 Limit AUCBuo >= 0 init AUCBvtot = 0 Limit AUCBvtot >= 0 init ABkid = 0 Limit ABkid >= 0 init ABkidfree = 0 init ABfcap = 0 Limit ABfcap >= 0 init ABlcap = 0 Limit ABlcap >= 0 init ABmcap = 0 Limit ABmcap >= 0 init ABvrgcap = 0 Limit ABvrgcap >= 0 ;init ABbrcap = 0 ;init ABpucap = 0 init ABuocap = 0 Limit ABuocap >= 0 init ABkidcap = 0 Limit ABkidcap >= 0 {diepoxybutane moles} init ACperit = 0 init ACf = 0 Limit ACf >= 0 init ACl = 0 Limit ACl >= 0
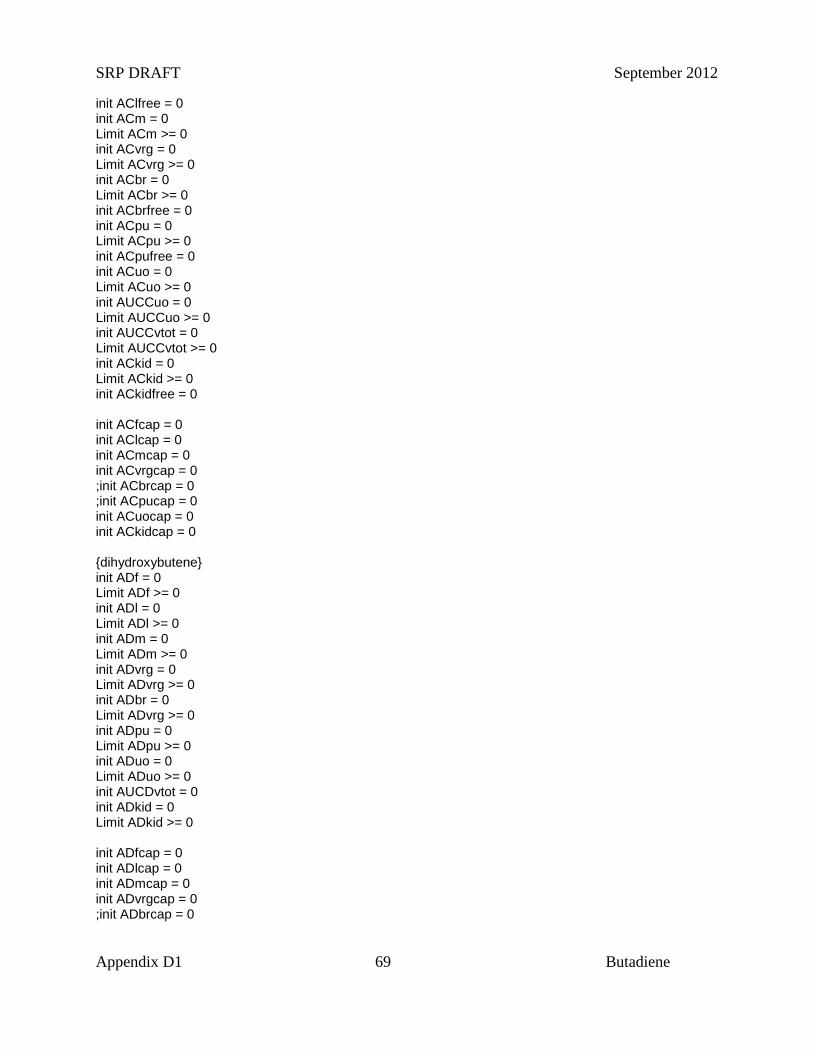
SRP DRAFT September 2012
Appendix D1 69 Butadiene
init AClfree = 0 init ACm = 0 Limit ACm >= 0 init ACvrg = 0 Limit ACvrg >= 0 init ACbr = 0 Limit ACbr >= 0 init ACbrfree = 0 init ACpu = 0 Limit ACpu >= 0 init ACpufree = 0 init ACuo = 0 Limit ACuo >= 0 init AUCCuo = 0 Limit AUCCuo >= 0 init AUCCvtot = 0 Limit AUCCvtot >= 0 init ACkid = 0 Limit ACkid >= 0 init ACkidfree = 0 init ACfcap = 0 init AClcap = 0 init ACmcap = 0 init ACvrgcap = 0 ;init ACbrcap = 0 ;init ACpucap = 0 init ACuocap = 0 init ACkidcap = 0 {dihydroxybutene} init ADf = 0 Limit ADf >= 0 init ADl = 0 Limit ADl >= 0 init ADm = 0 Limit ADm >= 0 init ADvrg = 0 Limit ADvrg >= 0 init ADbr = 0 Limit ADvrg >= 0 init ADpu = 0 Limit ADpu >= 0 init ADuo = 0 Limit ADuo >= 0 init AUCDvtot = 0 init ADkid = 0 Limit ADkid >= 0 init ADfcap = 0 init ADlcap = 0 init ADmcap = 0 init ADvrgcap = 0 ;init ADbrcap = 0
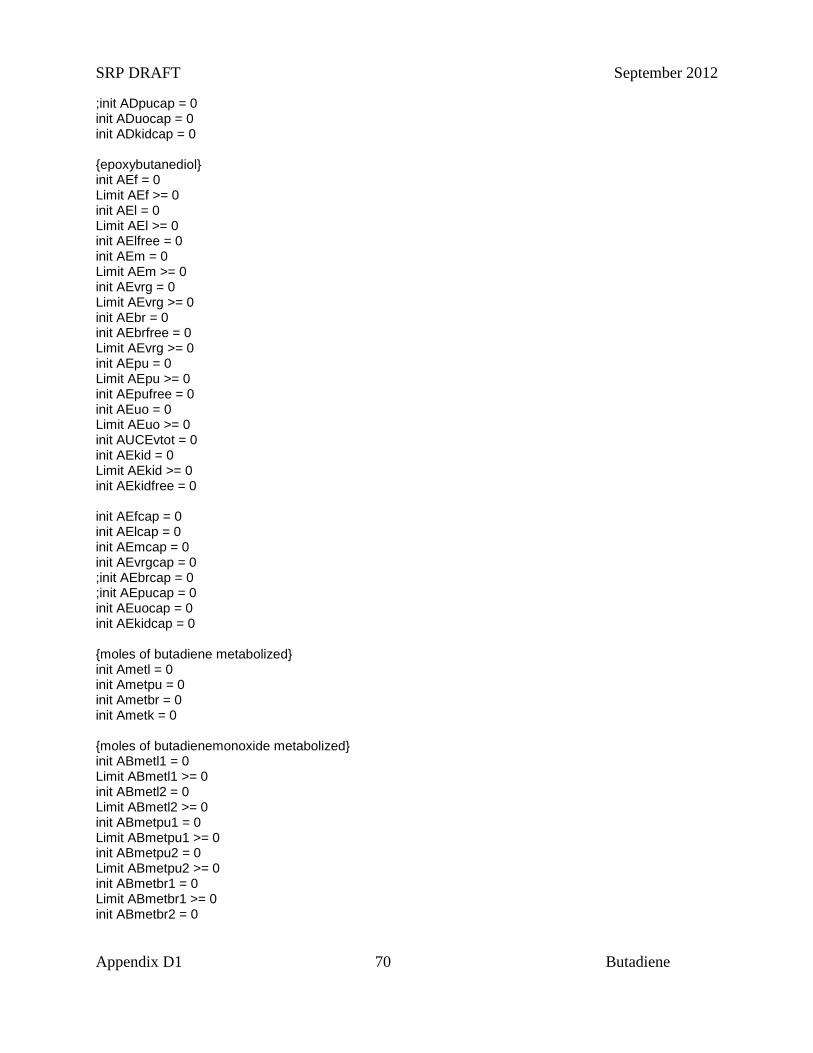
SRP DRAFT September 2012
Appendix D1 70 Butadiene
;init ADpucap = 0 init ADuocap = 0 init ADkidcap = 0 {epoxybutanediol} init AEf = 0 Limit AEf >= 0 init AEl = 0 Limit AEl >= 0 init AElfree = 0 init AEm = 0 Limit AEm >= 0 init AEvrg = 0 Limit AEvrg >= 0 init AEbr = 0 init AEbrfree = 0 Limit AEvrg >= 0 init AEpu = 0 Limit AEpu >= 0 init AEpufree = 0 init AEuo = 0 Limit AEuo >= 0 init AUCEvtot = 0 init AEkid = 0 Limit AEkid >= 0 init AEkidfree = 0 init AEfcap = 0 init AElcap = 0 init AEmcap = 0 init AEvrgcap = 0 ;init AEbrcap = 0 ;init AEpucap = 0 init AEuocap = 0 init AEkidcap = 0 {moles of butadiene metabolized} init Ametl = 0 init Ametpu = 0 init Ametbr = 0 init Ametk = 0 {moles of butadienemonoxide metabolized} init ABmetl1 = 0 Limit ABmetl1 >= 0 init ABmetl2 = 0 Limit ABmetl2 >= 0 init ABmetpu1 = 0 Limit ABmetpu1 >= 0 init ABmetpu2 = 0 Limit ABmetpu2 >= 0 init ABmetbr1 = 0 Limit ABmetbr1 >= 0 init ABmetbr2 = 0
SRP DRAFT September 2012
Appendix D1 71 Butadiene
Limit ABmetbr2 >= 0 init ABmetl3 = 0 Limit ABmetl3 >= 0 init ABmetpu3 = 0 Limit ABmetpu3 >= 0 init ABmetbr3 = 0 Limit ABmetbr3 >= 0 {moles of dihydroxybutene metabolized} init ADmetpu6 = 0 init ADmetbr6 = 0 init ADmetl6 = 0 {moles of diepoxybutane metabolized} init ACmetpu4 = 0 init ACmetbr4 = 0 init ACmetl4 = 0 {Cysteine metabolism, moles, mol/L} init AFl = Ccysl*Vl init AFlu = Ccyslu*Vlu init AFkid = Ccyskid*Vkid Ccysl = 1.93E-4 Ccyslu = 1.71E-4 Ccyskid = 2.8E-4 Vmax10lC = 420E-9 Vmax10l = Vmax10lC*CPL*Vl Vmax10luC = 54E-9 Vmax10lu = Vmax10luC*CPLu*Vlu Vmax10kidC = 7920E-9 Vmax10kid = Vmax10kidC*CPLu*Vkid Kmcys = 3.5E-4 KI = 2.3E-3 Kl0 = 1.5*Vl Klu0 = 1.5*Vlu Kkid0 = 1.5*Vkid {Glutathione metabolism, moles, mol/L} init AGl = CGSHl*Vl Limit AGl >= 0 init AGlu = CGSHlu*Vlu Limit AGlu >= 0 init AGkid = CGSHkid*Vkid Limit AGkid >= 0 CGSHl = 5E-3 CGSHlu = 1E-3 CGSHkid = 2E-3 CGl = AGl/Vl Limit CGl >= 0 CGlu = AGlu/Vlu Limit CGlu >= 0 CGkid = AGkid/Vkid Limit CGkid >= 0 Ka = 3E-3
SRP DRAFT September 2012
Appendix D1 72 Butadiene
{Adduct formation} init Adduct = 0 {tissue flows L/hr} Qtot = 15.3*BW^0.7 Qalv = 20.2*BW^0.7 Qf = 0.05*Qtot Ql = 0.044*Qtot Qkid = 0.163*Qtot Qm = Qtot - (Qf + Ql + Qvrg + Quo + Qkid) Qvrg = 0.389*Qtot Qpu = 0.928*Qtot Qbr = 0.072*Qtot Quo = 0.016*Qtot {tissue volumes, L} Vf = 0.06*BW Vl = 0.055*BW Vkid = 0.0167*BW Vm = BW - (Vf + Vl + Vvrg + Vlu + Vuo + Vkid) Vvrg = 0.1143*BW Vlu = 0.011*BW Vpu = 0.454*Vlu Vbr = 0.545*Vlu Vuo = 0.001*BW ;BW = 0.030 BW = 0.01263 + 3.69E-4*(T/24) - 5.59E-6*(T/24)^2 {capillary blood volumes, L} Vfcap = 0.03*Vf Vlcap = 0.11*Vl ;Vbrcap = 0.11*Vbr ;Vpucap = 0.11*Vpu Vkidcap = 0.102*Vkid Vvrgcap = 0.071*Vvrg Vuocap = 0.071*Vuo Vmcap = 0.013*Vm {blood/air and tissue/blood partition coefficients, butadiene} Pb = 1.95 Pl = 0.595 Pf = 10.8 Pkid = 0.472 Pm = 0.564 Pvrg = 0.472 Ppu = 0.615 Pbr = 0.615 Puo = 0.446 Pibd = 1.183 {blood/air and tissue/blood partition coefficients, butadienemonoxide} PBb = 56.8 PBl = 0.984
SRP DRAFT September 2012
Appendix D1 73 Butadiene
PBkid = 0.842 PBf = 2.25 PBm = 0.736 PBvrg = 0.842 PBpu = 0.977 PBbr = 0.977 PBuo = 0.908 Pibmo = 2.125 {blood/air and tissue/blood partition coefficients, diepoxybutane} PCl = 4.41 PCkid = 1.54 PCf = 2.19 PCm = 1.82 PCvrg = 1.54 PCpu = 1.41 PCbr = 1.41 PCuo = 1.41 Pideb = 1.174 {blood/air and tissue/blood partition coefficients, dihydroxybutene} PDl = 1.04 PDkid = 0.833 PDf = 0.573 PDm = 1.139 PDvrg = 0.962 PDpu = 1.107 PDbr = 1.107 PDuo = 1.22 Pidhb = 1.198 {blood/air and tissue/blood partition coefficients, epoxybutanediol} PEl = 0.903 PEkid = 1.06 PEf = 0.496 PEm = 0.986 PEvrg = 1.06 PEpu = 0.833 PEbr = 0.833 PEuo = 1.06 Piebd = 1.237 {butadiene oxidation metabolic parameters, mol/hr, mol/L} Vmaxlu = 139E-9*9.0E3*Vlu Vmaxbr = 0.50*Vmaxlu Vmaxpu = 0.50*Vmaxlu Kmlu = 5.01E-6 Vmaxl = 155.0E-9*30.0E3*Vl Km = 2.0E-6 VmaxkC = 1430E-9 Vmaxk = VmaxkC*Vkid*30.0E3 Kmk = Kmlu MPL = 3.0E4 MPLu = 9.0E3

SRP DRAFT September 2012
Appendix D1 74 Butadiene
{butadienemonoxide metabolic parameters, mol/hr, mol/L, /hr; 1 = hydrolysis EH, 2 = conjugation GST, 3 = oxidation P450} ;EH Vmaxl1 = 347.0E-9*30.0E3*Vl Km1 = 1.59E-3 Vmaxlu1C = 34.8E-9 Vmaxbr1 = Vmaxlu1C*Vbr*9.0E3 Vmaxpu1 = Vmaxlu1C*Vpu*9.0E3 Kmlu1 = 1.59E-3 Vmaxk1C = 113E-9 Vmaxk1 = Vmaxk1C*Vkid*9.0E3 Kmk1 = Kmlu1 krel = 3.76 R = 0.052 ;GST Vmaxl2C = 6420E-9 Vmaxl2 = Vmaxl2C*Vl*8.28E4 Km2 =3.59E-3 Vmaxlu2C = 720.0E-9 Vmaxbr2 = Vmaxlu2C*Vbr*8.28E4 Vmaxpu2 = Vmaxlu2C*Vpu*8.28E4 Kmlu2 = 3.59E-3 Vmaxk2C = 960.0E-9 Vmaxk2 = Vmaxk2C*Vkid*8.28E4 Kmk2 = 3.59E-3 CPL = 8.28E4 CPLu = 8.28E4 Kmgsh = 1.0E-3 ;P450 Vmaxl3 = 45.1E-9*30.0E3*Vl Vmaxlu3C = 10.2E-9 Vmaxpu3 = Vmaxlu3C*Vpu*9.0E3 Vmaxbr3 = Vmaxlu3C*Vbr*9.0E3 Km3 = 1.56E-5 Kmlu3 = Km3 Kmk3 = Km3 Vmaxk3C = 48.6E-9 Vmaxk3 = Vmaxk3C*Vkid*9.0E3 {Diepoxybutane (DEB) metabolic parameters, 4 = EH, 5 = GST, mol/hr, mol/L} Vmaxl4C = 1920E-9 Vmaxl4 = Vmaxl4C*Vl*30E3 Km4 = 8.1E-3 Vmaxlu4C = 10E-9 Vmaxbr4 = Vmaxlu4C*Vbr*9.0E3 Vmaxpu4 = Vmaxlu4C*Vpu*9.0E3 Kmlu4 = 7.5E-3 Vmaxk4C = 35.2E-9 Vmaxk4 = Vmaxk4C*Vkid*9.0E3 Kmk4 = Kmlu4 k4rel = 9.75
SRP DRAFT September 2012
Appendix D1 75 Butadiene
Vmaxl5C = 9720E-9 Vmaxl5 = Vmaxl5C*Vl*CPL Km5 = 6.4E-3 Vmaxlu5C = 100E-9 Vmaxbr5 = Vmaxlu5C*Vbr*CPlu Vmaxpu5 = Vmaxlu5C*Vpu*CPlu Vmaxk5C = 100E-9 Vmaxk5 = Vmaxk5C*Vkid*CPlu {Dihydroxybutene (DHB) metabolic parameters, 6 = P450, 7 = GST, mnol/hr, mol/L} Vmaxl6C = 16.3E-9 Vmaxl6 = Vmaxl6C*Vl*30E3 Km6 = 1.56E-5 Vmaxlu6C = 1.0E-9 Vmaxbr6 = Vmaxlu6C*Vbr*9.0E3 Vmaxpu6 = Vmaxlu6C*Vpu*9.0E3 Vmaxk6C = 1.0E-9 Vmaxk6 = Vmaxk6C*Vkid*9.0E3 Vmaxl7C = 3480E-9 Vmaxl7 = Vmaxl7C*Vl*CPL Km7 = 34E-3 Vmaxlu7C = 491E-9 Vmaxbr7 = Vmaxlu7C*Vbr*CPlu Vmaxpu7 = Vmaxlu7C*Vpu*CPlu Vmaxk7C = 1070E-9 Vmaxk7 = Vmaxk7C*Vkid*CPlu {Epoxybutanediol metabolic parameters 8 = EH, 9 = GST} Vmaxl8C = 363E-9 Vmaxl8 = Vmaxl8C*Vl*30E3 Km8 = 8.1E-3 Vmaxlu8C = 69.5E-9 Vmaxbr8 = Vmaxlu8C*Vbr*9.0E3 Vmaxpu8 = Vmaxlu8C*Vpu*9.0E3 Kmlu8 = 7.5E-3 Vmaxk8C = 10E-9 Vmaxk8 = Vmaxk8C*Vkid*9.0E3 Kmk8 = Kmlu8 k8rel = 50.6 Vmaxl9C = 2260E-9 Vmaxl9 = Vmaxl9C*Vl*CPL Km9 = 6.4E-3 Vmaxlu9C = 50E-9 Vmaxbr9 = Vmaxlu9C*Vbr*CPlu Vmaxpu9 = Vmaxlu9C*Vpu*CPlu Vmaxk9C = 50E-9 Vmaxk9 = Vmaxk9C*Vkid*CPlu Kadduct = 1E-4 Kip = 1.25
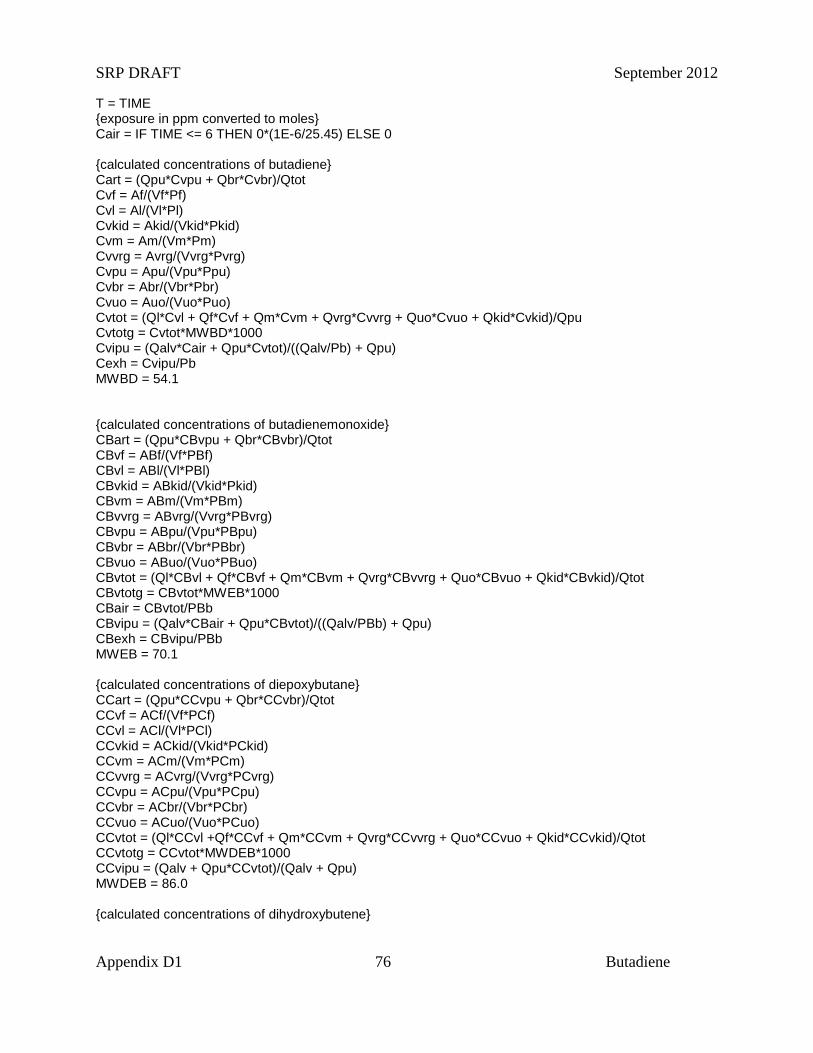
SRP DRAFT September 2012
Appendix D1 76 Butadiene
T = TIME {exposure in ppm converted to moles} Cair = IF TIME <= 6 THEN 0*(1E-6/25.45) ELSE 0 {calculated concentrations of butadiene} Cart = (Qpu*Cvpu + Qbr*Cvbr)/Qtot Cvf = Af/(Vf*Pf) Cvl = Al/(Vl*Pl) Cvkid = Akid/(Vkid*Pkid) Cvm = Am/(Vm*Pm) Cvvrg = Avrg/(Vvrg*Pvrg) Cvpu = Apu/(Vpu*Ppu) Cvbr = Abr/(Vbr*Pbr) Cvuo = Auo/(Vuo*Puo) Cvtot = (Ql*Cvl + Qf*Cvf + Qm*Cvm + Qvrg*Cvvrg + Quo*Cvuo + Qkid*Cvkid)/Qpu Cvtotg = Cvtot*MWBD*1000 Cvipu = (Qalv*Cair + Qpu*Cvtot)/((Qalv/Pb) + Qpu) Cexh = Cvipu/Pb MWBD = 54.1 {calculated concentrations of butadienemonoxide} CBart = (Qpu*CBvpu + Qbr*CBvbr)/Qtot CBvf = ABf/(Vf*PBf) CBvl = ABl/(Vl*PBl) CBvkid = ABkid/(Vkid*Pkid) CBvm = ABm/(Vm*PBm) CBvvrg = ABvrg/(Vvrg*PBvrg) CBvpu = ABpu/(Vpu*PBpu) CBvbr = ABbr/(Vbr*PBbr) CBvuo = ABuo/(Vuo*PBuo) CBvtot = (Ql*CBvl + Qf*CBvf + Qm*CBvm + Qvrg*CBvvrg + Quo*CBvuo + Qkid*CBvkid)/Qtot CBvtotg = CBvtot*MWEB*1000 CBair = CBvtot/PBb CBvipu = (Qalv*CBair + Qpu*CBvtot)/((Qalv/PBb) + Qpu) CBexh = CBvipu/PBb MWEB = 70.1 {calculated concentrations of diepoxybutane} CCart = (Qpu*CCvpu + Qbr*CCvbr)/Qtot CCvf = ACf/(Vf*PCf) CCvl = ACl/(Vl*PCl) CCvkid = ACkid/(Vkid*PCkid) CCvm = ACm/(Vm*PCm) CCvvrg = ACvrg/(Vvrg*PCvrg) CCvpu = ACpu/(Vpu*PCpu) CCvbr = ACbr/(Vbr*PCbr) CCvuo = ACuo/(Vuo*PCuo) CCvtot = (Ql*CCvl +Qf*CCvf + Qm*CCvm + Qvrg*CCvvrg + Quo*CCvuo + Qkid*CCvkid)/Qtot CCvtotg = CCvtot*MWDEB*1000 CCvipu = (Qalv + Qpu*CCvtot)/(Qalv + Qpu) MWDEB = 86.0 {calculated concentrations of dihydroxybutene}
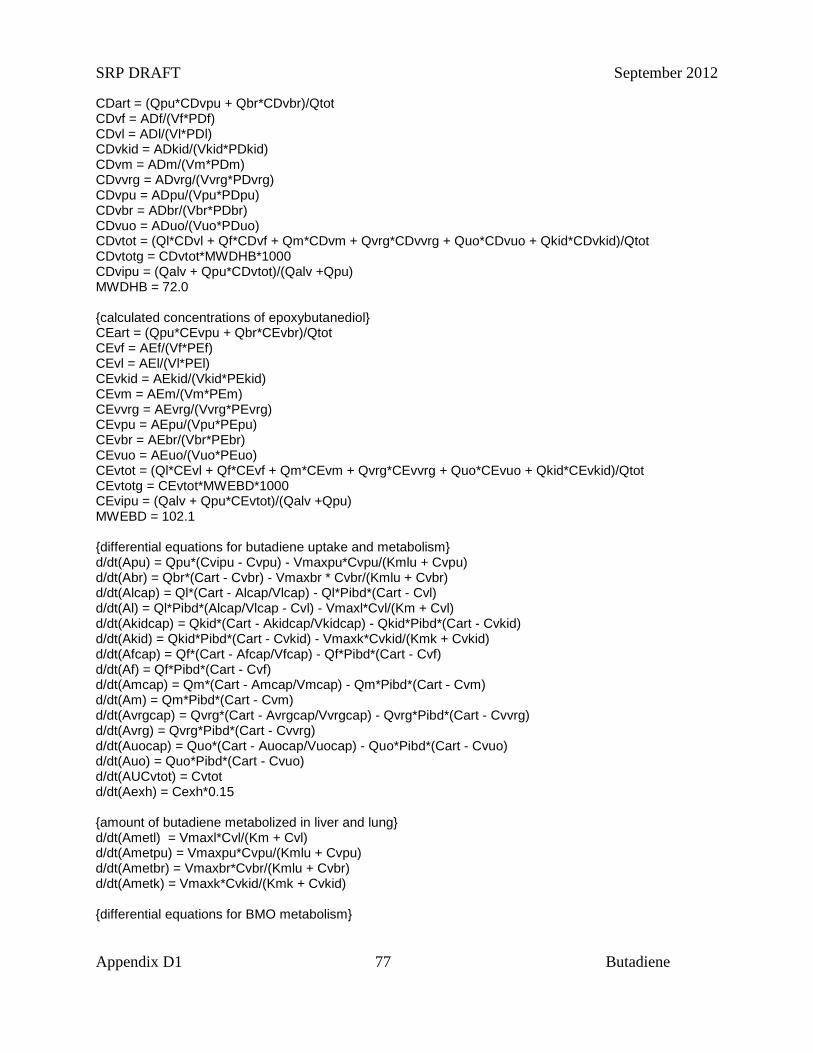
SRP DRAFT September 2012
Appendix D1 77 Butadiene
CDart = (Qpu*CDvpu + Qbr*CDvbr)/Qtot CDvf = ADf/(Vf*PDf) CDvl = ADl/(Vl*PDl) CDvkid = ADkid/(Vkid*PDkid) CDvm = ADm/(Vm*PDm) CDvvrg = ADvrg/(Vvrg*PDvrg) CDvpu = ADpu/(Vpu*PDpu) CDvbr = ADbr/(Vbr*PDbr) CDvuo = ADuo/(Vuo*PDuo) CDvtot = (Ql*CDvl + Qf*CDvf + Qm*CDvm + Qvrg*CDvvrg + Quo*CDvuo + Qkid*CDvkid)/Qtot CDvtotg = CDvtot*MWDHB*1000 CDvipu = (Qalv + Qpu*CDvtot)/(Qalv +Qpu) MWDHB = 72.0 {calculated concentrations of epoxybutanediol} CEart = (Qpu*CEvpu + Qbr*CEvbr)/Qtot CEvf = AEf/(Vf*PEf) CEvl = AEl/(Vl*PEl) CEvkid = AEkid/(Vkid*PEkid) CEvm = AEm/(Vm*PEm) CEvvrg = AEvrg/(Vvrg*PEvrg) CEvpu = AEpu/(Vpu*PEpu) CEvbr = AEbr/(Vbr*PEbr) CEvuo = AEuo/(Vuo*PEuo) CEvtot = (Ql*CEvl + Qf*CEvf + Qm*CEvm + Qvrg*CEvvrg + Quo*CEvuo + Qkid*CEvkid)/Qtot CEvtotg = CEvtot*MWEBD*1000 CEvipu = (Qalv + Qpu*CEvtot)/(Qalv +Qpu) MWEBD = 102.1 {differential equations for butadiene uptake and metabolism} d/dt(Apu) = Qpu*(Cvipu - Cvpu) - Vmaxpu*Cvpu/(Kmlu + Cvpu) d/dt(Abr) = Qbr*(Cart - Cvbr) - Vmaxbr * Cvbr/(Kmlu + Cvbr) d/dt(Alcap) = Ql*(Cart - Alcap/Vlcap) - Ql*Pibd*(Cart - Cvl) d/dt(Al) = Ql*Pibd*(Alcap/Vlcap - Cvl) - Vmaxl*Cvl/(Km + Cvl) d/dt(Akidcap) = Qkid*(Cart - Akidcap/Vkidcap) - Qkid*Pibd*(Cart - Cvkid) d/dt(Akid) = Qkid*Pibd*(Cart - Cvkid) - Vmaxk*Cvkid/(Kmk + Cvkid) d/dt(Afcap) = Qf*(Cart - Afcap/Vfcap) - Qf*Pibd*(Cart - Cvf) d/dt(Af) = Qf*Pibd*(Cart - Cvf) d/dt(Amcap) = Qm*(Cart - Amcap/Vmcap) - Qm*Pibd*(Cart - Cvm) d/dt(Am) = Qm*Pibd*(Cart - Cvm) d/dt(Avrgcap) = Qvrg*(Cart - Avrgcap/Vvrgcap) - Qvrg*Pibd*(Cart - Cvvrg) d/dt(Avrg) = Qvrg*Pibd*(Cart - Cvvrg) d/dt(Auocap) = Quo*(Cart - Auocap/Vuocap) - Quo*Pibd*(Cart - Cvuo) d/dt(Auo) = Quo*Pibd*(Cart - Cvuo) d/dt(AUCvtot) = Cvtot d/dt(Aexh) = Cexh*0.15 {amount of butadiene metabolized in liver and lung} d/dt(Ametl) = Vmaxl*Cvl/(Km + Cvl) d/dt(Ametpu) = Vmaxpu*Cvpu/(Kmlu + Cvpu) d/dt(Ametbr) = Vmaxbr*Cvbr/(Kmlu + Cvbr) d/dt(Ametk) = Vmaxk*Cvkid/(Kmk + Cvkid) {differential equations for BMO metabolism}
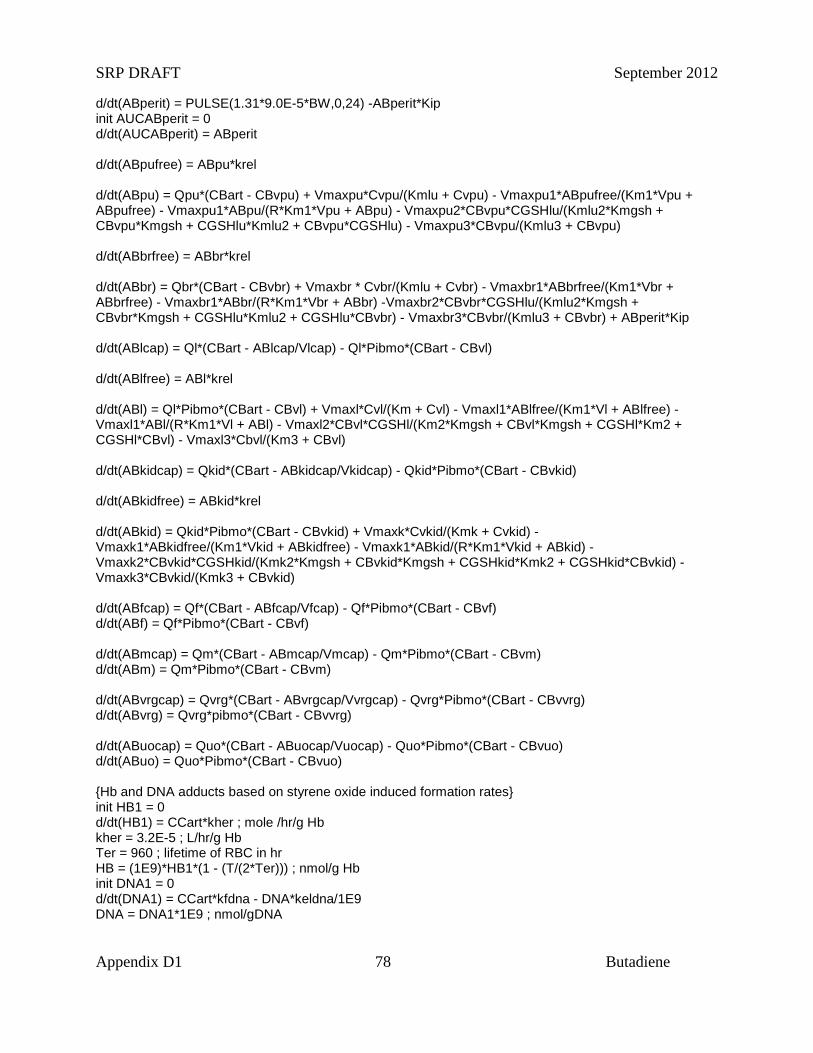
SRP DRAFT September 2012
Appendix D1 78 Butadiene
d/dt(ABperit) = PULSE(1.31*9.0E-5*BW,0,24) -ABperit*Kip init AUCABperit = 0 d/dt(AUCABperit) = ABperit d/dt(ABpufree) = ABpu*krel d/dt(ABpu) = Qpu*(CBart - CBvpu) + Vmaxpu*Cvpu/(Kmlu + Cvpu) - Vmaxpu1*ABpufree/(Km1*Vpu + ABpufree) - Vmaxpu1*ABpu/(R*Km1*Vpu + ABpu) - Vmaxpu2*CBvpu*CGSHlu/(Kmlu2*Kmgsh + CBvpu*Kmgsh + CGSHlu*Kmlu2 + CBvpu*CGSHlu) - Vmaxpu3*CBvpu/(Kmlu3 + CBvpu) d/dt(ABbrfree) = ABbr*krel d/dt(ABbr) = Qbr*(CBart - CBvbr) + Vmaxbr * Cvbr/(Kmlu + Cvbr) - Vmaxbr1*ABbrfree/(Km1*Vbr + ABbrfree) - Vmaxbr1*ABbr/(R*Km1*Vbr + ABbr) -Vmaxbr2*CBvbr*CGSHlu/(Kmlu2*Kmgsh + CBvbr*Kmgsh + CGSHlu*Kmlu2 + CGSHlu*CBvbr) - Vmaxbr3*CBvbr/(Kmlu3 + CBvbr) + ABperit*Kip d/dt(ABlcap) = Ql*(CBart - ABlcap/Vlcap) - Ql*Pibmo*(CBart - CBvl) d/dt(ABlfree) = ABl*krel d/dt(ABl) = Ql*Pibmo*(CBart - CBvl) + Vmaxl*Cvl/(Km + Cvl) - Vmaxl1*ABlfree/(Km1*Vl + ABlfree) - Vmaxl1*ABl/(R*Km1*Vl + ABl) - Vmaxl2*CBvl*CGSHl/(Km2*Kmgsh + CBvl*Kmgsh + CGSHl*Km2 + CGSHl*CBvl) - Vmaxl3*Cbvl/(Km3 + CBvl) d/dt(ABkidcap) = Qkid*(CBart - ABkidcap/Vkidcap) - Qkid*Pibmo*(CBart - CBvkid) d/dt(ABkidfree) = ABkid*krel d/dt(ABkid) = Qkid*Pibmo*(CBart - CBvkid) + Vmaxk*Cvkid/(Kmk + Cvkid) - Vmaxk1*ABkidfree/(Km1*Vkid + ABkidfree) - Vmaxk1*ABkid/(R*Km1*Vkid + ABkid) - Vmaxk2*CBvkid*CGSHkid/(Kmk2*Kmgsh + CBvkid*Kmgsh + CGSHkid*Kmk2 + CGSHkid*CBvkid) - Vmaxk3*CBvkid/(Kmk3 + CBvkid) d/dt(ABfcap) = Qf*(CBart - ABfcap/Vfcap) - Qf*Pibmo*(CBart - CBvf) d/dt(ABf) = Qf*Pibmo*(CBart - CBvf) d/dt(ABmcap) = Qm*(CBart - ABmcap/Vmcap) - Qm*Pibmo*(CBart - CBvm) d/dt(ABm) = Qm*Pibmo*(CBart - CBvm) d/dt(ABvrgcap) = Qvrg*(CBart - ABvrgcap/Vvrgcap) - Qvrg*Pibmo*(CBart - CBvvrg) d/dt(ABvrg) = Qvrg*pibmo*(CBart - CBvvrg) d/dt(ABuocap) = Quo*(CBart - ABuocap/Vuocap) - Quo*Pibmo*(CBart - CBvuo) d/dt(ABuo) = Quo*Pibmo*(CBart - CBvuo) {Hb and DNA adducts based on styrene oxide induced formation rates} init HB1 = 0 d/dt(HB1) = CCart*kher ; mole /hr/g Hb kher = 3.2E-5 ; L/hr/g Hb Ter = 960 ; lifetime of RBC in hr HB = (1E9)*HB1*(1 - (T/(2*Ter))) ; nmol/g Hb init DNA1 = 0 d/dt(DNA1) = CCart*kfdna - DNA*keldna/1E9 DNA = DNA1*1E9 ; nmol/gDNA

SRP DRAFT September 2012
Appendix D1 79 Butadiene
kfdna = 9.6E-5 ; N7 DNA adducts/gDNA/hr keldna = 0.0077 ; elimination of DNA adducts /hr {AUCs for butadienemonoxide} d/dt(AUCBuo) = CBvuo d/dt(AUCBvtot) = CBvtot {amounts of butadienemonoxide metabolized} d/dt(ABmetl1) = Vmaxl1*ABlfree/(Km1*Vl + ABlfree) + Vmaxl1*ABl/(R*Km1*Vl + ABl) d/dt(ABmetl2) = Vmaxl2*CBvl*CGSHl/(Km2*Kmgsh + CBvl*Kmgsh + CGSHl*Km2 + CGSHl*CBvl) d/dt(ABmetpu1) = Vmaxpu1*ABpufree/(Km1*Vpu + ABpufree) + Vmaxpu1*ABpu/(R*Km1*Vpu + ABpu) d/dt(ABmetpu2) = Vmaxpu2*CBvpu*CGSHlu/(Km2*Kmgsh + CBvpu*Kmgsh + CGSHlu*Km2 + CGSHlu*CBvpu) d/dt(ABmetbr1) = Vmaxbr1*ABbrfree/(Km1*Vbr + ABbrfree) + Vmaxbr1*ABbr/(R*Km1*Vbr + ABbr) d/dt(ABmetbr2) = Vmaxbr2*CBvbr*CGSHlu/(Km2*Kmgsh + CBvbr*Kmgsh + CGSHlu*Km2 + CGSHlu*CBvbr) d/dt(ABmetl3) = Vmaxl3*CBvl/(Km3 + CBvl) d/dt(ABmetpu3) = Vmaxpu3*CBvpu/(Km3 + CBVpu) d/dt(ABmetbr3) = Vmaxbr3*CBvbr/(Km3 + CBvbr) init ABmetk1 = 0 init ABmetk2 = 0 init ABmetk3 = 0 d/dt(ABmetk1) = Vmaxk1*ABkidfree/(Km1*Vkid + ABkidfree) + Vmaxk1*ABkid/(R*Km1*Vkid + ABkid) d/dt(ABmetk2) = Vmaxk2*CBvkid*CGSHkid/(Km2*Kmgsh + CBvkid*Kmgsh + CGSHkid*Km2 + CGSHkid*CBvkid) d/dt(ABmetk3) = Vmaxk3*CBvkid/(Km3 + CBvkid) {differential equations for diepoxybutane} d/dt(ACperit) = PULSE(0*BW,0,24) -ACperit*Kip d/dt(ACpufree) = ACpu*k4rel d/dt(ACpu) = Qpu*(CCart - CCvpu) + Vmaxpu3*CBvpu/(Km3 + CBvpu) - Vmaxpu4*ACpufree/(Kmlu4*Vpu + ACpufree) - Vmaxpu4*ACpu/(R*Kmlu4*Vpu + ACpu) - Vmaxpu5*CCvpu*CGSHlu/(Km5*Kmgsh + CCvpu*Kmgsh + CGSHlu*Km5 + CGSHlu*CCvpu) d/dt(ACbrfree) = ACbr*k4rel d/dt(ACbr) = Qbr*(CCart - CCvbr) + Vmaxbr3*CBvbr/(Km3 + CBvbr) - Vmaxbr4*ACbrfree/(Kmlu4*Vbr + ACbrfree) - Vmaxbr4*ACbr/(R*Kmlu4*Vbr + ACbr) - Vmaxbr5*CCvbr*CGSHlu/(Km5*Kmgsh + CCvbr*Kmgsh + CGSHlu*Km5 + CGSHlu*CCvbr) + ACperit*Kip d/dt(AClfree) = ACl*k4rel d/dt(AClcap) = Ql*(CCart - AClcap/Vlcap) - Ql*Pideb*(CCart - CCvl) d/dt(ACl) = Ql*Pideb*(CCart - CCvl) + Vmaxl3*CBvl/(Km3 + CBvl) - Vmaxl4*AClfree/(Km4*Vl + AClfree) - Vmaxl4*ACl/(R*Km4*Vl + ACl) - Vmaxl5*CCvl*CGSHl/(Km5*Kmgsh + CCvl*Kmgsh + CGSHl*Km5 + CGSHl*CCvl)

SRP DRAFT September 2012
Appendix D1 80 Butadiene
d/dt(ACkidfree) = ACkid*k4rel d/dt(ACkidcap) = Qkid*(CCart - ACkidcap/Vlcap) - Ql*Pideb*(CCart - CCvkid) d/dt(ACkid) = Qkid*Pideb*(CCart - CCvkid) + Vmaxk3*CBvkid/(Km3 + CBvkid) - Vmaxk4*ACkidfree/(Kmlu4*Vkid + ACkidfree) - Vmaxk4*ACkid/(R*Kmlu4*Vkid + ACkid) - Vmaxk5*CCvkid*CGSHkid/(Km5*Kmgsh + CCvkid*Kmgsh + CGSHkid*Km5 + CGSHkid*CCvkid) d/dt(ACfcap) = Qf*(CCart - ACfcap/Vfcap) - Qf*Pideb*(CCart - CCvf) d/dt(ACf) = Qf*Pideb*(CCart - CCvf) d/dt(ACmcap) = Qm*(CCart - ACmcap/Vmcap) - Qm*Pideb*(CCart - CCvm) d/dt(ACm) = Qm*Pideb*(CCart - CCvm) d/dt(ACvrgcap) = Qvrg*(CCart - ACvrgcap/Vvrgcap) - Qvrg*Pideb*(CCart - CCvvrg) d/dt(ACvrg) = Qvrg*Pideb*(CCart - CCvvrg) d/dt(ACuocap) = Quo*(CCart - ACuocap/Vuocap) - Quo*Pideb*(CCart - CCvuo) d/dt(ACuo) = Quo*Pideb*(CCart - CCvuo) {metabolism of diepoxybutane to epoxybutanediol} d/dt(ACmetpu4) = Vmaxpu4*ACpufree/(Kmlu4*Vpu + ACpufree) + Vmaxpu4*ACpu/(R*Kmlu4*Vpu + ACpu) d/dt(ACmetbr4) = Vmaxbr4*ACbrfree/(Kmlu4*Vbr + ACbrfree) + Vmaxbr4*ACbr/(R*Kmlu4*Vbr + ACbr) d/dt(ACmetl4) = Vmaxl4*AClfree/(Km4*Vl + AClfree) + Vmaxl4*ACl/(R*Km4*Vl + ACl) init ACmetk4 = 0 d/dt(ACmetk4) = Vmaxk4*ACkidfree/(Kmlu4*Vkid + ACkidfree) + Vmaxk4*ACkid/(R*Kmlu4*Vkid + ACkid) {AUCs for diepoxybutane} d/dt(AUCCuo) = CCvuo d/dt(AUCCvtot) = CCvtot {metabolism of diepoxybutane to DEB-SG} init ACmetpu5 = 0 init ACmetbr5 = 0 init ACmetl5 = 0 Limit ACmetl5 >= 0 init ACmetk5 = 0 d/dt(ACmetpu5) = Vmaxpu5*CCvpu*CGSHlu/(Km5*Kmgsh + CCvpu*Kmgsh + CGSHlu*Km5 + CGSHlu*CCvpu) d/dt(ACmetbr5) = Vmaxbr5*CCvbr*CGSHlu/(Km5*Kmgsh + CCvbr*Kmgsh + CGSHlu*Km5 + CGSHlu*CCvbr) d/dt(ACmetl5) = Vmaxl5*CCvl*CGSHl/(Km5*Kmgsh + CCvl*Kmgsh + CGSHl*Km5 + CGSHl*CCvl) d/dt(ACmetk5) = Vmaxk5*CCvkid*CGSHkid/(Km5*Kmgsh + CCvkid*Kmgsh + CGSHkid*Km5 + CGSHkid*CCvkid) {differential equations for dihydroxybutene} d/dt(ADpu) = Qpu*(CDart - CDvpu) + Vmaxpu1*ABpufree/(Km1*Vpu + ABpufree) + Vmaxpu1*ABpu/(R*Km1*Vpu + ABpu) - Vmaxpu6*CDvpu/(Km6 + CDvpu) - Vmaxpu7*CDvpu*CGSHlu/(Km7*Kmgsh + CDvpu*Kmgsh + CGSHlu*Km7 + CGSHlu*CDvpu)

SRP DRAFT September 2012
Appendix D1 81 Butadiene
d/dt(ADbr) = Qbr*(CDart - CDvbr) + Vmaxbr1*ABbrfree/(Km1*Vbr + ABbrfree) + Vmaxbr1*ABbr/(R*Km1*Vbr + ABbr) - Vmaxbr6*CDvbr/(Km6 + CDvbr) - Vmaxbr7*CDvbr*CGSHlu/(Km7*Kmgsh + CDvbr*Kmgsh + CGSHlu*Km7 + CGSHlu*CDvbr) d/dt(ADlcap) = Ql*(CDart - ADlcap/Vlcap) - Ql*Pidhb*(CDart - CDvl) d/dt(ADl) = Ql*Pidhb*(CDart - CDvl) + Vmaxl1*ABlfree/(Km1*Vl + ABlfree) + Vmaxl1*ABl/(R*Km1*Vl + ABl) - Vmaxl6*CDvl/(Km6 + CDvl) - Vmaxl7*CDvl*CGSHl/(Km7*Kmgsh + CDvl*Kmgsh + CGSHl*Km7 + CGSHl*CDvl) d/dt(ADkidcap) = Qkid*(CDart - ADkidcap/Vkidcap) - Qkid*Pidhb*(CDart - CDvkid) d/dt(ADkid) = Qkid*Pidhb*(CDart - CDvkid) + Vmaxk1*ABkidfree/(Km1*Vkid + ABkidfree) + Vmaxk1*ABkid/(R*Km1*Vkid + ABkid) - Vmaxl6*CDvkid/(Km6 + CDvkid) - Vmaxl7*CDvkid*CGSHkid/(Km7*Kmgsh + CDvkid*Kmgsh + CGSHkid*Km7 + CGSHkid*CDvkid) d/dt(ADfcap) = Qf*(CDart - ADfcap/Vfcap) - Qf*Pidhb*(CDart - CDvf) d/dt(ADf) = Qf*Pidhb*(CDart-CDvf) d/dt(ADmcap) = Qm*(CDart - ADmcap/Vmcap) - Qm*Pidhb*(CDart - CDvm) d/dt(ADm) = Qm*Pidhb*(CDart - CDvm) d/dt(ADvrgcap) = Qvrg*(CDart - ADvrgcap/Vvrgcap) - Qvrg*Pidhb*(CDart - CDvvrg) d/dt(ADvrg) = Qvrg*Pidhb*(CDart - CDvvrg) d/dt(ADuocap) = Quo*(CDart - ADuocap/Vuocap) - Quo*Pidhb*(CDart - CDvuo) d/dt(ADuo) = Quo*Pidhb*(CDart - CDvuo) d/dt(AUCDvtot) = CDvtot init (AUCDvuo) = 0 d/dt(AUCDvuo) = CDvuo {metabolism of DHB to EBD } d/dt(ADmetpu6) = Vmaxpu6*CDvpu/(Km6 + CDvpu) d/dt(ADmetbr6) = Vmaxbr6*CDvbr/(Km6 + CDvbr) d/dt(ADmetl6) = Vmaxl6*CDvl/(Km6 + CDvl) init ADmetk6 = 0 d/dt(ADmetk6) = Vmaxk6*CDvkid/(Km6 + CDvkid) {metabolism of DHB to DHB-SG conjugate} init ADmetpu7 = 0 init ADmetbr7 = 0 init ADmetl7 = 0 init ADmetk7 = 0 d/dt(ADmetpu7) = Vmaxpu7*CDvpu*CGSHlu/(Km7*Kmgsh + CDvpu*Kmgsh + CGSHlu*Km7 + CGSHlu*CDvpu) d/dt(ADmetbr7) = Vmaxbr7*CDvbr*CGSHlu/(Km7*Kmgsh + CDvbr*Kmgsh + CGSHlu*Km7 + CGSHlu*CDvbr) d/dt(ADmetl7) = Vmaxl7*CDvl*CGSHl/(Km7*Kmgsh + CDvl*Kmgsh + CGSHl*Km7 + CGSHl*CDvl) d/dt(ADmetk7) = Vmaxl7*CDvkid*CGSHkid/(Km7*Kmgsh + CDvkid*Kmgsh + CGSHkid*Km7 + CGSHkid*CDvkid) {differential equations for epoxybutanediol} d/dt(AEpufree) = AEpu*k8rel

SRP DRAFT September 2012
Appendix D1 82 Butadiene
d/dt(AEpu) = Qpu*(CEart - CEvpu) + Vmaxpu4*ACpufree/(Kmlu4*Vpu + ACpufree) + Vmaxpu4*ACpu/(R*Kmlu4*Vpu + ACpu) + Vmaxpu6*CDvpu/(Km6 + CDvpu) - Vmaxpu8*AEpufree/(Km8*Vpu + AEpufree) - Vmaxpu8*AEpu/(R*Km8*Vpu + AEpu) - Vmaxpu9*CEvpu*CGSHlu/(Km9*Kmgsh + CEvpu*Kmgsh + CGSHlu*Km9 + CGSHlu*CEvpu) d/dt(AEbrfree) = AEbr*k8rel d/dt(AEbr) = Qbr*(CEart - CEvbr) + Vmaxbr4*ACbrfree/(Kmlu4*Vbr + ACbrfree) + Vmaxbr4*ACbr/(R*Kmlu4*Vbr + ACbr) + Vmaxbr6*CDvbr/(Km6 + CDvbr) - Vmaxbr8*AEbrfree/(Km8*Vbr + AEbrfree) - Vmaxbr8*AEbr/(R*Km8*Vbr + AEbr) - Vmaxbr9*CEvbr*CGSHlu/(Km9*Kmgsh + CEvbr*Kmgsh + CGSHlu*Km9 + CGSHlu*CEvbr) d/dt(AElfree) = AEl*k8rel d/dt(AElcap) = Ql*(CEart - AElcap/Vlcap) - Ql*Piebd*(CEart - CEvl) d/dt(AEl) = Ql*Piebd*(CEart - CEvl) + Vmaxl4*AClfree/(Km4*Vl + AClfree) + Vmaxl4*ACl/(R*Km4*Vl + ACl) + Vmaxl6*CDvl/(Km6 + CDvl) - Vmaxl8*AElfree/(Km8*Vl + AElfree) - Vmaxl8*AEl/(R*Km8*Vl + AEl) - Vmaxl9*CEvl*CGSHl/(Km9*Kmgsh + CEvl*Kmgsh + CGSHl*Km9 + CGSHl*CEvl) d/dt(AEkidfree) = AEkid*k8rel d/dt(AEkidcap) = Qkid*(CEart - AEkidcap/Vkidcap) - Qkid*Piebd*(CEart - CEvkid) d/dt(AEkid) = Qkid*Pidhb*(CEart - CEvkid) + Vmaxk4*ACkidfree/(Kmlu4*Vkid + ACkidfree) + Vmaxk4*ACkid/(R*Kmlu4*Vkid + ACkid) + Vmaxl6*CDvkid/(Km6 + CDvkid) - Vmaxk8*AEkidfree/(Km8*Vkid + AEkidfree) - Vmaxk8*AEkid/(R*Km8*Vkid + AEkid) - Vmaxl9*CEvkid*CGSHkid/(Km9*Kmgsh + CEvkid*Kmgsh + CGSHkid*Km9 + CGSHkid*CEvkid) d/dt(AEfcap) = Qf*(CEart - AEfcap/Vfcap) - Qf*Piebd*(CEart - CEvf) d/dt(AEf) = Qf*Piebd*(CEart-CEvf) d/dt(AEmcap) = Qm*(CEart - AEmcap/Vmcap) - Qm*Piebd*(CEart - CEvm) d/dt(AEm) = Qm*Piebd*(CEart - CEvm) d/dt(AEvrgcap) = Qvrg*(CEart - AEvrgcap/Vvrgcap) - Qvrg*Piebd*(CEart - CEvvrg) d/dt(AEvrg) = Qvrg*Piebd*(CEart - CEvvrg) d/dt(AEuocap) = Quo*(CEart - AEuocap/Vuocap) - Quo*Piebd*(CEart - CEvuo) d/dt(AEuo) = Quo*Piebd*(CEart - CEvuo) d/dt(AUCEvtot) = CEvtot init (AUCEvuo) = 0 d/dt(AUCEvuo) = CEvuo {metabolism of epoxybutanediol to erythitol} init AEmetpu8 = 0 init AEmetbr8 = 0 init AEmetl8 = 0 init AEmetk8 = 0 d/dt(AEmetpu8) = Vmaxpu8*AEpufree/(Km8*Vpu + AEpufree) + Vmaxpu8*AEpu/(R*Km8*Vpu + AEpu) d/dt(AEmetbr8) = Vmaxbr8*AEbrfree/(Km8*Vbr + AEbrfree) + Vmaxbr8*AEbr/(R*Km8*Vbr + AEbr) d/dt(AEmetl8) = Vmaxl8*AElfree/(Km8*Vl + AElfree) + Vmaxl8*AEl/(R*Km8*Vl + AEl) init AEmetk8 = 0 d/dt(AEmetk8) = Vmaxk8*AEkidfree/(Km8*Vkid + AEkidfree) + Vmaxk8*AEkid/(R*Km8*Vkid + AEkid)
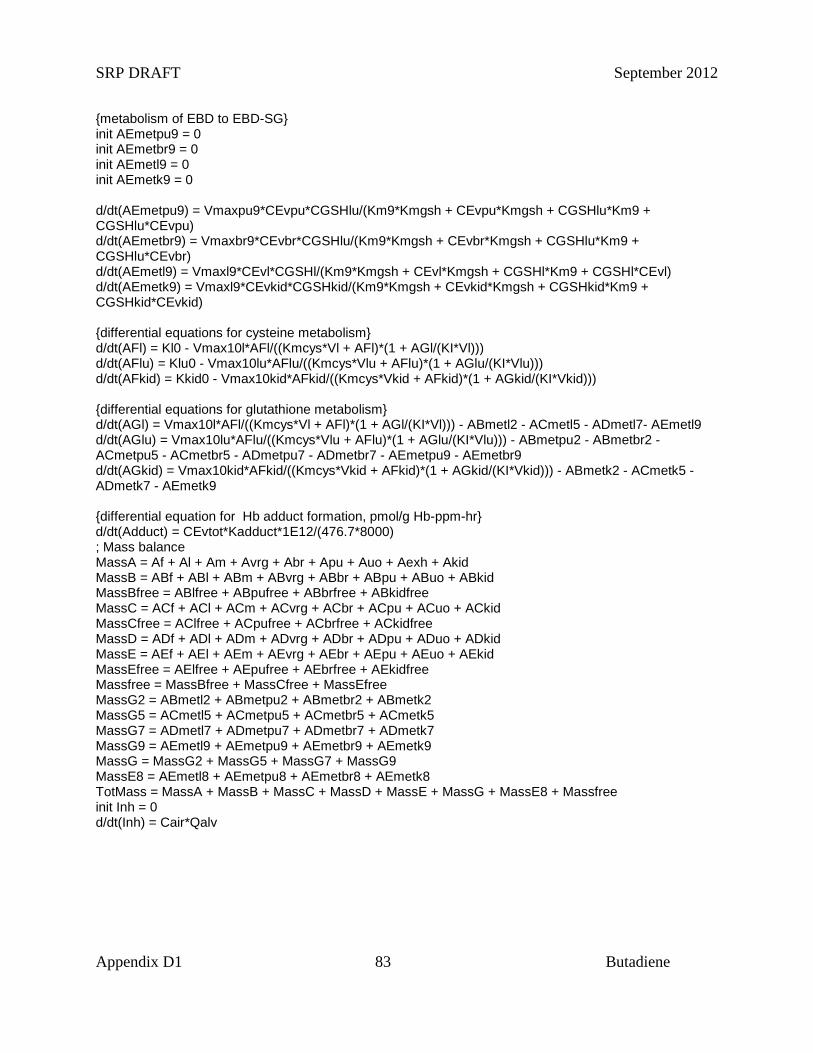
SRP DRAFT September 2012
Appendix D1 83 Butadiene
{metabolism of EBD to EBD-SG} init AEmetpu9 = 0 init AEmetbr9 = 0 init AEmetl9 = 0 init AEmetk9 = 0 d/dt(AEmetpu9) = Vmaxpu9*CEvpu*CGSHlu/(Km9*Kmgsh + CEvpu*Kmgsh + CGSHlu*Km9 + CGSHlu*CEvpu) d/dt(AEmetbr9) = Vmaxbr9*CEvbr*CGSHlu/(Km9*Kmgsh + CEvbr*Kmgsh + CGSHlu*Km9 + CGSHlu*CEvbr) d/dt(AEmetl9) = Vmaxl9*CEvl*CGSHl/(Km9*Kmgsh + CEvl*Kmgsh + CGSHl*Km9 + CGSHl*CEvl) d/dt(AEmetk9) = Vmaxl9*CEvkid*CGSHkid/(Km9*Kmgsh + CEvkid*Kmgsh + CGSHkid*Km9 + CGSHkid*CEvkid) {differential equations for cysteine metabolism} d/dt(AFl) = Kl0 - Vmax10l*AFl/((Kmcys*Vl + AFl)*(1 + AGl/(KI*Vl))) d/dt(AFlu) = Klu0 - Vmax10lu*AFlu/((Kmcys*Vlu + AFlu)*(1 + AGlu/(KI*Vlu))) d/dt(AFkid) = Kkid0 - Vmax10kid*AFkid/((Kmcys*Vkid + AFkid)*(1 + AGkid/(KI*Vkid))) {differential equations for glutathione metabolism} d/dt(AGl) = Vmax10l*AFl/((Kmcys*Vl + AFl)*(1 + AGl/(KI*Vl))) - ABmetl2 - ACmetl5 - ADmetl7- AEmetl9 d/dt(AGlu) = Vmax10lu*AFlu/((Kmcys*Vlu + AFlu)*(1 + AGlu/(KI*Vlu))) - ABmetpu2 - ABmetbr2 - ACmetpu5 - ACmetbr5 - ADmetpu7 - ADmetbr7 - AEmetpu9 - AEmetbr9 d/dt(AGkid) = Vmax10kid*AFkid/((Kmcys*Vkid + AFkid)*(1 + AGkid/(KI*Vkid))) - ABmetk2 - ACmetk5 - ADmetk7 - AEmetk9 {differential equation for Hb adduct formation, pmol/g Hb-ppm-hr} d/dt(Adduct) = CEvtot*Kadduct*1E12/(476.7*8000) ; Mass balance MassA = Af + Al + Am + Avrg + Abr + Apu + Auo + Aexh + Akid MassB = ABf + ABl + ABm + ABvrg + ABbr + ABpu + ABuo + ABkid MassBfree = ABlfree + ABpufree + ABbrfree + ABkidfree MassC = ACf + ACl + ACm + ACvrg + ACbr + ACpu + ACuo + ACkid MassCfree = AClfree + ACpufree + ACbrfree + ACkidfree MassD = ADf + ADl + ADm + ADvrg + ADbr + ADpu + ADuo + ADkid MassE = AEf + AEl + AEm + AEvrg + AEbr + AEpu + AEuo + AEkid MassEfree = AElfree + AEpufree + AEbrfree + AEkidfree Massfree = MassBfree + MassCfree + MassEfree MassG2 = ABmetl2 + ABmetpu2 + ABmetbr2 + ABmetk2 MassG5 = ACmetl5 + ACmetpu5 + ACmetbr5 + ACmetk5 MassG7 = ADmetl7 + ADmetpu7 + ADmetbr7 + ADmetk7 MassG9 = AEmetl9 + AEmetpu9 + AEmetbr9 + AEmetk9 MassG = MassG2 + MassG5 + MassG7 + MassG9 MassE8 = AEmetl8 + AEmetpu8 + AEmetbr8 + AEmetk8 TotMass = MassA + MassB + MassC + MassD + MassE + MassG + MassE8 + Massfree init Inh = 0 d/dt(Inh) = Cair*Qalv


![o-xylene 1,3-Butadiene - · PDF fileKey words: Alkenylation, OTP, o-xylene, 1,3-Butadiene, Na Metal 1. Polyethylene napthalate ... lm Q [2]. ;p 6 4] K2CO3, ... 4 M 12.4% ] < Na üY](https://img.pdfslide.us/doc/110x75/5a7899a97f8b9a7b698d6180/o-xylene-13-butadiene-words-alkenylation-otp-o-xylene-13-butadiene-na-metal.jpg)