Embed Size (px)
Citation preview
13
14
15
16
17
18
19
20
16
50
17
00
17
50
18
00
18
50
19
00
19
50
20
00
July
Te
mp
era
ture
(C
)
Figure 7.1
13
14
15
16
17
18
19
20
19
70
19
75
19
80
19
85
19
90
19
95
20
00
July
Te
mp
era
ture
(C
)
Ecological Climatology © 2008 G. Bonan
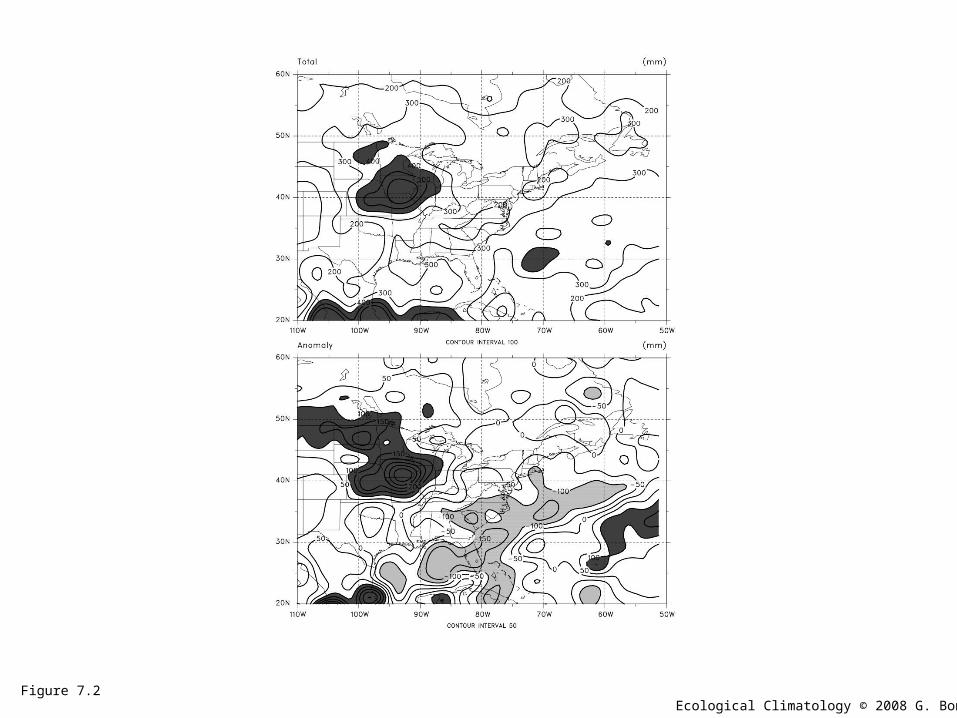
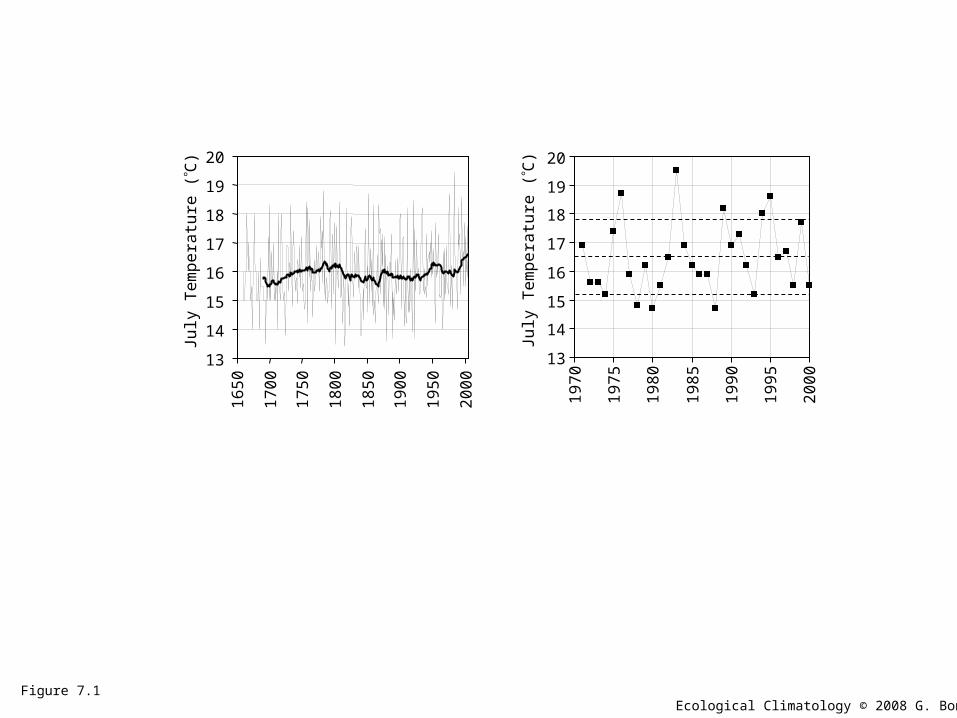
Figure 7.2Ecological Climatology © 2008 G. Bonan
Figure 7.3Ecological Climatology © 2008 G. Bonan
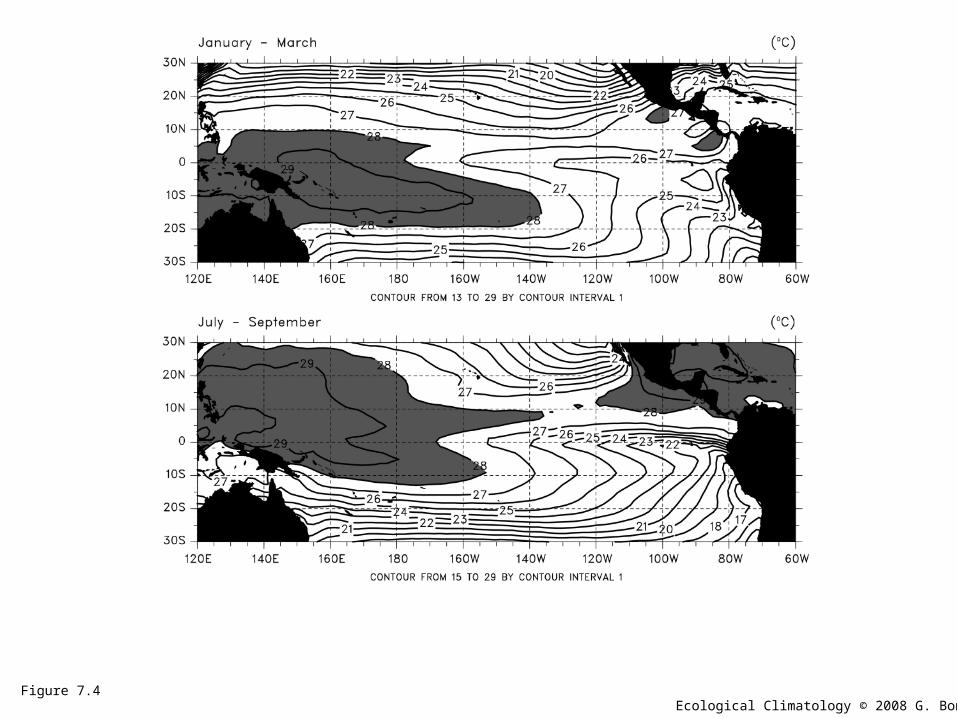
Figure 7.4Ecological Climatology © 2008 G. Bonan
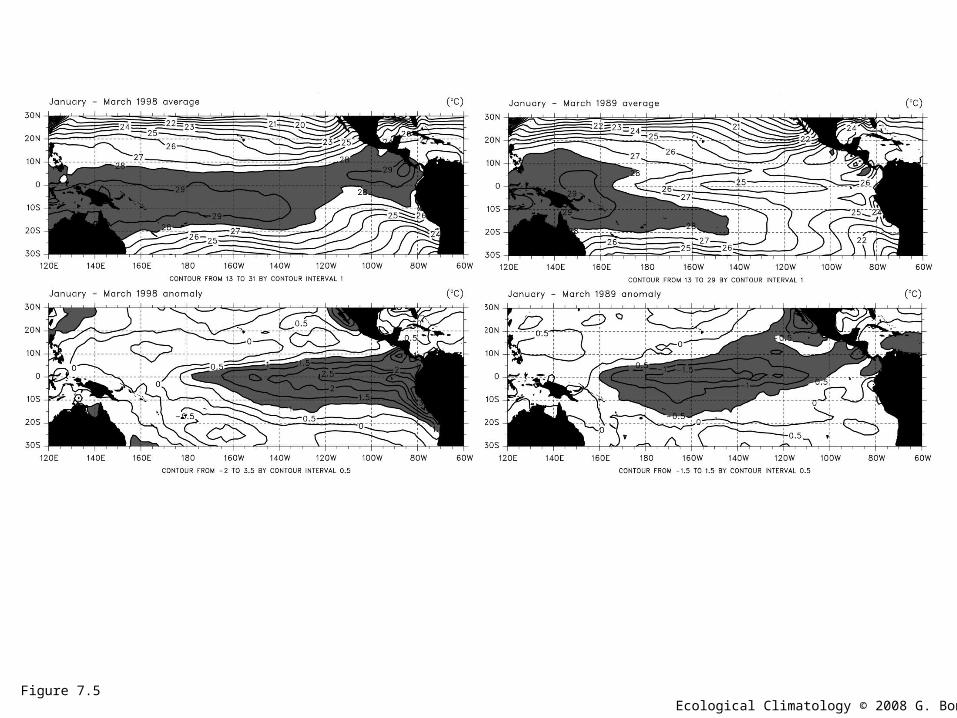
Figure 7.5Ecological Climatology © 2008 G. Bonan
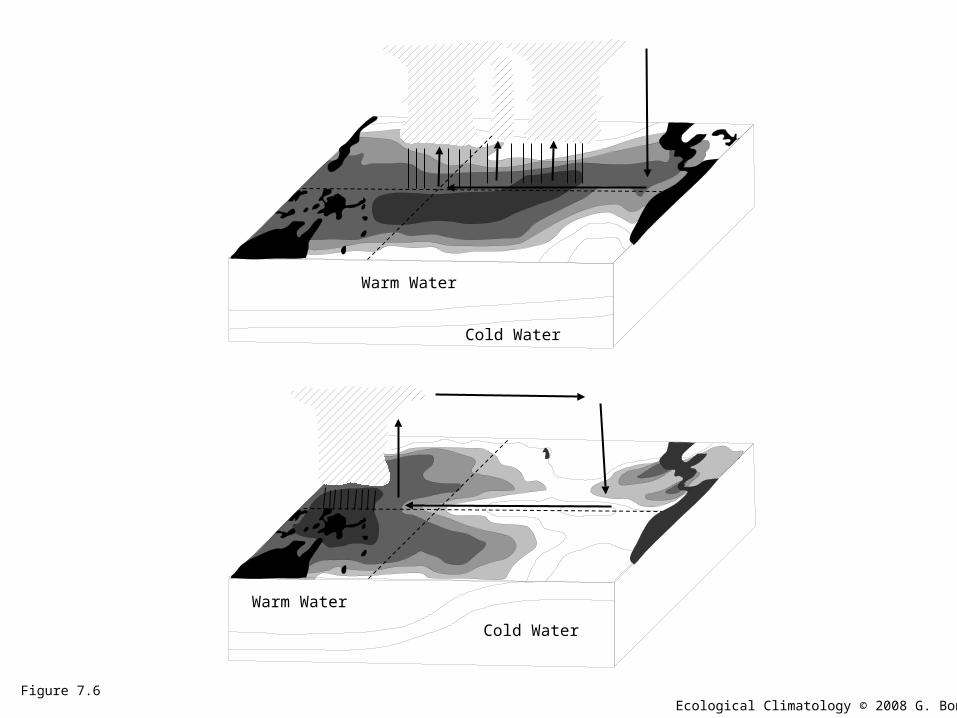
Warm Water
Cold Water
Warm Water
Cold Water
Figure 7.6Ecological Climatology © 2008 G. Bonan
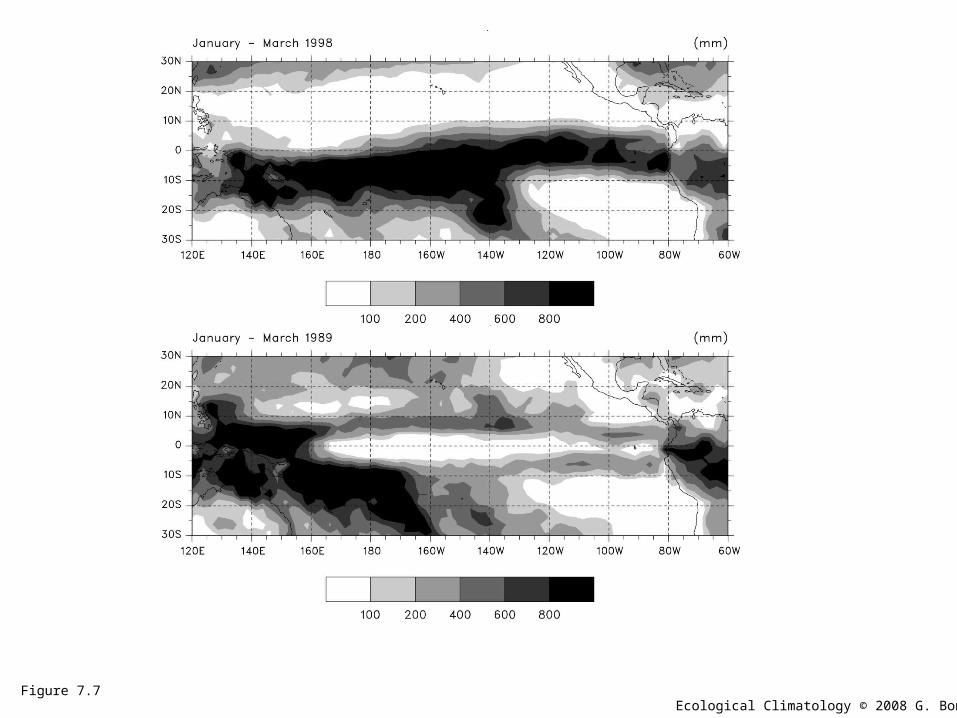
Figure 7.7Ecological Climatology © 2008 G. Bonan
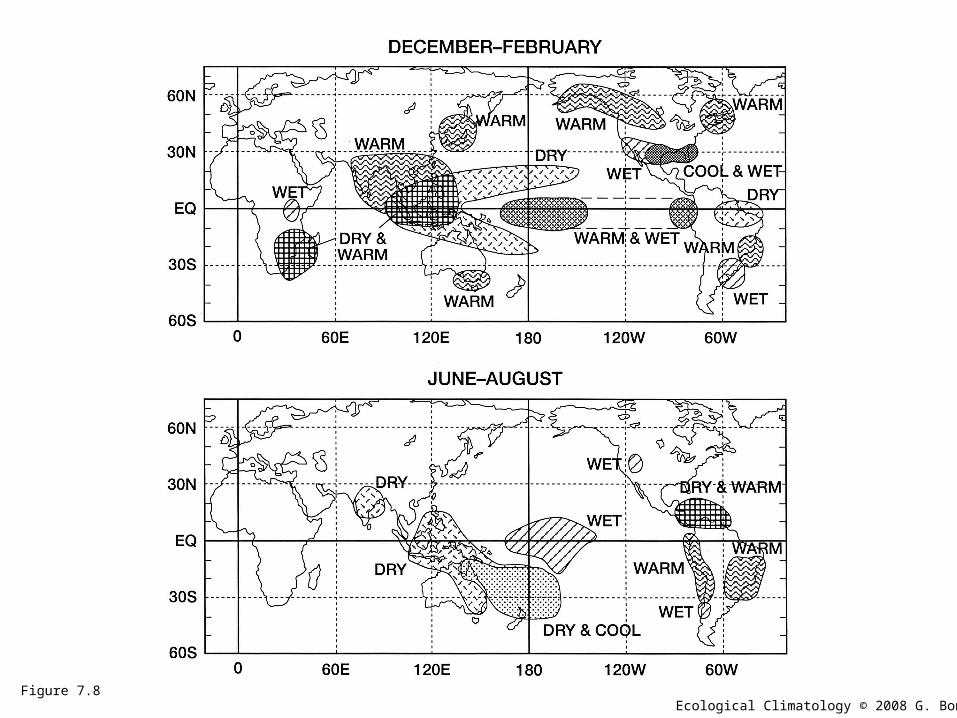
Figure 7.8Ecological Climatology © 2008 G. Bonan
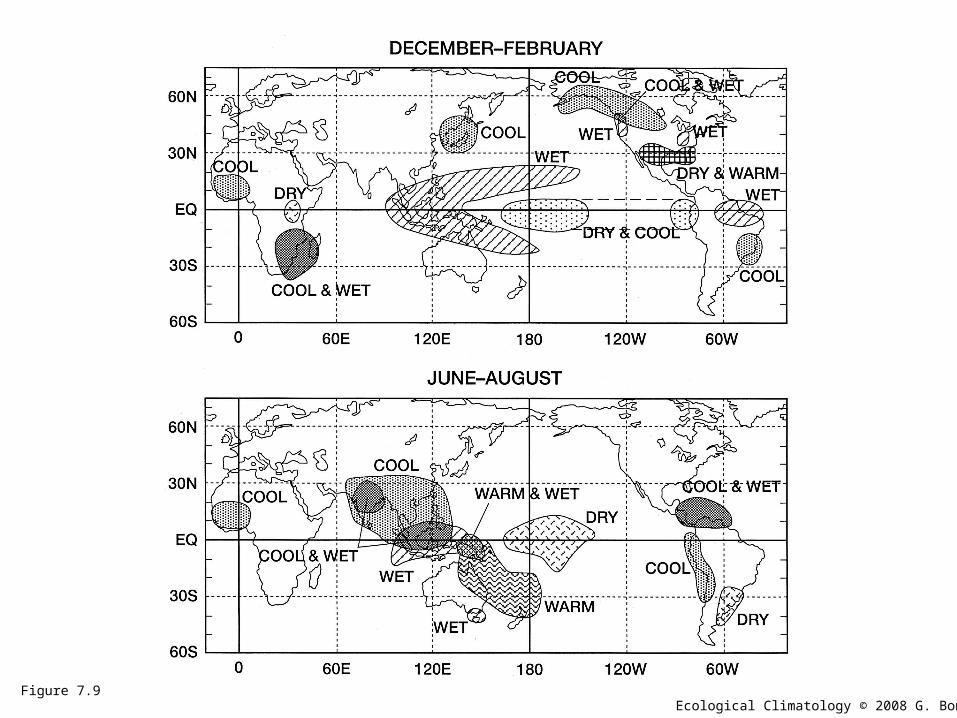
Figure 7.9Ecological Climatology © 2008 G. Bonan
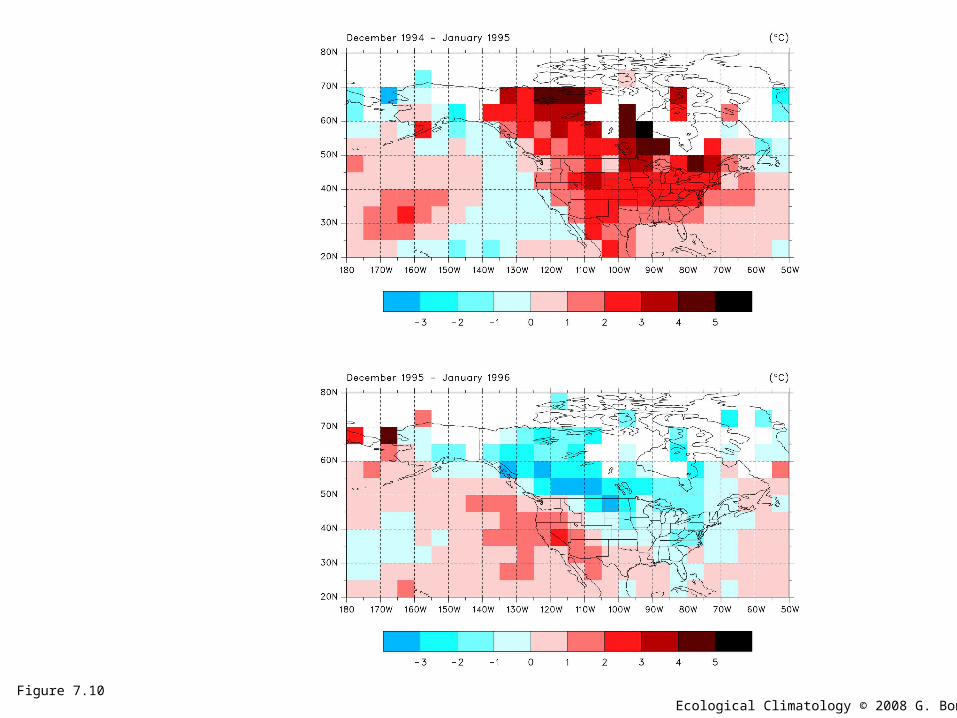
Figure 7.10Ecological Climatology © 2008 G. Bonan
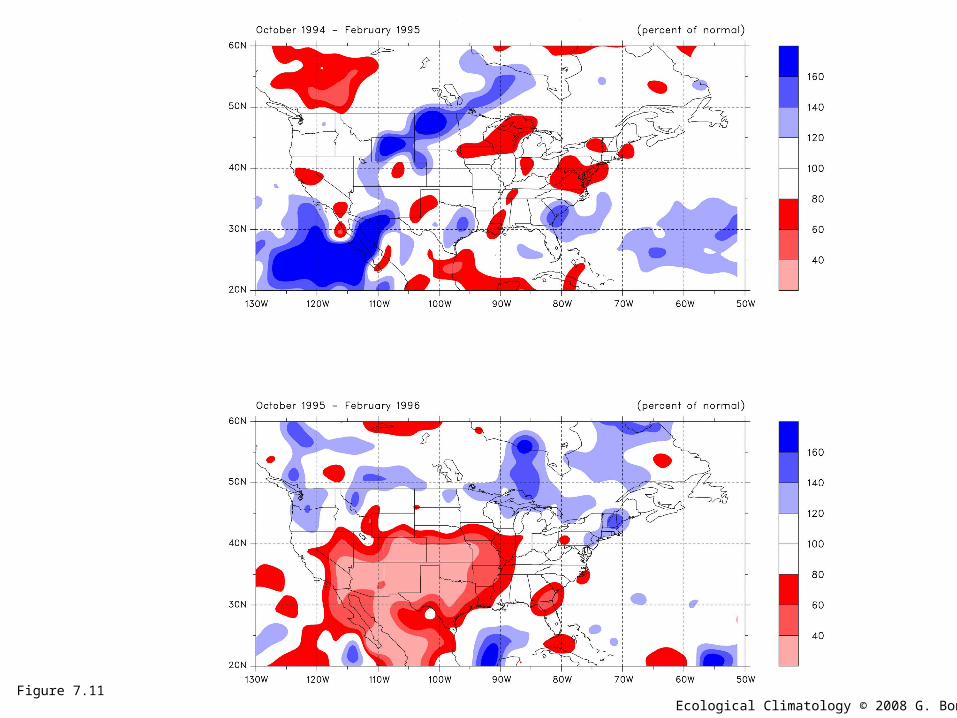
Figure 7.11Ecological Climatology © 2008 G. Bonan
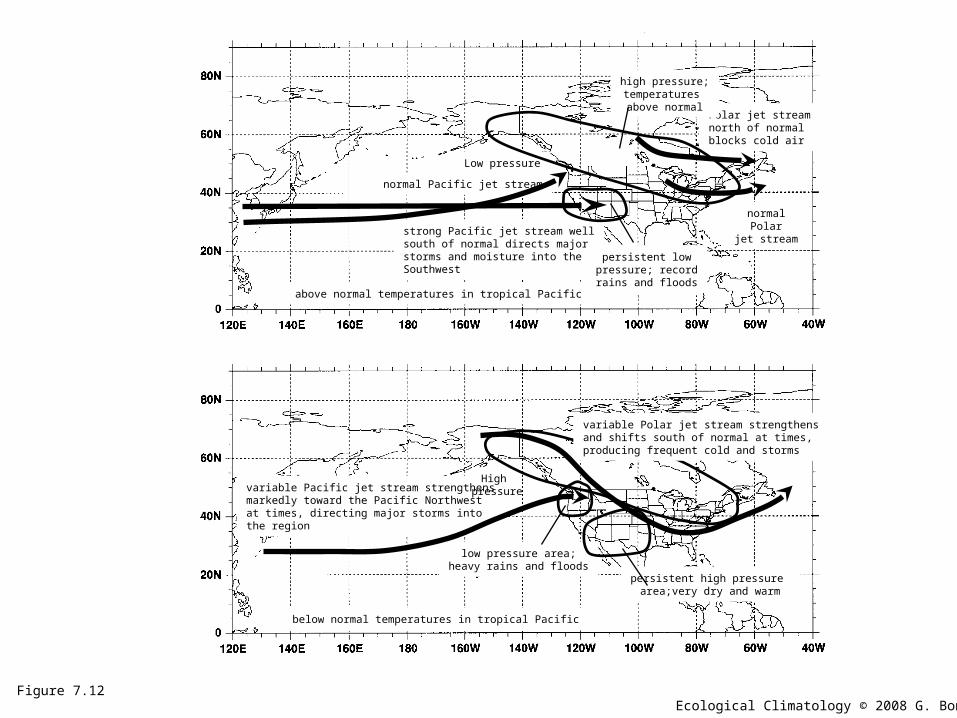
strong Pacific jet stream wellsouth of normal directs majorstorms and moisture into theSouthwest
normal Pacific jet stream
Polar jet stream north of normal blocks cold air
high pressure;temperatures above normal
persistent lowpressure; recordrains and floods
above normal temperatures in tropical Pacific
normal Polarjet stream
Low pressure
below normal temperatures in tropical Pacific
variable Pacific jet stream strengthensmarkedly toward the Pacific Northwestat times, directing major storms intothe region
low pressure area;heavy rains and floods
persistent high pressure area;very dry and warm
High pressure
variable Polar jet stream strengthensand shifts south of normal at times,producing frequent cold and storms
Figure 7.12Ecological Climatology © 2008 G. Bonan
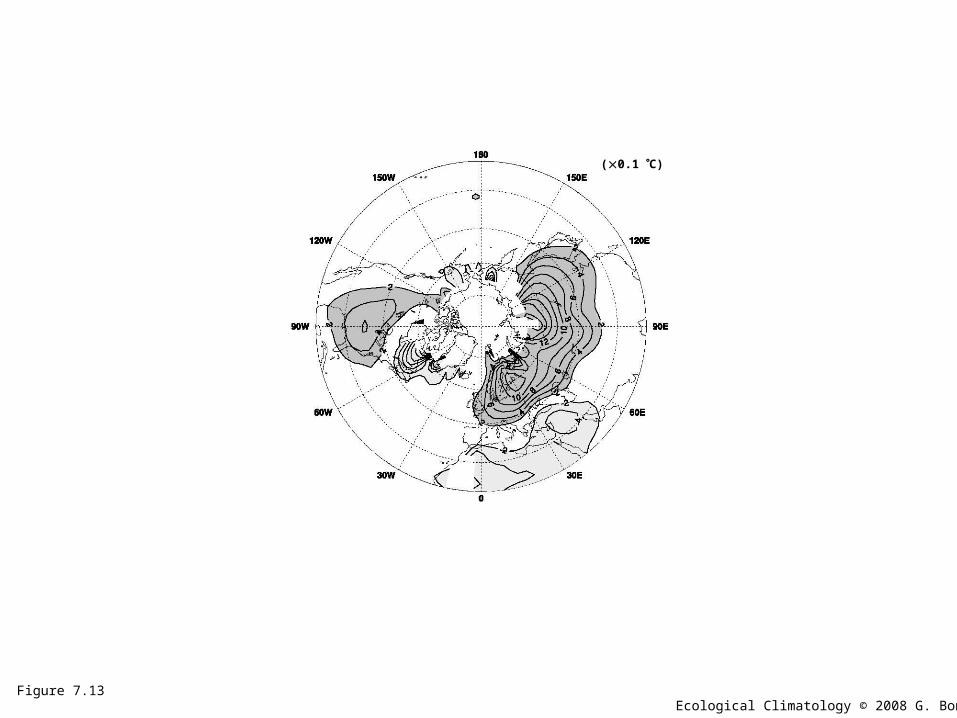
Figure 7.13
(0.1 C)
Ecological Climatology © 2008 G. Bonan

Figure 7.14
(mm day-1)Evaporation - Precipitation
90W 60W 30W 0 30E 60E
20N
40N
60N
80N
Ecological Climatology © 2008 G. Bonan
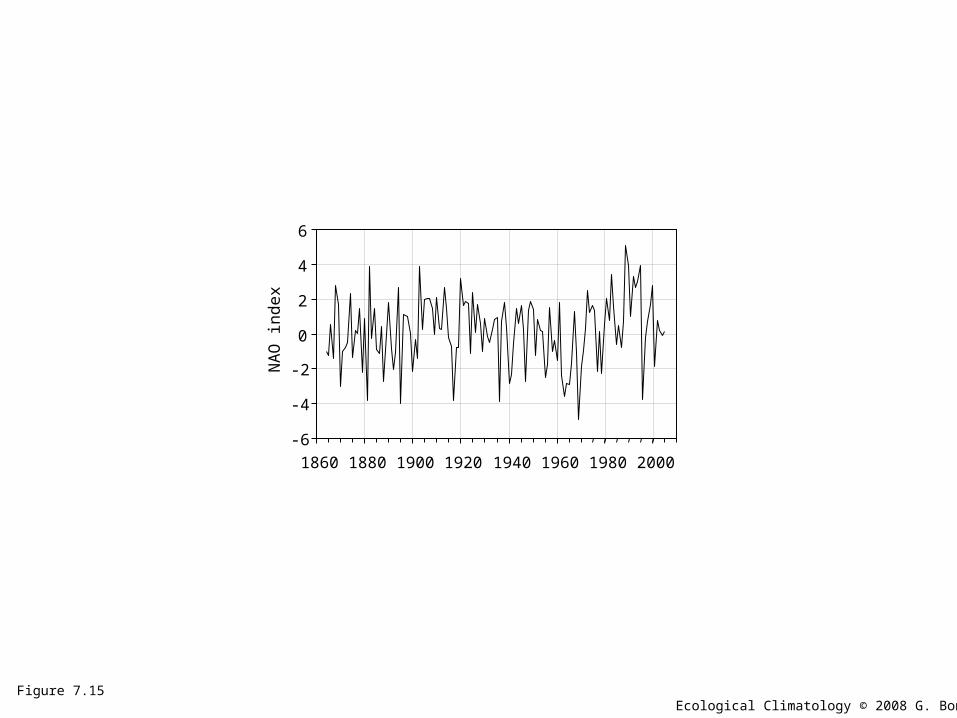
-6
-4
-2
0
2
4
6
1860 1880 1900 1920 1940 1960 1980 2000
NA
O in
de
x
Figure 7.15Ecological Climatology © 2008 G. Bonan