Embed Size (px)
Citation preview

12 | DIVERSITY OFLIFE
Figure 12.1 Although they look different, this bee and flower are distantly related. (credit:modification of work by John Beetham)
Chapter Outline12.1: Organizing Life on Earth
12.2: Determining Evolutionary Relationships
IntroductionThis bee and Echinacea flower could not look more different, yet they are related, as are all livingorganisms on Earth. By following pathways of similarities and differences—both visible andgenetic—scientists seek to map the history of evolution from single-celled organisms to the tremendousdiversity of creatures that have crawled, germinated, floated, swam, flown, and walked on this planet.
12.1 | Organizing Life on EarthBy the end of this section, you will be able to:By the end of this section, you will be able to:
• Discuss the need for a comprehensive classification system• List the different levels of the taxonomic classification system• Describe how systematics and taxonomy relate to phylogeny
All life on Earth evolved from a common ancestor. Biologists map how organisms are related byconstructing phylogenetic trees. In other words, a “tree of life” can be constructed to illustrate whendifferent organisms evolved and to show the relationships among different organisms, as shown inFigure 12.2. Notice that from a single point, the three domains of Archaea, Bacteria, and Eukarya
CHAPTER 12 | DIVERSITY OF LIFE 277
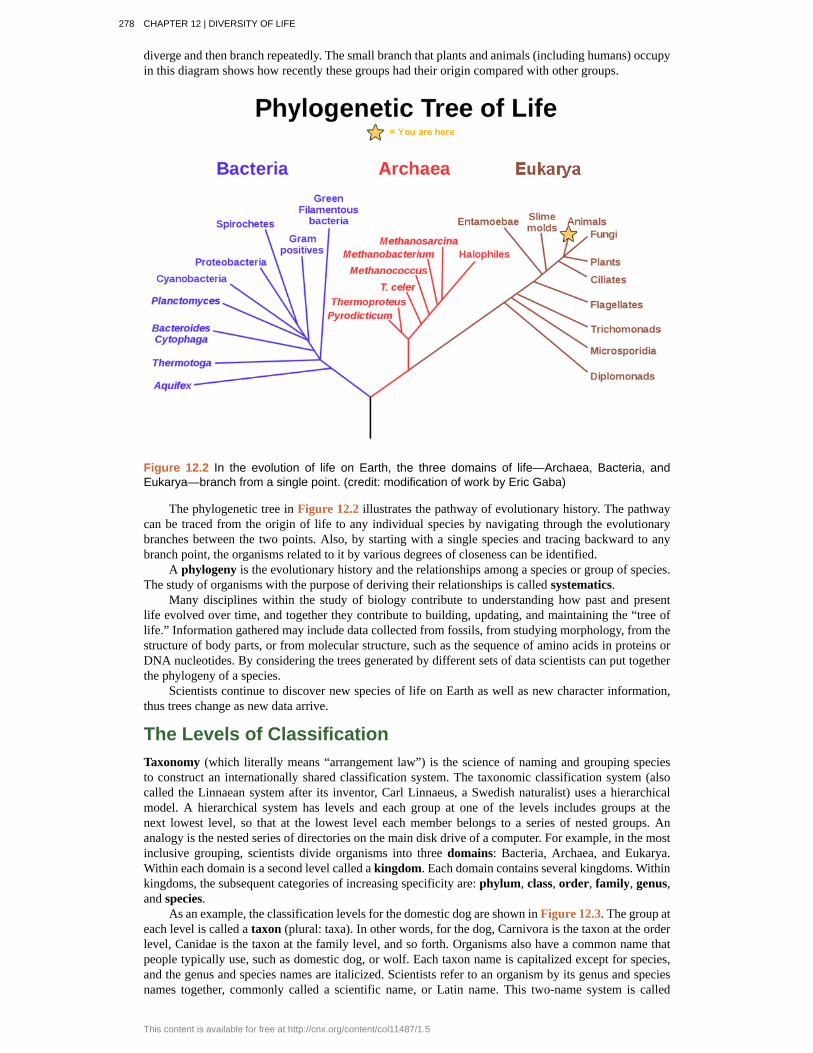
diverge and then branch repeatedly. The small branch that plants and animals (including humans) occupyin this diagram shows how recently these groups had their origin compared with other groups.
Figure 12.2 In the evolution of life on Earth, the three domains of life—Archaea, Bacteria, andEukarya—branch from a single point. (credit: modification of work by Eric Gaba)
The phylogenetic tree in Figure 12.2 illustrates the pathway of evolutionary history. The pathwaycan be traced from the origin of life to any individual species by navigating through the evolutionarybranches between the two points. Also, by starting with a single species and tracing backward to anybranch point, the organisms related to it by various degrees of closeness can be identified.
A phylogeny is the evolutionary history and the relationships among a species or group of species.The study of organisms with the purpose of deriving their relationships is called systematics.
Many disciplines within the study of biology contribute to understanding how past and presentlife evolved over time, and together they contribute to building, updating, and maintaining the “tree oflife.” Information gathered may include data collected from fossils, from studying morphology, from thestructure of body parts, or from molecular structure, such as the sequence of amino acids in proteins orDNA nucleotides. By considering the trees generated by different sets of data scientists can put togetherthe phylogeny of a species.
Scientists continue to discover new species of life on Earth as well as new character information,thus trees change as new data arrive.
The Levels of ClassificationTaxonomy (which literally means “arrangement law”) is the science of naming and grouping speciesto construct an internationally shared classification system. The taxonomic classification system (alsocalled the Linnaean system after its inventor, Carl Linnaeus, a Swedish naturalist) uses a hierarchicalmodel. A hierarchical system has levels and each group at one of the levels includes groups at thenext lowest level, so that at the lowest level each member belongs to a series of nested groups. Ananalogy is the nested series of directories on the main disk drive of a computer. For example, in the mostinclusive grouping, scientists divide organisms into three domains: Bacteria, Archaea, and Eukarya.Within each domain is a second level called a kingdom. Each domain contains several kingdoms. Withinkingdoms, the subsequent categories of increasing specificity are: phylum, class, order, family, genus,and species.
As an example, the classification levels for the domestic dog are shown in Figure 12.3. The group ateach level is called a taxon (plural: taxa). In other words, for the dog, Carnivora is the taxon at the orderlevel, Canidae is the taxon at the family level, and so forth. Organisms also have a common name thatpeople typically use, such as domestic dog, or wolf. Each taxon name is capitalized except for species,and the genus and species names are italicized. Scientists refer to an organism by its genus and speciesnames together, commonly called a scientific name, or Latin name. This two-name system is called
278 CHAPTER 12 | DIVERSITY OF LIFE
This content is available for free at http://cnx.org/content/col11487/1.5
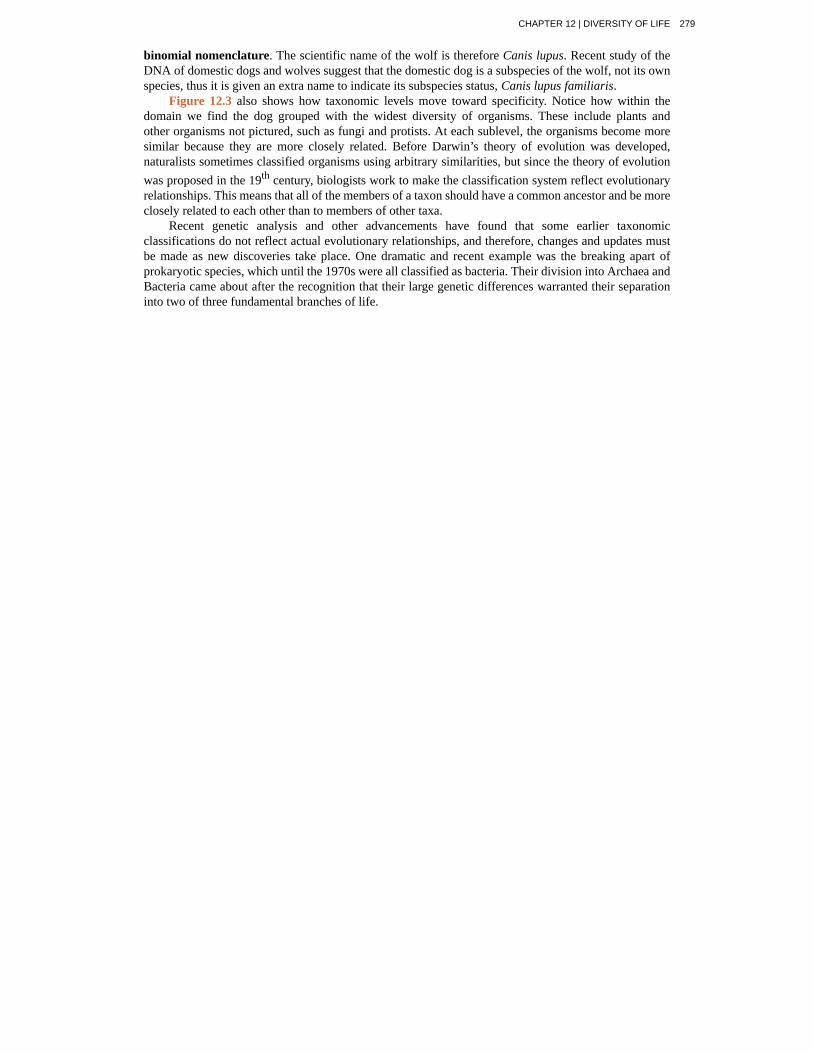
binomial nomenclature. The scientific name of the wolf is therefore Canis lupus. Recent study of theDNA of domestic dogs and wolves suggest that the domestic dog is a subspecies of the wolf, not its ownspecies, thus it is given an extra name to indicate its subspecies status, Canis lupus familiaris.
Figure 12.3 also shows how taxonomic levels move toward specificity. Notice how within thedomain we find the dog grouped with the widest diversity of organisms. These include plants andother organisms not pictured, such as fungi and protists. At each sublevel, the organisms become moresimilar because they are more closely related. Before Darwin’s theory of evolution was developed,naturalists sometimes classified organisms using arbitrary similarities, but since the theory of evolutionwas proposed in the 19th century, biologists work to make the classification system reflect evolutionaryrelationships. This means that all of the members of a taxon should have a common ancestor and be moreclosely related to each other than to members of other taxa.
Recent genetic analysis and other advancements have found that some earlier taxonomicclassifications do not reflect actual evolutionary relationships, and therefore, changes and updates mustbe made as new discoveries take place. One dramatic and recent example was the breaking apart ofprokaryotic species, which until the 1970s were all classified as bacteria. Their division into Archaea andBacteria came about after the recognition that their large genetic differences warranted their separationinto two of three fundamental branches of life.
CHAPTER 12 | DIVERSITY OF LIFE 279

Figure 12.3 At each sublevel in the taxonomic classification system, organisms become moresimilar. Dogs and wolves are the same species because they can breed and produce viableoffspring, but they are different enough to be classified as different subspecies. (credit “plant”:modification of work by "berduchwal"/Flickr; credit “insect”: modification of work by Jon Sullivan;credit “fish”: modification of work by Christian Mehlführer; credit “rabbit”: modification of work byAidan Wojtas; credit “cat”: modification of work by Jonathan Lidbeck; credit “fox”: modification ofwork by Kevin Bacher, NPS; credit “jackal”: modification of work by Thomas A. Hermann, NBII,USGS; credit “wolf” modification of work by Robert Dewar; credit “dog”: modification of work by"digital_image_fan"/Flickr)
In what levels are cats and dogs considered to be part of the same group?
Visit this PBS site (http://openstaxcollege.org/l/classify_life2) to learn more about taxonomy. UnderClassifying Life, click Launch Interactive.
280 CHAPTER 12 | DIVERSITY OF LIFE
This content is available for free at http://cnx.org/content/col11487/1.5
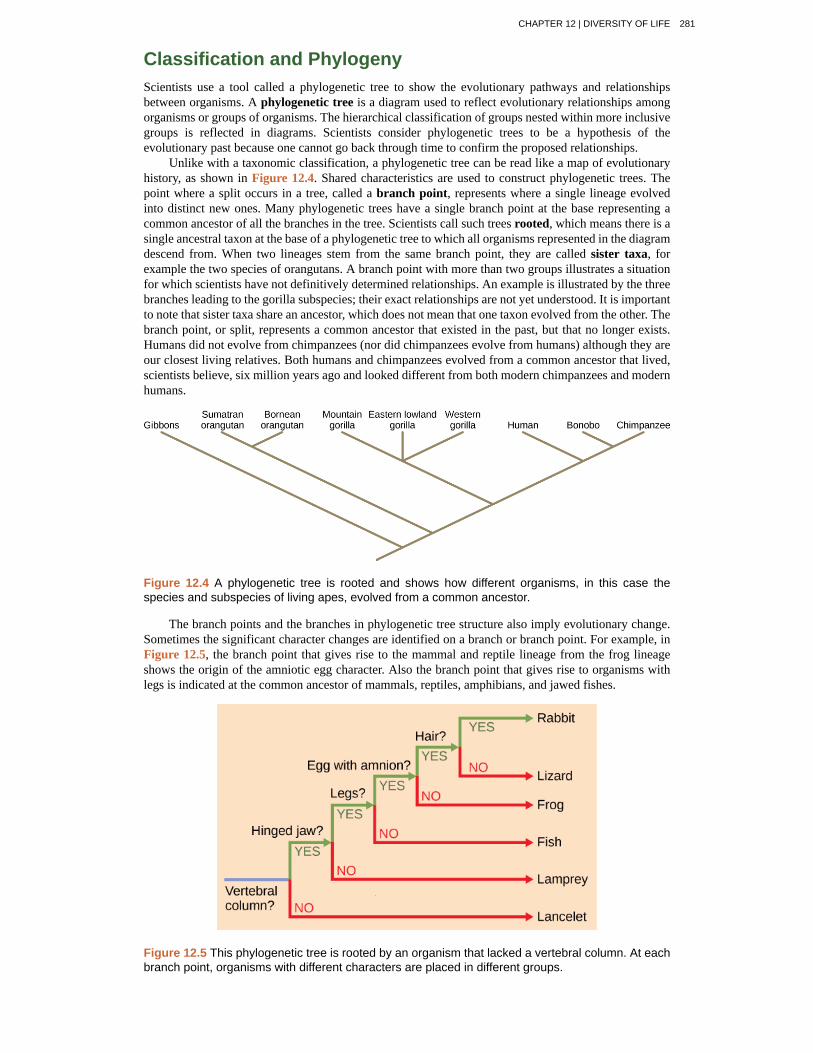
Classification and PhylogenyScientists use a tool called a phylogenetic tree to show the evolutionary pathways and relationshipsbetween organisms. A phylogenetic tree is a diagram used to reflect evolutionary relationships amongorganisms or groups of organisms. The hierarchical classification of groups nested within more inclusivegroups is reflected in diagrams. Scientists consider phylogenetic trees to be a hypothesis of theevolutionary past because one cannot go back through time to confirm the proposed relationships.
Unlike with a taxonomic classification, a phylogenetic tree can be read like a map of evolutionaryhistory, as shown in Figure 12.4. Shared characteristics are used to construct phylogenetic trees. Thepoint where a split occurs in a tree, called a branch point, represents where a single lineage evolvedinto distinct new ones. Many phylogenetic trees have a single branch point at the base representing acommon ancestor of all the branches in the tree. Scientists call such trees rooted, which means there is asingle ancestral taxon at the base of a phylogenetic tree to which all organisms represented in the diagramdescend from. When two lineages stem from the same branch point, they are called sister taxa, forexample the two species of orangutans. A branch point with more than two groups illustrates a situationfor which scientists have not definitively determined relationships. An example is illustrated by the threebranches leading to the gorilla subspecies; their exact relationships are not yet understood. It is importantto note that sister taxa share an ancestor, which does not mean that one taxon evolved from the other. Thebranch point, or split, represents a common ancestor that existed in the past, but that no longer exists.Humans did not evolve from chimpanzees (nor did chimpanzees evolve from humans) although they areour closest living relatives. Both humans and chimpanzees evolved from a common ancestor that lived,scientists believe, six million years ago and looked different from both modern chimpanzees and modernhumans.
Figure 12.4 A phylogenetic tree is rooted and shows how different organisms, in this case thespecies and subspecies of living apes, evolved from a common ancestor.
The branch points and the branches in phylogenetic tree structure also imply evolutionary change.Sometimes the significant character changes are identified on a branch or branch point. For example, inFigure 12.5, the branch point that gives rise to the mammal and reptile lineage from the frog lineageshows the origin of the amniotic egg character. Also the branch point that gives rise to organisms withlegs is indicated at the common ancestor of mammals, reptiles, amphibians, and jawed fishes.
Figure 12.5 This phylogenetic tree is rooted by an organism that lacked a vertebral column. At eachbranch point, organisms with different characters are placed in different groups.
CHAPTER 12 | DIVERSITY OF LIFE 281
This interactive exercise (http://openstaxcollege.org/l/tree_of_life3) allows you to explore theevolutionary relationships among species.
Limitations of Phylogenetic TreesIt is easy to assume that more closely related organisms look more alike, and while this is often the case,it is not always true. If two closely related lineages evolved under significantly different surroundings orafter the evolution of a major new adaptation, they may look quite different from each other, even moreso than other groups that are not as closely related. For example, the phylogenetic tree in Figure 12.5shows that lizards and rabbits both have amniotic eggs, whereas salamanders (within the frog lineage)do not; yet on the surface, lizards and salamanders appear more similar than the lizards and rabbits.
Another aspect of phylogenetic trees is that, unless otherwise indicated, the branches do not showlength of time, they show only the order in time of evolutionary events. In other words, a long branchdoes not necessarily mean more time passed, nor does a short branch mean less time passed— unlessspecified on the diagram. For example, in Figure 12.5, the tree does not indicate how much time passedbetween the evolution of amniotic eggs and hair. What the tree does show is the order in which thingstook place. Again using Figure 12.5, the tree shows that the oldest trait is the vertebral column, followedby hinged jaws, and so forth. Remember that any phylogenetic tree is a part of the greater whole, andsimilar to a real tree, it does not grow in only one direction after a new branch develops. So, for theorganisms in Figure 12.5, just because a vertebral column evolved does not mean that invertebrateevolution ceased, it only means that a new branch formed. Also, groups that are not closely related, butevolve under similar conditions, may appear more similar to each other than to a close relative.
12.2 | Determining Evolutionary RelationshipsBy the end of this section, you will be able to:By the end of this section, you will be able to:
• Compare homologous and analogous traits• Discuss the purpose of cladistics
Scientists collect information that allows them to make evolutionary connections between organisms.Similar to detective work, scientists must use evidence to uncover the facts. In the case of phylogeny,evolutionary investigations focus on two types of evidence: morphologic (form and function) andgenetic.
Two Measures of SimilarityOrganisms that share similar physical features and genetic sequences tend to be more closely relatedthan those that do not. Features that overlap both morphologically and genetically are referred to ashomologous structures; the similarities stem from common evolutionary paths. For example, as shown inFigure 12.6, the bones in the wings of bats and birds, the arms of humans, and the foreleg of a horse arehomologous structures. Notice the structure is not simply a single bone, but rather a grouping of severalbones arranged in a similar way in each organism even though the elements of the structure may havechanged shape and size.
282 CHAPTER 12 | DIVERSITY OF LIFE
This content is available for free at http://cnx.org/content/col11487/1.5

Figure 12.6 Bat and bird wings, the foreleg of a horse, the flipper of a whale, and the arm of a humanare homologous structures, indicating that bats, birds, horses, whales, and humans share a commonevolutionary past. (credit a photo: modification of work by Steve Hillebrand, USFWS; credit b photo:modification of work by U.S. BLM; credit c photo: modification of work by Virendra Kankariya; creditd photo: modification of work by Russian Gov./Wikimedia Commons)
Misleading AppearancesSome organisms may be very closely related, even though a minor genetic change caused a majormorphological difference to make them look quite different. For example, chimpanzees and humans, theskulls of which are shown in Figure 12.7 are very similar genetically, sharing 99 percent
[1]of their genes.
However, chimpanzees and humans show considerable anatomical differences, including the degree towhich the jaw protrudes in the adult and the relative lengths of our arms and legs.
1. Gibbons, A. (2012, June 13). Science Now. Retrieved from http://news.sciencemag.org/sciencenow/2012/06/bonobo-genome-sequenced.html
CHAPTER 12 | DIVERSITY OF LIFE 283
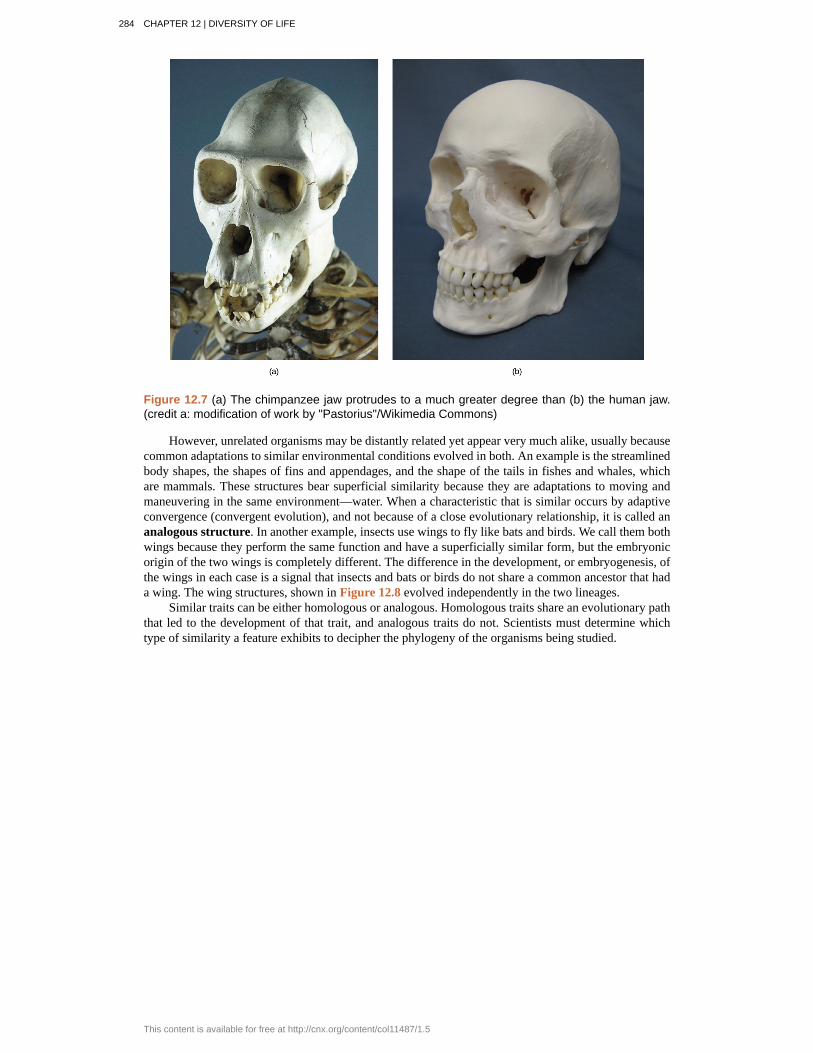
Figure 12.7 (a) The chimpanzee jaw protrudes to a much greater degree than (b) the human jaw.(credit a: modification of work by "Pastorius"/Wikimedia Commons)
However, unrelated organisms may be distantly related yet appear very much alike, usually becausecommon adaptations to similar environmental conditions evolved in both. An example is the streamlinedbody shapes, the shapes of fins and appendages, and the shape of the tails in fishes and whales, whichare mammals. These structures bear superficial similarity because they are adaptations to moving andmaneuvering in the same environment—water. When a characteristic that is similar occurs by adaptiveconvergence (convergent evolution), and not because of a close evolutionary relationship, it is called ananalogous structure. In another example, insects use wings to fly like bats and birds. We call them bothwings because they perform the same function and have a superficially similar form, but the embryonicorigin of the two wings is completely different. The difference in the development, or embryogenesis, ofthe wings in each case is a signal that insects and bats or birds do not share a common ancestor that hada wing. The wing structures, shown in Figure 12.8 evolved independently in the two lineages.
Similar traits can be either homologous or analogous. Homologous traits share an evolutionary paththat led to the development of that trait, and analogous traits do not. Scientists must determine whichtype of similarity a feature exhibits to decipher the phylogeny of the organisms being studied.
284 CHAPTER 12 | DIVERSITY OF LIFE
This content is available for free at http://cnx.org/content/col11487/1.5

Figure 12.8 The wing of a honey bee is similar in shape to a bird wing and a bat wing and servesthe same function (flight). The bird and bat wings are homologous structures. However, the honeybee wing has a different structure (it is made of a chitinous exoskeleton, not a boney endoskeleton)and embryonic origin. The bee and bird or bat wing types illustrate an analogy—similar structuresthat do not share an evolutionary history. (credit a photo: modification of work by U.S. BLM; credit b:modification of work by Steve Hillebrand, USFWS; credit c: modification of work by Jon Sullivan)
This website (http://openstaxcollege.org/l/relationships2) has several examples to show howappearances can be misleading in understanding the phylogenetic relationships of organisms.
Molecular ComparisonsWith the advancement of DNA technology, the area of molecular systematics, which describes theuse of information on the molecular level including DNA sequencing, has blossomed. New analysis ofmolecular characters not only confirms many earlier classifications, but also uncovers previously madeerrors. Molecular characters can include differences in the amino-acid sequence of a protein, differencesin the individual nucleotide sequence of a gene, or differences in the arrangements of genes. Phylogeniesbased on molecular characters assume that the more similar the sequences are in two organisms, themore closely related they are. Different genes change evolutionarily at different rates and this affectsthe level at which they are useful at identifying relationships. Rapidly evolving sequences are usefulfor determining the relationships among closely related species. More slowly evolving sequences areuseful for determining the relationships between distantly related species. To determine the relationshipsbetween very different species such as Eukarya and Archaea, the genes used must be very ancient,slowly evolving genes that are present in both groups, such as the genes for ribosomal RNA. Comparing
CHAPTER 12 | DIVERSITY OF LIFE 285
phylogenetic trees using different sequences and finding them similar helps to build confidence in theinferred relationships.
Sometimes two segments of DNA in distantly related organisms randomly share a high percentageof bases in the same locations, causing these organisms to appear closely related when they are not. Forexample, the fruit fly shares 60 percent of its DNA with humans.
[2]In this situation, computer-based
statistical algorithms have been developed to help identify the actual relationships, and ultimately, thecoupled use of both morphologic and molecular information is more effective in determining phylogeny.
Why Does Phylogeny Matter?In addition to enhancing our understanding of the evolutionary history of species,
our own included, phylogenetic analysis has numerous practical applications. Two ofthose applications include understanding the evolution and transmission of disease andmaking decisions about conservation efforts. A 2010 study
[3]of MRSA (methicillin-resistant
Staphylococcus aureus), an antibiotic resistant pathogenic bacterium, traced the origin andspread of the strain throughout the past 40 years. The study uncovered the timing andpatterns in which the resistant strain moved from its point of origin in Europe to centersof infection and evolution in South America, Asia, North America, and Australasia. Thestudy suggested that introductions of the bacteria to new populations occurred very fewtimes, perhaps only once, and then spread from that limited number of individuals. This isin contrast to the possibility that many individuals had carried the bacteria from one placeto another. This result suggests that public health officials should concentrate on quicklyidentifying the contacts of individuals infected with a new strain of bacteria to control itsspread.
A second area of usefulness for phylogenetic analysis is in conservation. Biologistshave argued that it is important to protect species throughout a phylogenetic tree ratherthan just those from one branch of the tree. Doing this will preserve more of the variationproduced by evolution. For example, conservation efforts should focus on a single specieswithout sister species rather than another species that has a cluster of close sisterspecies that recently evolved. If the single evolutionarily distinct species goes extinct adisproportionate amount of variation from the tree will be lost compared to one species inthe cluster of closely related species. A study published in 2007
[4]made recommendations
for conservation of mammal species worldwide based on how evolutionarily distinct andat risk of extinction they are. The study found that their recommendations differed frompriorities based on simply the level of extinction threat to the species. The studyrecommended protecting some threatened and valued large mammals such as theorangutans, the giant and lesser pandas, and the African and Asian elephants. Butthey also found that some much lesser known species should be protected based onhow evolutionary distinct they are. These include a number of rodents, bats, shrewsand hedgehogs. In addition there are some critically endangered species that did notrate as very important in evolutionary distinctiveness including species of deer miceand gerbils. While many criteria affect conservation decisions, preserving phylogeneticdiversity provides an objective way to protect the full range of diversity generated byevolution.
Building Phylogenetic TreesHow do scientists construct phylogenetic trees? Presently, the most accepted method for constructingphylogenetic trees is a method called cladistics. This method sorts organisms into clades, groups oforganisms that are most closely related to each other and the ancestor from which they descended. Forexample, in Figure 12.9, all of the organisms in the shaded region evolved from a single ancestor thathad amniotic eggs. Consequently, all of these organisms also have amniotic eggs and make a single clade,
2. Background on comparative genomic analysis. (2002, December). Retrieved from http://www.genome.gov/100058353. Harris, S.R. et al. 2010. Evolution of MRSA during hospital transmission and intercontinental spread. Science
327:469–474.4. Isaac NJ, Turvey ST, Collen B, Waterman C, Baillie JE (2007) Mammals on the EDGE: Conservation Priorities
Based on Threat and Phylogeny. PLoS ONE 2(3): e296. doi:10.1371/journal.pone.0000296
286 CHAPTER 12 | DIVERSITY OF LIFE
This content is available for free at http://cnx.org/content/col11487/1.5
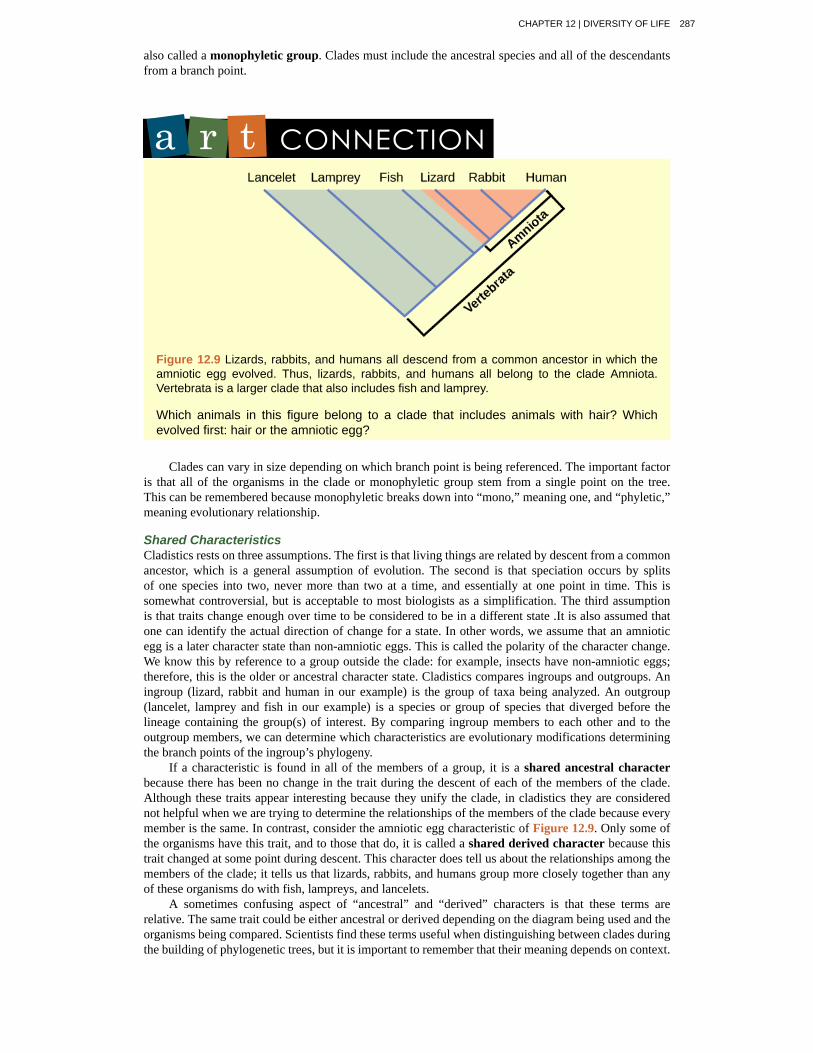
also called a monophyletic group. Clades must include the ancestral species and all of the descendantsfrom a branch point.
Figure 12.9 Lizards, rabbits, and humans all descend from a common ancestor in which theamniotic egg evolved. Thus, lizards, rabbits, and humans all belong to the clade Amniota.Vertebrata is a larger clade that also includes fish and lamprey.
Which animals in this figure belong to a clade that includes animals with hair? Whichevolved first: hair or the amniotic egg?
Clades can vary in size depending on which branch point is being referenced. The important factoris that all of the organisms in the clade or monophyletic group stem from a single point on the tree.This can be remembered because monophyletic breaks down into “mono,” meaning one, and “phyletic,”meaning evolutionary relationship.
Shared CharacteristicsCladistics rests on three assumptions. The first is that living things are related by descent from a commonancestor, which is a general assumption of evolution. The second is that speciation occurs by splitsof one species into two, never more than two at a time, and essentially at one point in time. This issomewhat controversial, but is acceptable to most biologists as a simplification. The third assumptionis that traits change enough over time to be considered to be in a different state .It is also assumed thatone can identify the actual direction of change for a state. In other words, we assume that an amnioticegg is a later character state than non-amniotic eggs. This is called the polarity of the character change.We know this by reference to a group outside the clade: for example, insects have non-amniotic eggs;therefore, this is the older or ancestral character state. Cladistics compares ingroups and outgroups. Aningroup (lizard, rabbit and human in our example) is the group of taxa being analyzed. An outgroup(lancelet, lamprey and fish in our example) is a species or group of species that diverged before thelineage containing the group(s) of interest. By comparing ingroup members to each other and to theoutgroup members, we can determine which characteristics are evolutionary modifications determiningthe branch points of the ingroup’s phylogeny.
If a characteristic is found in all of the members of a group, it is a shared ancestral characterbecause there has been no change in the trait during the descent of each of the members of the clade.Although these traits appear interesting because they unify the clade, in cladistics they are considerednot helpful when we are trying to determine the relationships of the members of the clade because everymember is the same. In contrast, consider the amniotic egg characteristic of Figure 12.9. Only some ofthe organisms have this trait, and to those that do, it is called a shared derived character because thistrait changed at some point during descent. This character does tell us about the relationships among themembers of the clade; it tells us that lizards, rabbits, and humans group more closely together than anyof these organisms do with fish, lampreys, and lancelets.
A sometimes confusing aspect of “ancestral” and “derived” characters is that these terms arerelative. The same trait could be either ancestral or derived depending on the diagram being used and theorganisms being compared. Scientists find these terms useful when distinguishing between clades duringthe building of phylogenetic trees, but it is important to remember that their meaning depends on context.
CHAPTER 12 | DIVERSITY OF LIFE 287

Choosing the Right RelationshipsConstructing a phylogenetic tree, or cladogram, from the character data is a monumental task that isusually left up to a computer. The computer draws a tree such that all of the clades share the same listof derived characters. But there are other decisions to be made, for example, what if a species presencein a clade is supported by all of the shared derived characters for that clade except one? One conclusionis that the trait evolved in the ancestor, but then changed back in that one species. Also a characterstate that appears in two clades must be assumed to have evolved independently in those clades. Theseinconsistencies are common in trees drawn from character data and complicate the decision-makingprocess about which tree most closely represents the real relationships among the taxa.
To aid in the tremendous task of choosing the best tree, scientists often use a concept calledmaximum parsimony, which means that events occurred in the simplest, most obvious way. Thismeans that the “best” tree is the one with the fewest number of character reversals, the fewest numberof independent character changes, and the fewest number of character changes throughout the tree.Computer programs search through all of the possible trees to find the small number of trees with thesimplest evolutionary pathways. Starting with all of the homologous traits in a group of organisms,scientists can determine the order of evolutionary events of which those traits occurred that is the mostobvious and simple.
Practice Parsimony: Go to this website (http://openstaxcollege.org/l/parsimony2) to learn howmaximum parsimony is used to create phylogenetic trees (be sure to continue to the second page).
These tools and concepts are only a few of the strategies scientists use to tackle the task of revealingthe evolutionary history of life on Earth. Recently, newer technologies have uncovered surprisingdiscoveries with unexpected relationships, such as the fact that people seem to be more closely relatedto fungi than fungi are to plants. Sound unbelievable? As the information about DNA sequences grows,scientists will become closer to mapping the evolutionary history of all life on Earth.
288 CHAPTER 12 | DIVERSITY OF LIFE
This content is available for free at http://cnx.org/content/col11487/1.5

analogous structure
binomial nomenclature
branch point
clade
cladistics
class
domain
family
genus
kingdom
maximum parsimony
molecular systematics
monophyletic group
order
phylogenetic tree
phylogeny
phylum
rooted
shared ancestral character
shared derived character
sister taxa
species
systematics
taxonomy
taxon
KEY TERMSa character found in two taxa that looks similar because of convergent
evolution, not because of descent from a common ancestor
a system of two-part scientific names for an organism, which includesgenus and species names
a point on a phylogenetic tree where a single lineage splits to distinct new ones
a group of taxa with the same set of shared derived characters, including an ancestral speciesand all its descendants
a method used to organize homologous traits to describe phylogenies using commondescendent as the primary criterion used to classify organisms
the category in the taxonomic classification system that falls within phylum and includesorders
the highest level category in the classification system and that includes all taxonomicclassifications below it; it is the most inclusive taxon
the category in the taxonomic classification system that falls within order and includes genera
the category in the taxonomic classification system that falls within family and includesspecies; the first part of the scientific name
the category in the taxonomic classification system that falls within domain and includesphyla
applying the simplest, most obvious way with the least number of steps
the methods of using molecular evidence to identify phylogeneticrelationships
(also, clade) organisms that share a single ancestor
the category in the taxonomic classification system that falls within class and includes families
diagram used to reflect the evolutionary relationships between organisms orgroups of organisms
evolutionary history and relationship of an organism or group of organisms
the category in the taxonomic classification system that falls within kingdom and includesclasses
describing a phylogenetic tree with a single ancestral lineage to which all organismsrepresented in the diagram relate
a character on a phylogenetic branch that is shared by a particularclade
a character on a phylogenetic tree that is shared only by a certain cladeof organisms
two lineages that diverged from the same branch point
the most specific category of classification
the science of determining the evolutionary relationships of organisms
the science of classifying organisms
a single level in the taxonomic classification system
CHAPTER 12 | DIVERSITY OF LIFE 289
CHAPTER SUMMARY
12.1 Organizing Life on Earth
Scientists continually obtain new information that helps to understand the evolutionary history of lifeon Earth. Each group of organisms went through its own evolutionary journey, called its phylogeny.Each organism shares relatedness with others, and based on morphologic and genetic evidencescientists attempt to map the evolutionary pathways of all life on Earth. Historically, organisms wereorganized into a taxonomic classification system. However, today many scientists build phylogenetictrees to illustrate evolutionary relationships and the taxonomic classification system is expected toreflect evolutionary relationships.
12.2 Determining Evolutionary Relationships
To build phylogenetic trees, scientists must collect character information that allows them to makeevolutionary connections between organisms. Using morphologic and molecular data, scientists work toidentify homologous characteristics and genes. Similarities between organisms can stem either fromshared evolutionary history (homologies) or from separate evolutionary paths (analogies). Afterhomologous information is identified, scientists use cladistics to organize these events as a means todetermine an evolutionary timeline. Scientists apply the concept of maximum parsimony, which statesthat the likeliest order of events is probably the simplest shortest path. For evolutionary events, thiswould be the path with the least number of major divergences that correlate with the evidence.
ART CONNECTION QUESTIONS1. Figure 12.3 In what levels are cats and dogsconsidered to be part of the same group?
2. Figure 12.8 Which animals in this figurebelong to a clade that includes animals with hair?Which evolved first: hair or the amniotic egg?
REVIEW QUESTIONS3. What is a phylogeny a description of?
a. mutationsb. DNAc. evolutionary historyd. organisms on Earth
4. What do scientists in the field of systematicsaccomplish?
a. discover new fossil sitesb. organize and classify organismsc. name new speciesd. communicate between field biologists
5. Which statement about the taxonomicclassification system is correct?
a. There are more domains than kingdoms.b. Kingdoms are the top category of
classification.c. A phylum may be represented in more
than one kingdom.d. Species are the most specific category of
classification.
6. Which best describes the relationship betweenchimpanzees and humans?
a. chimpanzees evolved from humansb. humans evolved from chimpanzeesc. chimpanzees and humans evolved from
a common ancestord. chimpanzees and humans belong to the
same species
7. Which best describes a branch point in aphylogenetic tree?
a. a hypothesisb. new lineagec. hybridizationd. a mating
8. Which statement about analogies is correct?
a. They occur only as errors.b. They are synonymous with homologous
traits.c. They are derived by response to similar
environmental pressures.d. They are a form of mutation.
9. What kind of trait is important to cladistics?
a. shared derived traitsb. shared ancestral traitsc. analogous traitsd. parsimonious traits
10. What is true about organisms that are a part ofthe same clade?
a. They all share the same basiccharacteristics.
b. They evolved from a shared ancestor.c. They all are on the same tree.d. They have identical phylogenies.
11. Which assumption of cladistics is statedincorrectly?
290 CHAPTER 12 | DIVERSITY OF LIFE
This content is available for free at http://cnx.org/content/col11487/1.5
a. Living things are related by descentfrom a common ancestor.
b. Speciation can produce one, two, orthree new species.
c. Traits change from one state to another.d. The polarity of a character state change
can be determined.
12. A monophyletic group is a ________.
a. phylogenetic treeb. shared derived traitc. character stated. clade
CRITICAL THINKING QUESTIONS13. How does a phylogenetic tree indicate majorevolutionary events within a lineage?
14. List the different levels of the taxonomicclassification system.
15. Dolphins and fish have similar body shapes. Isthis feature more likely a homologous oranalogous trait?
16. Describe maximum parsimony.
17. How does a biologist determine the polarity ofa character change?
CHAPTER 12 | DIVERSITY OF LIFE 291