Embed Size (px)
Citation preview

1260
A FORECAST OF THE EFFECTS OF CONTAINERIZATION ON THE TRANSPORTATION SYSTEM IN THE STATE OF VIRGINIA
by
Daniel D. McGeehan Highway Research Analyst
(The opinions, findings, and conclusions expressed in this report are those of the author and not necessarily those of the sponsoring agencies.
Virginia Highway Research Council (A Cooperative Organization Sponsored Jointly by the Virginia
Department of Highways and the University of Virginia)
In Cooperation with the U. S. Department of Transportation Federal Highway Administration
Charlottesville, Virginia
December 1973 VHRC 73-R27

1261
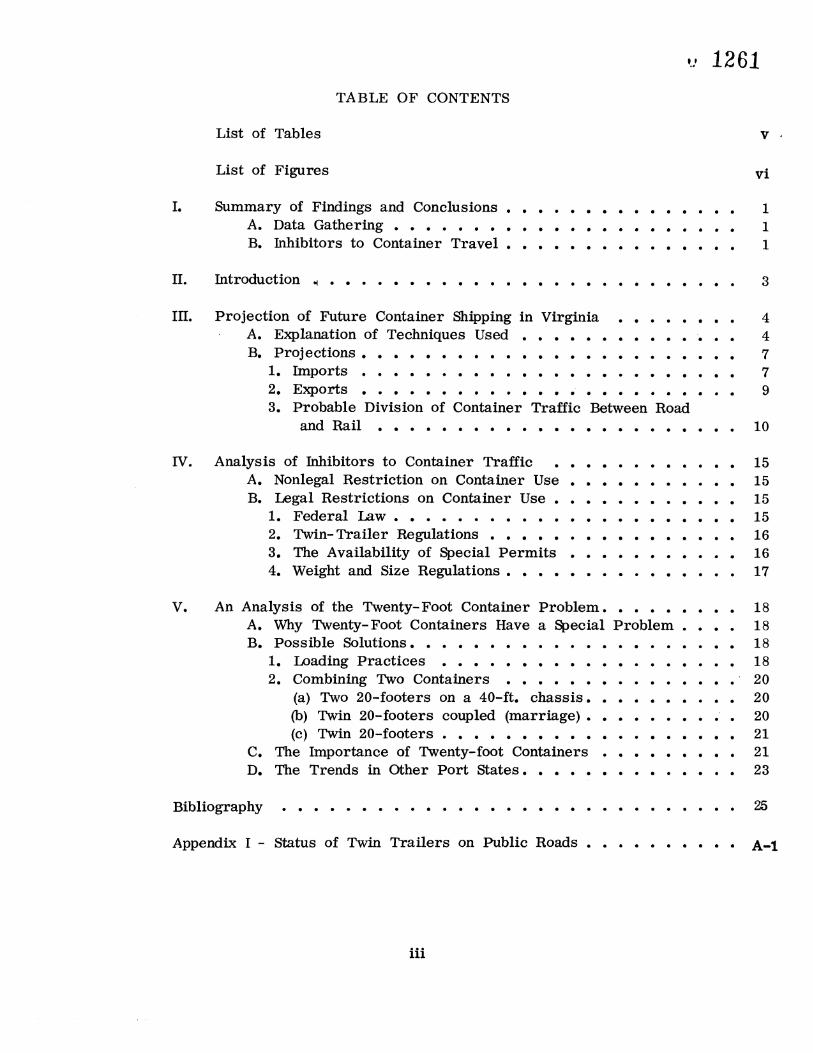
TABLE OF CONTENTS
List of Tables
List of Figures vi
I. Summary of Findings and Conclusions ...............
1 A. Data Gathering
...................... 1
B. Inhibitors to Container Travel 1
II. Introduction • ..........................
3
III. Projection of Future Container Shipping in Virginia 4 A. Explanation of Techniques Used
. 4 B. Projections
........................ 7
1. Imports ........................
7 2 Exports 9
and Rail 10
IV. Analysis of Inhibitors to Container Traffic 15 A. Nonlegal Restriction on Container Use 15 B. Legal Restrictions on Container Use 15
1. Federal Law ......................
15 2. Twin- Trailer Regulations 16 3. The Availability of Special Permits 16 4. Weight and Size Regulations 17
V. An Analysis of the Twenty-Foot Container Problem 18 Ao Why Twenty-Foot Containers Have a Special Problem 18 B. Possible Solutions 18
1. Loading Practices 18 2. Combining Two Containers 20
(a) Two 20-footers on a 40-ft. chassis 20 (b) Twin 20-footers coupled (marriage) 20 (c) Twin 20-footers 21
C. The Importance of Twenty-foot Containers 21 D. The Trends in Other Port States 23
Bibliography 25
Appendix I- Status of Twin Trailers on Public Roads A-1
iii


1262
LIST OF TA B LES
Table No. 1 2 3 4 5 6 7 8 9 10 11 12 13
Total Traffic Generated at Hampton Roads Import/Export Traffic Handled at Hampton Roads Import Data Prediction of Breakbulk/Container Tonnage Destination of Container Imports Sample of Origins of Export Container Movement Destination of Container Movement Containers Handled at Hampton Rail/Truck Movement from Destination to Port (Exports) Rail/Truck Movement from Port to Destination (Import) Containers Handled at Hampton Roads Requirements of the Bridge Law Norfolk International Terminal
Page No.
5 5 7 8 9 9
10 10 12 12 18 19 21
v

1263
LIST OF FIGURES
NOo Expected vs. Actual Movement of Containers Exports 13
Expected vs. Actual Movement of Containers Imports 14
vi

,•. 1264
APPENDIX I
STATUS OF TWIN TRAILERS ON PUBLIC ROADS


1266
I. SUMMARY OF FINDINGS AND CONCLUSIONS
A. Data Gathering
1. When studying containerized freight, data should be collected on the movement of container units. This is not as tautological as it
may seem, because most studies use a 20-foot equivalent method. *
However, using this method the researcher cannot define the ratio between the number of 20-foot containers to the number of 40-foot containers, nor is the number of empties traveling the road defined. However, most data are in total tonnage figures and the 20-foot equivalent must be used.
2. Valid predictions of the use of containers are extremely difficult to make because of the lack of reliable data. The predictions are more problematical at the local level than at the national level due to the margin for error being much smaller.
3. If reliable data on freight activities were available, the development of a mathematical prediction model would still pose problems. During the time of this study, changes in the political and economic arenas took place. Locally, the ports negot•ted for international consolidation, the dollar was devalued, and relations with foreign countries and the nation's export policies were changed. These economic and political fluctuations would be extremely difficult to account for in a traffic model. A thorough understanding of the underlying political and economic implications behind the decisions governing freight movement must be developed. This study was not able to identify these implications, therefore, the predictions suggested in this report are by no means put forward as being comprehensive.
B. Inhibitors to Container Travel
1o Because the states through which most container traffic flows, N.C., W. Va., and Tenn., do not allow twin-trailers, the Virginia twin-trailer prohibition is not considered to be a significant inhibitor to such traffic.
•A-20-foot e•uivalent is the amount of weight assumed to be in an
8 ft. x 8 ft. x 20 ft. container, usually ten tons.

1267
2. Virginia's permit laws allow for flexibility in container
usage, but permits for overweight containers are not requested frequently.
3. The weight laws in Virginia governing axle distances can be considered inhibitors to container movement in theory. However, actual sampling has indicated that less than 1% of the containers entering port are overweight.
C. General Comments
1• Many factors deemed inhibitors to the use of containers will be eliminated as technology within the container industry grows.
2. The use of 20-foot containers is declining in relationship to the use of 40-footers, but is increasing in terms of numbers.
3. The 20-foot containers are not as economical to haul as
larger containers; therefore, motor carriers are reluctant to move
them, and some methods used for moving these containers economically are illegal.
4. As the practice of pooling grows within the industry, the number of empty containers moved is expected to decrease.
5. The laws governing the use of containers are enforced at
a different governmental level for containers of foreign origin .than for those of domestic origin. Foreign shipments are subject to Federal Customs regulations, which are not a consideration in domestic shipments. Consequently, the term "indivisible load" in many state codes may apply to cargo under federal seal, thus qualifying it for special permits in those states.
6. Trends in some port states other than Virginia are
towards liberalizing laws so as to facilitate the movement of container traffic through the ports.
Do General Recommendations
1o Some attempt should be made to standardize regulations throughout the states, if not for all roads at least as they apply to the interstate system.
2. Some method of information exchange between entitites Withi• the container industry and government ought to be developed.

II. INTRODUCTION
To accommodate the intensified industrialization of the areas they serve, Virginia's major port cities- Norfolk, Portsmouth, and Newport News have had to expand their freight handling capacities. And, since a growing percentage of the freight they handle consists of "containerized" shipments, they have had to increase their capacity to handle container traffic. This multimodal traffic into and through the state will probably increase, although the extent to which it will affect highways is not certain. It may travel to a large extent by rail, and thereby decrease the volume of truck traffic on highways. On the other hand, it may go largely by "rubber wheel,' and increase the truck traffic. A third possibility is that small-truck traffic to consolidation terminals will increase, while truck traffic from these terminals to the railhead or the seaport will decrease. In any case, because of the growth of Virginia's ports and the emphasis on containerization, the volume and type of truck traffic in the state will likely change.
The first objective of the study reported here was to predict the change in traffic flow directly related to containerization and the possible effects of the change on the highway system in Virginia.
Many factors have developed which make a prediction of freight movement difficult. Not the least of these is the fact that the movement of containers and freight in general is highly bound up in the political and economic decision-making process. To a large extent, containers move internationally and are thereby affected by international economic activities as well as activities at the state and local levels. Therefore, trends in container movement can be altered by such activities as fluctuations in the value of the dollar, changes in U. S. trade agreements with different countries, embargos, and tariff fluctuations. In addition, the entire system can be affected by local legislation. If a state or local government were to enforce regulations which would make container travel difficult (such as
decreasing limits in weight or size laws), it is possible that the container freight handled by a port in that state or city• would be shifted to another port.
The container industry is a dynamic one, laws are changing, ports are building, and philosophies on international relations are
undergoing changes. It does not appear to this researcher that a
highly predictive model can be developed to account for the changes in such an industry.
1268
1269
For these reasons, the attempt to develop a model for predicting container movement was abandoned. Instead, an attempt was made to combine data developed by the Port Authority with certain raw data culled by the researcher from various files in the Ports. Although these data allow some rough predictions to be made, the information is not purported in any way to be comprehensive.
It should also be noted that the transportation industry has been found to have a strong code of ethics under which the interests of a carrier's shipper are protected. This code, which appears to apply from the smallest carrier up to the steamship lines, makes data gathering a very difficult job. In cases where the data. are obtainable they must be general enough to protect this ethical code. For this reason, different modes of transportation do not know the extent of the market they service. For example, a given truck company will know the amount of freight it hauls out of a given state but will have little information on the total amount of freight hauled by other truckers and by rail. Consequently, it does not know what percentage of the market it serves. Marketing within the transportation industry is highly competitive and the details of transactions are highly valued information.
III. PROJECTION OF FUTURE CONTAINER SHIPPING IN VIRGINIA
A. Explanation of Techniques U.se..d
In addition to the problems previously mentioned, data collection is made difficult by the complexity of the documentation needed to
move a container and the lack of standardization and sophistication in record keeping.
The Virginia Port Authority is attempting to centralize and modernize its record keeping, but due to the recent reorganization of the ports this system has not yet been completed. For this reason the historical data used in this study date only from March 1967. Since the data for fiscal 1972 are not yet available, the• only complete set of data is for the years 1968 through 1970.
The data in Table 1 indicate the total freight movement; however, it is necessary to distinguish between traffic moving from the ports and that moving to the ports. The data in Table 2 breakdown the

imports and exports except for the year 1972, for which data are
not yet complete.
1270
Table 1 Total Traffic Generated at Hampton Roads
1967 a
Totals ""9,•59 20-foot 4,565 40-foot 4,316 Others 578
March 1967 through September 1971 1968 1969 1970 1971 b 1972
23,485 41,' •90 87,016 96, •80 i38,826 12,395 19,964 29,771 28,643 10,505 20,888 45,451 56,483
585 938 11,794 11,154
aMarch- December
bjanuary- September
Total Loaded export 4,003 Empty export 388 Loaded import 1,629 Empty import 3,439
Table 2 Import/Export Traffic
Handled at Hampton Roads !96,7 a 1968 1969 1970 1971 b 1972 9,459 23,485 41• 790 87• 016 96• 280 138,826
11• 346 20,286 40• 384 46• 012 66,636 457 724 2• 798 2,784 2• 776
5,801 11,588 24,437 26,799 37,483 5,881 9• 192 19• 397 20,685 31,930
aMarch- December bjanuary - September CEstimated
From the data in Table 2 for each of the years 1968-1971 it
appears that the ratio of imports to exports is approximately 50%. To fill in the data for 1972, the 50% ratio was used, as were the ratios calculated for empty to loaded containers. Excluding the year 1967,

1271 basically because the ratios appear to be atypical, the ratio of loaded exports to empty exports is 96/4; the ratio of loaded imports to empty imports is 54/46. Since these ratios have held for the last four years, the extension is made to the 1972 data.
On the basis of the above information it can be assumed that approximately half of the total container traffic consists of imports moving from the port to some destination in the United States.
Knowing the total volume of container traffic is not enough; some of this traffic will move by truck and some by rail. The Port Authority shows the following breakdown:
Norfolk International Terminal (NIT)
Mode % Container Movement Rail 10 Truck 90
Mode Rail Truck Unknown
Portsmouth Marine Terminal (PMT) % Container Movement
38 6O
2
The breakdown of total traffic moving from NIT and PMT in 1972 is.
Projected Truck Port No. of Containers Projected Imports Movement NIT 101,933 x (. 50) 50,996 x (. 90) 45,896 PMT 36, 833 x (. 50) 18,416 x (. 60) II, 050 Total 138,826 69,412 56,946
Projected Rail Movement
5,100 7,366
12,466
Applying the 50% export/import ratio and the mode ratio to the data from the NIT and PMT, of the 138,826 containers handled by the ports, it can be estimated that approximately 69,412 containers traveled from the Hampton Roads ports to some destination in the United States in 1972. Of these, 56,946 were transported by truck and 12,466 by rail. For the moment, consider the container movement by truck. •lthough it was

,1272 decided that no routes beyond the boundary of the state of Virginia would be considered, some area beyond that boundary must be selected for use
as an information base for the prediction of future traffic. Consequently a sample of origin and destinations was taken from the ports of Norfolk and Portsmouth.
These data indicate that the states to which most of the container traffic flows are North Carolina, 44% or about 25,056 units; Virginia, 31% or about 17,653 units; South Carolina 8% or about 4,555 units; and Georgia 5% or about 2,846 container units.
This estimate accounts for 80% of the destinations; the other 20% are scattered over 17 other states in magnitudes of less than 2%.
B. Projections
i. Imports
The general cargo tonnage projection developed from the data obtained from the Virginia Port Authority is given in Table 3.
TABLE 3 IMPORT DATA
Year Breakbulk Container Total ]'9'70 a 619,475 327,456 946,931 1971 b 570,113 386,774 956,774 1972 557,865 494• 711 1,052,576 1973 544,182 613• 652 1,157• 834 1974 522, 183 751,434 1,273,617 1975 490,343 910• 636 1• 400• 979 1976 539,377 1• 001,700 1,541,077 1977 569,043 1,056• 793 1• 625,836 1978 600• 340 1,114,917 1,715,257 1979 633,359 1,176,237 1,809• 596 1980 668,193 1,240,931 1,909,124
20-ft. Equiv. 32,746 38• 677 49,471 61,365 75,143 91,064
100,170 105,679 111,492 117,624 124• 093
aActual bFirst nine months

In an explanation of the derivation of these data, the Port Authority said that the "cargo projection was arrived at by calculating the average annual increases of general cargo exports and imports for Virginia as recorded for the years 1966 through 1970 and pro- jecting them on a straight line basis. Annual increases in exports of 7.0% were indicated by this method. This average annual percentage increase was then applied to each year in the forecast through 1980." They further stated that the projections beyond the year 1980 become increasingly vague.
This study did not attempt to go beyond 1980; and no data beyond that year are available.
Based on the research of the Port Authority staff it has been forecasted that 65% of the total general cargo of the port is suitable for containerization. Based on the development of the technology in the field of containerization, it was felt that 70% of all general cargo commodities would move by containers by 1975. Table 4 was developed on the basis of that assumption.
TABLE 4 PREDICTION OF BREAKBULK/CONTAINER TONNAGE Breakbulk Container Per Cent
Year Tonnage Tonnage Totals Containerized 1970 a 1,297,463 868,601 2,166,064 40.1 1971 b 1,203,816 1,203,816 2,255,107 46.6 1972 1,144,011 1,304,151 2,448,162 53.3 1973 1,069,271 1,588,818 2,658,089 59.8 1974 973,760 1,912,631 2,886,391 66.3 1975 923,776 2,210,935 3,134,711 70.5 1976 1,005,317 2,399,522 3,404, 839 70.5 1977 1,055,317 2,517,516 3,573,467 70.5 1978 1,109,158 2,641,373 3,570,531 70.4 1979 1,165,074 2,771,383 3,936,457 70.4 1980 1,223,835 2,907,859 4,131,694 70.4
aActual bFirst nine months

127 By using the 20-foot equivalent factor, the destination data developed
from our sample and applying them to the information in Table 3, a prediction of the increase in container traffic flow to the states served by the Ports was developed and is in Table 5.
TABLE 5 DESTINATION OF CONTAINER IMPORTS
Total Container No. Carolina Virginia Georgia
Year Movement % % % 1970 32,746 14,408 10,151 1,637 1971 38,677 17,015 11,988 1,933 1972 49,471 21,767 15,336 2,473 1973 61,365 27,000 19,023 3,068 1974 75,143 33,062 23,294 3,757 1975 91,064 40,068 28,229 4, 553 1976 100,170 44,074 31,052 5,008 1977 105,679 46,498 32,760 5,284 1978 111,492 49,056 34,563 5,574 1979 117,624 51,755 36,463 5,881 1980 124,093 54,600 38,469 2,605
2. Expo•s The method of predicting the export container movement was much
the same as that for the imports. Once the ratio of export-to-import container movement was established a sample was used to determine the origination of that movement and is shown in Table 6.
TABLE 6 SAMPLE OF ORIGINS OF EXPORT CONTAINER MOVEMENT
State Trips % Virginia 996 62 North Carolina 232 14 Tennessee 170 11 Kentucky 128 8 Florida 21 1 South Carolina 29 2
The states listed in Table 6 represent 98% of the sample taken, the other 2% was spread over 8 other states each having less than 6% of the movement.

Using the data developed for export container movement shown in Table 6 the percentages can be applied to arrive at some idea of the future movement of containers as shown in Table 7.
TA BLE 7 DESTINATION OF CONTAINER MOVEMENT
(By 20-ft. Equivalents) Container
Year Tonnage 1970 541,145 1971 664,517 1972 809,440 1973 975,166 1974 1,161,197 1975 1,300,299 1976 1,397,822 1977 1,460,723 1978 1,526,456 1979 1,595,146 1980 1,666,928
20-ft. Equiv. Va. N. Car.
54,115 33,551 7,576 66,452 41,200 9,-303 80,944 50,185 11,332 97,517 60,460 i3,652
116,120 71,994 16,256 130,030 80,618 18,204 139,782 86,664 19•569 146,072 90,564 20,450 152,646 94,640 21,370 159,515 98,899 22,332 166,693 103,349 23,337
Tenn. Kent. Fla. SoCar. 5,952 7,310 8,904
10,402 12,773
4,329 541 1,082 5,316 665 1,329 6,475 809 1,619 7, 801 975 1,950 9,290 1,161 2,322
14,303 10,402 1,300 2,601 15,376 11,182 1,397 2,796 16,067 11,686 1,460 2,921 16,791 12,212 1,526 3,053 17,546 12,761 1,595 3,190 18,336 13,335 1,666 3,334
As mentioned earlier the breakdown of 20-footers to 40-footers to empties is useful. The data for the years in which actual information is available, given in Table 8, show this comparison.
TABLE 8 CONTAINERS HANDLED AT HAMPTON
Year 20- Foot 40- Foot Empty Total (Both 20's & 40's)
1968 12,395 10,505 585 23,485 1969 19,964 20,888 968 41,790 1970 29,771 45,451 11,794 87,016 1971 28,643 56,483 11,154 96,280
3. Probable Division of Container Traffic Between Road and Rail
Containerized shipments can be interchanged from truck to rail, or
ship, or even to air; some container movements in Virginia are trimodal and many are bimodal. A large proportion of container traffic moving into and through the port of Hampton Roads is carried by truck. Figures obtained from the Virginia Port Authority show that containers moving

through the PMT in the year 1972 were divided 38% by rail, 60% by truck, and 2% by barge or "other." At the NIT, 10% were transported by rail and 90% by truck.
A sample of truck/rail movement taken from information obtained from the Port Authority is shown in Tables 9 and 10o The information given in these tables was taken from a sample of the first quarter data for 1971. The sample was limited to the I•MT because of the high percentage of rail movement from that port.
The researcher expected to find that the greater the distance from the point of origin to the destination, the greater the possibility that freight would be shipped by rail. It seemed reasonable to assume that few, if any, rail shipments would occur within 150 miles of the ports. Figure 1 bears this out. Opinions gathered from interviews suggest that rail shipments under 150 miles were often the result of dispatchers' errors.
The expected truck movement is not so clear. The number of truck trips will decrease when longer distances are involved but the lack of rail service to some areas and higher rail rates are factors which make it difficult to predict precisely which form of transportation will be used. Since much of the container traffic is imported from other countries, unfamiliarity with our transportation system may be another factor which would cause the actual practices of shippers to differ from expectations.
Since the largest portion of movement through the Port of Hampton Roads is by truck, it is important to know what routes would be most affected by this movement. It has been stated earlier that the bulk of the imports move through the Port of Hampton Roads to North Carolina. The routes affected by this movement are U.S. 460 and 58. Container shipments within Virginia travel mainly on 1-81, I-.85, and t-64. If the container shipment predictions above hold true, Uo S. 460 and 58
can be expected to carry approximately 66,726 container trucks by 1975 and 89,142 by 1980.
-11-

1277
Mileage
Table 9
Container Movements by Rail/Truck from Destination to Port
EXPORTS
From Truck % Rail Total
233 379 711 589
1,013 804 406 565 90
753 604 862 851 759 739
1,233
Greensboro, N.C. 232 75 79 25 Columbia, S.C. 29 64 16 36 Nashville, Tenn. 170 77 52 23 Atlanta, Ga. 1 5 18 95 Jackson, Miss. 0 0 1 100 Orlando, Fla. 11 48 12 52 Charleston, W. Va. 8 89 1 11 Rochester, N.Y. 3 33 6 67 Richmond, Va. 471 95 23 5 Bowling Green, Ky. 128 70 55 30 Columbus, Ohio 6 43 8 57 Bloomington, Ill. 0 0 26 100 Lansing, Mich. 0 0 6 100 Birmingham, Ala. 8 35 15 65 Indianapolis, Ind. 3 3 96 97 I)es Moines, Iowa 10 32 21 68
67% of total
1,080 •• 1,515 •'• 435
311 45
222 19
1 23 9 9
494 183 14 26
6 23 99 31
Mileage
Table 10
Container Movements by Rail/Truck from Destination to Port
IlVlPORTS
To Truck % Rail Total
233 379 711 589
1,013 804 565 406 90
753 604 862 851 759 739
1,233
Greensboro, N.C. 252 91 26 Columbia, S.C. 43 98 1 Nashville, Tenn. 9 21 33 Atlanta, Ga. 30 88 4 Jackson, Miss. 13 17 63 Orlando, Fla. 11 48 12 Rochester, N.Y. 3 33 6 Charleston, W. Va. 8 89 1 Richmond, Va. 168 99 1 Bowling Green, Ky. 4 11 34 Columbus, Ohio 5 45 6
Bloomington, Ill. 1 10 9
Lansing, M.ich. 5 100 0 Birmingham, Ala. 0 0 0 Indittnapolis, Ind. 1 100 0
Des Moines, Iowa 0 0 0
533 •. •..
196 •749 •"
33% of total
9 2
79 12 83 52 67 11
1 89 55 90
0 0 0 0
278 44 42 34 76 23
9 9
169 38 11 10
5 0 1 0

1278
-13-

1279
4 /
/ /
/
//
0
-14-

-IV. ANALYSIS OF INHIBITORS TO CONTAINER TRAFFIC
1280
The factors acting as inhibitors to the growth of containerization come basically from two sources: first from within the industry and second from governmental regulations.
A. Nonlegal restrictions on container use
Within the industry itself there are major problems relating to standardization of packaging, documentation, and equipment. Due to the international market in which the container is used, these problems become more complex. These problems are easily understood but probably cannot be quickly solved.
Another major problem within the industry is the lack of equipment. The rigs used in handling a 20-foot container are not sufficient to efficiently handle a 40-foot container. Furthermore, there is a lack of coordination between users in the industry. A container having been emptied at one location must oftentimes be shipped back to its home empty. Experts in the field believe that as the industry grows and makes technological advances, these problems will be cured. Presently, however, the primary restrictions are in the form of governmental regulations.
B. Legal restrictions on container use
I. Federal Law
The federal regulations governing the movement of containers are
no more restrictive than are those concerning other freight except in the
areas of customs and antitrust. Because of the international movement of containers and the fact that the cargo is composed of many small packages, inspection can mean a complete unloading and thus an extra
expense. Because of the concern for freight termed "dangerous goods," e.g., narcotics, the probability of such inspections is becoming much greater.
The "pooling" of containers between modes and users within modes is a growing practice. By pooling, more efficient use of the empty containers and rigs will be accomplished. However, there are various federal regulations, e.g., antitrust laws, which make this practice illegal. Nevertheless, there is strong evidence which suggests that these regulations will be modified to allow some 4egree of pooling in the near future.
-15-

1281 The restrictions at the state level are more important because
they are not standardized throughout the U.S. Consequently a container may travel the majority of its trip legally and be restricted at its destination. Uniform regulations would allow for better handling and greater ease in travel.
Interviews with various truck lines and ship lines indicated that the main problem, and possibly the only problem, at the state level is the regulations on size and weight.
2. 2•¢in- Trailer Regulation
The state of Virginia does not allow twin-trailers on any road; however, although this does restrict the movement of the containers in Virginia, from a view of the transportation system, research has not found this regulation to be a significant inhibitor.
The analysis of regulations on twin-trailers shows that they are not allowed in West Virginia, Tennessee, North Carolina or the District of Columbia. To the extent that freight moves to these states the Virginia restrictions on the use of double-bottoms is not considered an inhibitor.
To the north, Maryland permits double-bottoms and, having a port which is in competition with those in Virginia, could take away some of the container traffic from Virginia. However, according to the sample of destinations mentioned earlier, little of the Virginia ports' traffic goes north. It seems, therefore, that this is only a limited inhibitor because the highly developed ports which serve the Maryland area are attracting the container traffic which fall into their sphere of influence.
To the west, Kentucky limits the travel of twin-trailers to designated highways. Permitting the use of twin trailers iu Virginia would open a route from the ports to the West. However, the great distance from the ports to the western Virginia boundary makes rail shipment more economical than highway shipment. An illustration of variations in state laws governing twin-trailers can be seen by referring to Appendix I.
3. The Availability of Special Permits
Since the state of Virginia does issue permits for oversize and overweight vehicles, regulations on permits cannot be considered as
-16-

inhibitor except for the time restriction on permits for travel on interstate highways.
1282
The regulations for issuing permits in other states are not as clear as other regulations governing the use of containers. Some of the other states surveyed such as Delaware and Maryland, do issue permits; others issue permits only in exceptional circumstances. As a general rule, "indivisible" loads will receive permits. Containers, frequently sealed by customs officials, qualify as "indivisible" loads.
4. Weight and Size Regulations
Since containers are usually "stuffed" in accordance with a well formed commodity flow program, they are often at capacity vis-a-vis weight. Consequently, the weight restrictions at the state level affect container movement more than other methods of moving freight. In comparison with the surrounding states, Virginia has the lowest limit on maximum weights. Virginia's maximum is 70, 000 lb. compared to Delaware with 73,280 lb., Maryland with 73,280 lb., West Virginia with 73,280 lb. (revised in recent amendment July 1, 1972), Tennessee with 72,000 lb., and Kentucky with 73,280 lb. It should be noted that Virginia allows a 5% tolerance; therefore, the legal maximum is 73,500 lb.
Further, Virginia regulations apply a formula which defines limits of weight in relation to the distance between the axles (commonly known as the "bridge law"). The states of Delaware, Maryland and West Virginia use a similar formula. Tennessee, Kentucky and North Carolina do not. This law presents a problem with respect to 20-foot containers. As can be seen in the Maryland version of the law, this problem was solved by exempting the containers carrying international freight into and out of the Port of Baltimore.
However, the Virginia Department of Highways in cooperation with the Virginia Port Authority surveyed a sample of freight hauling vehicles leaving the Hampton Roads Ports. The survey was held from June 5, 1973 to January 30, 1973 surveying 2,515,728 vehicles of which 14,743 were hauling containerized freight. Of the total sample (eo go, all vehicles) there were 7,300 violations or 0.29%; of the containerized freight there were 90 violations or. 61% violations.
Although there is a tendency for containers to be overloaded more
than general freight 61% does not seem to be a significant problem.

1283 V. AN ANALYSIS OF THE TWENTY-FOOT CONTAINER PROBLEM
A. Why Twenty-Foot Containers Have a Special Problem
In Table 11 the relationship of the growth of the movement of 20-foot containers to that of the 40-foot containers can be seen.
Year
Table 11 Containers Handled at Hampton Roads
1968 1969 1970 1971 20-foot 12,395 19,964 29,771 28,643 40-foot 10,505 20,888 45,451 56,483 All others 585 938 11,794 11,154 Total 23,485 41,790 87,016 96,280
Although the ratio of 20-foot containers to 40-foot containers is decreasing, the fact that the movement of 20-footers is definitely increasing cannot be ignored. As mentioned earlier, there are some
definite disadvantages that the 20-foot containers have which are not experienced by the 35-and 40-foot containers. Obvi3usly all containers enjoy the benefits mentioned earlier, i.e., intermoda! transit, minimum handling, and generally reduced costs. Because of the ease with which a container can be moved from one mode of travel to another, the time expended on a 40-foot box is no more than that spent on a 20-foot box. The 40-foot box, however, contains more cargo and thus returns
more profit for time expended. This explains the truckers' reluctance to haul the 20-footer over a distance greater than 150 miles.
Thus it can be seen that the 20-foot container has intrinsic limitations, but the problems go further. Many of the solutions to these intrinsic problems are prohibited by the Virginia weight and size limitations.
B. Possible Solutions
1. Loading Practices
The 20-foot box loaded to capacity would in all probability not exceed the maximum gross weight allowed by law. The actual weight •f any one shipment, of course, depends on the goods being carried; e.g., frozen meat would be heavier than textiles. The carrying capacity of one of these boxes is 20 long tons, or 38,080 lb. This
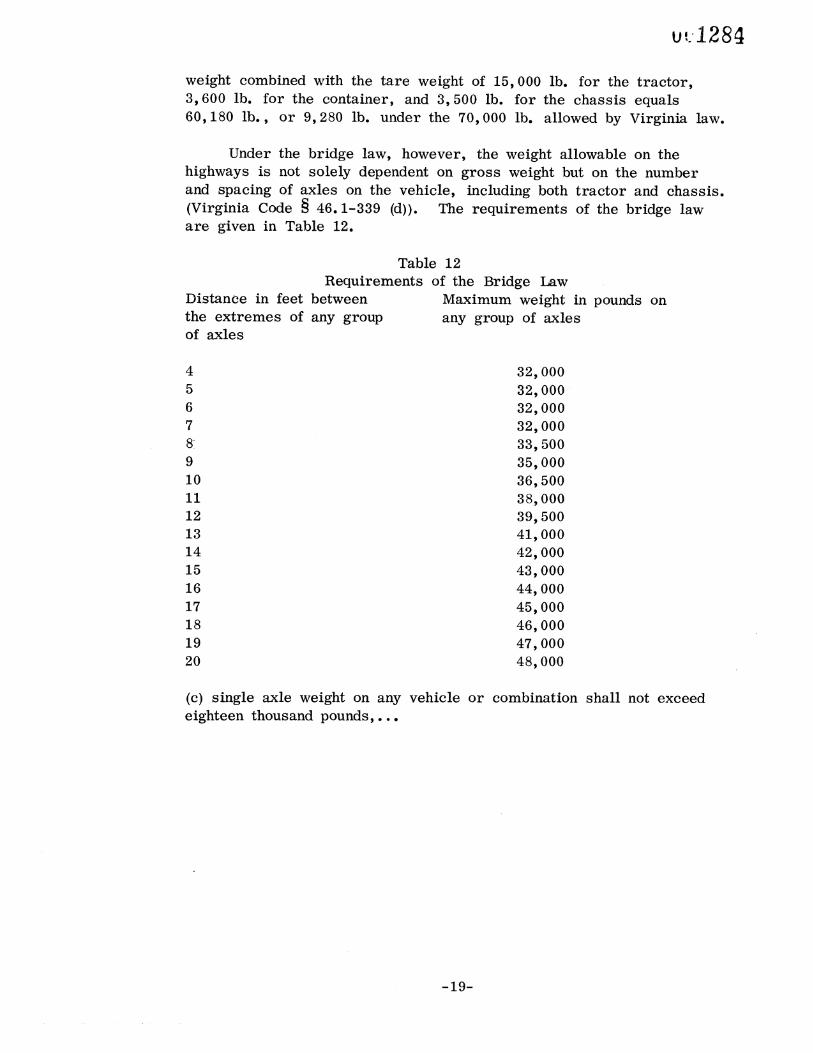
weight combined with the tare weight of 15,000 lbo for the tractor, 3,600 lb. for the container, and 3,500 lb. for the chassis equals 60,180 lb., or 9,280 lbo under the 70,000 lbo allowed by Virginia law.
Under the bridge law, however, the weight allowable on the highways is not solely dependent on gross weight but on the number and spacing of axles on the vehicle, including both tractor and chassis. (Virginia Code § 46.1-339 (d)). The requirements of the bridge law are given in Table 12.
Table 12 Requirements of the Bridge Law
Distance in feet between Maximum weight in pounds on the extremes of any group any group of axles of axles
4 32,000 5 32,000 6 32,000 7 32,000 8: 33,500 9 35,000 10 36,500 11 38,000 12 39,500 13 41,000 14 42,000 15 43,000 16 44,000 17 45,000 18 46,000 19 47,000 20 48,000
(c) single axle weight on any vehicle or combination shall not exceed eighteen thousand pounds,...
-19-

Again, because of the 20-foot conta•er•s s•ze, the number of axles on the chassis used to haul the box and the d•stance between these axles make it impossible to legally haul a loaded 20-foot container on a normal truck.
2. Combining Two Containers
A second method of making 20-footers economically attractive is to combine two 20-foot boxes to enable the combination to be hauled at near the profit margin realized for 35-and 40-foot boxes. The combining of these 20-foot containers can be done in one of three ways°
(a) Two 20-footers on a 40-foot chassis
Two 20-footers can be placed on a chassis designed for one 40-footer. The major problem with this arrangement is that many times the two containers will have different destinations and at some intermediate location they must be separated. The-separation of these containers requires a crane, which results in additional handling and time expended. For this reason this method, although legal, is probably not profitable.
(b) T•vin 20-foot containers coupled (marriage)
Two 20-foot containers can be coupled together to form a single traveling unit. The coupling is inserted in the end circular openings of the bottom corner fittings of abutting containers and twist-locks into place. This coupling remains in tension. A top fitting serves
as a compression member. Specially designed chassis are used to transport the coupled containers over the road.
This method has the same problem as the previous method, i. eo, the possible need for separation at some intermediate point. However, to uncouple these containers it is not necessary to use a
crane, but a level platform is desirable so that the couplings do not bind when being removed. It is true that extra time is necessary to perform the uncoupling but when compared with the economics of hauling a single unit this extra time is insignificant.
This method is therefore preferable to the one described above. However, in some states, as in Virginia, this method is probably not
a legal alternative. The Code of Virginia (§ 46.1-335) states the following:
No motor vehicle shall be driven upon a highway drawing or having attached thereto more than one motor vehicle, trailer or semitrailer unless such vehicle is being operated under a special permit from the State Highway Commission.,...
-20-

(c)• •[•i.•_•_20 footeFs
Two 20-footers can be combined by means of a converter dolly and be drawn by a t•'uck tractor. This method, because of the ease with which the units can be uncoupled, is preferable to the two methods previously mentioned. Once again, however, difficulties would be encountered under the re•lations of many states including Virginia. (See § 46.1-335 above).
C. The Importance of Twenty-Foot Containers
The obvious question to be asked is. Why, with all of these drawbacks, is the use of 20-foot containers increasing? There are two basic reasons why 20-foot containers are used; the first revolves around the factors of time and commodity, the •the.v 1•.::;.•. to.do with transportation conditions in foreign countries.
The capacity of a 20-foot container allows it to be filled and ready for shipment much sooner than a 40-footer.. For a company that produces small items (e. go toys) the time saved by stuffing and shipping a 20-footer rather than waiting to fill a 40-footer can be an
advantage. Other shippers dealing in perishable commodities (e. g., frozen meat) need the extra time saved by the shorter loading period required for the 20-footers.
The road conditions in many foreign countries restrict the use of the larger 40-foot containers. The weight of a 20-footer can be handled with a smaller tractor, which is an advantage in some foreign countries. Obviously, in countries with modern rail systems, the condition of the roads will have less effect on the use of larger containers.
Table 13 illustrates the consistency of containers which have entered the country through one port in the year 1971.
Table 13 Norfolk International Terminal
Year--- 1971 Import
Loaded 20-ft. 7,380 40-ft. 13,977
Empty 20-ft. 3•363 40-ft. 10• 536
-21-

1287 From the table it can be seen that a substantial number of 20-foot containers are entering the Norfolk port. Of the total, about 46% are
empty and would present no weight problem.
There are various reasons why empty containers are-shipped into this country. Most of these containers have been unloaded at their foreign destinations and are being returned to the owner. Some of them, however, have been manufactured overseas and are being shipped to buyers in this country. Although the number of empties is sub- stantial in relationship to the total, it is expected that it will .drop sharply in the near future. One of the greatest problems within the container industry is that heretofore there has been no .use of pooling arrangements. The exchange of containers by different owners has only recently become a serious objective. As the problems presently inhibiting the growth of this practice are resolved, the more efficient
use of these boxes will be realized and the numbers of empty containers will be proportionately reduced.
As container transportation is perfected, many problems will be eliminated. Special chassis will be in sufficient use to reduce the present carrier reluctance to ship 20-foot containers, fewer empty containers will travel over the road, and possible more containers will be moved by rail. Until that day, however, the problems of container freight will be shared between the industry and the governments having jurisdiction over their movement.
Special problems are involved in the international shipment of containers. Some problems are minor, such as elaborate documentation and proof of ownership. Other problems are much more significant. For example, when a motor carrier considers picking up cargo in a
domestic area he has the options of picking up a full load, part of a
load, or no load. The carrier must determine the weight of that load and act accordingly. He must take into account only the law of those
states he will pass through. On the other hand, a carrier picking up
a containerized shipment which has originated in a foreign country must
pick up the freight as is or not pick it up at all; he cannot pick up a
partial load. This is because most overseas shipments are under Uo S. Customs' seal; once this "red ball" seal is placed on a container the
only agency authorized to break the seal is U.S. Customs. The trucker
must deal with international as well as state laws. He is faced with
a choice of illegally transporting the overweight box or turning the job down. In the latter case• the port must find another method of moving these boxes, i.e., barge or rail, and faces a possible congestion problem.

D. The Trends in Other Port States
The port states of New Jersey, New York, Delaware, and Maryland have modified their laws in recent years to permit the hauling of the double-bottom trailer. More recently Maryland has dropped the "bridge law" requirement on containers of foreign origin.
Additionally, in recent years some port states have modified their highway laws to permit the movement of some problem freight such as 20-foot containers. Whether this modification was instigated by the ports or if it was implemented primarily to allow traffic to
move out of the ports and thus make them more competitive with other port states is not known at this time.
Interviews and other investigation have suggested that restriction due to the bridge law is a definite inhibitor to the movement of 20-foot containers.
-23-


BIB LI(X3 RA P HY u, 1289
Commonwealth of Vlrgiala, Re•ort of tho Vtrghfla Metro•ol!tan Areas Tz.ansp_o__,•.•.__tto__•n •_•h:•J.y Cornn:t•ioa to. the_ G.•_gy._._e•_:ng_r, 1Rlchmoad: Department of PurchRses & ,Supply, 1•70.
Commonwealth of Virginia...Report_ of th_• ••.n Tr•_ile1\ st•y Commission _t0__the _G0vern•or• Richmond: Department of Purchases & •pply• 1970.
Department of Tranaportation, _.Cpnt•ain_er: •te..rc.han_ge ..and Poo]ing._Arrsnzement_.•_. Washington: Bo•z, Allen and Hamilton, Inc.', 1970,
Department of Transportatioa, Eyaluat.i.0• 9,[ V0•e-ntta! Effe.•tS O. f ..U.,.St,Frcl£-ht: Tr•nsportatl0n_ Adv•aces_ _on_Highway_R.equirementso Washington: U.S. Government Printing Office, 1972.
Development Services and Business Research. Enforcing ,we.lght_R.e•t_rict!0ps .on__Eastern Kcntu_cky _Road_s. Kentucky: UniversRy of Kentucky. 1971.
Federal Register No. 208, Freight R.ate: ah.d_ Passen•er..,Fare. mcrease.S ICe Proposal. Washington: U.S. Government Printing O/rice, 1972.
Federal Register No. 219, Pangerous cargoes_. Washington: U.S. Government. Printing Office,. 1972.
Federal Register No. 231, Hijacking. Washington: U.S. Government Printing Office, 1972.
Federal Register No. 231. •psp.0rtation pf. Diseased. An_h•=a!=s. Washin•on: U.S. Government Printing Office, 1972.
Highway Research Board, Special Report 120, Urban_Commodi_tT Flow. Washin•on: HRB, 1971.
Highway Research Record No. 348, __p•nn•...ng and E_,ra_luatten.. of .Tra:nsportatio_n Systems. Washington: Highway Research Boa.rd, 1971.
Idaho Dspartment of Highways, Highway Operatig_ns wit.h .Truck T•ller Double and Triple Units. Idaho: Research Division Department of Highways, 1964.
Jack Faucett Associates, Pro]e_cti0ns .of, •C0ntainerizat.•n .Freight Shipments Between East Coast States. Maryland: Jack Faucett Associates, Inc., 1971.
Marvin • Manheim, Practical .!mplicatigns_pf. s°me .Fun.•.da•en•l=.P!op¢ •les of Travel Demand Models. Massachusetts: Transportation Systems Dlvlslon. 1972.
25
•eyer, J. R. and Strasthetn-., M. R., Techniques of Transport Phnnin•, Vol. I, Chapter 10. Pr•ici•x•d•_•r•ject E•aluat•0n. •s••oa: B•ok.•gs •stf•tton, 1971.
NTIS, U. S. Department of' Commerce, •.e._ Impact of _Ma.rJtim,e •?nta•_eriz•..t•.oa _op::th•_.U, S:. Tr•ns•or•:.•'•¢on •,stem. Vol.:.-. I-Ii, California: Manalytics Inc., 1972.
Stanfo.-xi Research [ustltute, .Fre.t•ht_Trhn,•portati•aand Ft.•u•e Hig.hwa..v Requiremca•s. Califorala: 5RI• 1972.
Subcommi•ee ou Roads, •cp0sed_.197•_H•.ghway _I.eg!slationo Washington: UoSo Government Printing Offlce, 19•2o
Subcommi•ee on Roads, Use....of Highway •s foT..publlc Tra•n_sportailon, Washlngton: U, S, Government Prlntlng OHice, 1972.
Tabak, Herman D,, Ca.rgo ,conta•n.ers, Maryland: Corned Maritime Press, Inc,
• 1970,
Transportation Research Forum. Richard B, Cross Co., 1969.
papers --_Tenth Annual Meeting.
Transportation Research Forum. l>roce.edings T•,.e ,lf•._.A.nnual Meeting. Indiana: Richard B. Cross Co., 1971.
Twin Trailer Study Commission, Report.on.. •e Ope.ratlonal and safet• Characteristlc• of T•dn Trailer .Combinations. Washington: American AssoCiation of •cate Highway O•Zlcials, 1969.
U. S. Department of Commerce, •..S•.,dy of,.the poten.tia,!..Economi c _Impact pf _P.r.op.o•ed •?v.clopmen•!_ ..F__.r_.•ways in the Coastal Plains Region, Wash•gton: Coastal Plains Regional Commissloa• 1970.
U. S. Department of Commerce, Container Interchange and Pooling F•cl!ities_ in Uhtted States Export-Import Traffic. New York: A, T, Kearney and Company, Inc., 1971.
U, S. Department of Agriculture, Effe__._cJs _of State•an•d Local Regulations_ on Interstate Movement of A•icu!•__r•..l. Products by_Highway. Washington: U. S, Government Printing Office, 1561.
Virginia Port Authority, .The ..port_. s 0f...Greater. Hampton .Ro_ad.s: Annual .- •sy_•. Norfolk:. Hampton Roads Maritime Association, 1971,
Winch, David M,, The Econ0..n-dcs. o..f_HighwaY P!snnlng. Canada: University of Toronto Press, 1963.
26