Embed Size (px)
Citation preview

Annual Report 20051200 Riverplace BoulevardJacksonville, FL 32207
www.steinmart.com
DirectorsJay SteinChairman of the Board,Stein Mart, Inc.
Michael D. FisherPresident & Chief Executive Officer,Stein Mart, Inc.
John H. Williams, Jr.Vice Chairman of the Board;former President & ChiefExecutive Officer, Stein Mart, Inc.
Alvin R. “Pete” CarpenterFormer Vice Chairman,CSX Corporation
Linda McFarland FarthingFormer President and Director of Friedman’s Inc. and Cato Corporation
Mitchell W. Legler, Esquire,Kirschner & Legler, P.A.
Michael D. RoseFormer Chairman of the Board,Gaylord Entertainment
Richard L. SisiskyPresident, The Shircliff & Sisisky Company
Martin E. “Hap” Stein, Jr.Chairman and Chief Executive Officer,Regency Centers Corporation
J. Wayne WeaverChairman of Shoe Carnival, Inc.;Chairman, Chief Executive Officer and majority owner of theJacksonville Jaguars
James H. WinstonChairman, LPMC, a real estate invest-ment firm based in Jacksonville, Florida
For more information about the Board ofDirectors, its committees and corporategovernance, go to www.steinmart.com,and click on Investor Relations.
Executive OfficersMichael D. FisherPresident & Chief Executive Officer
James G. DelfsSenior Vice President & Chief Financial Officer
D. Hunt HawkinsSenior Vice President,Human Resources
Michael D. RaySenior Vice President,Director of Stores
Vice Presidents, CorporateW. Michael AllenReal Estate
David W. BotheMarketing, Advertising and Sales Promotion
Ronald G. HughesOperations
Joseph MartinolichInternal Audit, Safety and Security
Roseann McLeanPlanning and Allocation
Clayton E. Roberson, Jr.Controller
Matthew K. Votaw Information Systems
Vice Presidents, Regional Directors of StoresSteven M. BermudezRobert H. BrooksJim C. LoveJ. Michael MeltonDiane Tarman
Vice Presidents, General MerchandisingManagersWilliam A. MollLadies’, Boutique, Dresses andIntimate Apparel
John H. PennellMen’s, Children’s and Accessories
M. Kassie JonesGifts and Linens
Corporate Headquarters1200 Riverplace BoulevardJacksonville, FL 32207(904) 346-1500www.steinmart.com
Annual Meeting of StockholdersThe Annual Meeting of Stockholderswill be held at 2 p.m. on Tuesday,June 6, 2006 at The Davis Gallery ofthe Times-Union Center for thePerforming Arts, 300 W. Water Street,Jacksonville, Florida.
Common Stock InformationThe Company’s common stock tradeson The Nasdaq Stock Market® underthe trading symbol SMRT. OnMarch 31, 2006, there were 1,111stockholders of record.
Transfer Agent & RegistrarMellon Investor Services LLCOverpeck Center85 Challenger RoadRidgefield Park, NJ 07660-21081-800-756-3353www.melloninvestor.com/isd
Legal CounselMitchell W. LeglerKirschner & Legler300A Wharfside WayJacksonville, FL 32207
Independent Registered Public Accounting FirmPricewaterhouseCoopers LLPJacksonville, FL
Copies of the Annual Report, Form 10-Kand other financial information are available on the investor relations portion of our website (www.steinmart.com) and withoutcharge by writing to the CorporateHeadquarters address above.(Attention: Stockholder Relations)
Investor RelationsSusan Datz EdelmanDirector, Stockholder Relations(904) [email protected]
Stein Mart® is a federally registered trademark ofStein Mart, Inc.
The production of this Stein Mart annual reportwas based on a Company commitment to providecurrent and prospective stockholders with accurate,thorough, and timely information about the Compa-ny while incurring only modest production costs.
Message from the Chairman:The progress our Company continues
to make is particularly gratifying to me.
More importantly, I am excited about
the even greater potential we see in
front of us.
We are focused on being more productive
as an organization and returning the
fruits of that productivity to shareholders.
In 2005, our Board of Directors chose
to begin paying a quarterly dividend to
shareholders. We were able to make
this commitment–in addition to our
resolve to grow our store network and
repurchase common stock as needed–
because of what we believe is the
underlying opportunity still ahead.
This Company is clearly gaining
strength as a result of the initiatives
crafted over the past few years, and we
believe the best is yet to come.
On behalf of the Board of Directors,
I thank you for your continued support
and interest in our Company.
Jay Stein
Chairman of the Board
Shareholder Information
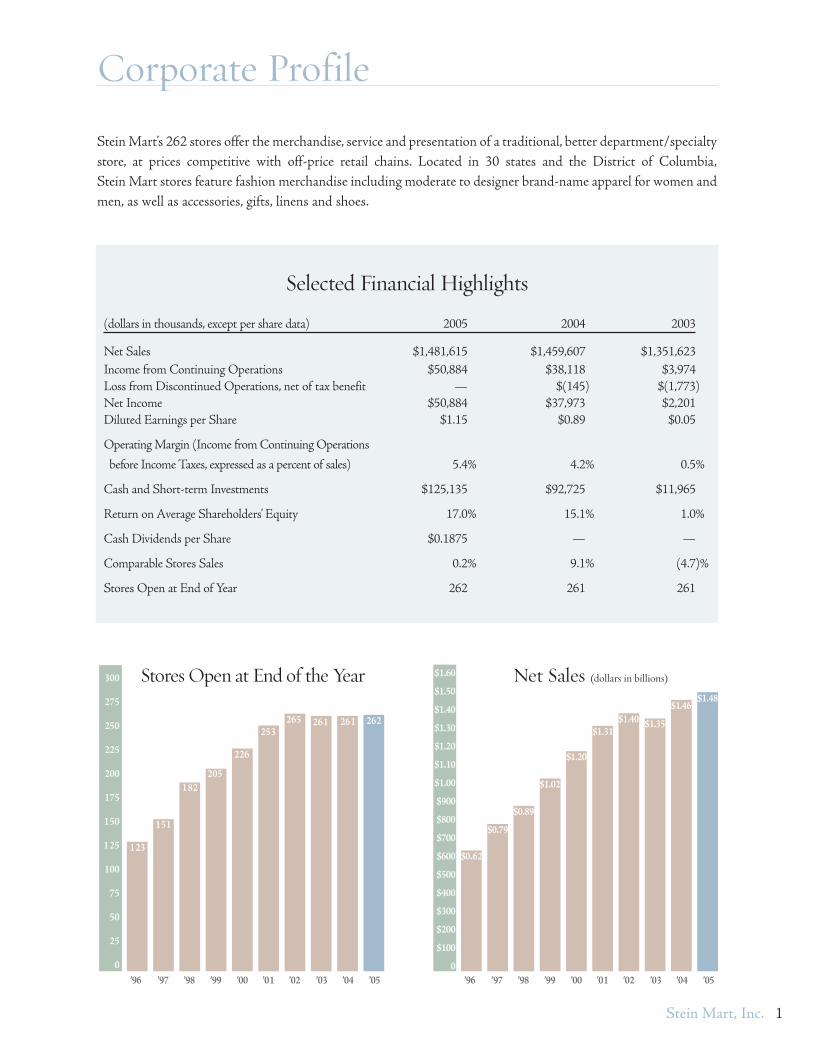
Stein Mart’s 262 stores offer the merchandise, service and presentation of a traditional, better department/specialtystore, at prices competitive with off-price retail chains. Located in 30 states and the District of Columbia,Stein Mart stores feature fashion merchandise including moderate to designer brand-name apparel for women andmen, as well as accessories, gifts, linens and shoes.
Stores Open at End of the Year
’96 ’97 ’98 ’99 ’00 ’01 ’02 ’03 ’04 ’05 ’96 ’97 ’98 ’99 ’00 ’01 ’02 ’03 ’04 ’05
Net Sales (dollars in billions)$1.60
$1.50
$1.40
$1.30
$1.20
$1.10
$1.00
$900
$800
$700
$600
$500
$400
$300
$200
$100
0
1
Selected Financial Highlights
(dollars in thousands, except per share data) 2005 2004 2003
Net Sales $1,481,615 $1,459,607 $1,351,623Income from Continuing Operations $50,884 $38,118 $3,974Loss from Discontinued Operations, net of tax benefit — $(145) $(1,773)Net Income $50,884 $37,973 $2,201Diluted Earnings per Share $1.15 $0.89 $0.05
Operating Margin (Income from Continuing Operations
before Income Taxes, expressed as a percent of sales) 5.4% 4.2% 0.5%
Cash and Short-term Investments $125,135 $92,725 $11,965
Return on Average Shareholders’ Equity 17.0% 15.1% 1.0%
Cash Dividends per Share $0.1875 — —
Comparable Stores Sales 0.2% 9.1% (4.7)%
Stores Open at End of Year 262 261 261
262261261265253
226
205182
151
123
$1.48$1.46
$1.35$1.40$1.31
$1.20
$1.02
$0.89
$0.79
$0.62
300
275
250
225
200
175
150
1 25
100
75
50
25
0
Corporate Profile
Stein Mart, Inc.

2
Dear fellow shareholders,We are pleased to report that 2005 was Stein Mart’s most profitable year ever. Net income rose 34.0% to $50.9 millionon a virtually identical store base to last year. Sales were slightly ahead of 2004’s intense pace, gross margins continued toimprove and our productivity within the stores was enhanced. The progress achieved in 2005 was built on the foundationof the many initiatives that we have been developing for three years: stricter inventory discipline, better merchandise andmarketing synergy, and a more productive store base. As a result, we ended the year with a 5.4% operating margin,demonstrating our ability to make real progress toward the goal of a 7% operating margin.
Here are some of the highlights of the year:
• Achieved record earnings per share of $1.15 as compared to $0.89 per share in 2004
• Increased gross profit $27.4 million for the year, on a modest 0.2% comparable store sales increase
• Improved the gross margin rate 150 basis points, driven by improved mark up and decreased markdowns
• Attained operating income of 5.4% of sales, up from 4.2% of sales in 2004
• Incurred no debt, and ended the year with cash and short-term investments of $125 million
• Initiated a $0.0625 per share quarterly cash dividend to shareholders
• Repurchased 836,550 shares of Company stock
• Opened seven new stores and relocated one, and closed six under-performing locations for a total of262 stores open at year-end
• Began a major investment phase in upgraded technology and store improvements with $34.8 million incapital expenditures
• Purchased Oracle/Profit Logic markdown optimization software to enhance markdown decision-makingand enable regional markdowns
• Rolled out the Oracle/360 Commerce technology to speed transactions in 68 stores
• Conducted extensive market research to reveal merchandise category opportunities
• Began the transformation of the Home area, led by a new merchandising team
Simply put, we did a better job for our customers this year. We provided them with engaging fashion at prices thatmade them feel good, not guilty. We gave them a pleasant shopping experience where their presence was recognizedand rewarded. We respected their time and energy by offering a shopping environment that was understandableand accessible, whether they had ten minutes or two hours to make a purchase. And we always tried to give thema little something ‘extra’ to underscore why they love to tell their friends, “I got it at Stein Mart.”
Stein Mart, Inc.
Letter to Shareholders, 2005
We did have our challenges in 2005. The Home area of our business continued to languish during the year, even as weprepared to overhaul the division to make it more compelling. The transition of the Home area resulted in a lack ofhome and seasonal merchandise during the important fourth quarter that negatively impacted our holiday sales. Andof course, our Gulf Coast and Florida business was severely interrupted by hurricane activity in the fall, closing severalof our stores for weeks, and in New Orleans, two stores remained closed for months.
Looking forwardThere are a number of exciting initiatives underway for Stein Mart in 2006–all geared to provide support for ourstated objective of a more productive, profitable organization. On these and the next few pages, we hope you willbecome familiar with some of the outstanding opportunities for us to make continued progress.
The following initiatives are expected to have strategic prominence in the Company’s operations in 2006:
• Fully integrate Oracle/ProfitLogic markdown optimization software, which should begin to positivelyimpact gross margin in the second half of 2006
• Expect to more aggressively open new stores, with the majority of the openings in the 3rd quarter of2006. A total of eight under-performing stores are planned to close.
• Introduce the newly-assorted Home area (Gifts and Linens) by the end of the 1st quarter of 2006 andcontinue to fine-tune these divisions going forward
• Eliminate the children’s apparel business beginning in the 2nd quarter of 2006, to be replaced by additionalcategories of ready-to-wear and intimate apparel
• Introduce a co-branded credit card to create new marketing opportunities and elevate the Preferred Customer program
• Complete the installation of Oracle/360 Commerce technology and equipment in all stores to speedtransaction time and enhance customer service
Our plans for 2006 are to improve our year-over-year results through an increase in comparable store sales andnew store openings as well as gross margin expansion resulting from the implementation of markdown optimizationsoftware. We anticipate spending approximately $60 million to open new stores, remodel existing stores and installequipment and technology relating to the Oracle/360 Commerce product. We plan to ramp up our new store open-ing program and pay a quarterly dividend while continuing to repurchase stock in order to offset the dilutive effectof stock options.
We remain enthusiastic about Stein Mart’s prospects for the future. Our customers, who are incredibly loyal, inspire us topush new boundaries in providing creative, compelling fashion at prices that represent true value. The more than 14,000associates who work tirelessly to satisfy our customers and support our stores are dedicated to providing a superior shop-ping experience. And you, our valued shareholders, continue to support us as we strive to make the Stein Mart organiza-tion an even more rewarding investment going forward. Thank you for your trust and your confidence.
Michael D. Fisher,President and Chief Executive Officer
3Stein Mart, Inc.

On the next few pages are details regarding some of the many initiatives underway or planned for Stein Martover the next year.
Our MerchandiseStein Mart shoppers aren’t shy; they know what they like and what they don’t. Last spring we interviewed thousandsof our customers as part of a market research project, and they gave us some pretty good ideas about where tointensify our offerings, and where to pull back.
The results of the feedback confirmed thatour customers strongly identify withnearly all of our product offerings. Themix of our merchandise is substantially inline with their shopping preferences.
The fashion apparel assortment resonateswith our target customers, whether it is inladies’ ready-to-wear or menswear. Theylook to us for newness in accessories andshoes. As we suspected, they are slightlyless enthusiastic about our children’sapparel. Our customer is an ardent sup-porter of our Home area–gifts &linens–but only when it adds somethingfashionable and new to his or her sur-roundings or social scene.
Armed with this knowledge, we will continue fine-tuning ourmerchandise assortments in 2006. This process actually started lastyear, with a new Home merchandising team providing an updatedperspective. We are downsizing parts of the assortment (i.e. utility
bedding, some tabletop) infavor of more dynamic andfashion-oriented categories.The Home area will featuredefinable “stories” being toldthrough bedding, furnitureand accessories and whichcan be layered and re-formulated as new mer-chandise arrives. Accentfurniture and luxurybedding continue to leadthe way for relevance to thecustomer’s living quarters.
Gifts &Linens
Shoes(leased
department)
Children’s 2%
Other 2%
Ladies’&
BoutiqueApparel
Ladies’Accessories
Men’s 19%
42%
13%
15%
7%
Highlights of 2005
4 Stein Mart, Inc.
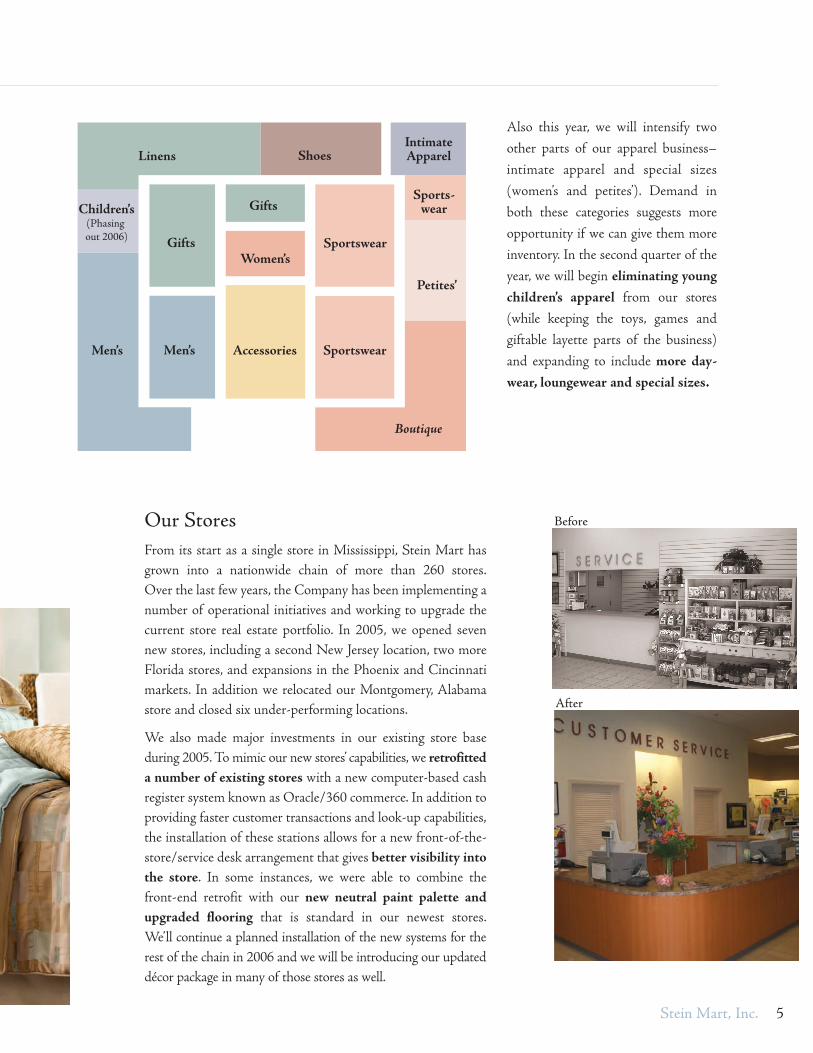
Our StoresFrom its start as a single store in Mississippi, Stein Mart hasgrown into a nationwide chain of more than 260 stores.Over the last few years, the Company has been implementing anumber of operational initiatives and working to upgrade thecurrent store real estate portfolio. In 2005, we opened sevennew stores, including a second New Jersey location, two moreFlorida stores, and expansions in the Phoenix and Cincinnatimarkets. In addition we relocated our Montgomery, Alabamastore and closed six under-performing locations.
We also made major investments in our existing store baseduring 2005. To mimic our new stores’ capabilities, we retrofitteda number of existing stores with a new computer-based cashregister system known as Oracle/360 commerce. In addition toproviding faster customer transactions and look-up capabilities,the installation of these stations allows for a new front-of-the-store/service desk arrangement that gives better visibility intothe store. In some instances, we were able to combine thefront-end retrofit with our new neutral paint palette andupgraded flooring that is standard in our newest stores.We’ll continue a planned installation of the new systems for therest of the chain in 2006 and we will be introducing our updateddécor package in many of those stores as well.
Also this year, we will intensify twoother parts of our apparel business–intimate apparel and special sizes(women’s and petites’). Demand inboth these categories suggests moreopportunity if we can give them moreinventory. In the second quarter of theyear, we will begin eliminating youngchildren’s apparel from our stores(while keeping the toys, games andgiftable layette parts of the business)and expanding to include more day-wear, loungewear and special sizes.
Linens
Accessories Sportswear
Sportswear
Sports-wear
Boutique
Petites’
Women’s
Gifts
Gifts
Shoes
Men’sMen’s
Children’s(Phasing out 2006)
IntimateApparel
5Stein Mart, Inc.
Before
After

In 2006, we plan to expand more aggressively in a number of bothnew and existing markets, representing the largest annual additionof new stores to the chain since 2001. Our new store site selectionprocess, which has been extensively refined, points toward a successfulclass of new additions to the Stein Mart chain. Since we embarked onthe new site selection process, new locations have averaged $5.0 millionin their first fiscal year, a significant increase from the $4.0-$4.5 millionin sales previously achieved. We are excited about the prospects ofpushing further into the Chicago market and the Northeast, and areequally enthusiastic about adding locations in our core footprint,namely Texas, Florida and the Carolinas.
Highlights of 2005
42*
17
12*
10
10
10
108
5
5
40*
4
7
1
19*2
2
1
11
1
19*
6*
2*
3
3
3 3
2*
* Additional stores will open in 2006
6 Stein Mart, Inc.

Outreach to CustomersStein Mart’s transition to a cohesive blend of brandingand promotional advertising, using television, colorcirculars that are both mailed and inserted in newspapers,and direct mail has been successful, but we believe it isstill evolving. In 2006, we intend to create more induce-ments for customers and potential customers to visit ourstores. You should expect to see a new dimension in ourtelevision advertising, where our “shopping sisterhood”theme has been so identifiable.
We are excited about the prospects of converting ourmany loyal shoppers into loyal credit card shoppers whenwe begin to offer a co-branded credit card later this year.In addition to being a convenience for our customers, itwill give us new avenues to provide more relevant contactso that we may better serve them in the future.
Our SystemsAs we strive to become better at deliveringthe right merchandise at the right price at theright time, we have added a new tool in ourmerchandising planning and allocation arse-nal. In the fall of 2005, we purchased Oracle’sProfitLogic markdown optimization soft-ware. This specialized product will help ourmerchants make markdown decisions at amore strategic level to gain the greatestprofitability. It will also give us new abilitiesto regionalize markdowns so that we canbetter tailor our clearance cycle to the geo-graphic diversity of our store base. Both theseenhancements should help improve ourgross margin productivity in the second halfof 2006.
“Stein Mart just really puts it
all together. Not just for your
wardrobe, but getting your
whole house ready for Spring.”
7Stein Mart, Inc.
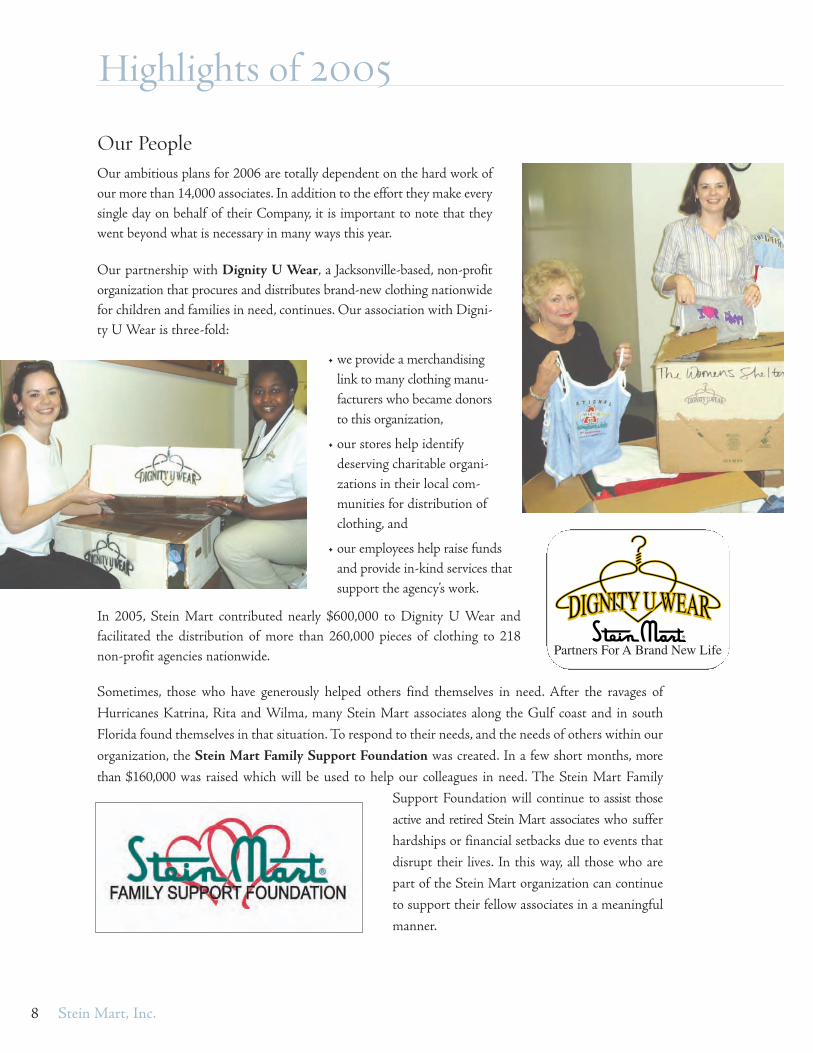
Our PeopleOur ambitious plans for 2006 are totally dependent on the hard work ofour more than 14,000 associates. In addition to the effort they make everysingle day on behalf of their Company, it is important to note that theywent beyond what is necessary in many ways this year.
Our partnership with Dignity U Wear, a Jacksonville-based, non-profitorganization that procures and distributes brand-new clothing nationwidefor children and families in need, continues. Our association with Digni-ty U Wear is three-fold:
• we provide a merchandisinglink to many clothing manu-facturers who became donorsto this organization,
• our stores help identifydeserving charitable organi-zations in their local com-munities for distribution ofclothing, and
• our employees help raise fundsand provide in-kind services thatsupport the agency’s work.
In 2005, Stein Mart contributed nearly $600,000 to Dignity U Wear andfacilitated the distribution of more than 260,000 pieces of clothing to 218non-profit agencies nationwide.
Sometimes, those who have generously helped others find themselves in need. After the ravages ofHurricanes Katrina, Rita and Wilma, many Stein Mart associates along the Gulf coast and in southFlorida found themselves in that situation. To respond to their needs, and the needs of others within ourorganization, the Stein Mart Family Support Foundation was created. In a few short months, morethan $160,000 was raised which will be used to help our colleagues in need. The Stein Mart Family
Support Foundation will continue to assist thoseactive and retired Stein Mart associates who sufferhardships or financial setbacks due to events thatdisrupt their lives. In this way, all those who arepart of the Stein Mart organization can continueto support their fellow associates in a meaningfulmanner.
Highlights of 2005
8 Stein Mart, Inc.
UNITED STATES SECURITIES AND EXCHANGE COMMISSION
Washington, D.C. 20549
FORM 10-K
[X] ANNUAL REPORT PURSUANT TO SECTION 13 OR 15(d) OF THE SECURITIES EXCHANGE ACT OF 1934 For the fiscal year ended January 28, 2006
or [ ] TRANSITION REPORT PURSUANT TO SECTION 13 OR 15(d) OF THE SECURITIES EXCHANGE ACT OF 1934
Commission file number 0-20052
STEIN MART, INC. (Exact name of registrant as specified in its charter)
Florida 64-0466198 (State or other jurisdiction of (I.R.S. Employer incorporation or organization) Identification Number) 1200 Riverplace Blvd., Jacksonville, Florida 32207 (Address of principal executive offices) (Zip Code) Registrant’s telephone number, including area code: (904) 346-1500 Securities registered pursuant to Section 12(g) of the Act: Title of each class: Name of each exchange on which registered: Common Stock $.01 par value The Nasdaq Stock Market® Indicate by check mark if the registrant is a well-known seasoned issuer, as defined in Rule 405 of the Securities Act. Yes [ ] No [X] Indicate by check mark if the registrant is not required to file reports pursuant to Section 13 or Section 15(d) of the Act. Yes [ ] No [X] Indicate by check mark whether the registrant (1) has filed all reports required to be filed by Section 13 or 15(d) of the Securities Exchange Act of 1934 during the preceding 12 months (or for such shorter period that the registrant was required to file such reports), and (2) has been subject to such filing requirements for the past 90 days. Yes [X] No [ ] Indicate by check mark if disclosure of delinquent filers pursuant to Item 405 of Regulation S-K is not contained herein, and will not be contained, to the best of registrant's knowledge, in definitive proxy or information statements incorporated by reference in Part III of this Form 10-K or any amendment to this Form 10-K. [X] Indicate by check mark whether the registrant is a large accelerated filer, an accelerated filer, or a non-accelerated filer. See definition of “accelerated filer and large accelerated filer” in Rule 12b-2 of the Exchange Act. Large accelerated filer [ ] Accelerated filer [X] Non-accelerated filer [ ] Indicate by check mark whether the registrant is a shell company (as defined in Rule 12b-2 of the Act). Yes [ ] No [X]. The aggregate market value of the voting common stock held by non-affiliates of the Registrant as of March 31, 2006 was $480,837,309. For purposes of this response, executive officers and directors are deemed to be affiliates of the registrant and the holdings by non-affiliates was computed as 27,602,601 shares. At March 31, 2006, the Registrant had issued and outstanding an aggregate of 43,530,014 shares of its common stock. Documents Incorporated By Reference: Portions of the Registrant’s Proxy Statement for its 2006 Annual Meeting of Stockholders are incorporated by reference in Parts III-IV.
2
STEIN MART, INC. TABLE OF CONTENTS
P This report contains forward-looking statements which are subject to certain risks, uncertainties or assumptions and may be affected by certain factors, including but not limited to the specific factors discussed in Part I, Item 1A under ‘Risk Factors’; in Part II, Item 5 under ‘Market for Registrant’s Common Equity, Related Stockholder Matters and Issuer Purchases of Equity Securities’; and Part II, Item 7 under ‘Management’s Discussion and Analysis of Financial Condition and Results of Operations-Liquidity and Capital Resources’. Wherever used, the words ‘plan’, ‘expect’, ‘anticipate’, ‘believe’, ‘estimate’ and similar expressions identify forward-looking statements. In addition, except for historical facts, all information provided in Part II, Item 7A, under ‘Quantitative and Qualitative Disclosures About Market Risk’ should be considered forward-looking statements. Should one or more of these risks, uncertainties or other factors materialize, or should underlying assumptions prove incorrect, actual results, performance or achievements of the Company may vary materially from any future results, performance or achievements expressed or implied by such forward-looking statements. Forward-looking statements are based on beliefs and assumptions of the Company’s management and on information currently available to such management. Forward-looking statements speak only as of the date they are made, and the Company undertakes no obligation to publicly update or revise its forward-looking statements in light of new information or future events. Undue reliance should not be placed on such forward-looking statements, which are based on current expectations. Forward-looking statements are no guarantees of performance.
ITEM NO. PAGE
PART I
1. Business 3 1A. Risk Factors 8 1B. Unresolved Staff Comments 10 2. Properties 11 3. Legal Proceedings 12 4. Submission of Matters to a Vote of Security Holders 12
PART II 5. Market for Registrant's Common Equity, Related Stockholder Matters and Issuer Purchases of Equity Securities 12 6. Selected Consolidated Financial Data 14 7. Management's Discussion and Analysis of Financial Condition and Results of Operations 15 7A. Quantitative and Qualitative Disclosures about Market Risk 20 8. Financial Statements and Supplementary Data 20 9. Changes in and Disagreements With Accountants on Accounting and Financial Disclosure 20 9A. Controls and Procedures 20 9B. Other Information 21
PART III 10. Directors and Executive Officers of the Registrant 21 11. Executive Compensation 21 12. Security Ownership of Certain Beneficial Owners and Management and Related Stockholder Matters 21 13. Certain Relationships and Related Transactions 21 14. Principal Accounting Fees and Services 21
PART IV 15. Exhibits and Financial Statement Schedules 21 SIGNATURES 22

3
PART I ITEM 1. BUSINESS OVERVIEW Stein Mart is a retailer offering the fashion merchandise, service and presentation of a better department or specialty store at prices competitive with off-price retail chains. Our focused assortment of merchandise features fashionable, current-season, moderate to better brand-name apparel for women and men, as well as accessories, gifts, linens and shoes all offered at prices targeted to be 25% to 60% below the list prices at department stores. Our target customers are fashion-conscious, value-seeking 35-60 year old women with above average annual household incomes. As of January 28, 2006, we operated 262 stores in 30 states and the District of Columbia. As used herein, the terms “we”, “our”, “us”, “Stein Mart” and the “Company” refer to Stein Mart, Inc. and its wholly-owned subsidiary. BUSINESS STRENGTHS We believe our success and future growth will be the result of consistent execution of the following business strengths: Target a Highly Desirable Customer. Generally, our target customers are fashion-conscious, value-seeking women between the ages of 35 and 60. Women in this age bracket represent approximately 35% of the female population and spent over $43 billion on apparel in 2004. Within this population, our target customer generally has higher than average levels of disposable income. Furthermore, we believe that the product selection, customer service, mall location and pricing of better department and specialty stores have become less appealing to our targeted customer. For these reasons, we believe that by continuing to make our shopping experience convenient, relevant and desirable to this target customer, we will be able to increase our share of the apparel market. Provide Timely, Consistent, Upscale Merchandise. We purchase current-season, fashionable, upscale, merchandise primarily through pre-planned buying programs similar to those used by department stores. We generally purchase from the same vendors as department stores. We collaborate with our vendors to acquire a more focused selection of merchandise that we feel better reflects the fashion tastes, colors and patterns desired by our target customer. This strategy enables us to offer current-season, fashionable merchandise on a more timely basis than some of our off-price competitors, who utilize more opportunistic buying approaches, including the use of “close-outs” and overstocks to source their merchandise. Offer Value on Fashion Merchandise. We strive to provide a compelling value on fashionable, current-season merchandise. As part of our favorable vendor relationships and streamlined purchase terms, we generally do not require many of the typical vendor concessions, such as advertising allowances or return privileges, that are common in the department store industry. As a result, we believe that our buyers are able to negotiate more favorable pricing terms from vendors. We pass these savings on to our customers through everyday low pricing that we target to be 25% to 60% below the list prices charged by department stores. Deliver an Attractive Store Appearance, Appealing Merchandise Presentation and High-Quality Customer Service. Within each of our stores, we try to create an ambiance through attractive in-store layouts, signage, merchandise presentation and customer service. Our merchandise is displayed in lifestyle groupings to assist our customers in assembling outfits and encourage multiple unit purchases. We generally offer a full assortment of sizes and styles for the goods we sell. We provide customer service levels similar to those found at better department or specialty stores. We also operate a distinctive ladies’ apparel store-within-a-store concept, the Boutique, which offers better merchandise and the presentation and service levels found in a specialty boutique. The Boutique is a key element of our merchandising strategy to attract more fashion-conscious customers. Maximize Inventory Efficiency. We primarily utilize drop shipments from our vendors to our stores of pre-ticketed, ready-to-hang, floor-ready merchandise. We use a drop-ship model because it enables our stores to introduce current-season merchandise on a timely basis, saves the expense of handling merchandise twice, as is typically the case through a distribution center, and optimizes inventory levels by avoiding the need to warehouse products. In addition, our merchandising control systems, including replenishment software, aid in our ability to optimize inventory levels and increase product flow-through, resulting in fewer markdowns and higher profitability. Execute our Convenience-based Real Estate Strategy. Our typical store format averages 37,000 square feet and is located primarily in neighborhood shopping centers in close proximity to upscale, residential neighborhoods. Our optimal co-tenants within these shopping centers cater to a similar target customer and are typically highly frequented retail formats such as supermarkets, drug stores, specialty retailers and restaurants. In addition, our store size and layout offer greater convenience to our customers than some of our department store competitors. Leverage our Broadly Recognized Brand. We enjoy a nationally recognized brand, with presence in 30 states and the District of Columbia as of January 28, 2006 and an active advertising and marketing program. We believe that our brand recognition rate among our target customers in markets we serve is over 50%. We are moving to strengthen our recognition levels through our
4
nationally televised “Once you go, you get it” advertising campaign, which portrays the personal shopping experiences of our actual customers. In fiscal 2002, we began a series of productivity initiatives designed to improve operating performance and better serve our target customers. These included: • Reformatting the typical store footprint to allocate additional space to businesses with more profit opportunities (ladies’ apparel,
ladies’ accessories and gifts), and downsizing those businesses with limited room for growth (tailored men’s apparel and children’s).
• Reducing average store inventories in order to give customers more clarity of selection and better access to merchandise.
Average store inventories declined 9.6% between fiscal 2002 and fiscal 2005. • Focusing on the creation of a more compelling fashion assortment that would be delivered, priced and promoted to move
through the inventory cycle as quickly and productively as possible, with a goal of reducing markdowns and increasing inventory turn.
• Eliminating regular distribution of percentage-off coupons for full price merchandise. These coupons were dilutive to our value
proposition and constrained the appropriate markdowns of seasonal goods. • Creating a new, television-based advertising campaign (“Once you go, you get it”) in order to introduce and reinforce the Stein
Mart brand. • Focusing on our real estate portfolio by adding greater depth and substance to the new location selection process, in an effort to
create more productive stores from the outset. A total of 26 new stores have been opened and three have been relocated to more advantageous locations since February 1, 2003.
• Taking more decisive action to remove under-performing locations from our existing real estate portfolio, resulting in the closure
of 29 stores between February 1, 2003 and January 28, 2006. As a result of these initiatives: • We improved sales per store (including leased departments) from $5.7 million to $6.1 million between fiscal 2002 and fiscal 2005
and sales per square foot (including leased departments) from $184 to $202 during the same period. • We improved average new store sales for stores opened after 2002 under the new location selection process to approximately
$5.0 million for the first full fiscal year. Previously, new store sales averaged $4.0 - $4.5 million for the same period. • We improved gross profit as a percentage of sales by 3.4 percentage points between fiscal 2002 and the end of fiscal 2005. • We improved our earnings per share from continuing operations on a fully diluted basis from $0.51 per share in fiscal 2002 to
$1.15 per share in fiscal 2005, representing a compound annual growth rate of approximately 31%. GROWTH STRATEGY Our management team is committed to executing the following key growth strategies: Optimize our Retail Footprint. As of January 28, 2006, we had 262 retail stores, seven of which were opened in fiscal 2005. In 2006, we will accelerate our new store growth with the most aggressive store opening plan since 2001, with the majority of new stores opening in the second half of the year. We will close eight stores in fiscal 2006. We expect to fund the cost of opening all new stores from our internal cash flow. Consistent with our past expansion strategy, new stores will be added in both new metropolitan markets and existing markets. Our drop shipment distribution approach allows management to concentrate on the most desirable real estate opportunities in targeted markets, without being constrained geographically by the capacity limits or locations of a distribution center. During 2002, we adopted a revised approach to identifying new store locations, which we believe will help us expand in a more profitable, efficient manner. As part of this new approach, we also applied additional disciplines to evaluating and closing under-performing stores where it makes economic sense to do so. Accordingly, we anticipate that new store openings will be partially offset by the closure on a selective basis of under-performing stores.

5
Improve Profitability. As we grow our business and open new stores, we intend to increase our operating income. Key elements of our profitability improvement strategy include: • focusing the business toward the needs and desires of our target customer by optimizing merchandise mix via continued
customer research • improving store traffic through our successful marketing programs emphasizing television-based advertising and newspaper
color circulars • enhancing margins by improving our product sell-through and minimizing our markdowns • lowering the cost of our merchandise by continually improving our purchasing process Further Strengthen and Build Customer Loyalty and Brand Awareness. As we grow our business, we believe we will continue to identify new and effective ways to improve our brand visibility and build customer loyalty. Successful use of programs such as the Preferred Customer program, which rewards our most devoted customers, is strengthened by our television-based advertising campaign. Additionally, our Agenda Program is designed to promote brand awareness in the community through fashion shows and wardrobe consultations for businesses and other organizations. MERCHANDISING, PRICING AND STORE APPEARANCE Our focused assortment of merchandise features moderate to better brand-name apparel for women and men as well as ladies’ accessories, gifts, linens and shoes. Our fashion assortment is driven primarily by our own merchandising plan, which anticipates and identifies seasonal fashion, silhouette and color trends, and how each should be represented on the selling floor in order to serve our target customer. Branded merchandise is complemented by a limited private label program which enhances the presentation of current fashion trends and provides key basic items in complete size ranges and assortments. We seek to offer distinct value to our customer through everyday low pricing that we target to be 25% to 60% below the list prices charged by department stores. From our customer’s perspective, we believe we differentiate ourselves from department stores and specialty stores due to our (i) everyday low pricing, (ii) convenient locations in neighborhood shopping centers near upscale neighborhoods, and (iii) assortments that are more focused than department stores and more varied than specialty stores. We also believe we differentiate ourselves from typical off-price retailers by offering (i) primarily current-season merchandise carried by better department and specialty stores, (ii) at moderate to better price levels, (iii) a stronger merchandising “statement,” consistently offering more depth of color and size in individual stock-keeping units, and (iv) merchandise presentation and customer service more comparable to other upscale retailers. Our typical store is approximately 37,000 gross square feet with a racetrack design, convenient centralized check-out, and individual dressing rooms. We seek to create excitement in our stores through the continual flow of fashion merchandise, targeted sales promotions, store layout, merchandise presentation, and the quality, value and depth of our merchandise assortment. We display merchandise in lifestyle groupings of apparel and accessories. Our management believes that the lifestyle grouping concept strengthens the fashion image of our merchandise and enables the customer to locate desired merchandise in a manner that encourages multiple purchases. The following table reflects the percentage of our sales by major merchandise category, which includes sales from leased shoe departments, for the fiscal years indicated: 2005 2004 2003
Ladies’ and Boutique apparel 42% 41% 39%
Ladies’ accessories 13% 12% 12%
Men’s 19% 18% 17%
Gifts and linens 15% 17% 19%
Leased shoe departments 7% 7% 7%
Children’s 2% 3% 4%
Other 2% 2% 2%
100% 100% 100%

6
A comprehensive Customer Intensification ProcessTM was conducted in the spring of 2005 with a goal to further clarify our customers’ shopping preferences. The results of that study led to a decision to eliminate our Children’s apparel offering in favor of additional ready-to-wear categories such as intimate apparel and special sizes. This process will begin in late Spring of 2006 and is expected to provide a more cohesive assortment for our target customer. Our shoe department is a leased department operated in individual stores by one of two shoe retailers, DSW Inc. or Nine West Group Inc., a division of Jones Apparel Group, Inc. The footwear featured in this department is presented in a manner consistent with our overall presentation in other departments, stressing fashionable, current-season footwear at value prices. This department offers a variety of women’s and men’s casual and dress shoes, which complement the range of apparel available in other departments. STORE NETWORK At January 28, 2006, we operated 262 stores in 30 states and the District of Columbia, primarily concentrated in the Southeast and Texas. Stores are located primarily in neighborhood shopping centers in close proximity to upscale residential neighborhoods, where our target customer is likely to reside. Other locations where our stores may be found include power centers, in freestanding buildings or in traditional shopping malls. All of our stores and our headquarters are leased. Our philosophy is to finance growth with internally generated funds and to continue to fill in existing markets as well as expand into new markets. Since less than five percent of our merchandise on a dollar basis is handled through our distribution/warehouse facility, we are not constrained geographically or by the capacity limits or location of a central facility. Our tenant representative brokers scout potential locations for future expansion across the United States. We refurbish existing retail locations or occupy newly constructed stores, which typically are anchor stores in new or existing shopping centers, ideally with co-tenants that cater to a similar customer base. Our historical ability to negotiate favorable leases and to construct attractive stores with a relatively low investment has provided us with a significant cost advantage over department and specialty stores. Our costs associated with opening a new store includes approximately $500,000 to $700,000 for fixtures, equipment, leasehold improvements and pre-opening expenses (primarily advertising, stocking and training). Pre-opening costs are expensed when incurred. The cost of our initial inventory investment for a new store is approximately $1.0 million. During 2002, we revised our approach to selecting new store locations. Most of the stores opened in 2003 and thereafter were selected using this new approach. Prior to that time, our principal consideration was population demographics, including data relating to income, education levels, age and occupation. The availability of prime real estate locations, existing and potential competitors, and the number of our stores that a market could support was also considered. We have since expanded our analysis to consider psychographics, such as fashion consciousness in the marketplace. We have also retained a third-party consulting firm to analyze each potential location. Finally, a committee of our senior officers considers the collected data and analysis, and determines whether to approve or reject potential new store locations. Based on this revised approach, our management has identified several target markets to expand our existing presence as well as new geographic regions to enter. We also revised our approach to identifying and analyzing under-performing stores. This approach involves regular review of all existing stores, with emphasis on strategies to improve the profitability of under-performing stores. If, after a period of time, a store’s profitability does not improve, the store is considered for closure. In some instances, lease termination costs make it economically impracticable to close an under-performing store. Sixteen under-performing stores were closed during 2003, seven under-performing stores were closed in 2004, and six under-performing stores were closed in 2005. In 2002, we also introduced a smaller (sub-15,000 square foot) store concept, collections of Stein Mart, to test our entry into resort and premium markets where our typical Stein Mart store is not feasible. The first collections of Stein Mart opened in Rolling Hills, California in October 2002 and was followed by stores in Pasadena, California; Hendersonville, North Carolina; and Amelia Island, Florida. We believe that this format has continued promise in locations where either real estate availability or costs are prohibitive for our typical 37,000 square foot store. CUSTOMER SERVICE Our customer service is fundamental to our goal of building customer loyalty. Our stores offer many of the services typically found in better department and specialty stores, such as a liberal merchandise return policy, a Preferred Customer program and electronic gift certificates. Each store is staffed to provide a number of sales associates to properly attend to customer needs. All our stores have their own Boutique, staffed generally by specially-recruited associates who are civically and socially prominent in the community and who generally work one day a week. We believe this staffing approach adds credibility and fashion integrity to the department. Our associates are paid on a per-hour or salaried basis and are not on commission. We installed the Oracle/360Commerce technology to speed transactions processing at checkout in 68 stores in 2005. We will complete the rollout of this technology and equipment in all stores all in 2006.
7
VENDOR RELATIONSHIPS AND BUYING We buy from approximately 1,700 vendors, and we enjoy longstanding working relationships with many of these vendors. Our buyers shop at a variety of marketplaces to identify and negotiate with vendors for our desired assortment of merchandise. In most cases, our merchandise is bought directly from the manufacturers’ lines, similar to department stores’ purchasing programs. In other cases, our merchants work with manufacturers to customize pieces on the vendor’s line for our inventory. We also develop branded and private label proprietary product through established vendors in order to provide customers with a unique product. Our private label merchandise comprises approximately 12% of sales. We do not have long-term or exclusive contracts with any particular vendor. In 2005, approximately eight percent of our purchases were from two vendors, and less than two percent of total purchases were from any other single vendor. We purchase current-season, fashionable, upscale, brand-name merchandise primarily through pre-planned buying programs similar to those used by department stores. We generally purchase from the same vendors as department stores. We collaborate with our vendors to acquire a more focused selection of merchandise that we feel better reflects the brands, colors and patterns desired by our target customer. We believe that this strategy enables us to provide current-season, fashionable merchandise on a more timely basis than some of our off-price competitors, who utilize more opportunistic buying approaches, including the use of “close-outs” and overstocks to source their merchandise. As part of our favorable vendor relationships and streamlined purchase terms, we generally do not require many of the typical vendor concessions, such as advertising allowances or return privileges, that are common in the department store industry. As a result, we believe that our buyers are able to negotiate more favorable pricing terms from vendors. We pass these savings on to our customers through everyday low pricing that we target to be 25% to 60% below the list prices charged by department stores. Our in-house merchandise development department works with buyers and vendors to ensure that the merchandise assortments offered are unique, fashionable, color-forward and of high quality. Our information systems enable us to acquire merchandise and track sales information on a store-by-store basis, allowing our buying staff to respond quickly to customer buying trends. MARKETING Our advertising stresses upscale, fashion merchandise at significant savings. In recent years, we have transitioned from spending the majority of our marketing budget on newspaper advertising to the production of color circulars and national, cable-television-based advertising. This evolution is a reallocation of dollars, as the percentage of sales has remained relatively constant during that time. Our management believes we also enjoy substantial word-of-mouth advertising benefits from our customer base. Two major events affected our marketing in recent years. In August 2003, we discontinued the regular use of various coupons that allowed customers to take a specified percentage discount off of full-priced merchandise. In the fall of 2003, we launched a nationwide, television-based advertising campaign featuring our customers and their comments about shopping at our stores. Our television ads run during the height of the spring and fall selling season, and are reinforced by color pre-print circulars, both inserted in newspapers and mailed directly to customers. During major clearance seasons, we utilize run-of-press newspaper advertising. Our Preferred Customer program, launched in May 2001, now includes more than two million customers. It recognizes and rewards our most devoted shoppers and most of them receive regular mailings regarding key events, promotions, special members-only shopping days and special discounts exclusive to these individuals. We have an Internet site, www.steinmart.com, to promote Stein Mart’s fashion point of view, as well as provide information for customers regarding stores, store locations, company management and selected sales promotion activity. However, we do not sell merchandise online at this time. Visitors to the website may sign up to be Preferred Customers and may purchase electronic gift certificates. DISTRIBUTION METHODOLOGY We primarily utilize drop shipments from our vendors directly to our stores, as opposed to having merchandise flow through a centralized distribution center. Most apparel merchandise is received pre-ticketed and “ready to hang” (floor ready). This system enables us to receive merchandise at each store on a timely basis and to save the time and expense of handling merchandise twice, which is typical of a traditional distribution center structure. Our management reviews the current system on a regular basis and, at this time, does not plan to change our drop-ship delivery system. We lease a small distribution/warehouse facility in Jacksonville, Florida, but less than five percent of our merchandise, on a dollar basis, is handled in this facility. INFORMATION SYSTEMS Our inventory control system enables us to achieve economies of scale from bulk purchases while at the same time ordering and tracking separate drop shipments by store. Our store inventory levels are regularly monitored and adjusted as sales trends dictate. The inventory control system provides us with information that enhances management’s ability to make informed buying decisions and accommodate unexpected increases or decreases in demand for a particular item. We use bar codes and bar code scanners as

8
part of an integrated inventory management and check-out system in our stores. Our merchandise planning and allocation system enables the buyers and planners to customize their merchandise assortments at the individual store and class level, based on selected criteria, such as a store’s selling patterns, climate and merchandise color preferences. The ability to customize individual store assortments enables us to more effectively manage inventory, capitalize on sales trends and reduce markdowns. The implementation of Oracle/ProfitLogic markdown optimization software in 2006 is expected to further enhance our markdown decision-making and enable regional markdowns. COMPETITION Our management believes that we occupy a market niche closer to department and specialty stores than typical off-price retail chains. Our competitors range from national department stores, such as Belk, Dillard’s and Macy’s, to off-price retailers, such as Filene’s Basement, Marshalls, Ross Stores and T.J. Maxx. We believe that we are well positioned to compete on the principal competitive factors in the retail apparel industry: assortment, presentation, quality of merchandise, price, customer service, vendor relations and store location. EMPLOYEES As of January 28, 2006, our work force consisted of approximately 14,000 employees (8,700 40-hour equivalent employees). Each of our stores employs an average of 55 persons as area managers, sales associates, cashiers and other positions. The number of employees fluctuates based on the particular selling season. TRADEMARKS We own the federally registered trademark Stein Mart®, together with a number of other marks used in conjunction with our private label merchandise program. In some classifications of merchandise, we use several private label programs to provide additional availability of items. Management believes that our trademarks are important but, with the exception of Stein Mart®, not critical to our merchandising strategy. AVAILABLE INFORMATION Copies of our annual report on Form 10-K, proxy statement, quarterly reports on Form 10-Q, current reports on Form 8-K, and any amendments to those filings are available free of charge on the investor relations portion of our website at http://ir.steinmart.com (click on “SEC filings”) as soon as reasonably practicable after they are filed electronically with the Securities and Exchange Commission. Also available free of charge on the www.steinmart.com website (click on “Investor Relations”; click on “Corporate Governance”) are the charters for the Audit Committee, the Compensation Committee, the Nominating and Corporate Governance Committee, as well as the Code of Ethics. Printed copies of these items are available free of charge upon request by writing Stein Mart, Inc., 1200 Riverplace Boulevard, Jacksonville, FL 32207, Attention: Stockholder Relations. ITEM 1A. RISK FACTORS Our results of operations and financial condition can be adversely affected by numerous risks and uncertainties. The most important of these risks and uncertainties are detailed below. You should carefully consider the risk factors described below and other risks which may be disclosed from time to time in the Company’s filings with the SEC before investing in the Company’s securities. Should any of these risks actually materialize, our business, financial condition, and future prospects could be negatively impacted. Intense competition in the retail industry. We face intense competition for customers from department stores, specialty retailers and regional and national off-price retail chains. Many of these competitors are larger and have significantly greater financial and marketing resources than we do. In addition, many department stores have become more promotional and have reduced their price points, and certain department stores and certain of our vendors have opened outlet stores which offer merchandise at prices that are competitive with ours. Many of our competitors also make sales through the Internet, and although we do maintain an Internet site, we do not sell merchandise online. Accordingly, we may face periods of intense competition in the future which could have a material adverse effect on our profitability and results of operations. We may be unable to open new stores in a cost-effective and timely manner. Our future operating results will depend to a substantial extent upon our ability to open and operate new stores successfully, and our ability to open new stores will depend upon a number of factors, including the ability to properly identify and enter new markets, locate suitable store sites in the face of intense competition, negotiate acceptable lease terms, construct or refurbish sites, hire, train and retain skilled managers and personnel, and other factors, some of which may be beyond our control. In particular, the success of our individual stores depends to a great extent on locating them in desirable and convenient venues in markets that include our target demographic. The success of individual stores also may depend on the success of the shopping centers in which they are located. In addition, the demographic and other marketing data we rely on in determining the location of our stores cannot predict future consumer preferences and buying trends with complete accuracy. As a result, stores we open may not be profitable or may be less successful than we anticipate.
9
Lastly, our proposed expansion also will place increased demands on our operational, managerial and administrative resources. These increased demands could cause us to operate our business less effectively, which in turn could cause deterioration in the financial performance of our existing stores. In addition, to the extent that our new store openings are in existing markets, we may experience reduced net sales volumes in existing stores in those markets. We expect to fund our expansion through cash flow from operations and, if necessary, by borrowings under our revolving credit facility; however, if we experience a decline in performance, we may slow or discontinue store openings. Consumer sensitivity to economic conditions. The retail apparel business is dependent upon the level of consumer spending which may be materially adversely affected by an economic downturn or a decline in consumer confidence. As a fashion retailer, we rely on the expenditure of discretionary income for most, if not all, of our sales. A downturn, whether real or perceived, in economic conditions or prospects, particularly in the Southeast and other regions in which we derive a significant portion of our net sales, could adversely affect consumer spending habits and have a material adverse effect on our results of operations. In particular, the continued threat of terrorism, heightened security measures and military action in response to an act of terrorism has disrupted commerce and intensified the uncertainty of the U.S. economy. Any further acts of terrorism or a future war may further disrupt commerce and undermine consumer confidence, which could negatively impact our sales revenue by causing consumer spending to decline. Furthermore, an act of terrorism or war, or the threat thereof, could negatively impact our business by interfering with our ability to obtain merchandise from vendors. Inability to obtain merchandise from our vendors or substitute suppliers at similar costs in a timely manner could have a material adverse effect on our operating results and financial condition. Unanticipated changes in fashion trends and changing consumer preferences. Our success depends in part upon our ability to anticipate and respond to changing consumer preferences and fashion trends in a timely manner. Although we attempt to stay abreast of the fashion tastes of our customers and provide merchandise that satisfies customer demand, fashion trends can change rapidly and we cannot assure that we will accurately anticipate shifts in fashion trends and adjust our merchandise mix to appeal to changing consumer tastes in a timely manner. If we misjudge the market for our products or are unsuccessful in responding to changes in fashion trends or in market demand, we could experience insufficient or excess inventory levels which could result in higher markdowns, any of which would have a material adverse effect on our financial condition and results of operations. A lack of adequate sources of merchandise at acceptable prices. Our business is dependent to a significant degree upon our ability to purchase designer and other fashion merchandise at acceptable wholesale prices. Although we believe our relationships with our vendors are positive, we do not have long-term agreements with any vendor. As a result, we must continuously seek out buying opportunities from our existing suppliers and from new sources. We compete for these opportunities with other retailers, discount and deep-discount chains, mass merchandisers and various privately-held companies and individuals. Although we do not depend on any single vendor or group of vendors and believe we can successfully compete in seeking out new vendors, the loss of certain key vendors could make it difficult for us to acquire sufficient quantities and an appropriate mix of merchandise at acceptable prices, which could have a material adverse effect on our results of operations.
Seasonality, and especially the importance of the holiday selling season. Our business is affected by the seasonal pattern common to most retailers. Historically, our highest net sales and profit levels occur during the fourth quarter, which includes the holiday selling season. Our operating results depend significantly upon net sales generated during the fourth quarter, and any factor that negatively impacts the holiday selling season could have a material adverse effect on our results of operations for the entire year. Our advertising, marketing and promotional strategies may be ineffective and inefficient. Our profitability and results of operations may be materially affected by the effectiveness and efficiency of our marketing expenditures and our ability to select the right markets and media in which to advertise. In particular, we may not be successful in our efforts to create greater awareness of our stores and our promotions, identify the most effective and efficient level of spending in each market and specific media vehicle and determine the appropriate creative message and media mix for our advertising, marketing and promotional expenditures. Our planned marketing expenditures may not result in increased revenues. In addition, if we are not able to manage our marketing expenditures on a cost-effective basis, our profitability and results of operations could be materially adversely affected. If the third parties, which we rely on for a majority of the distribution aspects of our business, experience labor strikes or do not adequately perform our distribution functions, our business would be disrupted. The efficient operation of our stores is dependent on our ability to receive merchandise in our stores throughout the United States in a timely manner. We depend on vendors to sort and pack substantially all of our merchandise and on package delivery companies to deliver this merchandise directly to our stores. These vendors and package delivery companies may experience labor strikes or other disruptions in the future, the resolution of which will be out of our control, and could result in a material disruption in our business. Any failure by these third parties to respond adequately to our distribution needs, including labor strikes or other disruptions in the business, would disrupt our operations and negatively impact our profitability.
10
Because of our focus on keeping our inventory at the forefront of fashion trends, extreme and/or unseasonable weather conditions could force us to prematurely mark down inventory. Our business is susceptible to unseasonable weather conditions. For example, extended periods of unseasonably warm temperatures during the winter season or cool weather during the summer season could render a portion of our inventory incompatible with those unseasonable conditions. These prolonged unseasonable weather conditions could have a material adverse effect on our business, financial condition and results of operations. In addition, hurricanes or other extreme weather conditions over a prolonged period might make it difficult for our customers to travel to our stores, which could have a material adverse effect on our business, financial condition and results of operations. Moreover, as many of our stores are located in the southeastern United States and Texas, we are subject to disruptions from hurricanes which may have a material adverse effect on our business. Fluctuations in comparable store sales and quarterly results of operations could cause the price of our common stock to decline substantially. Our comparable store sales and quarterly results of operations are affected by a variety of factors, including: • fashion trends • calendar shifts of holiday or seasonal periods • the effectiveness of our inventory management • changes in our merchandise mix • the timing of promotional events • weather conditions • changes in general economic conditions and consumer spending patterns • actions of competitors Our comparable store sales and quarterly results have fluctuated in the past and are expected to continue to fluctuate in the future. In addition, we cannot assure you that we will be able to maintain comparable store sales increases as we expand our business. We may be unable to close under-performing stores in a cost-effective and timely manner. As part of our strategy, we close certain under-performing stores, generally based on considerations of store profitability, competition, strategic factors and other considerations. Closing a store could subject us to costs including the write-down of leasehold improvements, equipment, furniture and fixtures. In addition, we could remain liable for future lease obligations. These costs associated with closings of under-performing stores could have a material adverse effect on our profitability and results of operations. Our failure to adequately protect our trademark Stein Mart®, and, to a lesser extent, the various other marks we use in conjunction with our private label merchandise program, could have a negative impact on our brand image. We believe that our trademark Stein Mart® and, to a lesser extent, the various other marks that we use in connection with our private label merchandise program, are important to us because we feel that these brands have characteristics unique to our business. We have obtained a federal registration of the Stein Mart® trademark and various other trademarks in the United States. We cannot assure you that the registrations that we have obtained will prevent the imitation of our business or infringement of our intellectual property rights by others. If we are unable to protect our brand or our brand becomes associated with lesser characteristics or otherwise carries a negative connotation, our brand image, and consequently the results of our operations, could be materially adversely affected. We are dependent on certain key personnel. Our continued success will depend to a significant extent upon the efforts and abilities of our senior executives, and the loss of the services of one or more of these executives could have a material adverse effect upon our results of operations. These executives are Michael D. Fisher, president and chief executive officer; Jay Stein, chairman of the board of directors; James G. Delfs, senior vice president, finance and chief financial officer; D. Hunt Hawkins, senior vice president, human resources; and Michael D. Ray, senior vice president, director of stores; and our general merchandising managers, M. Kassie Jones, William A. Moll and John H. Pennell, as well as the vice president of planning and allocation, Roseann McLean. Our continued success is also dependent upon our ability to attract and retain qualified employees to meet our needs, especially to support planned growth. ITEM 1B. UNRESOLVED STAFF COMMENTS None.

11
ITEM 2. PROPERTIES At January 28, 2006, the Company operated stores in the following states and the District of Columbia:
State Number of Stores
Alabama 10 Arizona 7 Arkansas 3 California 19 Colorado 2 Florida 42 Georgia 17 Illinois 6 Indiana 8 Iowa 1 Kansas 2 Kentucky 3 Louisiana 10 Michigan 1 Mississippi 5 Missouri 3 Nebraska 1 Nevada 4 New Jersey 2 New York 2 North Carolina 19 Ohio 10 Oklahoma 5 Pennsylvania 3 South Carolina 12 Tennessee 12 Texas 40 Utah 1 Virginia 10 Washington DC 1 Wisconsin 1 Total 262
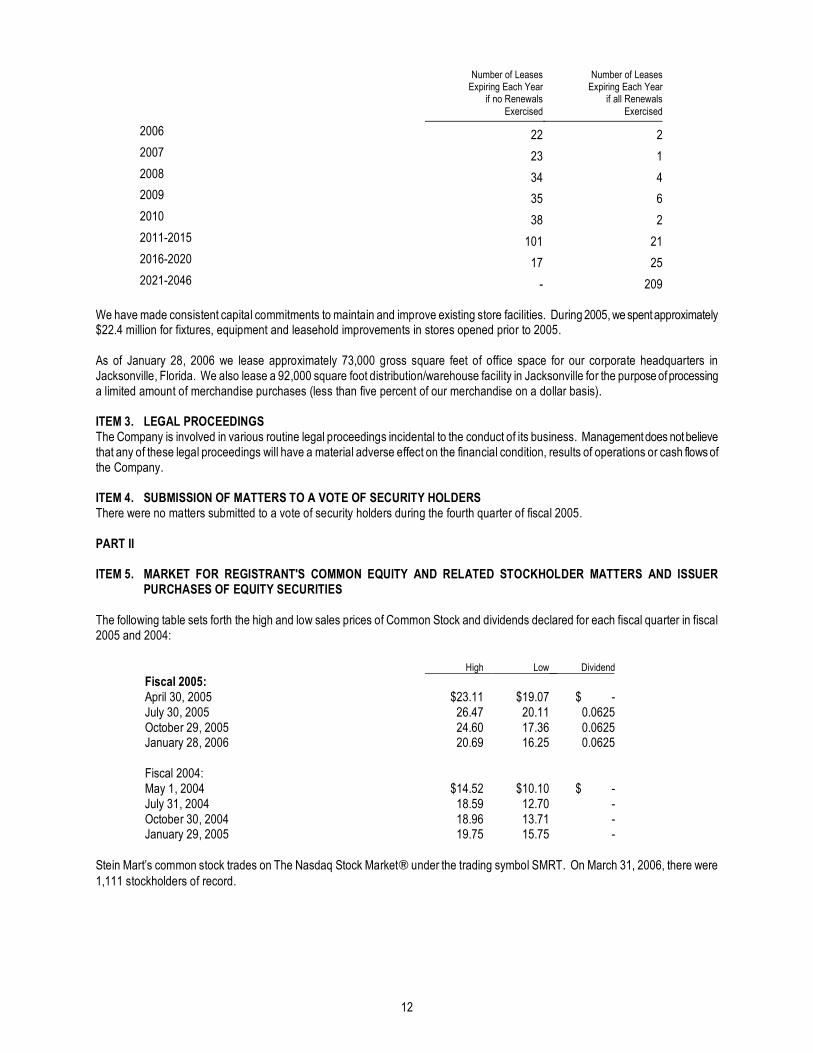
We lease all of our store locations and, therefore, have been able to grow without incurring indebtedness to acquire real estate. Management believes that we have earned a reputation as an “anchor tenant,” which, along with our established operating history, has enabled us to negotiate favorable lease terms. Most of our leases provide for minimum rents, as well as percentage rents that are based on sales in excess of predetermined levels. The table below reflects (i) the number of the Company's leases (as of January 28, 2006) that will expire each year if the Company does not exercise any of its renewal options, and (ii) the number of the Company's leases that will expire each year if the Company exercises all of its renewal options (assuming the lease is not otherwise terminated by either party pursuant to any other provision). The table includes the leases for the 262 store locations operated at January 28, 2006 and 8 previously closed store locations for which the Company has subleased or is actively seeking to sublease the property.
12
Number of Leases Expiring Each Year
if no Renewals Exercised
Number of Leases Expiring Each Year
if all Renewals Exercised
2006 22 2 2007 23 1 2008 34 4 2009 35 6 2010 38 2 2011-2015 101 21 2016-2020 17 25 2021-2046 - 209
We have made consistent capital commitments to maintain and improve existing store facilities. During 2005, we spent approximately $22.4 million for fixtures, equipment and leasehold improvements in stores opened prior to 2005. As of January 28, 2006 we lease approximately 73,000 gross square feet of office space for our corporate headquarters in Jacksonville, Florida. We also lease a 92,000 square foot distribution/warehouse facility in Jacksonville for the purpose of processing a limited amount of merchandise purchases (less than five percent of our merchandise on a dollar basis). ITEM 3. LEGAL PROCEEDINGS The Company is involved in various routine legal proceedings incidental to the conduct of its business. Management does not believe that any of these legal proceedings will have a material adverse effect on the financial condition, results of operations or cash flows of the Company. ITEM 4. SUBMISSION OF MATTERS TO A VOTE OF SECURITY HOLDERS There were no matters submitted to a vote of security holders during the fourth quarter of fiscal 2005.
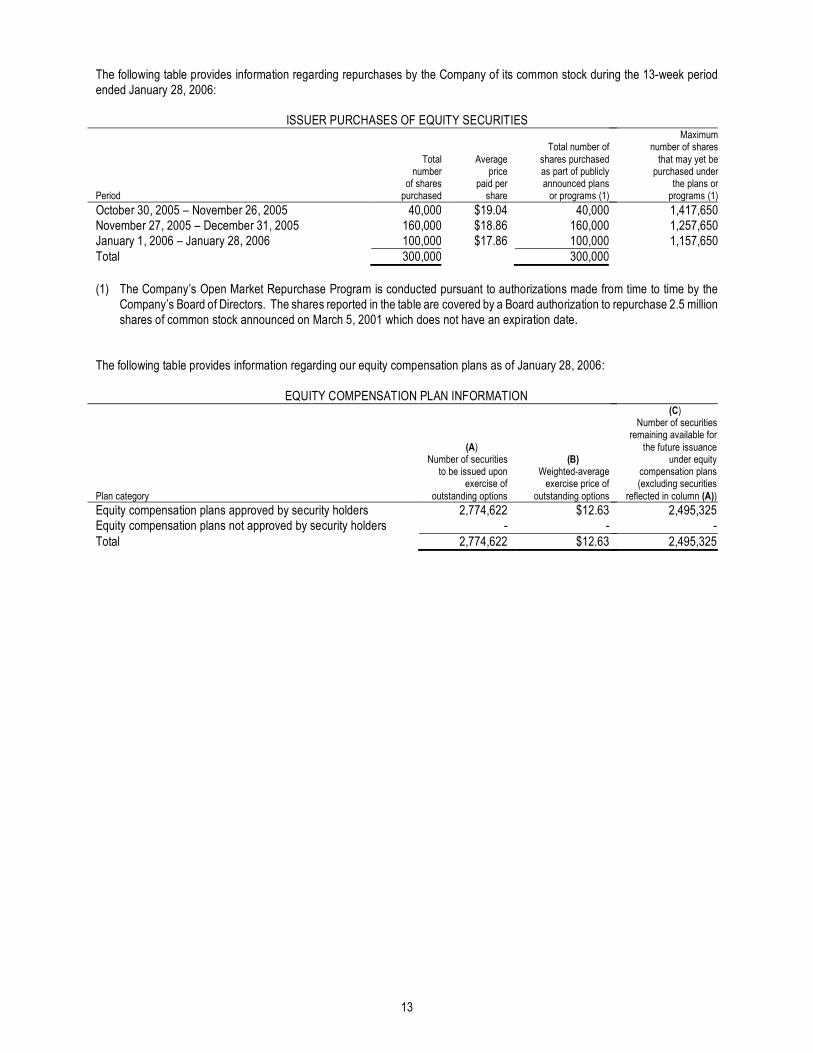
PART II ITEM 5. MARKET FOR REGISTRANT'S COMMON EQUITY AND RELATED STOCKHOLDER MATTERS AND ISSUER PURCHASES OF EQUITY SECURITIES The following table sets forth the high and low sales prices of Common Stock and dividends declared for each fiscal quarter in fiscal 2005 and 2004:
High Low Dividend
Fiscal 2005: April 30, 2005 $23.11 $19.07 $ - July 30, 2005 26.47 20.11 0.0625 October 29, 2005 24.60 17.36 0.0625 January 28, 2006 20.69 16.25 0.0625 Fiscal 2004:
May 1, 2004 $14.52 $10.10 $ - July 31, 2004 18.59 12.70 - October 30, 2004 18.96 13.71 - January 29, 2005 19.75 15.75 -
Stein Mart’s common stock trades on The Nasdaq Stock Market® under the trading symbol SMRT. On March 31, 2006, there were 1,111 stockholders of record.
13
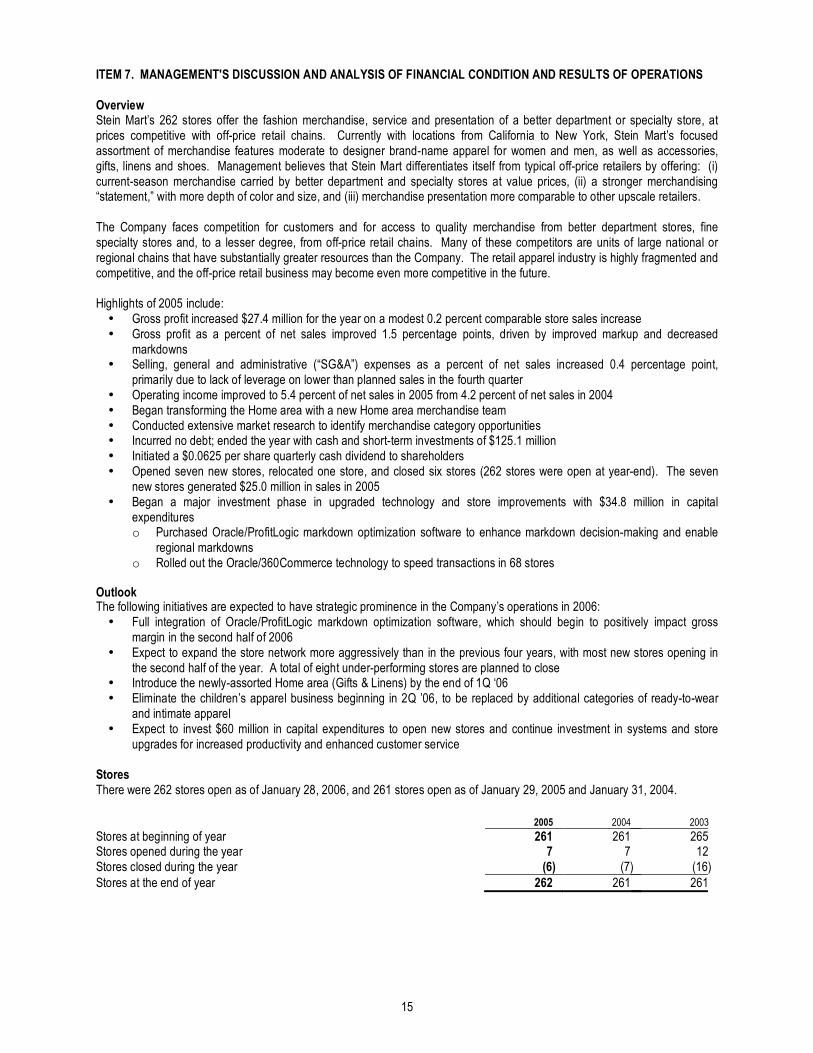
The following table provides information regarding repurchases by the Company of its common stock during the 13-week period ended January 28, 2006:
ISSUER PURCHASES OF EQUITY SECURITIES Period
Total number
of shares purchased
Average price
paid per share
Total number of
shares purchased as part of publicly announced plans
or programs (1)
Maximum number of shares
that may yet be purchased under
the plans or programs (1)
October 30, 2005 – November 26, 2005 40,000 $19.04 40,000 1,417,650 November 27, 2005 – December 31, 2005 160,000 $18.86 160,000 1,257,650 January 1, 2006 – January 28, 2006 100,000 $17.86 100,000 1,157,650 Total 300,000 300,000 (1) The Company’s Open Market Repurchase Program is conducted pursuant to authorizations made from time to time by the
Company’s Board of Directors. The shares reported in the table are covered by a Board authorization to repurchase 2.5 million shares of common stock announced on March 5, 2001 which does not have an expiration date.
The following table provides information regarding our equity compensation plans as of January 28, 2006:
EQUITY COMPENSATION PLAN INFORMATION Plan category
(A) Number of securities
to be issued upon exercise of
outstanding options
(B) Weighted-average
exercise price of outstanding options
(C) Number of securities
remaining available for the future issuance
under equity compensation plans (excluding securities
reflected in column (A)) Equity compensation plans approved by security holders 2,774,622 $12.63 2,495,325 Equity compensation plans not approved by security holders - - - Total 2,774,622 $12.63 2,495,325

14
ITEM 6. SELECTED CONSOLIDATED FINANCIAL DATA (Dollars in Thousands, Except Per Share and Per Square Foot Data)
Consolidated Statement of Operations Data: 2005 2004 2003 2002 2001
Net sales $1,481,615 $1,459,607 $1,351,623 $1,397,851 $1,309,429 Cost of merchandise sold 1,065,409 1,070,803 1,013,175 1,053,109 996,211
Gross profit 416,206 388,804 338,448 344,742 313,218 Selling, general and administrative expenses (1) 353,104 341,932 343,354 322,115 297,846 Other income, net 15,477 14,277 13,004 13,825 13,938
Income from operations 78,579 61,149 8,098 36,452 29,310 Interest income (expense), net 2,026 332 (1,688) (2,604) (4,000)
Income from continuing operations before income taxes 80,605 61,481 6,410 33,848 25,310 Provision for income taxes 29,721 23,363 2,436 12,862 9,617
Income from continuing operations 50,884 38,118 3,974 20,986 15,693 Loss from discontinued operations, net of tax benefit - (145) (1,773) (296) (339)
Net income $ 50,884 $ 37,973 $ 2,201 $ 20,690 $ 15,354
Basic income (loss) per share: Continuing operations $ 1.18 $ 0.90 $ 0.09 $ 0.51 $ 0.38 Discontinued operations - - (0.04) (0.01) (0.01) Total $ 1.18 $ 0.90 $ 0.05 $ 0.50 $ 0.37 Diluted income (loss) per share: Continuing operations $ 1.15 $ 0.89 $ 0.09 $ 0.51 $ 0.38 Discontinued operations - - (0.04) (0.01) (0.01) Total $ 1.15 $ 0.89 $ 0.05 $ 0.50 $ 0.37
Cash dividends paid per share $ .1875 $ - $ - $ - $ - Consolidated Operating Data: Stores open at end of period 262 261 261 265 253 Sales per store including leased departments (2) $ 6,123 $ 6,058 $ 5,564 $ 5,741 $ 5,922 Sales per store excluding leased departments (3) $ 5,687 $ 5,642 $ 5,179 $ 5,373 $ 5,520 Sales per square foot including leased departments (2) $ 202 $ 199 $ 181 $ 184 $ 189 Sales per square foot excluding leased departments (3) $ 202 $ 200 $ 182 $ 187 $ 191 Comparable store net sales increase (decrease) (4) 0.2% 9.1% (4.7%) (0.8%) (0.7%)
Consolidated Balance Sheet Data: Working capital $ 241,518 $ 211,242 $ 186,799 $ 146,609 $ 179,212 Total assets 519,845 480,108 399,101 415,846 417,672 Long-term debt (5) - - 24,962 - 57,750 Total stockholders’ equity 323,739 276,510 227,678 223,307 201,895 (1) Selling, general and administrative expenses include store closing and asset impairment charges of $3.4 million in 2005, $4.7 million in 2004, $12.0 million in
2003, $2.5 million in 2002 and $2.9 million in 2001. (2) These sales per store and sales per square foot calculations include sales from leased shoe departments. Sales per store is calculated by dividing (a) total
sales including leased department sales by (b) the number of stores open at the end of such period, exclusive of stores open for less than 12 months. Sales per square foot includes sales and selling space of leased departments and excludes administrative, receiving and storage areas.
(3) These sales per store and sales per square foot calculations exclude sales from leased shoe departments. Sales per store is calculated by dividing (a) total sales, excluding leased department sales by (b) the number of stores open at the end of such period, exclusive of stores open for less than 12 months. Sales per square foot excludes sales and selling space of leased departments, administrative, receiving and storage areas.
(4) Comparable store information for a period reflects stores open throughout that period and for the same 52-week period in the prior year. (5) Notes payable to banks of $41,350 at February 1, 2003 was classified as current.
The following selected consolidated financial data has been derived from our audited consolidated financial statements and should be read in conjunction with “Management’s Discussion and Analysis of Financial Condition and Results of Operations” and the Company’s Consolidated Financial Statements and notes thereto and the other information contained elsewhere in this Form 10-K.
ITEM 7. MANAGEMENT'S DISCUSSION AND ANALYSIS OF FINANCIAL CONDITION AND RESULTS OF OPERATIONS Overview Stein Mart’s 262 stores offer the fashion merchandise, service and presentation of a better department or specialty store, at prices competitive with off-price retail chains. Currently with locations from California to New York, Stein Mart’s focused assortment of merchandise features moderate to designer brand-name apparel for women and men, as well as accessories, gifts, linens and shoes. Management believes that Stein Mart differentiates itself from typical off-price retailers by offering: (i) current-season merchandise carried by better department and specialty stores at value prices, (ii) a stronger merchandising “statement,” with more depth of color and size, and (iii) merchandise presentation more comparable to other upscale retailers. The Company faces competition for customers and for access to quality merchandise from better department stores, fine specialty stores and, to a lesser degree, from off-price retail chains. Many of these competitors are units of large national or regional chains that have substantially greater resources than the Company. The retail apparel industry is highly fragmented and competitive, and the off-price retail business may become even more competitive in the future. Highlights of 2005 include: • Gross profit increased $27.4 million for the year on a modest 0.2 percent comparable store sales increase • Gross profit as a percent of net sales improved 1.5 percentage points, driven by improved markup and decreased
markdowns • Selling, general and administrative (“SG&A”) expenses as a percent of net sales increased 0.4 percentage point,
primarily due to lack of leverage on lower than planned sales in the fourth quarter • Operating income improved to 5.4 percent of net sales in 2005 from 4.2 percent of net sales in 2004 • Began transforming the Home area with a new Home area merchandise team • Conducted extensive market research to identify merchandise category opportunities • Incurred no debt; ended the year with cash and short-term investments of $125.1 million • Initiated a $0.0625 per share quarterly cash dividend to shareholders • Opened seven new stores, relocated one store, and closed six stores (262 stores were open at year-end). The seven
new stores generated $25.0 million in sales in 2005 • Began a major investment phase in upgraded technology and store improvements with $34.8 million in capital
expenditures o Purchased Oracle/ProfitLogic markdown optimization software to enhance markdown decision-making and enable
regional markdowns o Rolled out the Oracle/360Commerce technology to speed transactions in 68 stores
Outlook The following initiatives are expected to have strategic prominence in the Company’s operations in 2006: • Full integration of Oracle/ProfitLogic markdown optimization software, which should begin to positively impact gross
margin in the second half of 2006 • Expect to expand the store network more aggressively than in the previous four years, with most new stores opening in
the second half of the year. A total of eight under-performing stores are planned to close • Introduce the newly-assorted Home area (Gifts & Linens) by the end of 1Q ‘06 • Eliminate the children’s apparel business beginning in 2Q ’06, to be replaced by additional categories of ready-to-wear
and intimate apparel • Expect to invest $60 million in capital expenditures to open new stores and continue investment in systems and store
upgrades for increased productivity and enhanced customer service Stores There were 262 stores open as of January 28, 2006, and 261 stores open as of January 29, 2005 and January 31, 2004. 2005 2004 2003
Stores at beginning of year 261 261 265 Stores opened during the year 7 7 12 Stores closed during the year (6) (7) (16) Stores at the end of year 262 261 261
15

Results of Operations The following table sets forth each line item of the Consolidated Statements of Operations expressed as a percentage of the Company's net sales (numbers may not add due to rounding): 2005 2004 2003 Net sales 100.0% 100.0% 100.0% Cost of merchandise sold 71.9 73.4 75.0 Gross profit 28.1 26.6 25.0 Selling, general and administrative expenses 23.8 23.4 25.4 Other income, net 1.0 1.0 1.0 Income from operations 5.3 4.2 0.6 Interest income (expense), net 0.1 - (0.1) Income from continuing operations before income taxes 5.4 4.2 0.5 Provision for income taxes 2.0 1.6 0.2 Income from continuing operations 3.4 2.6 0.3 Loss from discontinued operations, net of tax benefit - - (0.1) Net income 3.4% 2.6% 0.2% Store Closings During 2005 and 2004, the Company closed 13 under-performing stores (see Notes 3 and 4 to the consolidated financial statements) whose aggregate losses from operations for 2005 and 2004 were $3.5 million and $8.2 million, respectively. Three stores closed during 2003 and 2004 resulted in the exit from certain markets and, in accordance with Statement of Financial Accounting Standards (“SFAS”) No. 144, are classified as discontinued operations, as cash flows of these stores have been eliminated from ongoing operations. The Company plans to close eight stores during 2006 primarily at natural lease exit dates, so lease termination costs in 2006 should not be significant. Sales and operating losses for the six stores closed in 2005 and seven stores closed in 2004 are shown below for the years ended January 28, 2006 and January 29, 2005. Included in the 2004 column are operating results of the seven stores closed in 2004, in addition to the six stores closed in 2005. 2005 2004
Sales from closed stores: Included in continuing operations $ 6,383 $29,063 Included in discontinued operations - 942 $ 6,383 $30,005 Operating losses from closed stores: Included in continuing operations $ (3,530) $ (7,973) Included in discontinued operations - (234) $ (3,530) $ (8,207) Operating losses from closed stores include the following store closing and asset impairment expenses: Continuing operations: 2005 2004
Lease termination costs $2,164 $1,991 Asset impairment charges, net - 527 Severance 534 647 Other 2 215 2,700 3,380 Discontinued operations: Lease termination costs - 77 Severance - 77 - 154 Total $2,700 $3,534 Continuing Operations Year Ended January 28, 2006 Compared to Year Ended January 29, 2005 The 1.5% total sales increase for the year ended January 28, 2006 from the prior year reflects a 0.2% increase in net sales from comparable stores, the opening of seven new stores which contributed $25.0 million to net sales, and the closing of six stores. The small increase in net sales from comparable stores was primarily due to a 4.4% decrease in net sales from comparable stores during the fourth quarter. The fourth quarter was negatively impacted by phasing out certain merchandise categories in the home area which were not fully replaced in time for the holiday selling season, as well as a later transition to spring apparel.
16
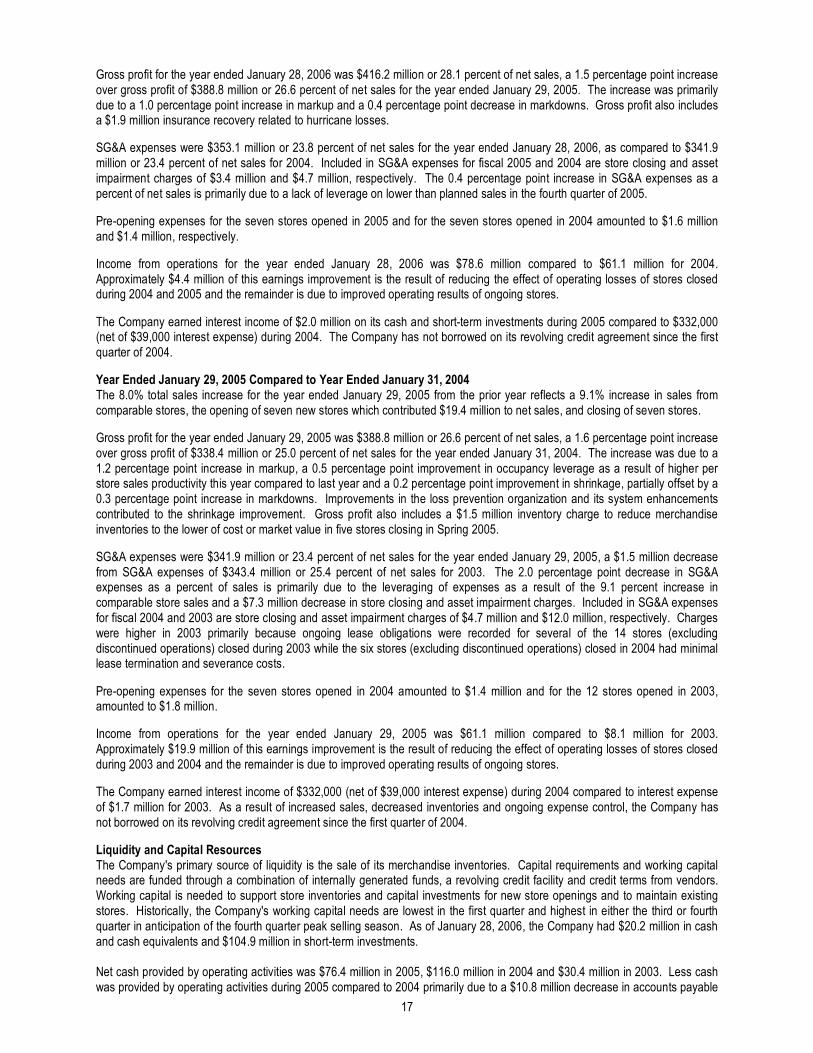
Gross profit for the year ended January 28, 2006 was $416.2 million or 28.1 percent of net sales, a 1.5 percentage point increase over gross profit of $388.8 million or 26.6 percent of net sales for the year ended January 29, 2005. The increase was primarily due to a 1.0 percentage point increase in markup and a 0.4 percentage point decrease in markdowns. Gross profit also includes a $1.9 million insurance recovery related to hurricane losses. SG&A expenses were $353.1 million or 23.8 percent of net sales for the year ended January 28, 2006, as compared to $341.9 million or 23.4 percent of net sales for 2004. Included in SG&A expenses for fiscal 2005 and 2004 are store closing and asset impairment charges of $3.4 million and $4.7 million, respectively. The 0.4 percentage point increase in SG&A expenses as a percent of net sales is primarily due to a lack of leverage on lower than planned sales in the fourth quarter of 2005. Pre-opening expenses for the seven stores opened in 2005 and for the seven stores opened in 2004 amounted to $1.6 million and $1.4 million, respectively. Income from operations for the year ended January 28, 2006 was $78.6 million compared to $61.1 million for 2004. Approximately $4.4 million of this earnings improvement is the result of reducing the effect of operating losses of stores closed during 2004 and 2005 and the remainder is due to improved operating results of ongoing stores. The Company earned interest income of $2.0 million on its cash and short-term investments during 2005 compared to $332,000 (net of $39,000 interest expense) during 2004. The Company has not borrowed on its revolving credit agreement since the first quarter of 2004. Year Ended January 29, 2005 Compared to Year Ended January 31, 2004 The 8.0% total sales increase for the year ended January 29, 2005 from the prior year reflects a 9.1% increase in sales from comparable stores, the opening of seven new stores which contributed $19.4 million to net sales, and closing of seven stores. Gross profit for the year ended January 29, 2005 was $388.8 million or 26.6 percent of net sales, a 1.6 percentage point increase over gross profit of $338.4 million or 25.0 percent of net sales for the year ended January 31, 2004. The increase was due to a 1.2 percentage point increase in markup, a 0.5 percentage point improvement in occupancy leverage as a result of higher per store sales productivity this year compared to last year and a 0.2 percentage point improvement in shrinkage, partially offset by a 0.3 percentage point increase in markdowns. Improvements in the loss prevention organization and its system enhancements contributed to the shrinkage improvement. Gross profit also includes a $1.5 million inventory charge to reduce merchandise inventories to the lower of cost or market value in five stores closing in Spring 2005. SG&A expenses were $341.9 million or 23.4 percent of net sales for the year ended January 29, 2005, a $1.5 million decrease from SG&A expenses of $343.4 million or 25.4 percent of net sales for 2003. The 2.0 percentage point decrease in SG&A expenses as a percent of sales is primarily due to the leveraging of expenses as a result of the 9.1 percent increase in comparable store sales and a $7.3 million decrease in store closing and asset impairment charges. Included in SG&A expenses for fiscal 2004 and 2003 are store closing and asset impairment charges of $4.7 million and $12.0 million, respectively. Charges were higher in 2003 primarily because ongoing lease obligations were recorded for several of the 14 stores (excluding discontinued operations) closed during 2003 while the six stores (excluding discontinued operations) closed in 2004 had minimal lease termination and severance costs. Pre-opening expenses for the seven stores opened in 2004 amounted to $1.4 million and for the 12 stores opened in 2003, amounted to $1.8 million. Income from operations for the year ended January 29, 2005 was $61.1 million compared to $8.1 million for 2003. Approximately $19.9 million of this earnings improvement is the result of reducing the effect of operating losses of stores closed during 2003 and 2004 and the remainder is due to improved operating results of ongoing stores. The Company earned interest income of $332,000 (net of $39,000 interest expense) during 2004 compared to interest expense of $1.7 million for 2003. As a result of increased sales, decreased inventories and ongoing expense control, the Company has not borrowed on its revolving credit agreement since the first quarter of 2004. Liquidity and Capital Resources The Company's primary source of liquidity is the sale of its merchandise inventories. Capital requirements and working capital needs are funded through a combination of internally generated funds, a revolving credit facility and credit terms from vendors. Working capital is needed to support store inventories and capital investments for new store openings and to maintain existing stores. Historically, the Company's working capital needs are lowest in the first quarter and highest in either the third or fourth quarter in anticipation of the fourth quarter peak selling season. As of January 28, 2006, the Company had $20.2 million in cash and cash equivalents and $104.9 million in short-term investments. Net cash provided by operating activities was $76.4 million in 2005, $116.0 million in 2004 and $30.4 million in 2003. Less cash was provided by operating activities during 2005 compared to 2004 primarily due to a $10.8 million decrease in accounts payable
17

during 2005 compared to a $34.0 million increase during 2004. More cash was provided by operating activities in 2004 compared to 2003 primarily due to an increase in net income and an increase in accounts payable. A significant increase in accounts payable occurred at year-end 2004 as a result of merchandise receipts being more current. Merchandise inventories have continued to be more current throughout 2005. Cash provided by operating activities includes cash provided by discontinued operations of $17,000 and $54,000 in 2004 and 2003, respectively. Cash used in investing activities was $67.3 million in 2005, $91.5 million in 2004 and $13.9 million in 2003. Capital expenditures were $34.8 million, $19.1 million and $13.9 million for 2005, 2004 and 2003, respectively. Capital expenditures were higher in 2005 compared to 2004 and 2003 as the Company began a major investment phase in upgraded technology and store improvements including the purchase of Oracle/ProfitLogic markdown optimization software to enhance markdown decision-making and enable regional markdowns and the roll-out of Oracle/360Commerce technology to speed point-of-sale transactions in 68 stores.
The Company expects to invest approximately $60 million in capital expenditures in 2006 to open new stores and continue investment in systems and store upgrades for increased productivity and enhanced customer service. The cost of opening a typical new store generally ranges from $500,000 to $700,000 for fixtures, equipment, leasehold improvements and pre-opening costs (primarily advertising, stocking and training). Pre-opening costs are expensed at the time of opening. Initial inventory investment for a new store is approximately $1.0 million. In December 2005, the Company amended its senior revolving credit agreement (the “Agreement”) with a group of lenders. The principal purposes of the amendment were to extend the term of the Agreement to January 2011, decrease the maximum credit from $150 million to $100 million, add an option to increase the facility by an additional $50 million, and reduce interest rates and unused line fees. At January 28, 2006, there were no direct borrowings and no Event of Default existed under the terms of the Agreement. The Company believes that expected net cash provided by operating activities and unused borrowing capacity under the revolving credit agreement will be sufficient to fund anticipated current and long-term capital expenditures and working capital requirements. Should current operating conditions deteriorate, management can borrow on the revolving credit agreement or adjust operating plans, including new store rollout. Contractual Obligations To facilitate an understanding of the Company’s contractual obligations, the following payments due by period data is provided:
Total
Less than 1 Year
1 – 2 Years
3 – 5 Years
After 5 Years
Operating leases $356,376 $64,788 $59,758 $136,520 $95,310 At January 28, 2006, the Company had no direct borrowings on its credit facility. Other long-term liabilities on the balance sheet include deferred income taxes, deferred compensation and other long-term liabilities that do not have specific due dates, so are excluded from the preceding table. Other long-term liabilities also include long-term store closing reserves, a component of which is future minimum payments under non-cancelable leases for closed stores. These future minimum lease payments total $12.8 million and are included in the above table. Off-Balance Sheet Arrangements The Company has outstanding standby letters of credit totaling $7.0 million securing certain insurance programs at January 28, 2006. If certain conditions were to occur under these arrangements, the Company would be required to satisfy the obligations in cash. Due to the nature of these arrangements and based on historical experience, the Company does not expect to make any payments; therefore, the letters of credit are excluded from the preceding table. There are no other off-balance sheet arrangements that could affect the financial condition of the Company.
18
Cash used in financing activities was $9.2 million in 2005, $16.2 million in 2004 and $14.4 million in 2003. More cash was used in financing activities in 2004 as a result of the Company eliminating borrowings under its revolving credit agreement. During 2005, cash was used to repurchase 836,550 shares of the Company’s common stock for $17.3 million. As of January 28, 2006, there are 1.2 million shares remaining to be repurchased pursuant to the Board of Directors current authorizations. In March 2006 the Company declared a quarterly cash dividend of $0.0625 per share which was paid on March 24, 2006. On April 4, 2006 the Board of Directors declared a special cash dividend of $1.50 per share payable on April 28, 2006 to stockholders of record on April 17, 2006.
Seasonality The Company's business is seasonal in nature with a higher percentage of the Company’s merchandise sales and earnings generated in the fall and holiday selling seasons. Accordingly, selling, general and administrative expenses are typically higher as a percent of net sales during the first three quarters of each year. Critical Accounting Policies The preparation of the Company’s consolidated financial statements requires management to make estimates and assumptions that affect the reported amounts of assets, liabilities, expenses and related disclosure of contingent assets and liabilities. Management bases its estimates and judgments on historical experience and other relevant factors, the results of which form the basis for making judgments about the carrying values of assets and liabilities that are not readily apparent from other sources. While the Company believes that the historical experience and other factors considered provide a meaningful basis for the accounting policies applied in the preparation of the financial statements, the Company cannot guarantee that its estimates and assumptions will be accurate, which could require the Company to make adjustments to these estimates in future periods. Following is a summary of the more significant accounting policies: Inventories. Merchandise inventories are valued at the lower of average cost or market, on a first-in first-out basis, using the retail inventory method (RIM). RIM is an averaging method that is widely used in the retail industry. The use of RIM results in inventories being valued at the lower of cost or market as markdowns are taken as a reduction of the retail values of inventories. Based on a review of historical markdowns, current business trends and seasonal inventory categories, additional inventory reserves may be recorded to reflect estimated markdowns which may be required to liquidate certain inventories and reduce inventories to the lower of cost or market. Management believes its inventory valuation methods approximate the net realizable value of clearance inventory and result in valuing inventory at the lower of cost or market. Vendor Allowances. The Company receives allowances from some of its vendors primarily related to markdown reimbursements, damaged/defective merchandise and vendor compliance issues. Allowances received from vendors related to profitability of inventory recently sold and damaged/defective inventory are reflected as reductions to cost of merchandise sold. Allowances received due to compliance issues (primarily violations of shipping and merchandise preparation requirements) are reflected as a reduction of the cost of the merchandise. Long-Lived Assets. Long-lived assets are reviewed for impairment whenever events or changes in circumstances indicate that the carrying amount of an asset may not be recoverable. Factors used in the review include management’s plans for future operations, recent operating results and projected cash flows. For long-lived assets held for use, an impairment loss is recognized if the sum of the future undiscounted cash flows from the use of the assets is less than the carrying value of the assets. The amount of the impairment charge is the excess of the carrying value of the asset over its fair value. Fair value is based on estimated market values for similar assets. Store Closing Costs. The Company follows SFAS No. 146, “Accounting for Costs Associated with Exit or Disposal Activities,” to record store closing costs. SFAS No. 146 requires the recognition of costs associated with exit or disposal activities when they are incurred rather than at the date of commitment to an exit or disposal plan. Insurance Reserve Estimates. The Company uses a combination of insurance and self-insurance for various risks including workers’ compensation, general liability and associate-related health care benefits, a portion of which is paid by the covered employees. The Company is responsible for paying the claims that are less than the insured limits. The reserves recorded for these claims are estimated actuarially, based on claims filed and claims incurred but not reported. These reserve estimates are adjusted based upon actual claims filed and settled. The estimated accruals for these reserves could be significantly affected if future claims differ from historical trends and other actuarial assumptions. Revenue Recognition. Revenue from sales of the Company’s merchandise is recognized at the time of sale, net of any returns and allowances, discounts and percentage-off coupons. Future merchandise returns are estimated based on historical experience. Leased department sales are excluded from net sales; commissions, net of related selling expenses, and rental income from leased departments are included in other income, net. Operating Leases. The Company leases retail stores under operating leases. Certain lease agreements contain rent holidays, rent escalation clauses and/or contingent rent provisions. The Company recognizes rent expense on a straight-line basis over the expected lease term and records the difference between the amounts charged to expense and the rent paid as a deferred rent liability. The landlord/lessor constructs the building leasehold improvements for the majority of the Company’s stores. For other store operating leases which require the Company/lessee to construct the building leasehold improvements, these assets are considered to be landlord assets and the Company records the cost of these leasehold improvements in excess of any landlord construction allowance received as prepaid rent which is amortized to rent expense over the lease term.
19

For a complete listing of our significant accounting policies, see Note 1 to the consolidated financial statements. New Accounting Pronouncements In December 2004, the FASB issued SFAS No. 123R, “Share-Based Payment”, which replaces SFAS No. 123 and supersedes APB Opinion No. 25. SFAS No. 123R requires all share-based payments to employees, including grants of employee stock options, to be recognized in the financial statements based on their fair values. In April 2005, the Securities Exchange Commission amended the compliance date to the first annual period beginning after June 15, 2005 for public companies. The Company will adopt the provisions of SFAS No. 123R in the first quarter of 2006. The Company has elected to apply the modified prospective transition method to all past awards outstanding and unvested as of the effective date of January 29, 2006, and will recognize the associated expense over the remaining vesting period based on the fair values previously determined and disclosed as part of its pro-forma disclosures. Thus, the Company will not restate the results of prior periods. The Company expects the effects of applying the modified prospective transition method to outstanding and unvested awards as of the effective date to be immaterial. In May 2005, the FASB issued SFAS No. 154, “Accounting Changes and Error Corrections – A Replacement of APB Opinion No. 20 and FASB Statement No. 3”. SFAS No. 154 requires retrospective application to prior period financial statements of changes in accounting principle, unless it is impracticable to determine either the period-specific effects or the cumulative effect of the change. SFAS No. 154 also redefines “restatement” as the revising of previously issued financial statements to reflect the correction of an error. This statement is effective for accounting changes and corrections of errors made in fiscal years beginning after December 15, 2005. Management does not expect the adoption of SFAS No. 154 to have a material effect on the Company’s Consolidated Balance Sheets or Statements of Operations. ITEM 7A. QUANTITATIVE AND QUALITATIVE DISCLOSURES ABOUT MARKET RISK The Company is exposed to interest rate risk primarily through borrowings under its revolving credit facility. The facility permits debt commitments up to $100.0 million, has a January 2011 maturity date and bears interest at spreads over the prime rate and LIBOR. The Company eliminated borrowings under its credit facility during the first quarter of 2004 and, at January 28, 2006, had no direct borrowings on its credit facility. Management believes that its exposure to market risk associated with its borrowings is not material. ITEM 8. FINANCIAL STATEMENTS AND SUPPLEMENTARY DATA The consolidated financial statements of the Company and the Report of Independent Registered Certified Public Accounting Firm thereon are filed pursuant to this Item 8 and are included in this report beginning on page F-1. ITEM 9. CHANGES IN AND DISAGREEMENTS WITH ACCOUNTANTS ON ACCOUNTING AND FINANCIAL DISCLOSURE None. ITEM 9A. CONTROLS AND PROCEDURES Evaluation of Disclosure Controls and Procedures and Changes in Internal Control The Company, under the supervision and with the participation of the Company’s management, including the Chief Executive Officer and Chief Financial Officer, has carried out an evaluation of the effectiveness of the design and operation of the Company’s disclosure controls and procedures, as defined in Rule 13a-15(e) and 15d-15(e) under the Securities Exchange Act of 1934, as amended, as of the end of the period covered by this report. No system of controls, no matter how well designed and operated, can provide absolute assurance that the objectives of the system of controls are met, and no evaluation of controls can provide absolute assurance that the system of controls has operated effectively in all cases. The Company’s disclosure controls and procedures however are designed to provide reasonable assurance that the objectives of disclosure controls and procedures are met. Based on the evaluation discussed above, the Company’s Chief Executive Officer and Chief Financial Officer have concluded that the Company’s disclosure controls and procedures were effective as of the date of that evaluation to provide reasonable assurance that the objectives of disclosure controls and procedures are met. Management’s Report on Internal Control Over Financial Reporting The Company’s management is responsible for establishing and maintaining adequate internal control over financial reporting, as such term is defined in Exchange Act Rule 13a-15(f). The Company’s internal control over financial reporting was designed to provide reasonable assurance regarding the reliability of financial reporting and the preparation of financial statements for external purposes in accordance with generally accepted accounting principles. Because of its inherent limitations, internal control over financial reporting may not prevent or detect misstatements. Also, projections of any evaluation of effectiveness to future periods are subject to the risk that controls may become inadequate because of changes in conditions, or that the degree of compliance with the policies or procedures may deteriorate.
20
Management assessed the effectiveness of the Company’s internal control over financial reporting as of January 28, 2006. In making this assessment, management used the criteria set forth in Internal Control-Integrated Framework issued by the Committee of Sponsoring Organizations of the Treadway Commission. Based on that assessment, management concluded that the Company’s internal control over financial reporting was effective as of January 28, 2006. Management’s assessment of the effectiveness of the Company’s internal control over financial reporting as of January 28, 2006 has been audited by PricewaterhouseCoopers LLP, an independent registered certified public accounting firm, as stated in their report which is included on page F-1 herein. ITEM 9B. OTHER INFORMATION None. PART III ITEM 10. DIRECTORS AND EXECUTIVE OFFICERS OF THE REGISTRANT The information required by this item appears under the captions “Section 16(a) Beneficial Ownership Reporting Compliance”, "Election of Directors" and “Executive Officers” in the Company's Proxy Statement for its 2006 Annual Meeting of Stockholders and is incorporated by reference. The Company has adopted a code of ethics applicable to all of the Company’s officers, directors and employees, including the Company’s principal executive officer, principal financial officer, principal accounting officer and persons performing similar functions. The text of this code of ethics may be found on our web site at www.steinmart.com. The Company intends to post notice of any waiver from, or amendment to, any provision of our code of ethics on our web site. ITEM 11. EXECUTIVE COMPENSATION The information required by this item appears under the caption "Executive Compensation" and “Certain Transactions; Compensation Committee Interlocks and Insider Participation” in the Company's Proxy Statement for its 2006 Annual Meeting of Stockholders and is incorporated by reference. ITEM 12. SECURITY OWNERSHIP OF CERTAIN BENEFICIAL OWNERS AND MANAGEMENT AND RELATED STOCKHOLDER MATTERS The information required by this item appears under the caption "Voting Securities" in the Company's Proxy Statement for its 2006 Annual Meeting of Stockholders and is incorporated by reference. ITEM 13. CERTAIN RELATIONSHIPS AND RELATED TRANSACTIONS The information required by this item appears under the caption "Certain Transactions; Compensation Committee Interlocks and Insider Participation" in the Company's Proxy Statement for its 2006 Annual Meeting of Stockholders and is incorporated by reference. ITEM 14. PRINCIPAL ACCOUNTING FEES AND SERVICES The information required by this item appears under the caption “Independent Registered Certified Public Accounting Firm” in the Company’s Proxy Statement for its 2006 Annual Meeting of Stockholders and is incorporated by reference. PART IV ITEM 15. EXHIBITS AND FINANCIAL STATEMENT SCHEDULES (a) The following financial statements and exhibits are filed as part of this report or are incorporated herein as indicated.
1. List of Financial Statements Page Report of Independent Registered Certified Public Accounting Firm F–1 Consolidated Balance Sheets F–2 Consolidated Statements of Operations F–3 Consolidated Statements of Stockholders’ Equity F–4 Consolidated Statements of Cash Flows F–5 Notes to Consolidated Financial Statements F–6 2. List of Financial Statement Schedules All schedules are omitted because they are not applicable or the required information is presented in the financial statements or notes thereto. 3. List of Exhibits The exhibits are listed in Exhibit Index incorporated herein.
21

22
SIGNATURES Pursuant to the requirements of Section 13 or 15(d) of the Securities Exchange Act of 1934, the registrant has duly caused this report to be signed on its behalf by the undersigned, thereunto duly authorized. STEIN MART, INC.
Date: April 6, 2006 By: /s/ Michael D. Fisher
Michael D. Fisher, President and Chief Executive Officer
Pursuant to the requirements of the Securities Exchange Act of 1934, this report has been signed by the following persons on behalf of the registrant and in the capacities indicated on the 6th day of April, 2006. /s/ Jay Stein /s/ Linda McFarland Farthing Jay Stein Linda McFarland Farthing Chairman of the Board Director /s/ John H. Williams, Jr. /s/ Mitchell W. Legler John H. Williams, Jr. Mitchell W. Legler Vice Chairman Director /s/ Michael D. Fisher /s/ Michael D. Rose Michael D. Fisher Michael D. Rose President and Chief Executive Officer Director /s/ James G. Delfs /s/ Richard L. Sisisky James G. Delfs Richard L. Sisisky Senior Vice President and Chief Financial Officer Director /s/ Clayton E. Roberson, Jr. /s/ Martin E. Stein, Jr. Clayton E. Roberson, Jr. Martin E. Stein, Jr. Vice President and Controller Director /s/ Alvin R. Carpenter /s/ J. Wayne Weaver Alvin R. Carpenter J. Wayne Weaver Director Director /s/ James H. Winston James H. Winston Director
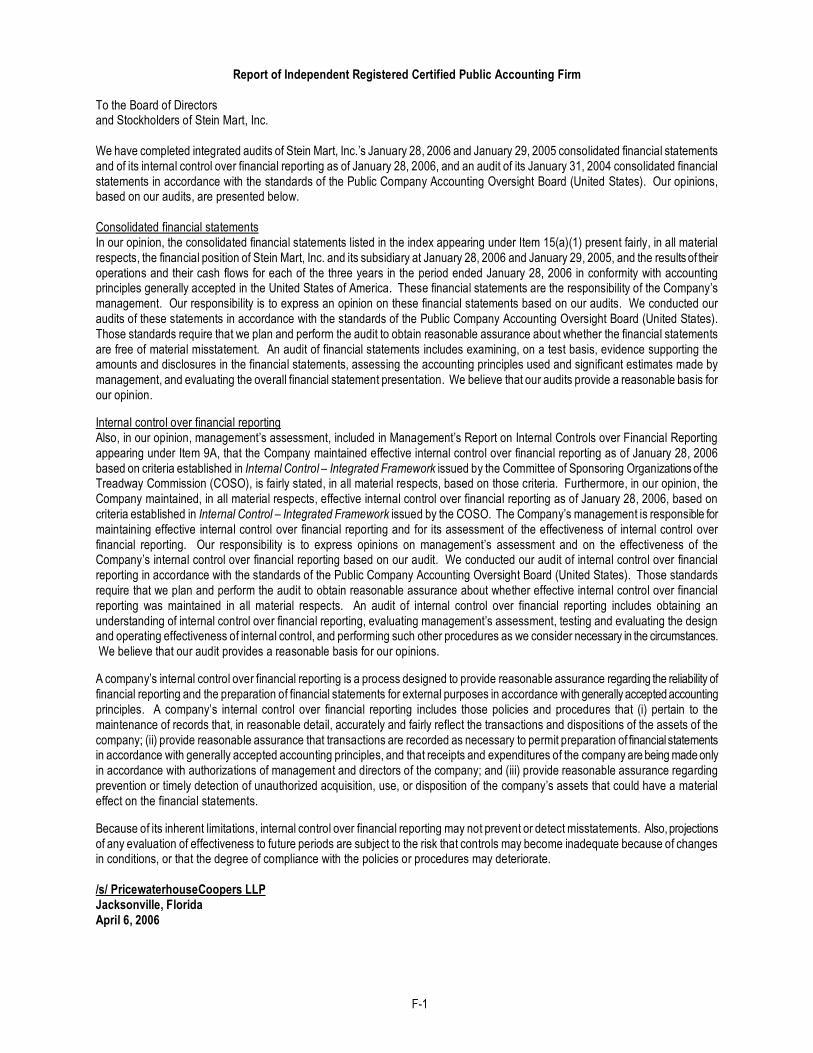
F-1
Report of Independent Registered Certified Public Accounting Firm
To the Board of Directors and Stockholders of Stein Mart, Inc. We have completed integrated audits of Stein Mart, Inc.’s January 28, 2006 and January 29, 2005 consolidated financial statements and of its internal control over financial reporting as of January 28, 2006, and an audit of its January 31, 2004 consolidated financial statements in accordance with the standards of the Public Company Accounting Oversight Board (United States). Our opinions, based on our audits, are presented below. Consolidated financial statements In our opinion, the consolidated financial statements listed in the index appearing under Item 15(a)(1) present fairly, in all material respects, the financial position of Stein Mart, Inc. and its subsidiary at January 28, 2006 and January 29, 2005, and the results of their operations and their cash flows for each of the three years in the period ended January 28, 2006 in conformity with accounting principles generally accepted in the United States of America. These financial statements are the responsibility of the Company’s management. Our responsibility is to express an opinion on these financial statements based on our audits. We conducted our audits of these statements in accordance with the standards of the Public Company Accounting Oversight Board (United States). Those standards require that we plan and perform the audit to obtain reasonable assurance about whether the financial statements are free of material misstatement. An audit of financial statements includes examining, on a test basis, evidence supporting the amounts and disclosures in the financial statements, assessing the accounting principles used and significant estimates made by management, and evaluating the overall financial statement presentation. We believe that our audits provide a reasonable basis for our opinion. Internal control over financial reporting Also, in our opinion, management’s assessment, included in Management’s Report on Internal Controls over Financial Reporting appearing under Item 9A, that the Company maintained effective internal control over financial reporting as of January 28, 2006 based on criteria established in Internal Control – Integrated Framework issued by the Committee of Sponsoring Organizations of the Treadway Commission (COSO), is fairly stated, in all material respects, based on those criteria. Furthermore, in our opinion, the Company maintained, in all material respects, effective internal control over financial reporting as of January 28, 2006, based on criteria established in Internal Control – Integrated Framework issued by the COSO. The Company’s management is responsible for maintaining effective internal control over financial reporting and for its assessment of the effectiveness of internal control over financial reporting. Our responsibility is to express opinions on management’s assessment and on the effectiveness of the Company’s internal control over financial reporting based on our audit. We conducted our audit of internal control over financial reporting in accordance with the standards of the Public Company Accounting Oversight Board (United States). Those standards require that we plan and perform the audit to obtain reasonable assurance about whether effective internal control over financial reporting was maintained in all material respects. An audit of internal control over financial reporting includes obtaining an understanding of internal control over financial reporting, evaluating management’s assessment, testing and evaluating the design and operating effectiveness of internal control, and performing such other procedures as we consider necessary in the circumstances. We believe that our audit provides a reasonable basis for our opinions. A company’s internal control over financial reporting is a process designed to provide reasonable assurance regarding the reliability of financial reporting and the preparation of financial statements for external purposes in accordance with generally accepted accounting principles. A company’s internal control over financial reporting includes those policies and procedures that (i) pertain to the maintenance of records that, in reasonable detail, accurately and fairly reflect the transactions and dispositions of the assets of the company; (ii) provide reasonable assurance that transactions are recorded as necessary to permit preparation of financial statements in accordance with generally accepted accounting principles, and that receipts and expenditures of the company are being made only in accordance with authorizations of management and directors of the company; and (iii) provide reasonable assurance regarding prevention or timely detection of unauthorized acquisition, use, or disposition of the company’s assets that could have a material effect on the financial statements. Because of its inherent limitations, internal control over financial reporting may not prevent or detect misstatements. Also, projections of any evaluation of effectiveness to future periods are subject to the risk that controls may become inadequate because of changes in conditions, or that the degree of compliance with the policies or procedures may deteriorate. /s/ PricewaterhouseCoopers LLP Jacksonville, Florida April 6, 2006

F-2
Stein Mart, Inc. Consolidated Balance Sheets
(In thousands)
January 28, 2006 January 29, 2005
ASSETS Current assets: Cash and cash equivalents $ 20,200 $ 20,250 Short-term investments 104,935 72,475 Trade and other receivables 11,121 11,380 Inventories 265,788 277,164 Prepaid expenses and other current assets 13,672 13,010
Total current assets 415,716 394,279 Property and equipment, net 87,106 71,048 Other assets 17,023 14,781
Total assets $519,845 $480,108
LIABILITIES AND STOCKHOLDERS’ EQUITY Current liabilities: Accounts payable $ 88,408 $ 99,163 Accrued liabilities 80,337 78,785 Income taxes payable 5,453 5,089
Total current liabilities 174,198 183,037 Other liabilities 21,908 20,561
Total liabilities 196,106 203,598 COMMITMENTS AND CONTINGENCIES (Note 8) Stockholders’ equity: Preferred stock - $.01 par value; 1,000,000 shares authorized; no shares issued or outstanding Common stock - $.01 par value; 100,000,000 shares authorized; 43,516,372 and 42,880,031 shares issued and outstanding, respectively 435 429 Additional paid-in capital 21,967 14,340 Unearned compensation (3,704) (603) Retained earnings 305,041 262,344
Total stockholders’ equity 323,739 276,510
Total liabilities and stockholders’ equity $519,845 $480,108
The accompanying notes are an integral part of these consolidated financial statements.
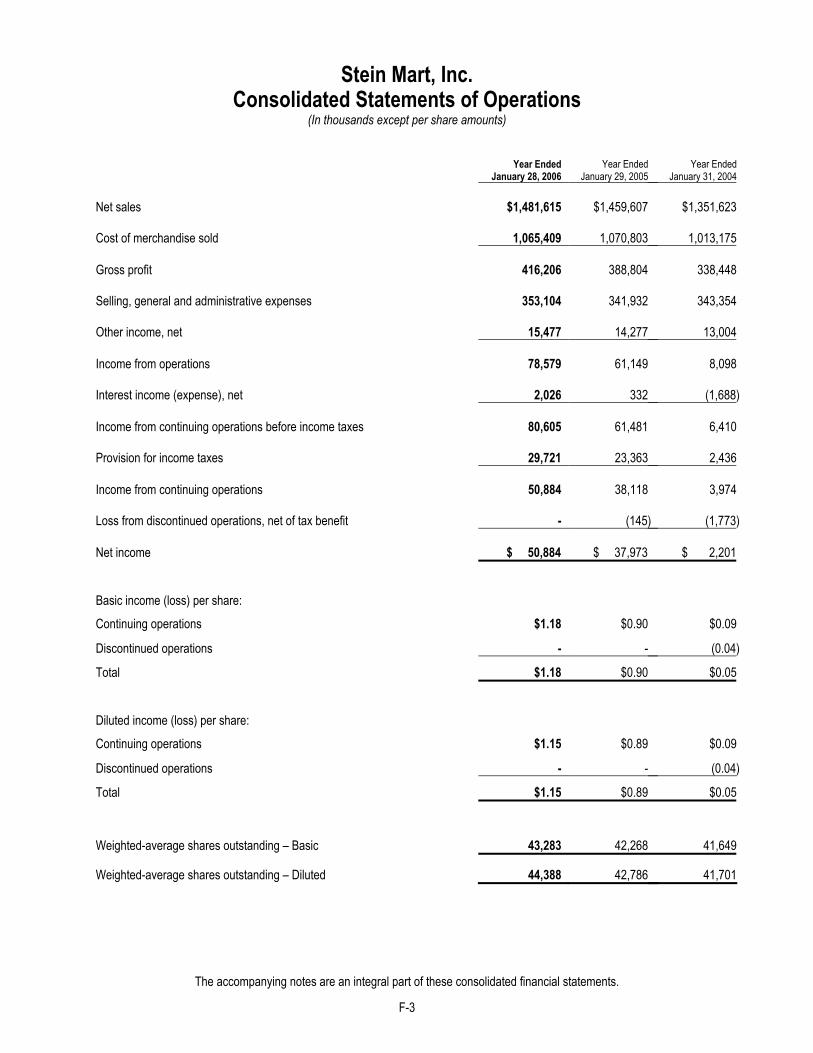
F-3
Stein Mart, Inc. Consolidated Statements of Operations
(In thousands except per share amounts) Year Ended
January 28, 2006 Year Ended
January 29, 2005 Year Ended
January 31, 2004
Net sales $1,481,615 $1,459,607 $1,351,623
Cost of merchandise sold 1,065,409 1,070,803 1,013,175
Gross profit 416,206 388,804 338,448
Selling, general and administrative expenses 353,104 341,932 343,354
Other income, net 15,477 14,277 13,004
Income from operations 78,579 61,149 8,098
Interest income (expense), net 2,026 332 (1,688)
Income from continuing operations before income taxes 80,605 61,481 6,410
Provision for income taxes 29,721 23,363 2,436
Income from continuing operations 50,884 38,118 3,974
Loss from discontinued operations, net of tax benefit - (145) (1,773)
Net income
Basic income (loss) per share:
Continuing operations $1.18 $0.90 $0.09
Discontinued operations - - (0.04)
Total $1.18 $0.90 $0.05
Diluted income (loss) per share:
Continuing operations $1.15 $0.89 $0.09
Discontinued operations - - (0.04)
Total $1.15 $0.89 $0.05
Weighted-average shares outstanding – Basic 43,283 42,268 41,649
Weighted-average shares outstanding – Diluted 44,388 42,786 41,701
The accompanying notes are an integral part of these consolidated financial statements.
$ 50,884 $ 37,973 $ 2,201
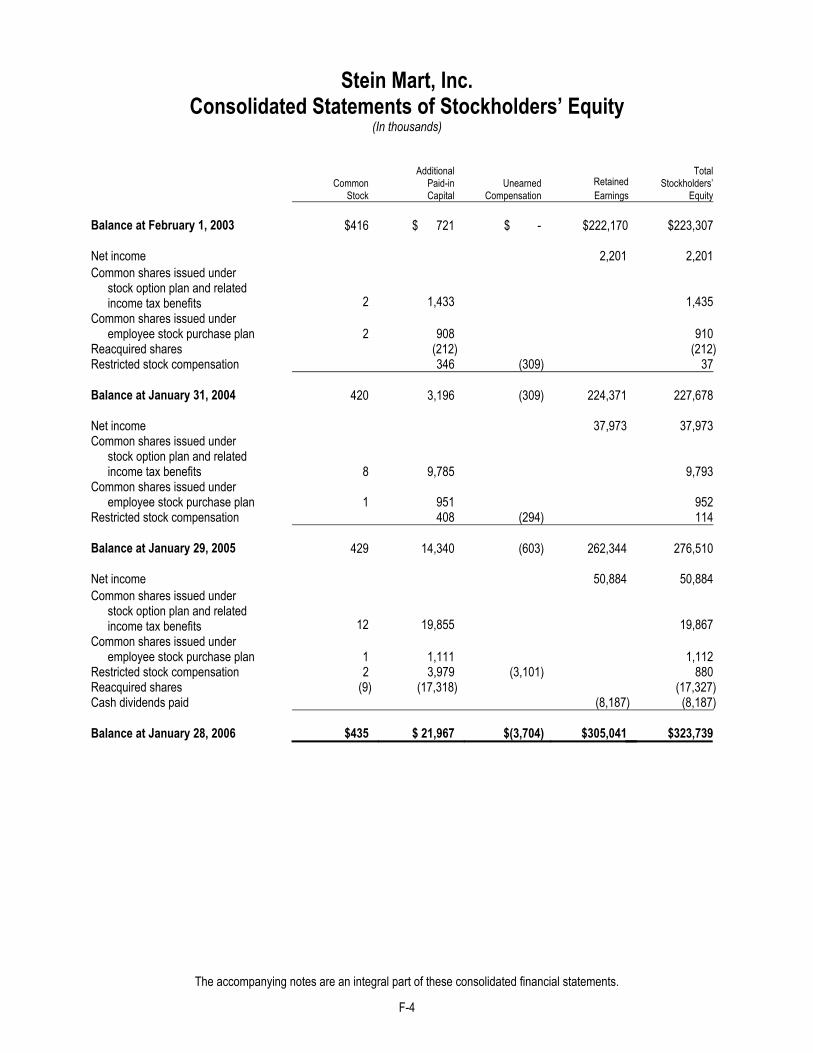
F-4
Stein Mart, Inc. Consolidated Statements of Stockholders’ Equity
(In thousands)
Common Stock
Additional
Paid-in Capital
Unearned Compensation
Retained Earnings
Total
Stockholders’ Equity
Balance at February 1, 2003
$416
$ 721
$ -
$222,170
$223,307
Net income
2,201
2,201
Common shares issued under stock option plan and related income tax benefits
2
1,433
1,435 Common shares issued under
2
908
910
Reacquired shares (212) (212) Restricted stock compensation 346 (309) 37 Balance at January 31, 2004
420
3,196
(309)
224,371
227,678
Net income
37,973
37,973
Common shares issued under stock option plan and related income tax benefits
8
9,785
9,793 Common shares issued under
1
951
952
Restricted stock compensation 408 (294) 114 Balance at January 29, 2005
429
14,340
(603)
262,344
276,510
Net income
50,884
50,884
Common shares issued under income tax benefits
12
19,855
19,867 Common shares issued under
1
1,111
1,112
Restricted stock compensation 2 3,979 (3,101) 880 Reacquired shares (9) (17,318) (17,327) Cash dividends paid (8,187) (8,187) Balance at January 28, 2006
$435
$ 21,967
$(3,704)
$305,041
$323,739
The accompanying notes are an integral part of these consolidated financial statements.
employee stock purchase plan
stock option plan and related
employee stock purchase plan
employee stock purchase plan

F-5
Stein Mart, Inc. Consolidated Statements of Cash Flows
(In thousands)
Year Ended January 28, 2006
Year Ended January 29, 2005
Year Ended January 31, 2004
Cash flows from operating activities: Net income $ 50,884 $ 37,973 $ 2,201 Adjustments to reconcile net income to net cash provided by operating activities: Depreciation and amortization 20,223 18,018 19,543 Impairment of property and other assets 708 2,103 3,881 Store closing charges 2,197 1,382 5,883 Gain from insurance settlement (639) - - Deferred income taxes 66 57 (1,734) Restricted stock compensation 880 114 37 Tax benefit from exercise of stock options 4,617 1,938 164 Changes in assets and liabilities: Trade and other receivables 898 (1,625) 692 Inventories 11,376 6,215 13,851 Prepaid expenses and other current assets (747) 603 (2,408) Other assets (3,804) (109) (2,483) Accounts payable (10,755) 34,045 (11,179) Accrued liabilities 1,297 12,145 4,499 Income taxes payable 364 5,089 (5,353) Other liabilities (1,202) (1,967) 2,784 Net cash provided by operating activities 76,363 115,981 30,378 Cash flows from investing activities: Capital expenditures (34,801) (19,066) (13,853) Purchases of short-term investments (1,971,320) (912,525) - Sales of short-term investments 1,938,860 840,050 - Net cash used in investing activities (67,261) (91,541) (13,853) Cash flows from financing activities: Net payments under notes payable to banks - (24,962) (16,388) Cash dividends paid (8,187) - - Proceeds from exercise of stock options 15,250 7,855 1,271 Proceeds from employee stock purchase plan 1,112 952 910 Repurchase of common stock (17,327) - (212) Net cash used in financing activities (9,152) (16,155) (14,419) Net (decrease) increase in cash and cash equivalents (50) 8,285 2,106 Cash and cash equivalents at beginning of year 20,250 11,965 9,859 Cash and cash equivalents at end of year $ 20,200 $ 20,250 $ 11,965
Supplemental disclosures of cash flow information: Income taxes paid $ 25,027 $ 17,154 $ 7,723 Interest paid - 63 1,702
The accompanying notes are an integral part of these consolidated financial statements.

STEIN MART, INC. NOTES TO CONSOLIDATED FINANCIAL STATEMENTS
F-6
1. Summary of Significant Accounting Policies and Other Information As of January 28, 2006 the Company operated a chain of 262 off-price retail stores in 30 states and the District of Columbia that features fashionable, current-season, moderate to better brand-name apparel for men and women, as well as accessories, gifts, linens and shoes. Consolidation. The consolidated financial statements include the accounts of the Company and its wholly-owned subsidiary. All inter-company accounts have been eliminated in consolidation. Fiscal Year End. The Company’s fiscal year ends on the Saturday closest to January 31. Results for 2005, 2004 and 2003 are for the 52 weeks ended January 28, 2006, January 29, 2005 and January 31, 2004, respectively. Use of Estimates. The preparation of financial statements in conformity with generally accepted accounting principles requires management to make estimates and assumptions that affect the reported amounts of assets and liabilities and disclosure of contingent assets and liabilities at the date of the financial statements and the reported amounts of revenues and expenses during the reporting period. Actual results could differ from those estimates. Cash Equivalents. Cash equivalents include money market funds and are stated at cost, which approximates fair value. Short-Term Investments. Short-term investments include investment grade variable-rate debt obligations and are classified as available-for-sale securities. These securities are recorded at cost, which approximates fair value due to their variable interest rates, which reset every 7-35 days. Despite the long-term nature of their stated contractual maturities, the Company has the ability to quickly liquidate these securities. As a result of the resetting variable rates, there are no cumulative gross unrealized or realized holding gains or losses from these investments. All income generated from these investments is recorded as interest income. Inventories. Merchandise inventories are valued at the lower of average cost or market, on a first-in first-out basis, using the retail inventory method (RIM). RIM is an averaging method that is widely used in the retail industry. The use of RIM results in inventories being valued at the lower of cost or market as markdowns are taken as a reduction of the retail values of inventories. Based on a review of historical markdowns, current business trends and seasonal inventory categories, additional inventory reserves may be recorded to reflect estimated markdowns which may be required to liquidate certain inventories and reduce inventories to the lower of cost or market. Management believes its inventory valuation methods approximate the net realizable value of clearance inventory and result in valuing inventory at the lower of cost or market. Vendor Allowances. The Company receives allowances from some of its vendors primarily related to markdown reimbursements, damaged/defective merchandise and vendor compliance issues. Allowances received from vendors related to profitability of inventory recently sold and damaged/defective inventory are reflected as reductions to cost of merchandise sold. Allowances received due to compliance issues (primarily violations of shipping and merchandise preparation requirements) are reflected as a reduction of the cost of the merchandise. Property and Equipment. Property and equipment are stated at cost, less accumulated depreciation and amortization. Depreciation is computed using the straight-line method over estimated useful lives of 3-10 years for fixtures, equipment and software and 5-15 years for leasehold improvements. Leasehold improvements are amortized over the shorter of the estimated useful lives of the improvements or the term of the lease. Impairment of Long-Lived Assets. The Company follows Statement of Financial Accounting Standards (“SFAS”) No. 144, “Accounting for the Impairment or Disposal of Long-Lived Assets,” which requires impairment losses to be recorded on long-lived assets used in operations whenever events or changes in circumstances indicate that the net carrying amounts may not be recoverable. For long-lived assets held for use, an impairment loss is recognized if the sum of the future undiscounted cash flows from the use of the assets is less than the carrying value of the assets. The amount of the impairment is the excess of the carrying value of the asset over its fair value. Fair value is based on estimated market values of similar assets. Impairment reviews are performed for individual stores. Factors used in the review include management’s plans for future operations, recent operating results and projected cash flows. Store Closing Costs. The Company follows SFAS No. 146, “Accounting for Costs Associated with Exit or Disposal Activities,” to record store closing costs. SFAS No. 146 requires the recognition of costs associated with exit or disposal activities when they are incurred rather than at the date of commitment to an exit or disposal plan. Insurance Reserves. The Company uses a combination of insurance and self-insurance for various risks including workers’ compensation, general liability and associate-related health care benefits. Claim liabilities are estimated actuarially, based on claims filed and claims incurred but not reported.
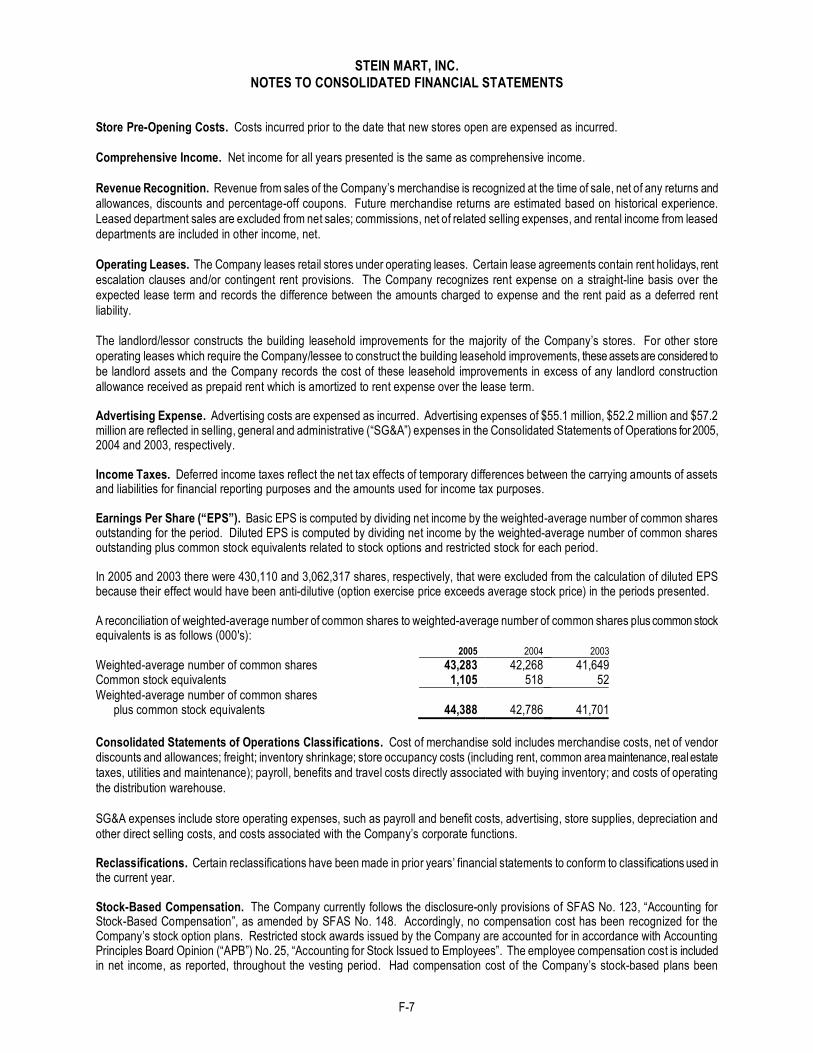
STEIN MART, INC. NOTES TO CONSOLIDATED FINANCIAL STATEMENTS
F-7
Store Pre-Opening Costs. Costs incurred prior to the date that new stores open are expensed as incurred. Comprehensive Income. Net income for all years presented is the same as comprehensive income. Revenue Recognition. Revenue from sales of the Company’s merchandise is recognized at the time of sale, net of any returns and allowances, discounts and percentage-off coupons. Future merchandise returns are estimated based on historical experience. Leased department sales are excluded from net sales; commissions, net of related selling expenses, and rental income from leased departments are included in other income, net. Operating Leases. The Company leases retail stores under operating leases. Certain lease agreements contain rent holidays, rent escalation clauses and/or contingent rent provisions. The Company recognizes rent expense on a straight-line basis over the expected lease term and records the difference between the amounts charged to expense and the rent paid as a deferred rent liability. The landlord/lessor constructs the building leasehold improvements for the majority of the Company’s stores. For other store operating leases which require the Company/lessee to construct the building leasehold improvements, these assets are considered to be landlord assets and the Company records the cost of these leasehold improvements in excess of any landlord construction allowance received as prepaid rent which is amortized to rent expense over the lease term. Advertising Expense. Advertising costs are expensed as incurred. Advertising expenses of $55.1 million, $52.2 million and $57.2 million are reflected in selling, general and administrative (“SG&A”) expenses in the Consolidated Statements of Operations for 2005, 2004 and 2003, respectively. Income Taxes. Deferred income taxes reflect the net tax effects of temporary differences between the carrying amounts of assets and liabilities for financial reporting purposes and the amounts used for income tax purposes. Earnings Per Share (“EPS”). Basic EPS is computed by dividing net income by the weighted-average number of common shares outstanding for the period. Diluted EPS is computed by dividing net income by the weighted-average number of common shares outstanding plus common stock equivalents related to stock options and restricted stock for each period. In 2005 and 2003 there were 430,110 and 3,062,317 shares, respectively, that were excluded from the calculation of diluted EPS because their effect would have been anti-dilutive (option exercise price exceeds average stock price) in the periods presented. A reconciliation of weighted-average number of common shares to weighted-average number of common shares plus common stock equivalents is as follows (000's): 2005 2004 2003 Weighted-average number of common shares 43,283 42,268 41,649 Common stock equivalents 1,105 518 52 Weighted-average number of common shares plus common stock equivalents
44,388
42,786
41,701
Consolidated Statements of Operations Classifications. Cost of merchandise sold includes merchandise costs, net of vendor discounts and allowances; freight; inventory shrinkage; store occupancy costs (including rent, common area maintenance, real estate taxes, utilities and maintenance); payroll, benefits and travel costs directly associated with buying inventory; and costs of operating the distribution warehouse. SG&A expenses include store operating expenses, such as payroll and benefit costs, advertising, store supplies, depreciation and other direct selling costs, and costs associated with the Company’s corporate functions. Reclassifications. Certain reclassifications have been made in prior years’ financial statements to conform to classifications used in the current year. Stock-Based Compensation. The Company currently follows the disclosure-only provisions of SFAS No. 123, “Accounting for Stock-Based Compensation”, as amended by SFAS No. 148. Accordingly, no compensation cost has been recognized for the Company’s stock option plans. Restricted stock awards issued by the Company are accounted for in accordance with Accounting Principles Board Opinion (“APB”) No. 25, “Accounting for Stock Issued to Employees”. The employee compensation cost is included in net income, as reported, throughout the vesting period. Had compensation cost of the Company’s stock-based plans been
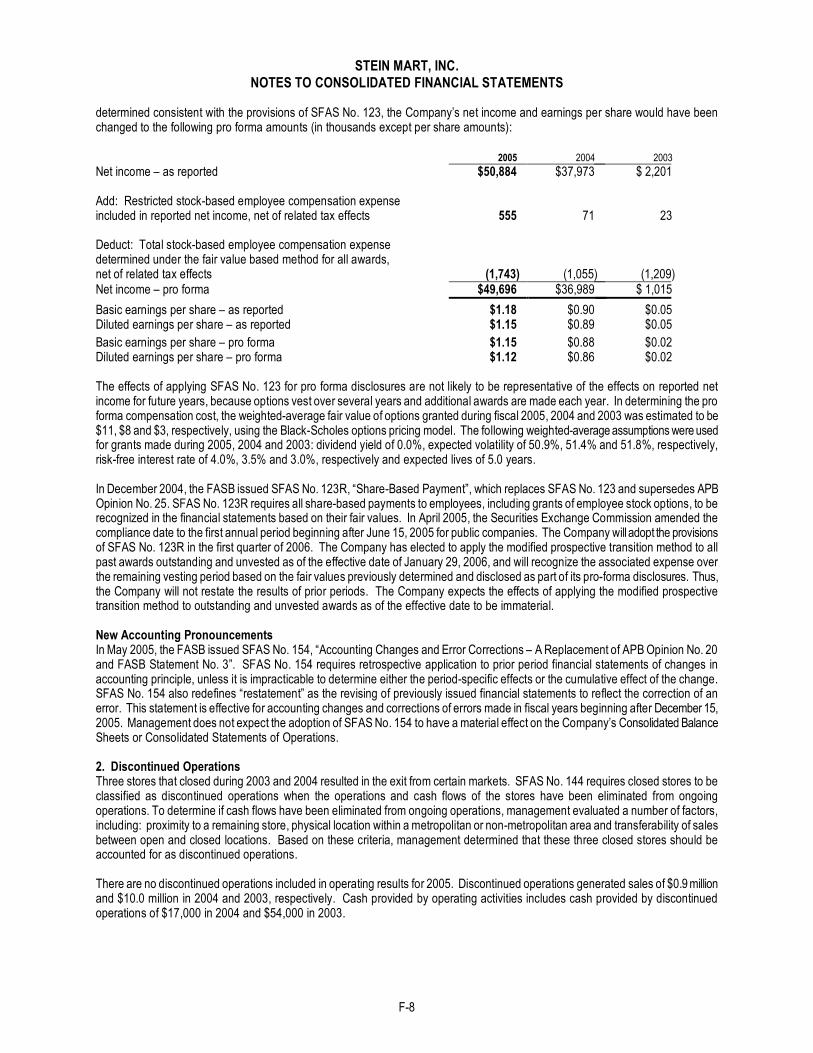
STEIN MART, INC. NOTES TO CONSOLIDATED FINANCIAL STATEMENTS
F-8
determined consistent with the provisions of SFAS No. 123, the Company’s net income and earnings per share would have been changed to the following pro forma amounts (in thousands except per share amounts): 2005 2004 2003 Net income – as reported $50,884 $37,973 $ 2,201 Add: Restricted stock-based employee compensation expense included in reported net income, net of related tax effects 555 71 23 Deduct: Total stock-based employee compensation expense determined under the fair value based method for all awards, net of related tax effects
(1,743)
(1,055) (1,209) Net income – pro forma $49,696 $36,989 $ 1,015
Basic earnings per share – as reported $1.18 $0.90 $0.05 Diluted earnings per share – as reported $1.15 $0.89 $0.05 Basic earnings per share – pro forma $1.15 $0.88 $0.02 Diluted earnings per share – pro forma $1.12 $0.86 $0.02 The effects of applying SFAS No. 123 for pro forma disclosures are not likely to be representative of the effects on reported net income for future years, because options vest over several years and additional awards are made each year. In determining the pro forma compensation cost, the weighted-average fair value of options granted during fiscal 2005, 2004 and 2003 was estimated to be $11, $8 and $3, respectively, using the Black-Scholes options pricing model. The following weighted-average assumptions were used for grants made during 2005, 2004 and 2003: dividend yield of 0.0%, expected volatility of 50.9%, 51.4% and 51.8%, respectively, risk-free interest rate of 4.0%, 3.5% and 3.0%, respectively and expected lives of 5.0 years. In December 2004, the FASB issued SFAS No. 123R, “Share-Based Payment”, which replaces SFAS No. 123 and supersedes APB Opinion No. 25. SFAS No. 123R requires all share-based payments to employees, including grants of employee stock options, to be recognized in the financial statements based on their fair values. In April 2005, the Securities Exchange Commission amended the compliance date to the first annual period beginning after June 15, 2005 for public companies. The Company will adopt the provisions of SFAS No. 123R in the first quarter of 2006. The Company has elected to apply the modified prospective transition method to all past awards outstanding and unvested as of the effective date of January 29, 2006, and will recognize the associated expense over the remaining vesting period based on the fair values previously determined and disclosed as part of its pro-forma disclosures. Thus, the Company will not restate the results of prior periods. The Company expects the effects of applying the modified prospective transition method to outstanding and unvested awards as of the effective date to be immaterial. New Accounting Pronouncements In May 2005, the FASB issued SFAS No. 154, “Accounting Changes and Error Corrections – A Replacement of APB Opinion No. 20 and FASB Statement No. 3”. SFAS No. 154 requires retrospective application to prior period financial statements of changes in accounting principle, unless it is impracticable to determine either the period-specific effects or the cumulative effect of the change. SFAS No. 154 also redefines “restatement” as the revising of previously issued financial statements to reflect the correction of an error. This statement is effective for accounting changes and corrections of errors made in fiscal years beginning after December 15, 2005. Management does not expect the adoption of SFAS No. 154 to have a material effect on the Company’s Consolidated Balance Sheets or Consolidated Statements of Operations. 2. Discontinued Operations Three stores that closed during 2003 and 2004 resulted in the exit from certain markets. SFAS No. 144 requires closed stores to be classified as discontinued operations when the operations and cash flows of the stores have been eliminated from ongoing operations. To determine if cash flows have been eliminated from ongoing operations, management evaluated a number of factors, including: proximity to a remaining store, physical location within a metropolitan or non-metropolitan area and transferability of sales between open and closed locations. Based on these criteria, management determined that these three closed stores should be accounted for as discontinued operations. There are no discontinued operations included in operating results for 2005. Discontinued operations generated sales of $0.9 million and $10.0 million in 2004 and 2003, respectively. Cash provided by operating activities includes cash provided by discontinued operations of $17,000 in 2004 and $54,000 in 2003.

STEIN MART, INC. NOTES TO CONSOLIDATED FINANCIAL STATEMENTS
F-9
Loss from discontinued operations includes the following components:
2004 2003 Loss from discontinued operations $(234) $(2,860) Income tax benefit 89 1,087 Loss from discontinued operations, net of tax benefit $(145) $(1,773) See Notes 3 and 4 for a description of store closing costs and asset impairment charges included in loss from discontinued operations. 3. Store Closing Charges The Company closes under-performing stores in the normal course of business. The Company closed six stores during 2005, seven stores during 2004 and 16 stores during 2003 incurring pre-tax lease termination and severance costs of $1.1 million, $1.9 million and $7.6 million, respectively. Lease termination costs are net of estimated sublease income that could reasonably be obtained for the properties. In the event the Company is not successful in subleasing closed store locations when management expects, additional reserves for store closing costs may be recorded. During 2005 and 2004, the Company recorded net pre-tax charges of $1.6 million and $0.9 million, respectively, to adjust previously recorded store closing reserves for changes in estimated sublease income, net of a lease termination recovery. Store closing charges are included in SG&A expenses in the Consolidated Statements of Operations, except for $154,000 in 2004 and $320,000 in 2003 which are included in loss from discontinued operations, net of tax benefits. The following tables show the activity in the store closing reserve:
January 29,
2005
Charges
Payments January 28,
2006
Continuing operations: Lease termination costs $6,898 $2,164 $3,540 $5,522 Severance 131 534 602 63 Total store closing reserve $7,029 $2,698 $4,142 $5,585
January 31,
2004
Charges
Payments January 29,
2005
Continuing operations: Lease termination costs $8,780 $1,991 $3,873 $6,898 Severance 131 647 647 131 Other 105 - 105 - 9,016 2,638 4,625 7,029 Discontinued operations: Lease termination costs 159 77 236 - Severance 19 77 96 - 178 154 332 - Total store closing reserve $9,194 $2,792 $4,957 $7,029
February 1,
2003
Charges
Payments January 31,
2004
Continuing operations: Lease termination costs $4,982 $6,561 $2,763 $8,780 Severance - 723 592 131 Other - 105 - 105 4,982 7,389 3,355 9,016 Discontinued operations: Lease termination costs - 172 13 159 Severance - 148 129 19 - 320 142 178 Total store closing reserve $4,982 $7,709 $3,497 $9,194 The store closing reserve at January 28, 2006, January 29, 2005 and January 31, 2004 includes a current portion (in accrued liabilities) of $2.8 million, $3.0 million and $2.8 million, respectively, and a long-term portion (in other liabilities) of $2.8 million, $4.0 million and $6.4 million, respectively.

STEIN MART, INC. NOTES TO CONSOLIDATED FINANCIAL STATEMENTS
F-10
The table below sets forth the components of loss from operations for stores closed during 2005, 2004 and 2003. The 2005 table presents the losses from the six stores that closed during 2005; the 2004 table presents the sum of the losses from the six stores closed during 2005 and the seven stores that closed in 2004; and the 2003 table presents the sum of the losses from the six stores closed during 2005, the seven stores closed in 2004 and the 16 stores closed in 2003.
Operating Results Of Closed Stores Included In:
Year ended January 28,2006: Continuing Operations
Discontinued Operations
Total Closed Stores
Sales $ 6,383 $ - $ 6,383 Cost of sales 5,436 - 5,436 Gross margin 947 - 947
Selling, general and administrative expenses 4,522 - 4,522 Other income, net 45 - 45
$ (3,530) $ - $ (3,530)
# of stores closed in 2005 6 - 6
Year ended January 29, 2005: Continuing Operations
Discontinued Operations
Total Closed Stores
Sales $ 29,063 $ 942 $ 30,005
Cost of sales 25,964 752 26,716 Gross margin 3,099 190 3,289 Selling, general and administrative expenses 11,372 424 11,796
Other income, net 300 - 300 $ (7,973) $ (234) $ (8,207)
# of stores closed in 2005 and 2004 12 1 13
Year ended January 31, 2004: Continuing Operations
Discontinued Operations
Total Closed Stores
Sales $ 68,895 $10,009 $ 78,904 Cost of sales 65,643 9,611 75,254
Gross margin 3,252 398 3,650 Selling, general and administrative expenses 29,772 3,327 33,099 Other income, net 703 69 772
Loss from operations $ (25,817) $ (2,860) $ (28,677) # of stores closed in 2005, 2004 and 2003 26 3 29 4. Impairment of Long-Lived Assets During 2005, 2004 and 2003, the Company recorded net pre-tax asset impairment charges of $0.7 million, $1.8 million and $3.9 million, respectively, to reduce the carrying value of furniture, fixtures, equipment and leasehold improvements held for use in stores closing in 2006, stores closed during those years, and certain other under-performing stores to their respective estimated fair value. These charges are included in SG&A expenses in the Consolidated Statements of Operations, except for $228,000 in 2003 which is included in loss from discontinued operations, net of tax benefit.
Loss from operations
Loss from operations
STEIN MART, INC. NOTES TO CONSOLIDATED FINANCIAL STATEMENTS
F-11
5. Property and Equipment, Net Property and equipment, net consists of the following:
January 28, 2006
January 29, 2005
Fixtures, equipment and software $174,439 $157,550 Leasehold improvements 49,118 42,187 223,557 199,737 Accumulated depreciation and amortization 136,451 128,689 $ 87,106 $ 71,048 6. Accrued Liabilities The major components of accrued liabilities are as follows: January 28,
2006 January 29,
2005 Compensation and employee benefits $25,027 $28,420 Unredeemed gift and returns cards 20,491 17,538 Property taxes 12,232 11,458 Payroll and other taxes 5,824 7,477 Store closing reserve 2,820 3,041 Other 13,943 10,851 $80,337 $78,785 7. Revolving Credit Agreement In December 2005, the Company amended its senior revolving credit agreement (the “Agreement”) with a group of lenders. The principal purposes of the amendment were to extend the term of the Agreement to January 2011, decrease the maximum credit from $150 million to $100 million, add an option to increase the facility by an additional $50 million, and reduce interest rates and unused line fees. At January 28, 2006, there were no direct borrowings and no Event of Default existed under the terms of the Agreement. Borrowings under the Agreement are based on and collateralized primarily by eligible inventory. The Company routinely issues commercial and standby letters of credit for purposes of securing foreign sourced merchandise and certain insurance programs. Outstanding letters of credit reduce availability under the credit agreement. The Company had outstanding commercial and stand-by letters of credit of $0.2 million and $7.0 million, respectively, at January 28, 2006. The interest rates on borrowings under the Agreement range from Prime to Prime plus .25% per annum for Prime Rate Loans and LIBOR plus 1.00% to LIBOR plus 1.75% per annum for Eurodollar Rate Loans and are established quarterly, based on excess availability as defined in the Agreement. An unused line fee of .20% is charged on the unused portion of the revolving credit facility, based on excess availability. All borrowings bear interest at variable rates that approximate current market rates and therefore the carrying value of these borrowings approximates fair value. 8. Leased Facilities and Commitments The Company leases all of its retail and support facilities. Annual store rent is generally comprised of a fixed minimum amount plus a contingent amount based on a percentage of sales exceeding a stipulated amount. Most leases also require additional payments covering real estate taxes, common area costs and insurance. Rent expense is as follows: 2005 2004 2003 Minimum rentals $65,463 $64,010 $64,195 Contingent rentals 405 531 441 $65,868 $64,541 $64,636
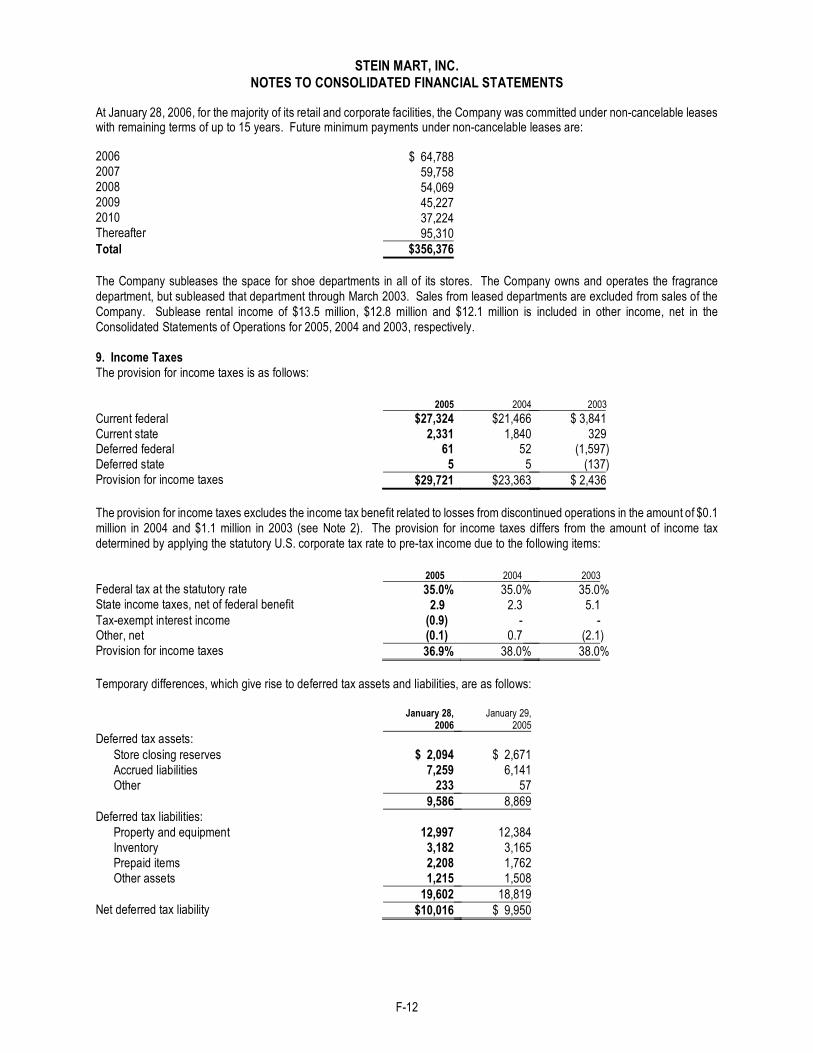
STEIN MART, INC. NOTES TO CONSOLIDATED FINANCIAL STATEMENTS
F-12
At January 28, 2006, for the majority of its retail and corporate facilities, the Company was committed under non-cancelable leases with remaining terms of up to 15 years. Future minimum payments under non-cancelable leases are: 2006 $ 64,788 2007 59,758 2008 54,069 2009 45,227 2010 37,224 Thereafter 95,310 Total $356,376 The Company subleases the space for shoe departments in all of its stores. The Company owns and operates the fragrance department, but subleased that department through March 2003. Sales from leased departments are excluded from sales of the Company. Sublease rental income of $13.5 million, $12.8 million and $12.1 million is included in other income, net in the Consolidated Statements of Operations for 2005, 2004 and 2003, respectively. 9. Income Taxes The provision for income taxes is as follows: 2005 2004 2003
Current federal $27,324 $21,466 $ 3,841 Current state 2,331 1,840 329 Deferred federal 61 52 (1,597) Deferred state 5 5 (137) Provision for income taxes $29,721 $23,363 $ 2,436 The provision for income taxes excludes the income tax benefit related to losses from discontinued operations in the amount of $0.1 million in 2004 and $1.1 million in 2003 (see Note 2). The provision for income taxes differs from the amount of income tax determined by applying the statutory U.S. corporate tax rate to pre-tax income due to the following items: 2005 2004 2003 Federal tax at the statutory rate 35.0% 35.0% 35.0% State income taxes, net of federal benefit 2.9 2.3 5.1 Tax-exempt interest income (0.9) - - Other, net (0.1) 0.7 (2.1) Provision for income taxes 36.9% 38.0% 38.0% Temporary differences, which give rise to deferred tax assets and liabilities, are as follows: January 28,
2006 January 29,
2005 Deferred tax assets: Store closing reserves $ 2,094 $ 2,671 Accrued liabilities 7,259 6,141 Other 233 57 9,586 8,869 Deferred tax liabilities: Property and equipment 12,997 12,384 Inventory 3,182 3,165 Prepaid items 2,208 1,762 Other assets 1,215 1,508 19,602 18,819 Net deferred tax liability $10,016 $ 9,950

STEIN MART, INC. NOTES TO CONSOLIDATED FINANCIAL STATEMENTS
F-13
Deferred tax assets and liabilities are reflected on the Company’s Consolidated Balance Sheets as follows:
January 28,
2006 January 29,
2005 Current deferred tax liabilities (included in accrued liabilities) $ 192 $ - Current deferred tax assets (included in prepaid expenses and other current assets)
-
(85)
Non-current deferred tax liabilities (included in other liabilities) 9,824 10,035 Net deferred tax liability $10,016 $ 9,950 The exercise of certain stock options which have been granted under the Company’s stock option plans gives rise to compensation which is includable in the taxable income of the applicable employees and deductible by the Company for federal and state income tax purposes. Such compensation results from increases in the market value of the Company’s common stock subsequent to the date of grant of the applicable exercised stock options, and in accordance with APB No. 25, such compensation is not recognized as an expense for financial accounting purposes and the related tax benefits are recorded directly in paid-in capital. 10. Common Stock During 2005, the Company repurchased 836,550 shares of its common stock in the open market at a total cost of $17.3 million. As of January 28, 2006, there are 1.2 million shares which can be repurchased pursuant to the Board of Directors’ current authorizations. In 2001, the shareholders approved a stock option plan (the “Omnibus Plan”), which replaced the Company’s Employee Stock and Director Stock Option Plans (the “Previous Plans”). After the approval of the Omnibus Plan, no further options have been or will be issued under the Previous Plans. The term of the Omnibus Plan is indefinite, except that no incentive stock option award can be granted after the tenth anniversary of the plan. In 2002, the Board of Directors determined that it was appropriate to undertake an overall review of the Company’s compensation strategies. As part of this review, it was decided that starting in fiscal 2003 restricted stock awards as provided for in the Omnibus Plan, in addition to stock options, would be granted. The following table presents the number of stock options and restricted stock awards initially authorized and available to grant under the Omnibus Plan (shares in thousands): Shares Stock options and restricted stock awards initially authorized 4,500 Stock options and restricted stock awards available for grant: January 31, 2004 3,179 January 29, 2005 3,040 January 28, 2006 2,495 The Company has issued restricted stock awards to eligible key employees and directors. All awards have restriction periods tied primarily to employment and/or service and performance. Shares awarded under the plan entitle the shareholder to all rights of common stock ownership except that the shares may not be sold, transferred, pledged, exchanged or otherwise disposed of during the restriction period. Vesting occurs either (1) seven years following the date of grant or at the end of the second fiscal year following the date of grant, if certain defined Company performance goals are achieved, (2) at the rate of 33%, 33% and 34%, respectively, at the end of each of the first three years, (3) 100% at the end of the third year, or (4) at the rate of 33%, 33% and 34%, respectively, at the end of the third, fourth and fifth years. Unvested shares are forfeited upon termination of employment. The Company’s restricted stock award activity is as follows (shares in thousands):
Shares
Weighted-Average Grant Date
Fair Value Granted during 2003 72 $ 5.53 Forfeited (9) 5.53 Non-vested at January 31, 2004 63 5.53 Granted 29 15.26 Forfeited (7) 5.53 Non-vested at January 29, 2005 85 8.86 Granted 192 21.33 Vested (6) 13.45 Forfeited (9) 13.25 Non-vested at January 28, 2006 262 $17.75

STEIN MART, INC. NOTES TO CONSOLIDATED FINANCIAL STATEMENTS
F-14
The Omnibus Plan, consistent with the Previous Plans, provides that shares of common stock may be granted to certain key employees and outside directors through non-qualified stock options, incentive stock options, stock appreciation rights, performance awards, restricted stock, or any other award made under the terms of the plan. The Board of Directors, or its delegated authority, determines the exercise price and all other terms of all grants. In general, one-third of the options granted become exercisable on the third, fourth and fifth anniversary dates of grant and expire seven years after the date of grant. No stock appreciation rights have been granted under this or the prior plan. Activity for the fixed-price stock option plans is as follows (shares in thousands):
Number of Shares
Weighted-Average Exercise Price
Outstanding at February 1, 2003 5,031 $10.90 Granted 303 4.74 Exercised (251) 4.79 Forfeited (727) 9.06 Outstanding at January 31, 2004 4,356 11.13 Granted 180 15.24 Exercised (765) 10.11 Forfeited (129) 10.91 Outstanding at January 29, 2005 3,642 11.55 Granted 445 20.83 Exercised (1,214) 12.46 Forfeited (98) 11.82 Outstanding at January 28, 2006 2,775 $12.63 Exercisable stock options were 1.462 million, 2.248 million and 2.611 million at January 28, 2006, January 29, 2005 and January 31, 2004, respectively. The following table summarizes information about the weighted-average remaining contractual life (in years) and the weighted-average exercise prices for fixed-price stock options outstanding at January 28, 2006 (shares in thousands):
Options Outstanding Options Exercisable Range of
Exercise Prices Number
Outstanding Remaining
Life Exercise
Price Number
Exercisable Exercise
Price
$ 5.00 – 8.95 909 5.7 $ 5.73 434 $ 7.89 $ 8.96 – 13.43 442 5.5 10.99 197 10.99 $13.44 – 17.91 994 2.7 14.45 831 14.24 $17.92 – 22.39 430 6.1 20.83 - -
2,775 4.7 $12.63 1,462 $11.91 The Company has an Employee Stock Purchase Plan (the “Stock Purchase Plan”) whereby all employees who complete six months employment with the Company and who work on a full-time basis or are regularly scheduled to work more than 20 hours per week are eligible to participate in the Stock Purchase Plan. Participants in the Stock Purchase Plan are permitted to use their payroll deductions to acquire shares at 85% of the lower of the fair market value of the Company’s stock determined at either the beginning or the end of each option period. In 2005, 2004 and 2003, the participants acquired 74,120 shares, 97,836 shares and 179,902 shares of the Company’s common stock at weighted-average per share prices of $15.00, $9.73 and $4.92 per share, respectively. 11. Employee Benefit Plans The Company has a defined contribution retirement plan covering employees who are at least 21 years of age, have completed at least one year of service and who work at least 1,000 hours annually. Under the profit sharing portion of the plan, the Company can make discretionary contributions which vest at a rate of 20 percent per year after two years of service. The Company matches 50 percent of the employee’s voluntary pre-tax contributions up to a maximum of four percent of the employee’s compensation. The Company’s matching portion vests in accordance with the plan’s vesting schedule. Total Company contributions under the retirement plan were $816,000, $985,000 and $1,044,000 for 2005, 2004 and 2003, respectively. The Company has an executive split dollar life insurance plan wherein eligible executives are provided with pre-retirement life insurance protection based upon three to five times base salary. Upon retirement, the executive is provided with life insurance protection based upon one and one-half to two and one-half times final base salary. The expense for this plan was $57,000, $290,000 and $229,000 in 2005, 2004 and 2003, respectively.

STEIN MART, INC. NOTES TO CONSOLIDATED FINANCIAL STATEMENTS
F-15
The Company also has an executive deferral plan providing officers and key executives with the opportunity to participate in an unfunded, deferred compensation program. Effective November 1, 2002, the plan was amended to include director-level employees. Under the program, participants may defer up to 100% of their base compensation and bonuses earned. The Company will match the officers’ and key executives’ contributions 100%, and the director-level employees’ contributions 50%, up to the first 10% of compensation deferred. A participant’s Company matching contributions and related investment earnings are 20% vested after four years of participation in the plan and increase 20% per year through the eighth year, at which time a participant is fully vested. The liability to the employees for amounts deferred was $5,881,000 at January 28, 2006 and $4,051,000 at January 29, 2005, and is included in Other liabilities in the Consolidated Balance Sheets. The expense for this plan, net of forfeitures, was $831,000, $1,084,000 and $747,000 in 2005, 2004 and 2003, respectively. In connection with the above two plans, whole life insurance contracts were purchased on the related participants. At January 28, 2006 and January 29, 2005 the cash surrender value of these policies was $9,444,000 and $7,160,000, respectively, and is included in Other assets in the Consolidated Balance Sheets. 12. Sales by Major Merchandise Category The Company is a single business segment as defined by SFAS No. 131, “Disclosures about Segments of an Enterprise and Related Information”. SFAS No. 131 requires that companies report revenues for each product or group of similar products. The following table summarizes the Company’s sales by major merchandise category: 2005 2004 2003 Ladies’ apparel and accessories $ 878,934 $ 843,616 $ 743,323 Men’s apparel and accessories 298,809 281,730 250,555 Gifts and linens 231,382 260,018 277,150 Other 72,490 74,243 80,595 Net sales $1,481,615 $1,459,607 $1,351,623 13. Quarterly Results of Operations (Unaudited) Year Ended January 28, 2006
13 Weeks Ended
Apr. 30, 2005
13 Weeks Ended
July 30, 2005
13 Weeks Ended
Oct. 29, 2005
13 Weeks Ended
Jan. 28, 2006
Net sales $380,654 $337,065 $336,537 $427,359 Gross profit 111,695 96,256 83,051 125,204 Net income 16,794 11,639 1,396 21,055 Basic income per share $0.39 $0.27 $0.03 $0.49 Diluted income per share $0.38 $0.26 $0.03 $0.48 Year Ended January 29, 2005
13 Weeks Ended May 1, 2004
13 Weeks Ended July 31, 2004
13 Weeks Ended Oct. 30, 2004
13 Weeks Ended Jan. 29, 2005
Net sales $363,608 $320,624 $330,432 $444,943 Gross profit 98,738 83,920 76,204 129,942 Income (loss) from continuing operations 11,654 5,660 (2,033) 22,837 Loss from discontinued operations (139) (6) - - Net income (loss) 11,515 5,654 (2,033) 22,837 Basic income (loss) per share $0.27 $0.13 $(0.05) $0.54 Diluted income (loss) per share $0.27 $0.13 $(0.05) $0.53 14. Legal Proceedings The Company is involved in various routine legal proceedings incidental to the conduct of its business. Management, based upon the advice of outside legal counsel, does not believe that any of these legal proceedings will have a material adverse effect on the Company’s financial condition, results of operations or cash flows. 15. Subsequent Event On April 4, 2006 the Board of Directors declared a special cash dividend of $1.50 per share payable on April 28, 2006 to stockholders of record on April 17, 2006.

EXHIBIT INDEX 3.1
Articles of Incorporation of the Registrant, incorporated by reference to the Company’s Form S-1 Registration Statement No. 33-46322
3.2
Bylaws of the Registrant, amended September 8, 2003, incorporated by reference to the Company’s Form 10-K for the fiscal year ended January 31, 2004
4.1
Provisions of the Articles of Incorporation and Bylaws of the Registrant defining rights of shareholders of Common Stock of the Registrant, incorporated by reference to the Company’s Form 10-K for the fiscal year ended December 30, 2000
4.2
Form of stock certificate for Common Stock, incorporated by reference to the Company’s Form S-1 Registration Statement No. 33-46322
10.1*
Form of Director’s and Officer’s Indemnification Agreement, incorporated by reference to the Company’s Form S-1 Registration Statement No. 33-46322
10.2
Loan and Security Agreement dated July 18, 2003, among Stein Mart, Inc., Wachovia Bank, National Association and Fleet Retail Finance, Inc. as Co-Arrangers, Congress Financial Corporation (Florida) as Administrative and Collateral Agent, General Electric Capital Corporation as Documentation Agent and the Lenders (as such terms are defined in the Credit Agreement), incorporated by reference to the Company’s Form 10-Q for the quarter ended August 2, 2003
10.3
Amendment No. 1 to Loan and Security Agreement dated January 11, 2006 between Stein Mart, Inc. and Wachovia Bank, National Association (successor to Congress Financial Corporation), incorporated by reference to the Company’s Form 8-K dated January 11, 2006
10.4*
Employee Stock Plan, incorporated by reference to the Company’s Form S-1 Registration Statement No. 33-46322
10.5*
Form of Non-Qualified Stock Option Agreement, incorporated by reference to the Company’s Form S-1 Registration Statement No. 33-46322
10.6*
Form of Incentive Stock Option Agreement, incorporated by reference to the Company’s Form S-1 Registration Statement No. 33-46322
10.7
Profit Sharing Plan, incorporated by reference to the Company’s Form S-1 Registration Statement No. 33-46322
10.8*
Executive Health Plan, incorporated by reference to the Company’s Form S-1 Registration Statement No. 33-46322
10.9*
Director Stock Option Plan, incorporated by reference to the Company’s Form S-1 Registration Statement No. 33-46322
10.10*
Executive Split Dollar Plan, incorporated by reference to the Company’s Form 10-K for the fiscal year ended January 1, 2000
10.11*
Executive Deferral Plan, amended November 1, 2002, incorporated by reference to the Company’s Form 10-K for the fiscal year ended January 31, 2004
10.12
2001 Omnibus Plan, incorporated by reference to the Company’s Form S-8 Registration Statement filed on August 7, 2001
10.13*
Form of Restricted Share Award Agreement for Key Employees, pursuant to Omnibus Plan, incorporated by reference to the Company’s Form 10-K for the fiscal year ended January 31, 2004
10.14*
Management Incentive Compensation Plan, incorporated by reference to the Company’s Proxy Statement for its 2005 Annual Meeting of Stockholders
10.15*
Employment Agreement, dated as of July 11, 2005, between Stein Mart, Inc. and Michael D. Fisher, incorporated by reference to the Company’s Form 8-K filed on July 15, 2005

10.16*
Employment Agreement, dated as of July 11, 2005, between Stein Mart, Inc. and James G. Delfs, incorporated by reference to the Company’s Form 8-K filed on July 15, 2005
10.17*
Employment Agreement, dated as of July 11, 2005, between Stein Mart, Inc. and D. Hunt Hawkins, incorporated by reference to the Company’s Form 8-K filed on July 15, 2005
10.18*
Employment Agreement, dated as of July 11, 2005, between Stein Mart, Inc. and Michael D. Ray, incorporated by reference to the Company’s Form 8-K filed on July 15, 2005
23.1
Consent of PricewaterhouseCoopers LLP
31.1
Certification of Chief Executive Officer Pursuant to Section 302 of the Sarbanes Oxley Act of 2002
31.2
Certification of Chief Financial Officer Pursuant to Section 302 of the Sarbanes Oxley Act of 2002
32.1
Certification of the Chief Executive Officer Pursuant to 18 U.S.C. Section 1350
32.2
Certification of the Chief Financial Officer Pursuant to 18 U.S.C. Section 1350
* Management contract or compensatory plan or arrangements.

Exhibit 31.1
Certification of Chief Executive Officer Pursuant to Section 302 of the Sarbanes-Oxley Act of 2002 I, Michael D. Fisher, certify that: 1. I have reviewed this Annual Report on Form 10-K of Stein Mart, Inc.; 2. Based on my knowledge, this report does not contain any untrue statement of a material fact or omit to state a material
fact necessary to make the statements made, in light of the circumstances under which such statements were made, not misleading with respect to the period covered by this report;
3. Based on my knowledge, the financial statements, and other financial information included in this report, fairly present
in all material respects the financial condition, results of operations and cash flows of Stein Mart, Inc. as of, and for, the periods presented in this report;
4. The registrant's other certifying officer and I are responsible for establishing and maintaining disclosure controls and
procedures (as defined in Exchange Act Rules 13a-15(e) and 15d-15(e)) and internal control over financial reporting (as defined in Exchange Act Rules 13a-15(f) and 15d-15(f)) for the registrant and have:
a. Designed such disclosure controls and procedures, or caused such disclosure controls and procedures to be
designed under our supervision, to ensure that material information relating to the registrant, including its consolidated subsidiary, is made known to us by others within that entity, particularly during the period in which this report is being prepared;
b. Designed such internal control over financial reporting, or caused such internal control over financial
reporting to be designed under our supervision, to provide reasonable assurance regarding the reliability of financial reporting and the preparation of financial statements for external purposes in accordance with generally accepted accounting principles;
c. Evaluated the effectiveness of the registrant's disclosure controls and procedures and presented in this
report our conclusions about the effectiveness of the disclosure controls and procedures, as of the end of the period covered by this report based on such evaluation; and
d. Disclosed in this report any change in the registrant’s internal control over financial reporting that occurred
during the registrant’s most recent fiscal quarter that has materially affected, or is reasonable likely to materially affect, the registrant’s internal control over financial reporting; and
5. The registrant's other certifying officer and I have disclosed, based on our most recent evaluation of internal control
over financial reporting, to the registrant's auditors and the audit committee of registrant's board of directors (or persons performing the equivalent functions):
a. All significant deficiencies and material weaknesses in the design or operation of internal controls over
financial reporting which are reasonably likely to adversely affect the registrant's ability to record, process, summarize and report financial information; and
b. Any fraud, whether or not material, that involves management or other employees who have a significant role
in the registrant's internal controls over financial reporting. Date: April 6, 2006 /s/ Michael D. Fisher Michael D. Fisher
President and Chief Executive Officer
Exhibit 31.2
Certification of Chief Financial Officer Pursuant to Section 302 of the Sarbanes-Oxley Act of 2002 I, James G. Delfs, certify that: 1. I have reviewed this Annual Report on Form 10-K of Stein Mart, Inc.; 2. Based on my knowledge, this report does not contain any untrue statement of a material fact or omit to state a material
fact necessary to make the statements made, in light of the circumstances under which such statements were made, not misleading with respect to the period covered by this report;
3. Based on my knowledge, the financial statements, and other financial information included in this report, fairly present
in all material respects the financial condition, results of operations and cash flows of Stein Mart, Inc. as of, and for, the periods presented in this report;
4. The registrant's other certifying officer and I are responsible for establishing and maintaining disclosure controls and
procedures (as defined in Exchange Act Rules 13a-15(e) and 15d-15(e)) and internal control over financial reporting (as defined in Exchange Act Rules 13a-15(f) and 15d-15(f)) for the registrant and have:
a. Designed such disclosure controls and procedures, or caused such disclosure controls and procedures to be
designed under our supervision, to ensure that material information relating to the registrant, including its consolidated subsidiary, is made known to us by others within that entity, particularly during the period in which this report is being prepared;
b. Designed such internal control over financial reporting, or caused such internal control over financial
reporting to be designed under our supervision, to provide reasonable assurance regarding the reliability of financial reporting and the preparation of financial statements for external purposes in accordance with generally accepted accounting principles;
c. Evaluated the effectiveness of the registrant's disclosure controls and procedures and presented in this
report our conclusions about the effectiveness of the disclosure controls and procedures, as of the end of the period covered by this report based on such evaluation; and
d. Disclosed in this report any change in the registrant’s internal control over financial reporting that occurred
during the registrant’s most recent fiscal quarter that has materially affected, or is reasonable likely to materially affect, the registrant’s internal control over financial reporting; and
5. The registrant's other certifying officer and I have disclosed, based on our most recent evaluation of internal control
over financial reporting, to the registrant's auditors and the audit committee of registrant's board of directors (or persons performing the equivalent functions):
a. All significant deficiencies and material weaknesses in the design or operation of internal controls over
financial reporting which are reasonably likely to adversely affect the registrant's ability to record, process, summarize and report financial information; and
b. Any fraud, whether or not material, that involves management or other employees who have a significant role
in the registrant's internal controls over financial reporting. Date: April 6, 2006 /s/ James G. Delfs James G. Delfs Chief Financial Officer
Exhibit 32.1 Certification by Chief Executive Officer Pursuant to 18 U.S.C. Section 1350 Solely for the purposes of complying with 18 U.S.C. Section 1350, I, the undersigned President and Chief Executive Officer of Stein Mart, Inc. (the “Company”), hereby certify that: 1. the Annual Report on Form 10-K of the Company for the 52 weeks ended January 28, 2006 (the “Report”) fully
complies with the requirements of Section 13(a) of the Securities Exchange Act of 1934; and 2. the information contained in the Report fairly presents, in all material respects, the financial condition and results of
operations of the Company. Date: April 6, 2006 /s/ Michael D. Fisher
Michael D. Fisher President and Chief Executive Officer

Exhibit 32.2 Certification by Chief Financial Officer Pursuant to 18 U.S.C. Section 1350 Solely for the purposes of complying with 18 U.S.C. Section 1350, I, the undersigned Chief Financial Officer of Stein Mart, Inc. (the “Company”), hereby certify that: 1. the Annual Report on Form 10-K of the Company for the 52 weeks ended January 28, 2006 (the “Report”) fully
complies with the requirements of Section 13(a) of the Securities Exchange Act of 1934; and 2. the information contained in the Report fairly presents, in all material respects, the financial condition and results of
operations of the Company. Date: April 6, 2006 /s/ James G. Delfs
James G. Delfs Chief Financial Officer

This page intentionally left blank