Embed Size (px)
Citation preview
US008280652B2
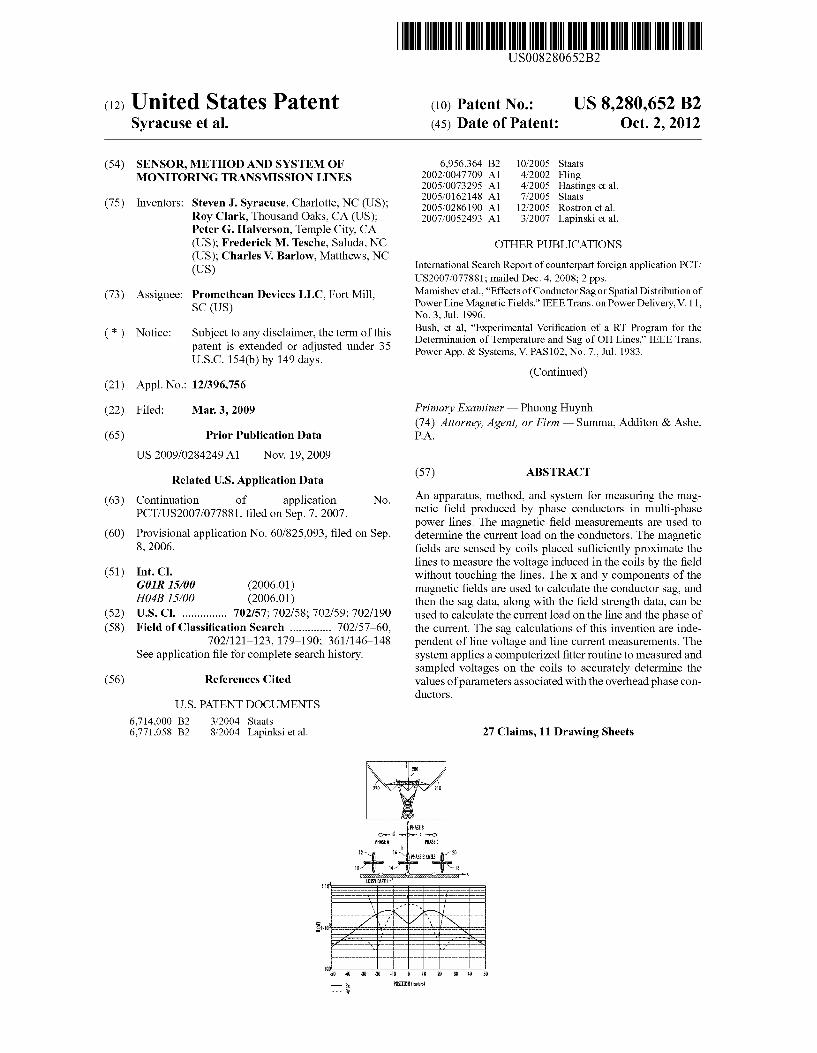
(12) Ulllted States Patent (10) Patent N0.: US 8,280,652 B2 Syracuse et a]. (45) Date of Patent: Oct. 2, 2012
(54) SENSOR, METHOD AND SYSTEM OF 6,956,364 B2 10/2005 Staats MONITORING TRANSMISSION LINES 2002/0047709 A1 4/2002 Fllng
2005/0073295 A1 4/2005 Hastrngs et al. 2005/0162148 A1 7/2005 Staats
(75) Inventors: Steven J. Syracuse, Charlotte, NC (US); Zoos/0286190 A1 12/2005 Rostron et a1‘ Roy Clark, Thousand Oaks, CA (Us); 2007/0052493 A1 3/2007 Lapinski et al. Peter G. Halverson, Temple City, CA (US); Frederick M. Tesche, Saluda, NC OTHER PUBLIC ATIQNS (US); Charles V. Barlow, Matthews, NC _ _ _ _ (Us) Internatronal Search Report of counterpart forergn applrcatron PCT/
US2007/077881; mailed Dec. 4, 2008; 2 pps.
(73) Assigneez Promethean Devices LLC’ Fort Mill’ Mamishev et al., “Effects of Conductor Sag or Spatial Distribution of SC (Us) Power Lrne Magnetrc Frelds,” IEEE Trans. on Power Delrvery, V. 1 1,
No. 3, Jul. 1996. * - _ - - - - Bush, et al, “Experimental Veri?cation of a RT Program for the
( ) Nonce' SutbJetCt. to altly (jllsglalmeé’. thte germdof?glg Determination of Temperature and Sag of OH Lines,” IEEE Trans. Pa en 15 ex en 6 or a Jus 6 un er Power App. & Systems, V. PAS102, N0. 7., Jul. 1983. U.S.C. 154(b) by 149 days.
(Continued) (21) Appl.No.: 12/396,756
(22) Filed; Man 3, 2009 Primary Examiner * Phuong Huynh (74) Attorney, Agent, or Firm * Summa, Additon & Ashe,
(65) Prior Publication Data PA.
US 2009/0284249 A1 Nov. 19, 2009
57 ABSTRACT Related US. Application Data ( )
(63) Continuation of application NO An'apparatus, method, and system for measuring the mag PCT/US2007/077881 ?led on Sep 7 2007' netrc ?eld produced by phase conductors in multr-phase
_ _ _ _ ’ ’ power lines. The magnetic ?eld measurements are used to
(60) PIOVlSlOnal aPPllCaUOIl N0~ 60/825,093, ?led On SeP- determine the current load on the conductors. The magnetic 8, 2006- ?elds are sensed by coils placed suf?ciently proximate the
lines to measure the voltage induced in the coils by the ?eld (51) Int- Cl- without touching the lines. The X and y components of the
GoIR 15/00 (2006-01) magnetic ?elds are used to calculate the conductor sag, and H 043 15/00 (2006-01) then the sag data, along with the ?eld strength data, can be
(52) U-s- Cl- ------------- -- 702/57; 702/58; 702/ 59; 702/190 used to calculate the current load on the line and the phase of (58) Field of Classi?cation Search ............ .. 702/57*60, the current, The sag calculations of this invention are inde
702/ 121*123, 179*190; 361/ l46il48 pendent of line voltage and line current measurements. The See application ?le for complete search history. system applies a computerized ?tter routine to measured and
sampled voltages on the coils to accurately determine the (56) References Cited values of parameters associated with the overhead phase con
U.S. PATENT DOCUMENTS
6,714,000 B2 3/2004 Staats 6,771,058 B2 8/2004 Lapinksiet al.
ductors.
27 Claims, 11 Drawing Sheets
h n H PHASHKDILS 2“
10 14 I8
0 l0 10 30 40 SD

US 8,280,652 B2 Page 2
OTHER PUBLICATIONS
Seppa, T.O., “Temperature-Sag Model for Operational Real Time Ratings,” IEEE Trans. on Pwr. Delivery, V. 10, No. 3, Jul. 1995. Chen, et al, “High Temp. Sag Model for OH Conductors,” IEEE Trans. Pwr. Del., V. 18, No. 1, Jan. 2003.
Wait et al., “On the Image Representation of the Quasi-Static Fields of a Line Current Source above the Ground”, Canadian Journal of Physics, vol. 47, 1969, pp. 2731-2733. Olsen, “Electromagnetic Fields from Power Lines,” Washington State University, Pullman, WA 99164-2752, 1993, IEEE Power Con ference Proceedings.
US. Patent 0a. 2, 2012 Sheet 1 0f 11 US 8,280,652 B2
US. Patent 0a. 2, 2012 Sheet 2 0f 11 US 8,280,652 B2
“w...
US. Patent 0a. 2, 2012 Sheet 3 0f 11 US 8,280,652 B2
US. Patent 0a. 2, 2012 Sheet 4 0f 11 US 8,280,652 B2
\\ \mw Kw \ x
mg m
US. Patent 0a. 2, 2012 Sheet 5 0f 11 US 8,280,652 B2
US. Patent 0a. 2, 2012 Sheet 6 0f 11 US 8,280,652 B2
ff-isamma
US. Patent 0a. 2, 2012 Sheet 7 0f 11 US 8,280,652 B2
US. Patent 0a. 2, 2012 Sheet 8 0f 11 US 8,280,652 B2
'EE I i i E i i i I E i i i i i i i i i i i i I i i E
m»; %
m “5 ,,,, , 5
g 5 m a m , é“
" ———~———- wan‘ {may , m H: mm ?AFPXE‘E'E} “ '"
g ~~~~- mag mm ms / “ “ E2
E U: LS/m i
‘E E‘S i i i i i i i l i i i l i i i I i
US. Patent 0a. 2, 2012 Sheet 9 0f 11 US 8,280,652 B2
gsmww WE: ?g Em gm 3% 2mm 3% a? $2 mama Em mam
as .2 é 3 “Emma “3%, @g mg g 2% a magma ENE magma 1
am am
@. H gmm?mmma
mg “3 H “Em ?gm?m M
g %
m ENMEW ?§§?§§ m $52M 駧§§?§§ m
E ,m , ma w
,2. mm M
.2.”
mg
222
5,.“ a“
, mm Emma EH2“ m 2% 2 E ?g E 2% Emma Wag“ ?g 6» gm?“ magma mma?w E? gw?m
1%
US. Patent 0a. 2, 2012 Sheet 10 0f 11 US 8,280,652 B2
gwwwm
3E
US 8,280,652 B2 1
SENSOR, METHOD AND SYSTEM OF MONITORING TRANSMISSION LINES
CROSS-REFERENCE TO PRIOR APPLICATIONS
This application is a continuation of and claims the bene?t of priority to co-pending International Patent Application No. PCT/US2007/077881 ?led on Sep. 7, 2007, and published as WO 2008/ 031029. The international case, in turn, claims the bene?t of priority to US. Provisional Patent Application Ser. No. 60/825,093 ?led Sep. 8, 2006. The disclosures of both priority cases are hereby incorporated by reference in their entireties.
STATEMENT REGARDING FEDERALLY SPONSORED RESEARCH AND DEVELOPMENT
This invention Was made With US. Government support under Contract No. DE-FG02-05ER84159 aWarded by the Department of Energy. The government has certain rights in this invention.
FIELD OF THE INVENTION
This invention relates to a reliable, loW cost, non-contact, non-invasive, high accuracy, high resolution sensor that Will simultaneously monitor high voltage transmission conductor sag, temperature, maximum current-carrying capability (or “ampacity”), and phase current. Given this data, the system can estimate available transmission capacity (“ATC”) and dynamically rate the circuit. The system of this invention performs extremely Well With even a minimum number of installed sensors, and the system may be con?gured in either an entirely portable manner or installed for long-term use. The claimed computeriZed system and method make use of the magnetic ?eld emanating from overhead transmission and distribution lines to determine the properties of the overhead phase conductors and the current thereon. The system takes advantage of the fact that the magnetic ?eld from the phase conductors is more robust than the conductors’ electric ?eld. The electric ?eld, or e' ?eld, is easily corrupted by Weather and ground effects, so using the magnetic ?eld provides a more stable system that can be used in multiple environments.
BACKGROUND
Demand for electric poWer has groWn signi?cantly faster than the transmission system’s capability to deliver it, and deliver it reliably. As a result, the overhead transmission and poWer distribution system is being operated in a manner for Which it Was not designed; bottlenecks and congestion, black outs, equipment damage, and system disturbances are becom ing Widespread, and are occurring With ever increasing fre quency.
Real-time monitoring of critical, congested transmission circuits Would improve reliability, relieve congestion, increase available transmission capacity (“ATC”), and safely alloW more poWer to be moved over existing circuits than is presently possible. As a result, the existing system Would serve more demand; operating revenues could be increased, and some demand-driven neW construction and upgrade costs could be deferred. At the same time, system operational safety, reliability, and poWer transfer capability can be improved.
Existing real time (“RT”) monitoring and dynamic thermal circuit rating (“DTCR”) systems have signi?cantly expensive total installed costs. As a result of the cost and other product
20
25
30
35
40
45
50
55
60
65
2 issues, the market penetration, acceptance, use, and groWth of these technologies have been impeded. The sensor of this invention Will be far less expensive than existing sensor and DTCR technologies, Will be capable of easy and rapid instal lation and calibration, and Will enable Widespread, loW-cost implementation of DTCR. The improvements necessary to relieving bottlenecks and
congestion in transmission lines, While simultaneously main taining reliability, have been studied thoroughly, reported in detail, and recommended time and again. At best it is a $50 100 billion, decades-long effort. While the required improve ments are mostly understood, and have been detailed and charted, they are off to a very sloW start. While a fraction of these improvements (including appreciable neW construc tion) began in the late 1990’s, and are underWay today, the improvement rate is still very signi?cantly lagging demand groWth.
Congestion costs electricity consumers approximately four billion dollars per year. Congestion-related costs could be signi?cantly decreased if, While maintaining reliability, increased transfers across congested overhead transmission paths Were alloWed. Increased transmission capacity Would improve grid reliability by alloWing regions to share capacity reserves. Real time-monitoring of congested circuit param eters is a focal point for efforts directed toWards higher grid ef?ciency and reliability via improved measurement and grid visualiZation. Parameters include conductor sag, tempera ture, current, ampacity, and ATC (“available transmission capacity”). When these parameters can be determined accu rately, and in real-time, latent or “hidden” transmission capacity can be revealed; this can then be monitored, quanti ?ed, logged, and modeled. Ultimately, and more importantly, such transmission capacity can be capitaliZed on via dynamic thermal circuit rating and operation. Real time dynamic ther mal circuit rating (“RT-DTCR”) systems maximiZe transmis sion circuit performance (ATC, ampacity, ef?ciency) While simultaneously maintaining reliability. While a feW commercial high voltage transmission line
(“HVTL”) sensors and DTCR systems have become avail able over the years, acceptance, market penetration, use, and groWth-in-use have been impeded by a number of factors. Technical issues (e.g., system failure, sensor impacts on reli ability, poor accuracy, frequent loss of calibration, complex/ lengthy/invasive installation or calibration) have plagued some technologies. More important has been the very high total installed cost. An overhead transmission line (OHTL) sensor/DTCR product With drastically loWer costs Would rep resent a dramatic improvement over existing commercial technologies.
Efforts to develop devices aimed at measuring conductor capacity, usage, and availability are hindered by complexity in design or installation. Genscape, Inc., for example, has ?led multiple patent applications for their method of moni toring poWer and current How in phase conductors. Several of the Genscape, Inc. publications (e.g., US. Pat. No. 6,714, 000; US. Pat. No. 6,771,058; US. Pat. No. 6,956,364; and US. Patent Application No. 20050162148) require magnetic ?eld measurements and electric ?eld measurements to derive electrical poWer dynamics in the facility. Genscape’s dual measurements entail signi?cantly intricate data processing to estimate the poWer ?oW (MW) in high voltage transmission circuits.
Genscape’s US. Patent Application 20070052493 utiliZes magnetic ?ux measurements to determine Which position beloW an overhead conductor is optimal for detecting changes in magnetic ?eld. The ’493 publication gives little detail regarding the manner by Which the data gathered by the
US 8,280,652 B2 3
process therein could be used to determine additional useful parameters such as phase conductor magnitude, phase angle, cable heights, temperature, and ampacity. US. Patent Application 200502861 90 to Rostron discloses
an electric poWer monitoring system using electromagnetic ?eld sensors located remotely from the phase conductors. Rostron does not disclose the mathematical bases and algo rithms for unknown system variables. At best, Rostron dis closes the idea that measuring the electromagnetic ?eld from a ?xed, above-ground pedestal or platform can be used in predicting phase currents. Rostron offers little more detail.
BRIEF SUMMARY OF THE INVENTION
The invention herein includes an apparatus, a computer ized method, and a computer-implemented system for mea suring the magnetic ?eld produced by phase conductors and using those measurements to determine the amplitude, phase and current on a phase conductor, as Well as that conductor’s position in space (sag). The method requires neither conduc tor temperature nor electric ?eld measurements for accuracy. These values, in addition to knoWn standards for the materials Within the poWer distribution system, alloW for calculating current amplitude and phase, in addition to line sag, With remotely placed sensor measurements. Upon calculating line current and sag, the conductor temperature and capacity, along With ampacity, may be determined.
The objects of this invention are accomplished by using a sensor for measuring the three dimensional phase and mag nitude of the magnetic ?eld emanating from phase conductors in an overhead transmission system. The sensor takes advan tage of at least tWo parallel Wire coils having opposite polarity currents generated by the magnetic ?eld. The coils, also called Windings herein, cancel the electric ?eld and the noise associated thereWith for better accuracy.
The sensors are used in pairs to measure the X and y com ponents of the magnetic ?eld from an overhead poWer trans mission and distribution line. These magnetic ?eld compo nents induce respective open circuit voltages on each sensor, Which serve as inputs to a larger computerized system for calculating other parameters of interest in the model.
The system disclosed and claimed herein also implements a computerized method of measuring the physical height of three or more phase conductors in a poWer transmission and distribution system. In particular, the system’s data acquisi tion and data analysis modules e?iciently ?t compared data measurements With knoWn operating parameters to deter mine, at a minimum, the height of a phase conductor, as Well as the magnitude and phase of the current on that conductor. Other parameters, such as sag, ampacity, capacity, and fre quency of the current, along With conductor temperature, can also be determined from the system disclosed and claimed beloW.
BRIEF DESCRIPTION OF THE DRAWINGS
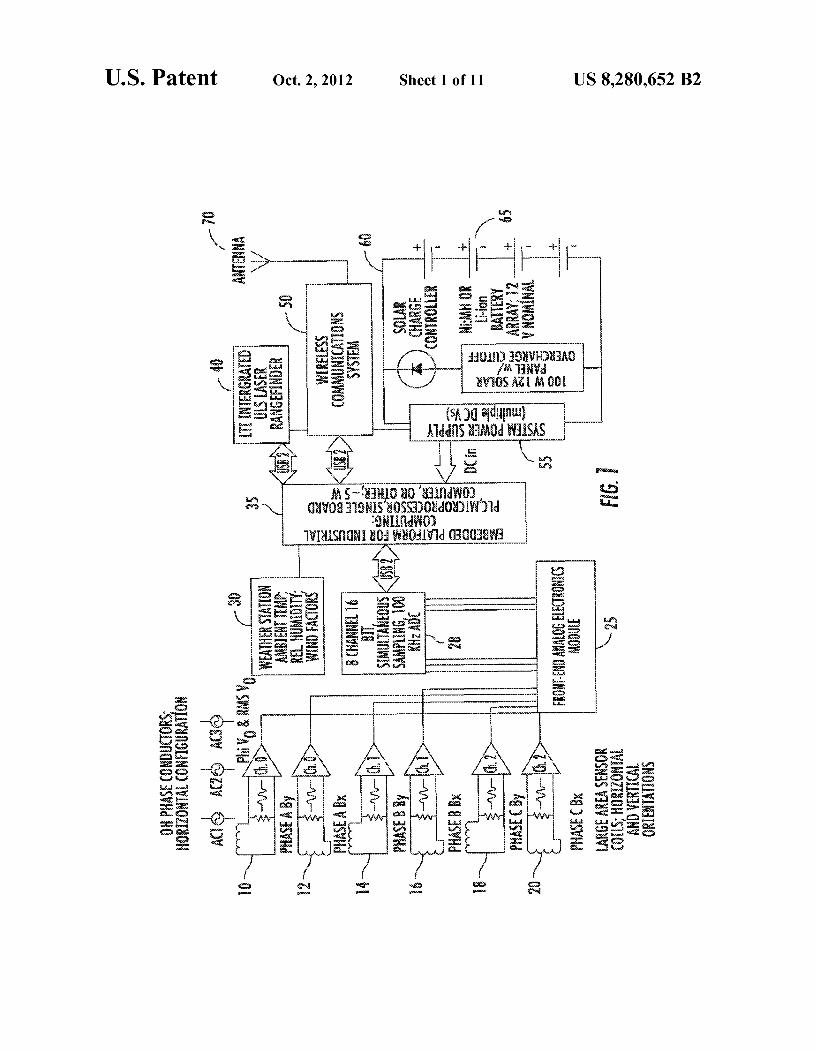
FIG. 1 schematically depicts the electronic circuit of this invention as installed in a ?eld operation having magnetic ?eld sensors under overhead phase conductors.
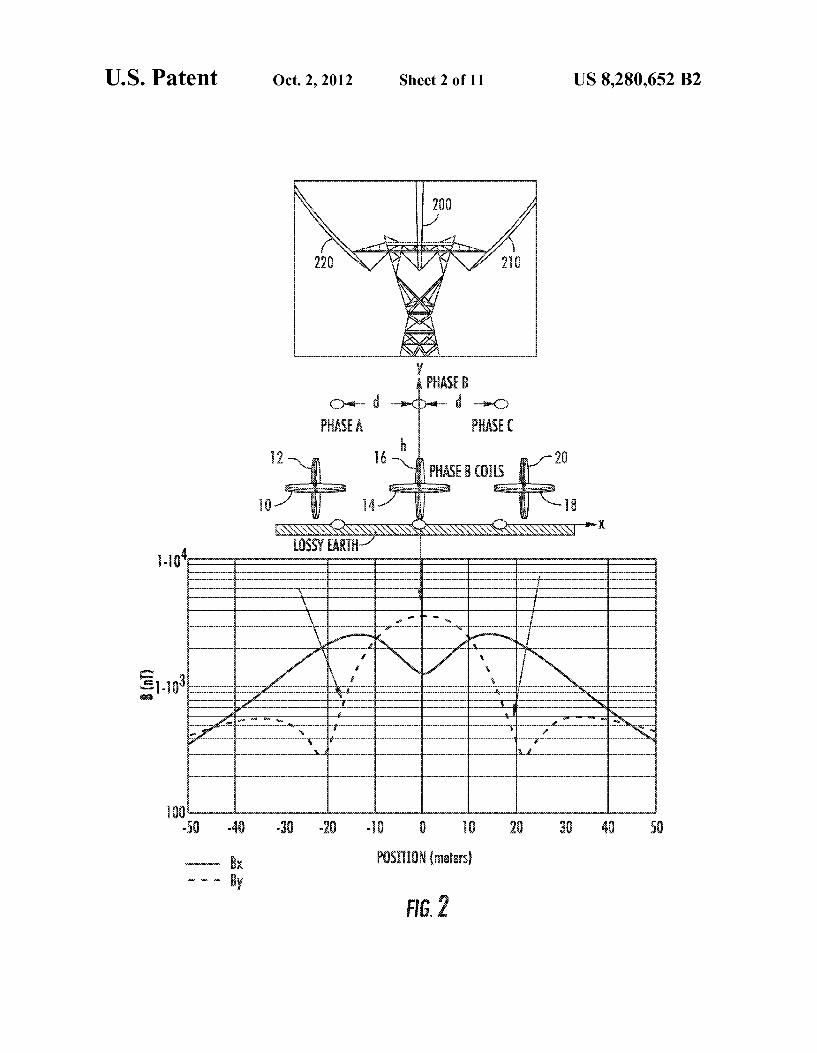
FIG. 2 shoWs a three-part representation of the sensors as placed under a horizontally-oriented 3-phase overhead poWer line and the associated output generated by the system.
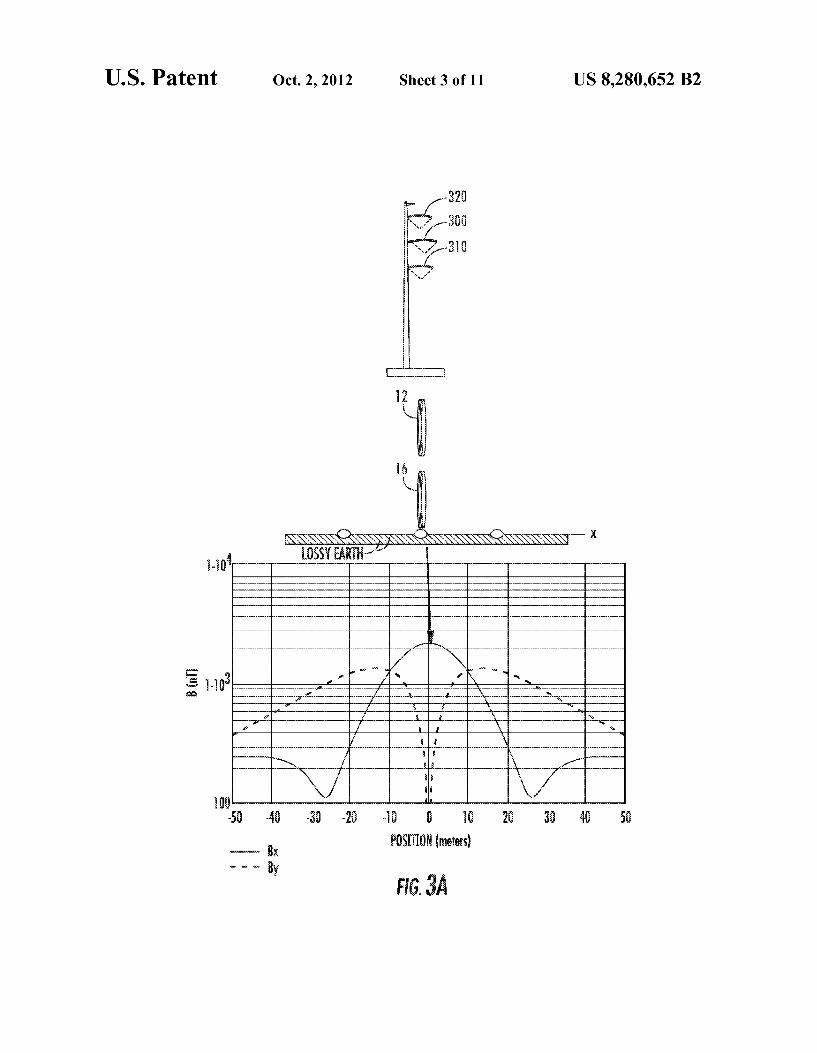
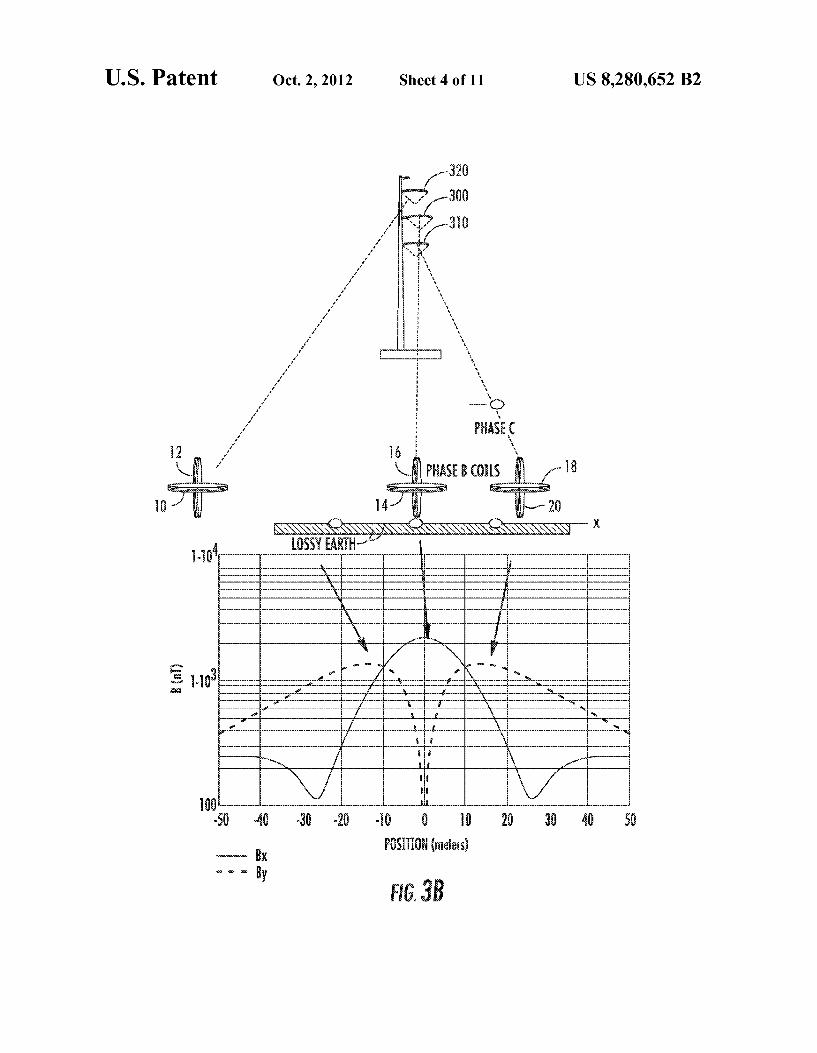
FIGS. 3A and 3B shoW a three-part representation of the sensors as placed under a vertically-oriented 3-phase over head poWer line and the associated output generated by the system.
20
25
30
35
40
45
50
55
60
65
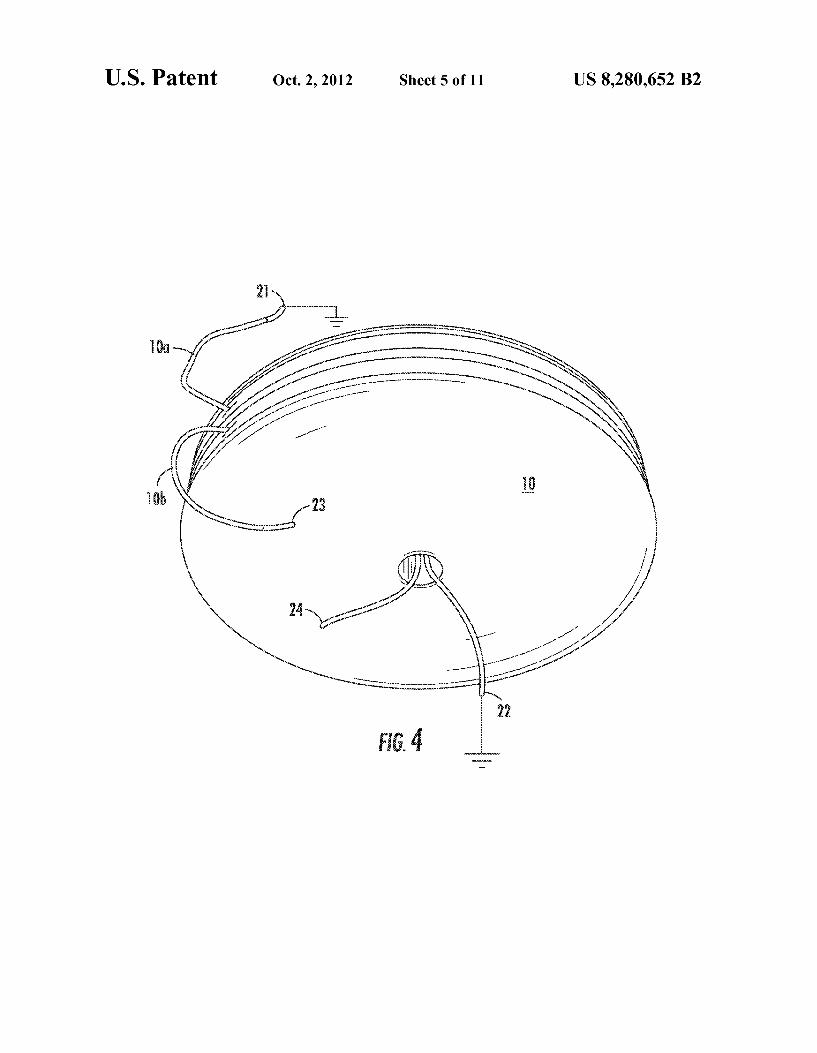
4 FIG. 4 depicts an electric ?eld canceling, magnetic ?eld
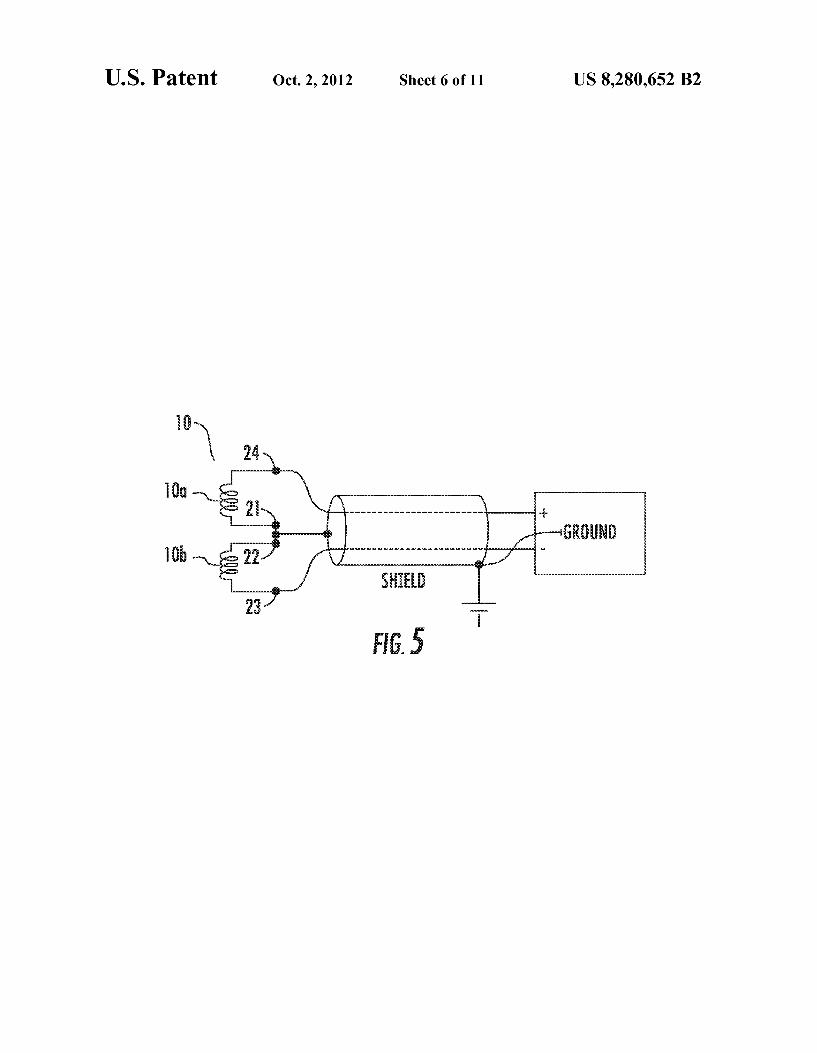
sensor having tWo opposite polarity coils. FIG. 5 schematically depicts the coil Wiring of the sensors
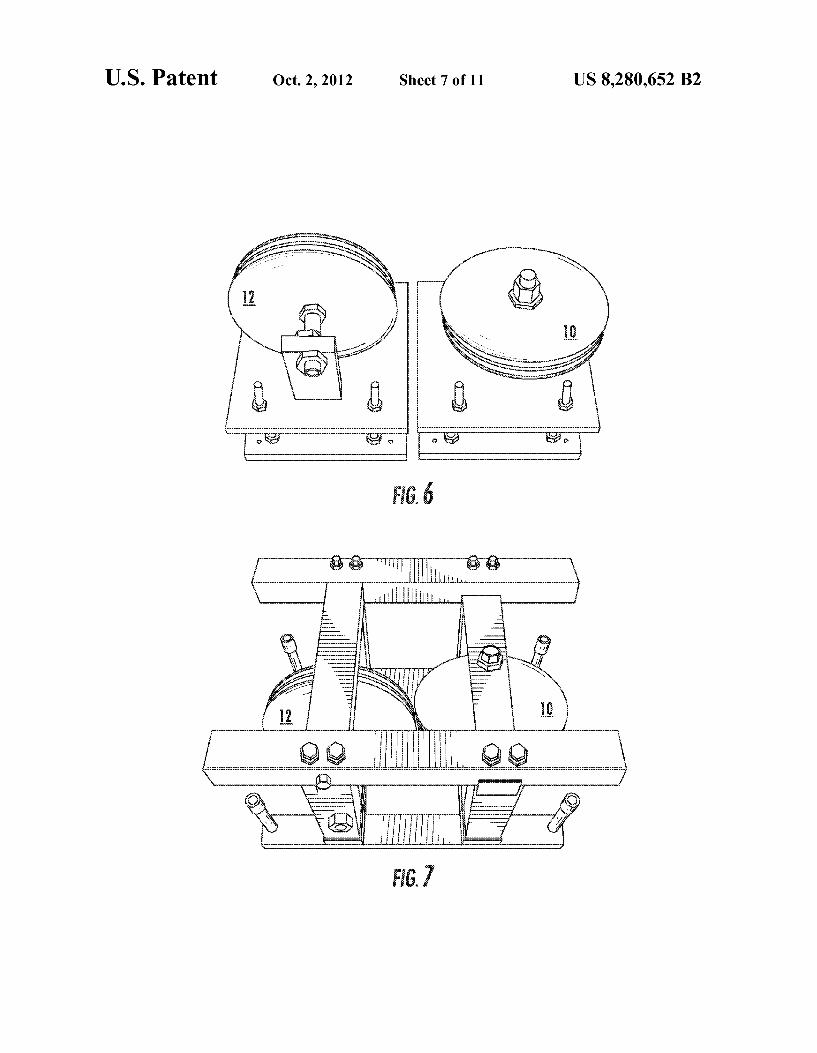
in FIG. 4. FIG. 6 shoWs a pair of electric ?eld canceling magnetic
?eld sensors for placing under an overhead transmission line according this invention.
FIG. 7 shoWs the sensor pair of FIG. 6 With a protective housing for long term installations.
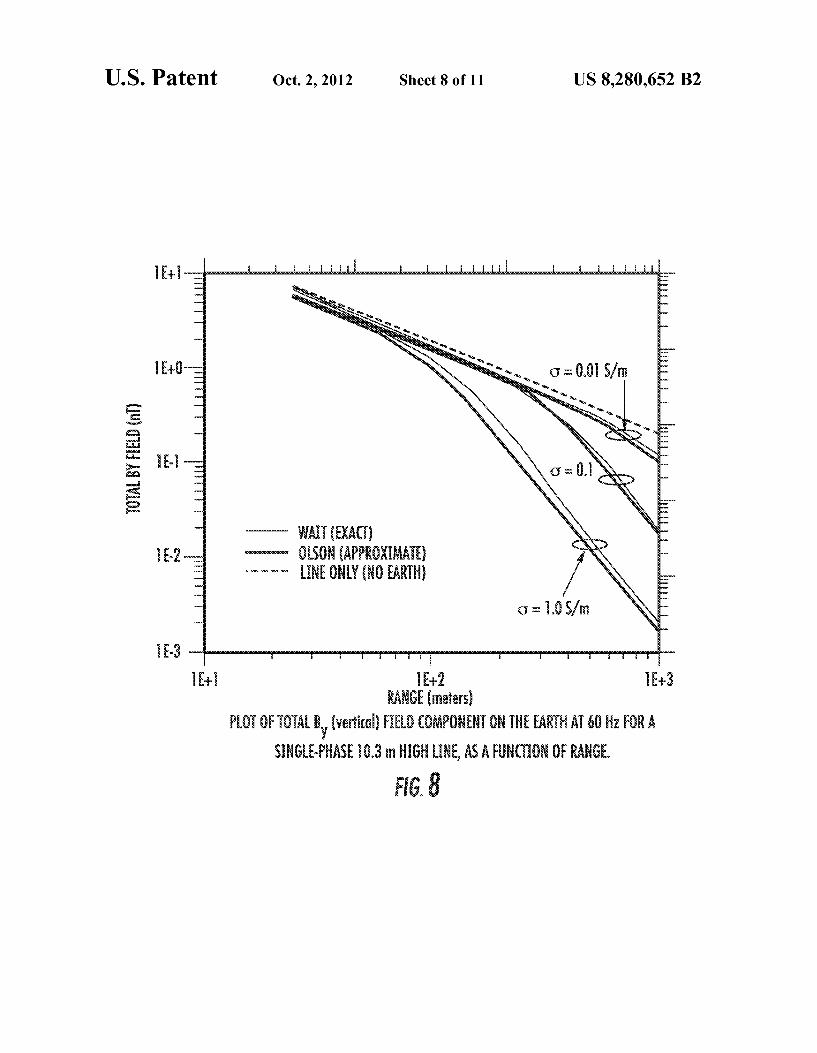
FIG. 8 is a plot of the vertical ?eld component of the image magnetic ?eld that Would be measured on the ground/earth level as generated by an overhead transmission line.
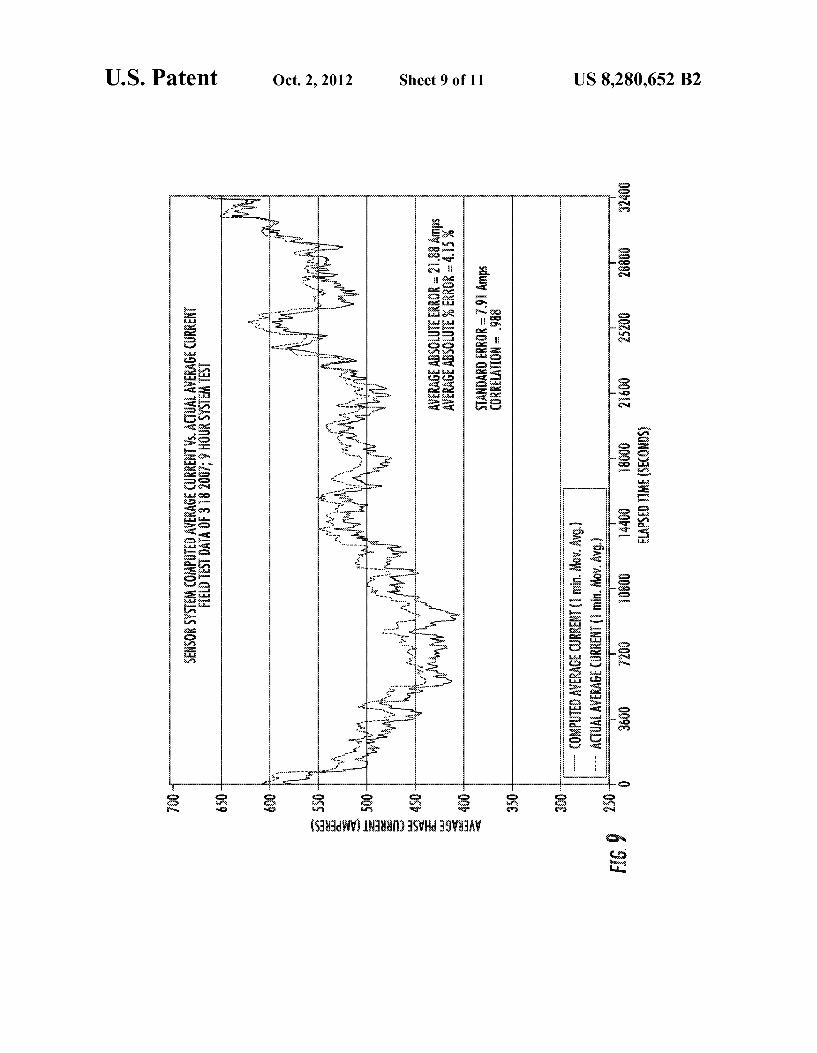
FIG. 9 is a plot of the sensor system computed average current in comparison to the knoWn values.
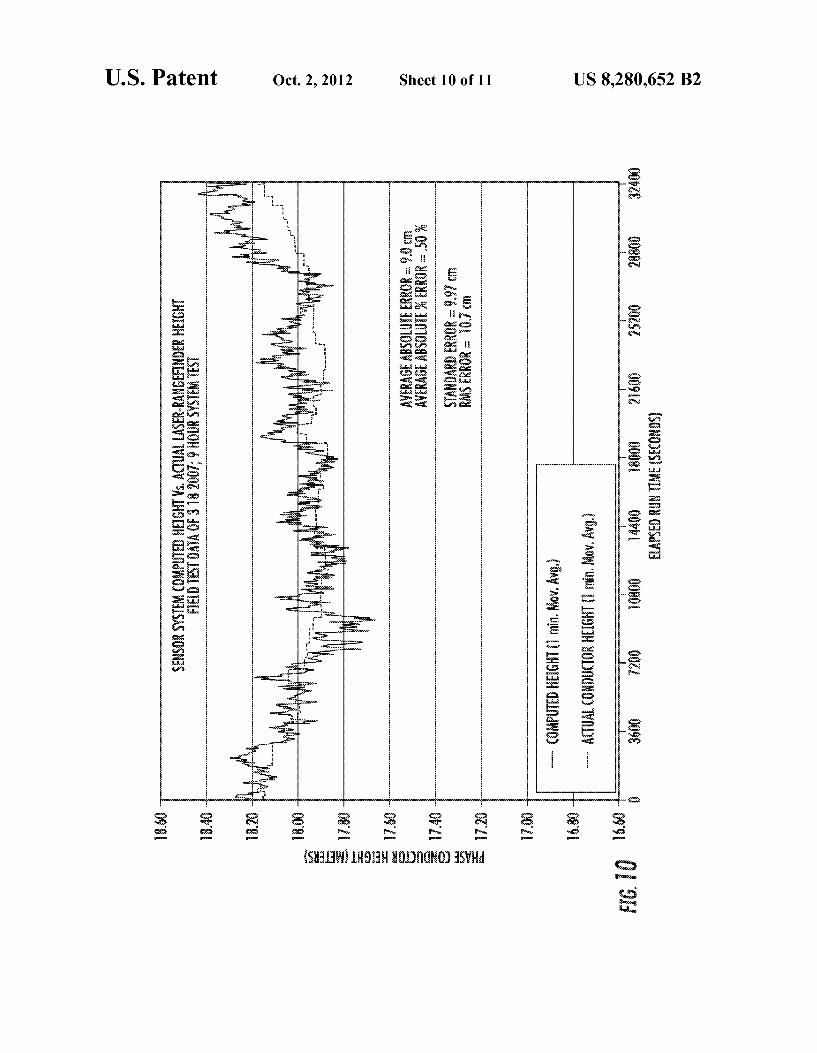
FIG. 10 is a plot of the sensor system computed height in comparison to the knoWn value as measured.
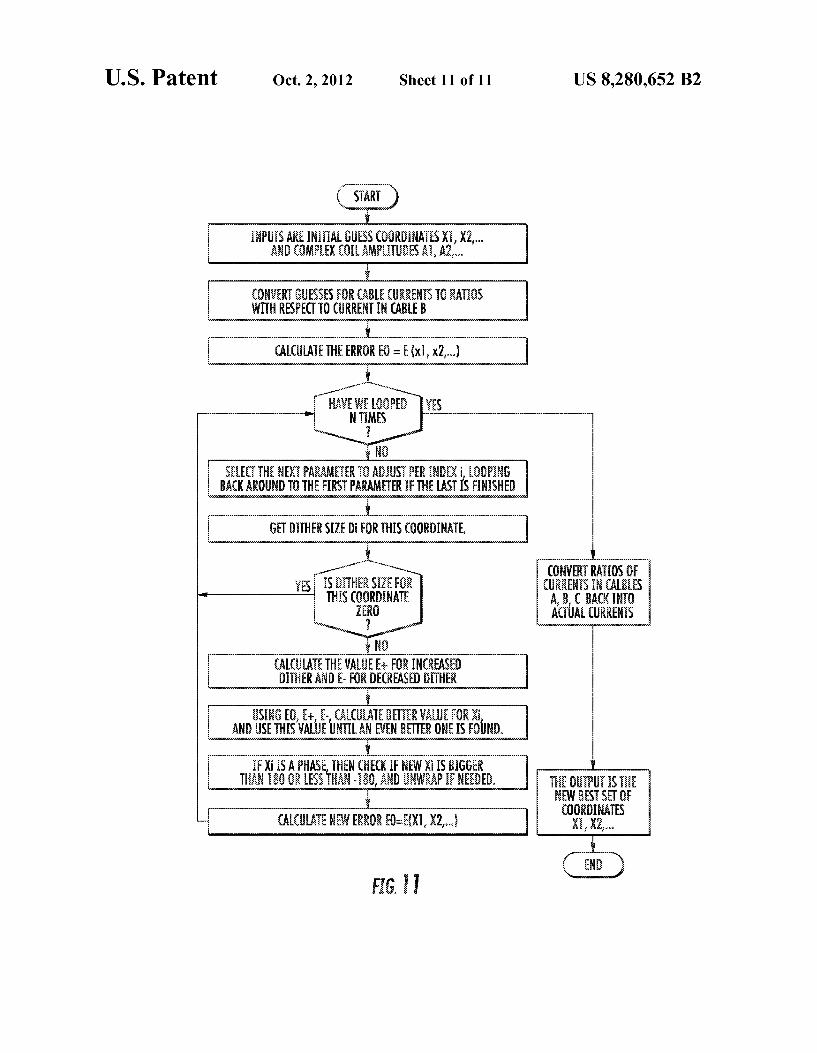
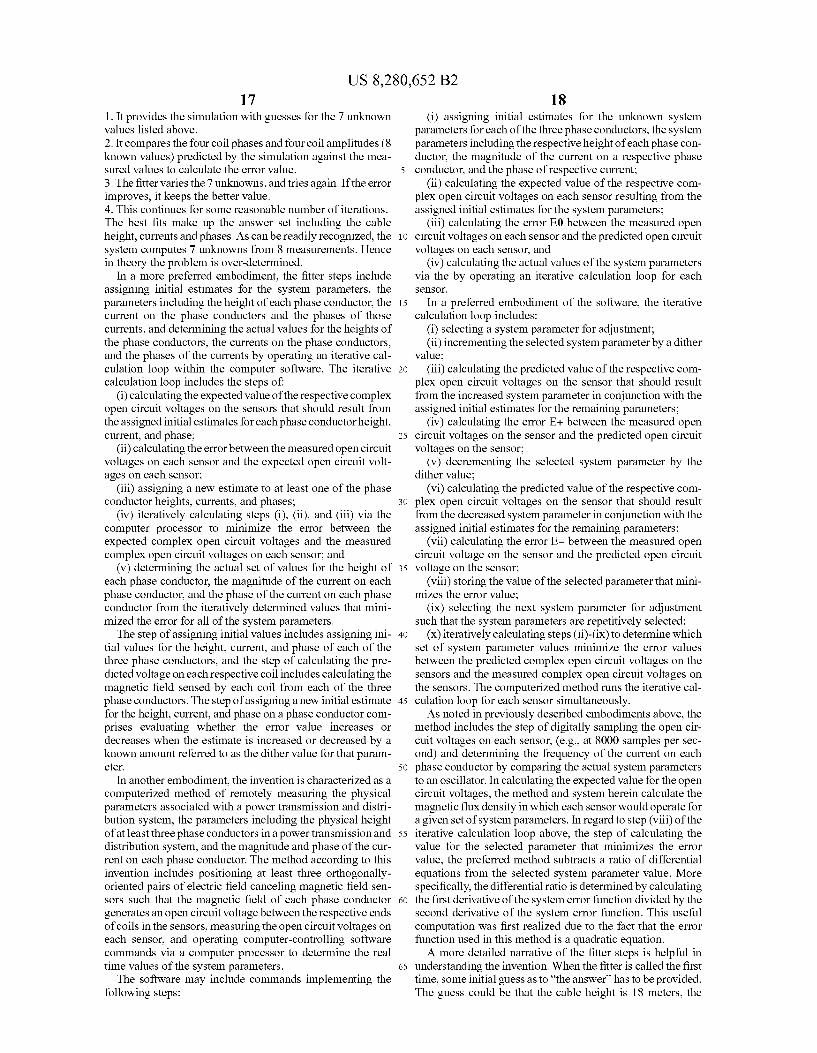
FIG. 11 is a schematic of the computer logic used in one embodiment of the data ?tter for calculating the overhead transmission system parameters from measured sensor volt ages.
DETAILED DESCRIPTION
High voltage overhead phase conductors are very long, gentle catenaries, the electro-mechanical characteristics and behavior of Which have been intensely studied are very Well understoodl. The quasi-lineal phase conductors generate time-varying magnetic ?elds that, at 60 Hz, may be treated quasi-statically. The ?eld strength at any location can be measured very accurately and, if measured simultaneously at multiple, spatially distinct locations, used to determine accu rately the distance to the conductors. The distance, in turn, can be used to determine the sag of the conductors; given this, the average conductor temperature, current phase angle, and magnitude of the current can be accurately established. The magnetic ?eld, H, around a phase conductor has mag
nitude, H:I/2J'cr, Where r is the distance to the conductor and I is the phase current. In three-phase transmission circuits, the phase currents, I1, I2 and I3, are 120 degrees out of phase, vary Widely over the course of a day. In realistic systems, there Will be imbalances that are addressed in the Work supporting this invention. While the basics physics discussed beloW pre dominantly address a balanced system, the invention encom passes the multitude of imbalanced parameters that could be present in any given situation.
H1, H2 and H3 continuously vary in strength and ?ip direc tions at the fundamental frequency (e.g., 60 Hz in the US. and 50 Hz in Europ). To determine the combined H ?eld at any location, one must compute the vector sum of the three con tributing ?elds by decomposing them into horizontal (X) and vertical (y) components and adding these separately. This sum is noted as HXIH lX+HZX+H3X and Hx:H1x+H2x+H3x. One should note that only the X and y components of the magnetic ?eld are signi?cant for purposes herein because the third, the z component, is so small that it is statistically insigni?cant for the system here.
For a circuit With a horizontal phase conductor con?gura tion, such as that of FIG. 2, Hlx and HIV, at a point directly under the nadir of the central phase conductor 200, are given by
US 8,280,652 B2 5
(Equation 1 .1), Where d is the ?xed distance distance betWeen the phase conductors 200, 210, and 220, and h is the height of the conductors above the test point,
(Equations 1.2 and 1.3) Since I1, I2 and I3 are sinusoids, the system must sum three,
120 degree out-of-phase, sinusoidal, scalar quantities. Con sider three scalar quantities, V1, V2 and V3, sinusoidally vary ing, and 120 degrees out-of-phase. In phasor notation, V1, V2, and V3 may be expressed as Vl:Vlp[cos(0)+j sin(0)]:Vlp, V2:V2p[cos(120)+j sin(120)]:V2P[—1/2+j\/m], and V3IV3P [cos(—120)+j sin(—120)]:V3P[—1/2—j\/m], Where VIP is Vlpeak, VZP is Vzpeak, etc. The magnitude of the combined quantities is given by
V : [(real part)2 + (imaginary pa.rt)2]l/2 1/2
Dropping the “p” subscript, the result is
For a test location directly under the nadir of the center phase, the system combines the ?eld components from the three overhead phases. By inserting the x component of equa tions 1.1, 1.2, and 1.3 into Equation 2, We ?nd that the mag nitude of Hx, the horiZontal ?eld component, is
Similarly, for Hy, the vertical ?eld component, We have
_ 1l 1 it
y _ 5(2 _ h2+d2]'
(Equation 3y) The ratio of the components is
(Equation 4)
It is important to note that When the load on the conductor is balanced, Equation 4 is independent of both the circuit voltage and the current in the phase conductors. For an AC transmission circuit With horiZontal phase conductor geom etry, Equation 4 shoWs that by simultaneously measuring the AC amplitude of H,C and Hy directly beloW the central phase conductor, the distance from the phase conductors to the sensing coils can be determined using the formula
20
25
30
35
40
45
50
55
65
h = i i v? H;
(Equation 5), Where d is the ?xed separation of the phase conductors. Given h, We can then calculate the phase current, I, from Equation 3y,
2..., (1 _ L)". y it h2 + d2
H,C and Hy can be determined by measuring the AC voltages developed in large area coils positioned Within the magnetic ?eld of at least one phase conductor. One can use the coils to measure the magnitude and phase of the magnetic ?elds in three dimensions (i.e., the “x” or left/right dimension, “y” or up/doWn dimension, and “Z” or forWards/backWards dimen sion). In this embodiment, the three dimensional picture of the ?elds can be described as vectors Whose tails are ?xed at
points in space, but Whose tips rotate at, for example, 60 HZ tracing out ellipses as they rotate. As Will be explained in more detail beloW, one preferred embodiment of the system of this invention utiliZes only the coils Whose axes are in the horiZontal and vertical directions.
Given H, the RMS voltage V for a coil Whose n turns enclose an area A is V:2J'cFuOHnA. F is 60 HZ, p.o:4s'c><l0_7 Henries/meter, and H is the RMS amplitude of the component of the magnetic ?eld in the direction of the coil axis. To measure Hx, a coil 12, such as that shoWn in FIG. 6, Whose axis is horiZontal is used; Hy requires a coil 10 With a vertical axis. TWo identical coils (FIG. 6) With orthogonal axes (a “T” con?guration) may be used to continuously monitor HJ/HX, giving us continuous information on h and Inns.
While Equation 5 applies only to the horiZontal phase conductor con?guration, vertical phase conductor con?gura tions (FIG. 3) can also be monitored With properly con?gured coils (10, 12, 14, 16, 18, 20). In this case, Hy directly under the phases Will be Zero (by symmetry), so the HJ/H,C approach cannot be used. HoWever, H,C canbe measured simultaneously at tWo heights, y 1 and y2, directly under the conductors 310, 320 and very close to ground level; the ratio Hx(yl)/Hx(y2) can be then used to determine h and, given this, Inns. The layout and functional block diagram for the ?eld development system is shoWn in FIG. 1. As set forth in FIGS. 1 and 2, one embodiment of this
invention includes tWo large area coils 14, 16 (650-1000 m2) located directly under the nadir of the central phase conductor 200 of a horizontally con?gured transmission circuit. The coils 14, 16 are arranged in a “T” con?guration, and are located at ground level, or just above. The coils and sensor system occupy a volume of about 1 m3, sit on a thin concrete pad, and are housed Within a high reliability, high strength Weatherproof enclosure (non-metallic; loW u). Calculations further indicate that, at minimal additional cost, the sensor system can be located just beneath the surface of the earth With the solar panel and antenna being located on the nearest transmission toWer.
The thermo-mechanical relationship betWeen phase con ductor sag and average conductor temperature has been stud ied exhaustively and modeled extensively2’ 3’ 4. Several com mercial softWare packages, e.g., Sag10, LineAmps, EPRI’s DTCR Package, and The Valley Group’s IntelliCat, are based on prior models. Given mechanical, engineering, and dimen sional information speci?c to the span and conductor being
US 8,280,652 B2 7
monitored (e.g., line tension, conductor type and properties, span length), the average temperature of the conductors in the span can be determined from accurate, real-time sag measure ment. Combining lrms With accurate knowledge of sag and temperature, and incorporating the conductor’s static rating (the latter a function of temperature), alloWs us to calculate ampacity. The difference betWeen the actual, real-time ampacity and actual, real-time conductor lrms is a measure of the margin, or additional transfer capability, available to operators, if the monitored spans are not clearance (sag) limited and/ or thermally limited. This is the basis for dynamic thermal circuit rating (“DTCR”) and operation.
Referring to FIG. 1, the preliminary design of the Sensor System supports very loW continuous poWer requirements. Subsystems and components support loW duty-cycle opera tion via sleep, quiescent, and on-off operational modes. The transducers themselves require no poWer, and for most embodiments, no system component or subsystem requires active (TEC-based) heating or cooling. The system Will be poWered by the combination of a high ef?ciency 12 V Si solar panel 60 and a rechargeable NizMH (or Li ion) battery array 65; these Will feed a SWitched PoWer Supply 55. The tWo most poWer intensive system components are the single board computer 35 and the Wireless communications transmitter 50, at 5 W and approximately 4 W, respectively. Maximum con tinuous poWer consumption is less than 9 W. The combination of the solar panel 60 and the, high-e?iciency battery array 65 Will supply system poWer under all conditions. In darkness, the fully charged battery array 65 can poWer the system for more than 60 hrs.; recharge time in full sunlight is less than or equal to 7 hours. Given the thermo -mechanical time constants of overhead phase conductors, active reporting at 7.5 or 10 minute intervals should be entirely suf?cient to support all end-user monitoring and/or DTCR activities. At 7.5 minute reporting, the effective system poWer duty cycle Will be approximately 6.7%.
Technical discussions of DTCR technology alWays treat the parameters to be monitored, and the sensor types, but alWays speculate as to the number, location, and spacing of same. It is Well knoWn that the location, route, direction, elevation, and topography of a circuit, and its right of Way, have very signi?cant effects on the temperature and, there fore, the sag and clearance of overhead high voltage conduc tor spans. If, for example, one has 5, 10, 20, or perhaps more, straight rights of Way or circuit miles on level ground, and With a single compass direction, it is plausible that a single sensor, located on the ruling span (or a critical span) could provide the desired real time ampacity-limiting sag and tem perature information. HoWever, long, straight, transmission rights of Way, over single types of terrain and vegetation, and at constant altitude, do not represent a signi?cant fraction of rights of Way and circuit miles in the United States.
Most commonly, there are numerous changes in direction, topography, and elevation along a given circuit; such changes affect incident solar radiation, Wind velocity, Wind direction, ambient temperature and humidity. Changing topography, surface vegetation, and surface/terrain geology have a signi? cant in?uence on conductor temperature and, therefore, sag; such changes can frequently be observed on a span by span basis. These factors combine to render conductor temperature and sag highly dynamic and unpredictable. While Weather systems, patterns, and ambient conditions may be very simi lar Within 5, 10, or 20 miles, in many cases, even assuming static right of Way parameters, over the time course of minutes to hours one sees signi?cantly different ambient tempera tures, humidity, Wind velocity/direction at points separated by such distances.
20
25
30
35
40
45
50
55
60
65
8 Ruling spans are obviously initial, or default, sensor loca
tions.5 HoWever, the ruling span is an assumed uniform design span Which approximately portrays the thermo-me chanical behavior of a span betWeen its dead ends. Its purpose lies With the design and construction of a line (sags and clearances are calculated for structure spotting and conductor stringing), not With operation over the seasons and the years. Additionally, While a ruling span is a logical starting point, its thermo-mechanical state and behavior may not at all be rep resentative of the circuit as a Whole.
In response to aging infrastructure, signi?cant increases in average loading, and the groWing problem of congestion, many utilities, independent service operators (“ISOs”), and regional transmission organizations (“RTOs”) noW have high-accuracy survey data on their transmission lines and rights of Way. Many recent surveys have focused on knoWn, heavily loaded and congested paths, and have revealed the existence of so-called “critical spans,” i.e., spans that are not infrequently sag/clearance limited. Such critical spans are obvious candidates for sensor placements. With such survey data in hand, it is typically possible to assign a single, most critical span, but there are frequently additional spans that are, statistically, also critical. As a result, a given congested (or heavily loaded) path may contain a doZen or more critical spans that are, or could be, indicated for sensor placement. The fact of the matter is that presently there is no clear rule
or consensus as to sensor number and spacing. Each utility, RTO, and ISO is different, each congested path is unique, and ‘critical span,’ insofar as using the term to designate a sensor placement, is, for a number of reasons (some of Which are statistical), de?ned differently by different entities. It is vir tually certain that the determination of sensor number, loca tion, and spacing Will be made on a case-by-case basis, viZ. RTO by RTO, congested path by congested path. If the history of the purchase of Intelligent Electronic Devices (“lEDs”) for transmission and distribution (“T&D”) system applications is any guide, then it is also virtually certain that the number of sensors speci?ed Will be inversely proportional to total installed cost.6 As more current ?oWs in an electrical poWer line, the 12R
loss in the conductors causes an increase in the line tempera ture, With a corresponding lengthening of the line conductors due to thermal expansion. Since the conductors are supported at ?xed points (e.g., at the toWers), there Will be a change in the conductor height as the current increases, and this change in conductor height causes a small change in the B-?eld as measured at ground level.
Using a simple three conductor model for a three-phase poWer transmission line, calculations have been performed to illustrate the behavior of the vertical and horiZontal compo nents of the B-?eld on the earth under the line. This model is based on an approximate solution for the ?elds, Which uses a complex image theory to include the effects of the lossy earth under the line. It turns out, hoWever, that for ?eld observation points close to the transmission line, the earth effects are negligible.
Line Geometry and Current
This study utiliZes tWo con?gurations that are typical of 500 kV-class transmission lines as shoWn in FIGS. 2 and 3. As shoWn in FIG. 2, one line has a horizontal layout of the phase conductors 200, 210, 220, and there may be tWo shield con ductors mounted symmetrically above the phase conductors (not shoWn). FIG. 3 portrays a vertically stacked line With a single overhead shield Wire and three phase conductors 300, 310, 320.
US 8,280,652 B2 9
This analysis neglects the overhead shield conductors and any current that may be ?owing in them. In the horizontal con?guration of FIG. 2, a typical line height is h:l7.4 m and the phase conductor separations are d:l0.67 m. For the ver tical conductor con?guration of FIG. 3, the phase A conduc tor height is taken to be h:l7.4 m and the phase conductor separations are d:9.l4 m.
The voltages on the lines of FIG. 2 are 1200 out of phase With each other. Taking the 0° phase reference to be on the Phase B conductors, the line voltages can be expressed in phasor notation as
Note that these voltages are balanced, in that their sum is Zero:
The currents that How in the lines depend on the electrical loads attached to the line. Utilities attempt to balance these loads so that the line currents are also balanced. HoWever, this is not alWays possible and sometimes there Will be a total, or Zero-sequence, current 10 ?oWing, as
(Z) 21; =10. 1'
Moreover, because the electrical loads on the line may be reactive, there is no guarantee that the currents have the same phase as the voltage, nor are the phases exactly 1200 apart. As time varies, both the amplitudes and relative phases of the current phasors can be expected to change, depending on the state of the electrical loading of the line.
If We assume that the current phases are identical With the voltage phases, then the Zero sequence current can be Written as
(3) 10 = IAW’M +18 + ICE/2M3
Estimation of Magnetic Flux Density
To compute the B-?eld produced by an overhead poWer line, the starting point is to use the Biot-Savart laW7, Which provides the magnetic (H) ?eld in the vicinity of a conductor carrying a quasi-static current I. For a theoretically in?nite straight line conductor, the Bior Savart laW reduces to Amperes LaW: The H-?eld at a distance r from the Wire produced by the current is in the (l) direction, and is expressed as
20
25
30
35
40
45
50
55
60
65
10
1 (4) H¢(r) : % (A/m).
The corresponding magnetic ?ux density (B-?eld) around the Wire is given by
(5) I B¢(r) : % (teslas)
I = 200- (nanoteslas)
r
By LenZ’ s laW, the open-circuit voltage induced in an n turn Wire coil With area A is related to the time derivative of the B-?eld linking the coil by
V — AdB l (6) (I) _ —n E (vo ts).
For a time harmonic B-?eld With frequency f, the peak amplitude of the induced open circuit coil voltage is given as
The simple relationship betWeen the B-?eld and the open circuit voltage of the loop in Eq. (7) implies that such a loop can be used as a sensor to measure the B-?eld produced by an
overhead poWer line. Accordingly, a poWer line can be mod eled as three overhead conductors at locations (xi, yi) over a conducting earth. For each conductor in the line, the B-?eld at an observation location (x0, yo) can be expressed in terms of a direct contribution in the form of Eq. (4) plus a contribution arising from the presence of the lossy earth. Expressions for the B-?eld from a single conductor over the earth have been developed by Wait8 and later used by Olsen9 for a three phase line like that in FIG. 2.
From Olsen the Cartesian components of the B-?eld at location (x0,y0) are given by a sum of three terms arising from the currents in each conductor as
(33)
3
By(xo, yo) = 20021;[ ] (nT). [:1
In the above expressions, the ?rst term in the bracket is the direct B-?eld contribution from the Wire, and the second term arises from the earth effect. This second term appears as an image of the overhead conductor in the earth at a complex distance (y+0t), Where y is the height of the conductor in question, and 0t is a frequency dependent complex distance given by
US 8,280,652 B2 11
a = (1 + j)503 gglfo (m).
The terms r1 and r2 are the distances from the Wire and image to the observation point, respectively, and are given as
(9)
Effect of the Earth on the B-Field
To illustrate the behavior of the B-?eld produced by an overhead poWer line and assess the effects of the conducting earth, it is instructive to consider a single conductor line (e.g., a line like that in FIG. 2 With current ?oWing only in phase B 200. For a 10.3 m high line, FIG. 8 presents a plot ofnormal ized vertical B ?eld (By/I) at 60 Hz for different earth con ductivities, using the rigorous analysis of Wait and the approximate image analysis by Olsen. The x-axis of this plot represents the horizontal distance of the observation point from the line, and close to the line, it is noted that the complex image and exact models agree Well, and that the earth effects are not very signi?cant. A real earth has an electrical conductivity 0 that lies
betWeen 0.1 and 0.0001 S/m. From FIG. 9, We note that for this range of conductivity, the B-?eld response for observa tion points less than 200 meters from the line is very nearly equal to that of the isolated phase conductor. Thus, close to the line, the earth effects are negligible and the second term in the brackets in Eq. (8) can be omitted. The B-?eld is calcu lated by just the contributions from the phase conductor cur rents.
Analysis of FIGS. 2 and 3
It is instructional to plot the B-?eld under the 3-conductor line of FIG. 2. FIG. 2 includes a magnetic ?eld plot for the 3-conductor line With the 3-phase current having 1200 phase differences and 400 A amplitude. The vertical (y) component of the B-?eld is a maximum under the center phase (200), and the horizontal (x) component is maximized at about x::14 meters, Which is close to the horizontal locations of the outer (210 and 220) phase conductors. It is notable in FIG. 2 that the maximum B-?eld amplitude is about a factor of 3 smaller than in the 3 -conductor case With the same current magnitudes and identical phases. It is interesting to consider the behavior of the B-?elds on the ground under the alternate line, shoWn in FIG. 3, Which has the conductors stacked vertically. FIG. 3 shoWs the vertical and horizontal B-?eld components under this line, and one should note that the behavior of these components are reversed from that of the line With horizontal conductors. That is to say that for the line With vertically stacked conductors 300, 310, 320, the horizontal (x) compo nent of the B-?eld is maximum under the line, and the vertical (y) ?elds are maximized at x::14 meters.
Effects of Zero-Sequence Current
To assess the importance of the presence of a zero-se quence current ?oWing in the transmission line of FIG. 2, the computational model has been used With the phase currents A
20
25
30
35
40
45
50
55
60
65
12 and C equal to 1300 A, Which is near the maximum. The phase B 200 current is equal to 1300+I0, Where the zero sequence current I0 is alloWed to vary from 0 to 100 A. Each of these currents has a 1200 phase difference from the others. The peak values of the B-?elds (magnetic ?ux density
?elds) are relatively insensitive to the presence of the zero sequence current. By placing magnetic ?ux density sensors at these peak ?eld locations, the system Will provide useful data for estimating line sag. In this regard, the ?rst placement of the sensors does not have to be arbitrary, but instead, the system Will approximate the most sensitive locations to place the sensors for accuracy.
Estimates of Line Sag
With the computational model for the B-?elds, it is pos sible to examine and evaluate various strategies for estimating transmission line sag due to line heating. Some of these strategies require further study, but a ?rst step in developing a method for estimating line sag it to examine hoW the mea sured B-?elds on the earth change as the line height varies.
Also, in the system of this invention, the value of line height is calculated quite accurately, as shoWn in FIG. 10, to address issues related to line sag.
Computerized Method of Analyzing Overhead Transmission and Distribution Lines
Against the back drop of the above discussions, one should note that it is Within the scope of this invention to use com puterized systems to implement the computations for deter mining the current magnitude, current phase and phase con ductor height for any given overhead poWer transmission and distribution system. These parameters can then be used to model other factors such as line temperature, sag, clearance, ampacity, and line capacity. As shoWn in FIGS. 1-3, the com puterized system of this invention utilizes orthogonally ori ented pairs of electric ?eld canceling magnetic ?eld sensors 10, 12, 14, 16, 18, and 20 placed under overhead phase con ductors 200, 210, 220, 300, 310, 320. Each sensor in a pair senses either a respective x or y component of the magnetic ?eld emanating from the overhead phase conductors. The sensors are positioned remotely from the phase conductors and therefore do not interfere With the transmission system. The magnetic ?eld components emanating from the lines induce respective open circuit voltages on each sensor, Which serve as inputs to a larger computerized system for calculat ing other parameters of interest in the model.
Each sensor (e. g., 10) in the system is an apparatus capable of measuring the three-dimensional phase and magnitude of the magnetic ?eld emanating from a phase conductor. The sensor 10 has at least one pair of parallel conductive Windings 21-23, 22-24 of opposite polarity from a common ground. The opposite polarity Windings substantially cancel the elec tric ?eld signal on the Windings and generate an open circuit voltage betWeen the ungrounded ends of each Winding. The result is that tWo good magnetic ?eld signals from the coils are positive and negative mirror images of each other. The electric ?eld signal is the same on the tWo leads from the coils. By using a differential input device in the electronics, the electric ?eld is rejected as a common mode signal, and the differential mode magnetic ?eld signal is kept.
In one embodiment the Windings 21-23, 22-24 have an enclosed area of at least 150 turn-meters-squared. The Wind ings are Wrapped around a substantially cylindrical bobbin such that each Winding is separately turned about respective side-by-side cross-sectional thicknesses of the bobbin. In a
US 8,280,652 B2 13
preferred embodiment, the Windings are of the same material, link, and turn radius. The bobbin includes a core that may be made of a ferrite material, an alloy of nickel and iron, or met-glass.
The voltage induced on each sensor is related to its position relative to the overhead phase conductors, the number of loops or turns in the sensor coils, and the rate of change of the magnetic ?eld from the phase conductors. One should keep in mind that the coils are sensitive to the time derivative of the magnetic ?eld signal. A consequence of this is that the coils are tWice as sensitive to the second harmonic of a fundamen
tal frequency (e.g., 60 HZ fundamental in the instant case). The coils are three times as sensitive to the third harmonic and so on. In one embodiment, the sensor is suf?ciently close to an overhead phase conductor such that the open circuit voltage betWeen the Windings is at least 100 mV AC. In a more preferred embodiment, the open circuit voltages are betWeen about 100 and about 400 mV AC.
It is desirable to operate the system Within a frequency range that avoids the resonant frequency of the coils, or Wind ings, Within each sensor 10. For this reason, the coils are con?gured to have the resonant frequency centered at 4 kHZ or higher. With a fundamental frequency of interest at about 60 HZ, the system according to this invention operates Well beloW the resonant frequency of the coils for a more con trolled and stable response. The coils Within the sensors of this invention are designed so that the inter-Winding capaci tance is extremely loW (approximately 0.5 nF), and this loW capacitance pushes the resonant frequency out to the desired range of 4 kHZ or higher. One should note that the output of the sensor 10 depends
upon the load on the coils Within that sensor 10, as determined by the input electronics. If the load is “high impedance” then almost no current comes out of the coil, and the measured output is voltage. If the load is “loW impedance,” then signi? cant current Will come out of the coil. The possibility exists, therefore, that a loW impedance system based on induced current measurements from the sensors could be used to calculate the desired values for the overhead transmission and distribution system. As noted above, the sensors Work in pairs and are posi
tioned orthogonally Without intersecting so as to sense only the x and y components of the AC magnetic ?elds produced by a phase conductor. A vertically positioned sensor (e.g., 12) has a horiZontal axis and provides a measurable voltage induced by the x-component of the magnetic ?eld. A horizon tally positioned sensor (e.g., 10) has a vertical axis and pro vides a measurable voltage induced by the y-component of the magnetic ?eld. As shoWn in FIG. 1, a most preferred embodiment utiliZes three pairs of orthogonally oriented sen sors 10, 12, 14, 16, 18, 20 positioned on the ground under three overhead phase conductors.
FIGS. 4 and 5 shoW further details of a sensor used accord ing to this invention. Sensor 10 has tWo Windings 10a, 10b side-by-side in a cross-sectional thickness of the sensor. A ?rst Winding 10a starts at end 22 closest to the sensor core and Wraps around the core circumference for the desired number of turns, thereby ending at loose end 23 along the outer circumference of the sensor. A second Winding starts at end 24 closest to the sensor core and Wraps around the core circumference for the desired number of turns, ending at loose end 21 along the outer circumference of the sensor 10. As shoWn in FIG. 5, the ?rst (core) end 22 of the second Winding 10b and the loose end 21 of the ?rst Winding 1011 are connected to a common ground. A differential voltage mea surement is then available betWeen the Windings from the
20
25
30
35
40
45
50
55
60
65
14 loose end 23 of the second Winding 10b and the ?rst (core) end 24 of the ?rst Winding 10a. One useful aspect of taking the differential voltage mea
surement in this Way is that the opposite polarity Windings 10a and 10b cancel out the electric ?elds generated on the Windings. The electric ?eld is not necessary for the system of this invention and only distorts the desired voltage measure ments. By canceling the electric ?elds generated on the Wind ings 10a and 10b, the system of the present invention provides more accurate voltage measurements related only to the mag netic ?eld emanating from the overhead phase conductors.
Continuing With the disclosure of FIG. 1, the open circuit voltages from the sensors are differential inputs to a respec tive loW pass ?lter for each sensor. This ?ltering removes the higher harmonics and provides only the data of interest to the next step in the process. In accordance With standard design considerations, the loW pass ?lter may be an RC loW pass ?lter, and in particular, may be a loW pass ?lter With a cut-off frequency of about 98 HZ. The analog voltage measurements are then sampled by an
analog to digital converter 25 (ADC) to digitiZe the data processing. In one embodiment, the ADC has eight channels and samples the voltage signals at 8000 samples per second to produce a 16 bit number representing each real time voltage measured across the pairs of Windings on each sensor. By incorporating an oscillator into the hardWare design, the invention improves the ADC 25 performance and provides a convenient means of calculating the frequency of the voltage signals. The voltages, of course, are induced across the Windings of
each sensor in response to the magnetic ?eld from the phase conductors in the overhead transmission and distribution sys tem. The numbers representing the voltages in digital format are fed to a computer processor 35 for analysis according to this invention. The digitally represented voltage signals pro vide the foundation for the system’s ability to determine the magnitude of the current on each overhead phase conductor, the phases and frequencies of those currents, the height, sag, and clearance of each phase conductor, the capacity and ampacity of each conductor, and the temperature of the lines.
In order to provide calibration tools, sensor data, and a general check on the system, FIG. 1 shoWs a laser range ?nder for manually measuring the height of the conductors from the sensor and for determining the sensors’ geographical posi tions. The invention encompasses the possibility, hoWever, of using a pre-populated database to account for this informa tion. All of the data from the ?eld measurements may be transmitted via a traditional or a Wireless netWork (e.g., the internet) to other computers and other data processing centers located remotely from the point of data collection. Finally, FIG. 1 also shoWs the battery back-up and the solar poWered panel that alloWs ?eld installation Without connecting to a separate poWer source. The system further includes a data processing module
implemented in softWare for processing the digital data that represents real time voltage signal outputs from the sensors. The data processing module is split into tWo executables. The ?rst executable completes data acquisition in real time. The second executable completes the analysis in either real time or off line. The data acquisition module Within the data processing
system includes a digital band pass ?lter to isolate the funda mental frequency of the data stream representing each real time voltage signal. The data acquisition module may be further divided into a phase determination module for iden tifying the phase of each voltage signal and an amplitude

![Ulllted States Patent [19] [11] Patent Number: 5,953,284cmosedu.com/jbaker/patents/US5953284.pdf · Ulllted States Patent [19] [11] Patent Number: 5,953,284 Baker et al. [45] Date](https://img.pdfslide.us/doc/110x75/5e888b660cfad041a644f355/ulllted-states-patent-19-11-patent-number-5953-ulllted-states-patent-19.jpg)


![Ulllted States Patent [19] [11] Patent Number: 6,138,105…US006138105A Ulllted States Patent [19] [11] Patent Number: 6,138,105 Walker et al. [45] Date of Patent: Oct. 24, 2000 [54]](https://img.pdfslide.us/doc/110x75/5b0c7a657f8b9a02508c3a7b/ulllted-states-patent-19-11-patent-number-6138105-ulllted-states-patent-19.jpg)


![(12) Ulllted States Patent (10) Patent N0.: US 7,705,177 ... · US007705177B2 (12) Ulllted States Patent (10) Patent N0.: US 7,705,177 B2 Oniciu et a]. (45) Date of Patent: Apr. 27,](https://img.pdfslide.us/doc/110x75/60b0c9a58b545159f300a441/12-ulllted-states-patent-10-patent-n0-us-7705177-us007705177b2-12.jpg)