Embed Size (px)
Citation preview
12Phenotypic Variation and Bistable Switching in Bacteria
Wiep Klaas Smits(*ü ), Jan-Willem Veening, and Oscar P. Kuipers
Abstract Microbial research generally focuses on clonal populations. However, bacterial cells with identical genotypes frequently display different phenotypes under identical conditions. This microbial cell individuality is receiving increasing attention in the literature because of its impact on cellular differentiation, survival under selec-tive conditions, and the interaction of pathogens with their hosts. It is becoming clear that stochasticity in gene expression in conjunction with the architecture of the gene network that underlies the cellular processes can generate phenotypic variation. An important regulatory mechanism is the so-called positive feedback, in which a system reinforces its own response, for instance by stimulating the production of an activator. Bistability is an interesting and relevant phenomenon, in which two distinct subpopu-lations of cells showing discrete levels of gene expression coexist in a single culture. In this chapter, we address techniques and approaches used to establish phenotypic variation, and relate three well-characterized examples of bistability to the molecular mechanisms that govern these processes, with a focus on positive feedback.
Wiep Klaas SmitsDepartment of Genetics, University of Groningen, Groningen Biomolecular Sciences and Biotechnology Institute, Kerklaan 30, 9751NN, Haren, The Netherlands. Present address: Department of Biology, Building 68-530, Massachusetts Institute of Technology, Cambridge, MA 02139, [email protected]
W. El-Sharoud (ed.) Bacterial Physiology: A Molecular Approach. 339© Springer-Verlag Berlin Heidelberg 2008
12.1 Phenotypic Variation ..................................................................................................... 34012.2 Reporters and Techniques for Single-Cell Analysis ..................................................... 34112.3 Sources of Phenotypic Variation ................................................................................... 34412.4 Bistability in Gene Expression ...................................................................................... 34712.5 Examples of “Natural” Multistability ........................................................................... 349
12.5.1 Lactose Use in E. coli...................................................................................... 34912.5.2 Genetic Competence in B. subtilis .................................................................. 35212.5.3 White–Opaque Switching in C. albicans ........................................................ 354
12.6 Perspectives and Implications of Bistability ................................................................. 356Highly Recommended Readings .............................................................................................. 358References ................................................................................................................................ 359
340 W.K. Smits et al.
12.1 Phenotypic Variation
The potential of bacteria to thrive in a variety of ecological niches strongly depends on their genetic content. However, within these niches, environmental conditions such as pH, salinity, temperature, and the availability of nutrients can strongly fluc-tuate. In addition, bacteria may be faced with interspecies or intraspecies competi-tion in the form of, for instance, antimicrobial peptides.
To survive these kinds of stresses, bacteria adapt their genetic programs, result-ing in change of phenotypes to meet the fluctuating environmental conditions. Environmental signals are commonly interpreted by cells via a system of sensor and regulator proteins that result in a change in the transcription profiles (transcrip-tome) and/or protein expression patterns (proteome) of the cells (other sensing sys-tems also exist in bacterial cells; see Chaps. 7, 8, and 9 for details on some of these systems). These adaptive changes generally last for the duration of the stress, but in some cases may persist for many generations.
Microbial research has traditionally considered bacterial cultures as homoge-neous, because they are a clonal population derived from a common ancestor. Before single-cell analyses of bacterial populations, many heterogeneous proc-esses may have gone undetected or may have been discarded as an artifact of the methods used. Single-cell analyses (see Sect. 12.2) show that cells in a culture demonstrate a remarkable level of variation, which roughly can be divided into two categories.
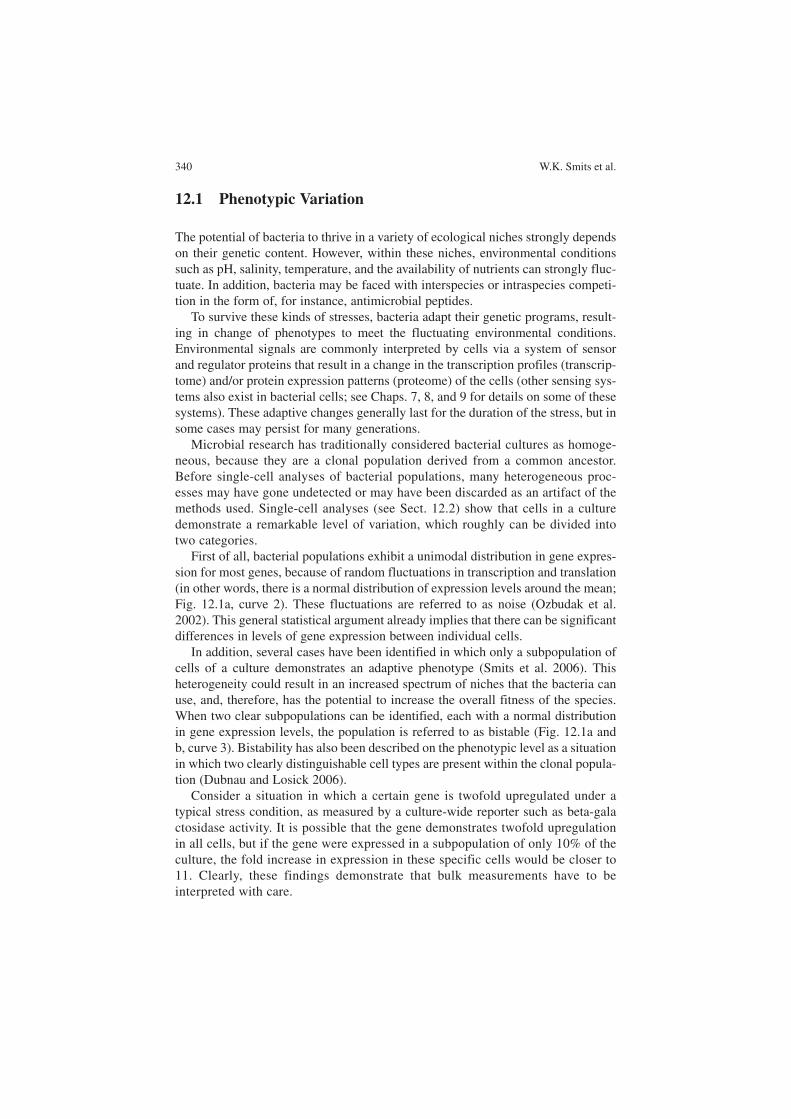
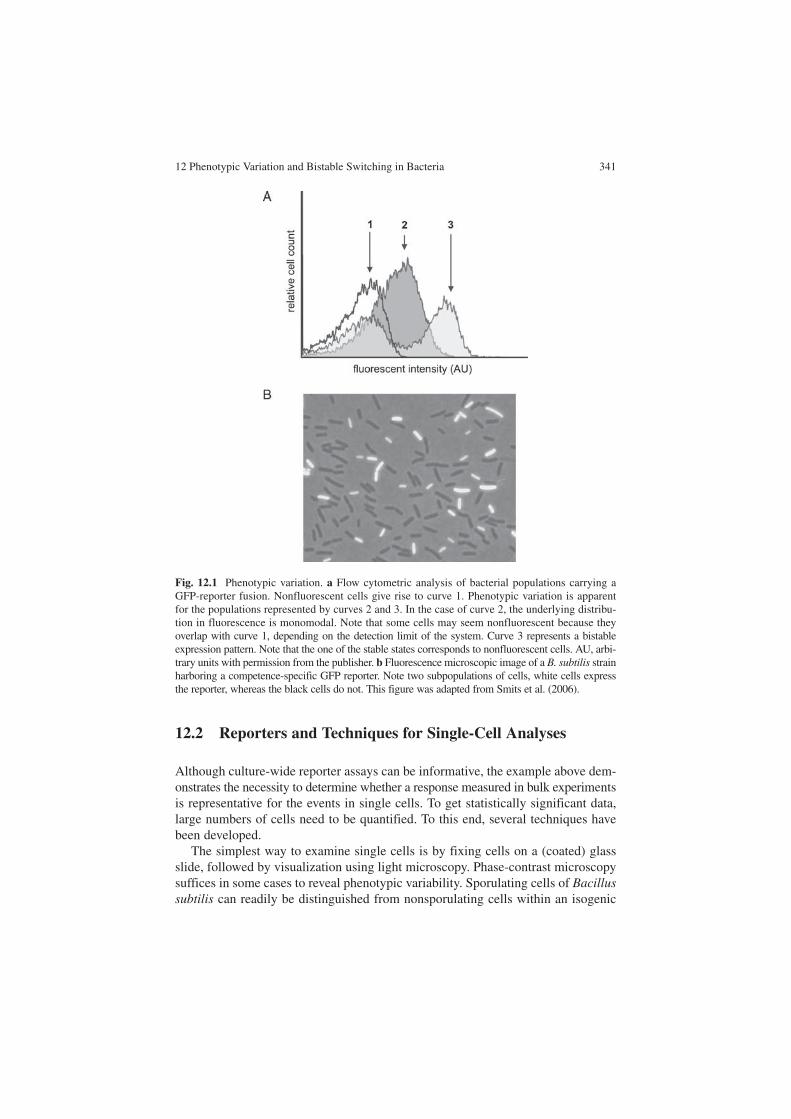
First of all, bacterial populations exhibit a unimodal distribution in gene expres-sion for most genes, because of random fluctuations in transcription and translation (in other words, there is a normal distribution of expression levels around the mean; Fig. 12.1a, curve 2). These fluctuations are referred to as noise (Ozbudak et al. 2002). This general statistical argument already implies that there can be significant differences in levels of gene expression between individual cells.
In addition, several cases have been identified in which only a subpopulation of cells of a culture demonstrates an adaptive phenotype (Smits et al. 2006). This heterogeneity could result in an increased spectrum of niches that the bacteria can use, and, therefore, has the potential to increase the overall fitness of the species. When two clear subpopulations can be identified, each with a normal distribution in gene expression levels, the population is referred to as bistable (Fig. 12.1a and b, curve 3). Bistability has also been described on the phenotypic level as a situation in which two clearly distinguishable cell types are present within the clonal popula-tion (Dubnau and Losick 2006).
Consider a situation in which a certain gene is twofold upregulated under a typical stress condition, as measured by a culture-wide reporter such as beta-galactosidase activity. It is possible that the gene demonstrates twofold upregulation in all cells, but if the gene were expressed in a subpopulation of only 10% of the culture, the fold increase in expression in these specific cells would be closer to 11. Clearly, these findings demonstrate that bulk measurements have to be interpreted with care.
12 Phenotypic Variation and Bistable Switching in Bacteria 341
12.2 Reporters and Techniques for Single-Cell Analyses
Although culture-wide reporter assays can be informative, the example above dem-onstrates the necessity to determine whether a response measured in bulk experimentsis representative for the events in single cells. To get statistically significant data, large numbers of cells need to be quantified. To this end, several techniques have been developed.
The simplest way to examine single cells is by fixing cells on a (coated) glass slide, followed by visualization using light microscopy. Phase-contrast microscopy suffices in some cases to reveal phenotypic variability. Sporulating cells of Bacillussubtilis can readily be distinguished from nonsporulating cells within an isogenic
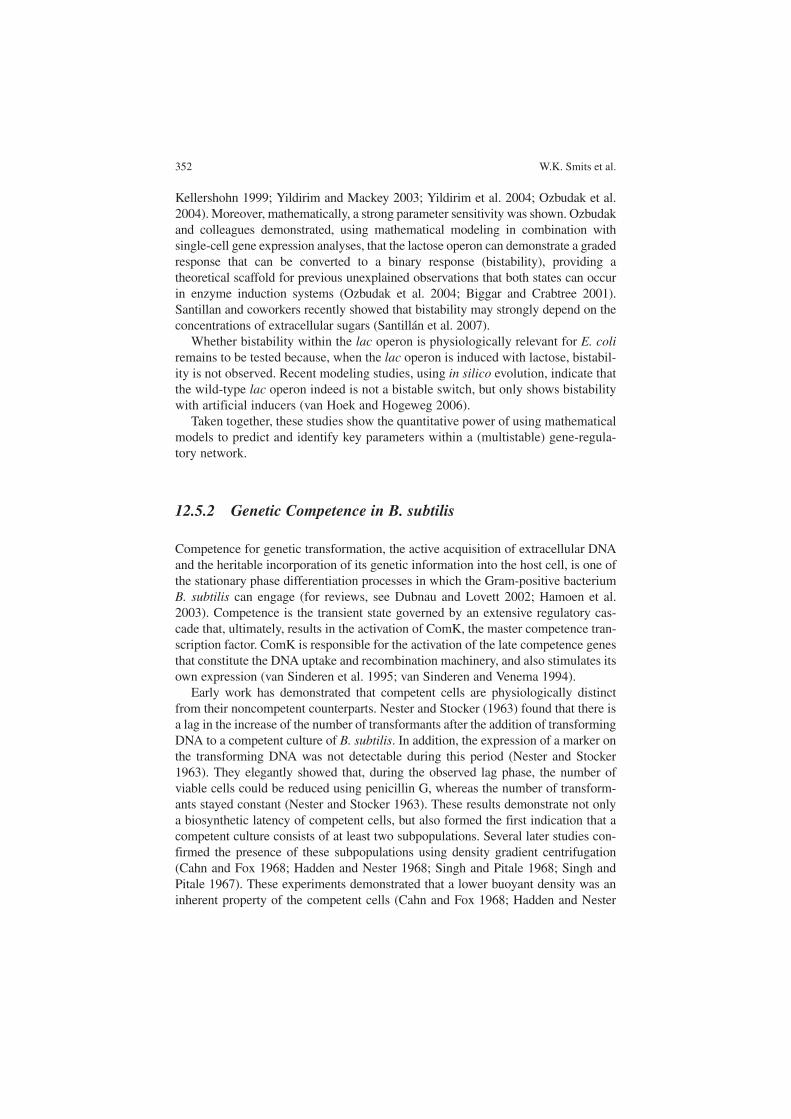
Fig. 12.1 Phenotypic variation. a Flow cytometric analysis of bacterial populations carrying a GFP-reporter fusion. Nonfluorescent cells give rise to curve 1. Phenotypic variation is apparent for the populations represented by curves 2 and 3. In the case of curve 2, the underlying distribu-tion in fluorescence is monomodal. Note that some cells may seem nonfluorescent because they overlap with curve 1, depending on the detection limit of the system. Curve 3 represents a bistable expression pattern. Note that the one of the stable states corresponds to nonfluorescent cells. AU, arbi-trary units with permission from the publisher. b Fluorescence microscopic image of a B. subtilis strain harboring a competence-specific GFP reporter. Note two subpopulations of cells, white cells express the reporter, whereas the black cells do not. This figure was adapted from Smits et al. (2006).
342 W.K. Smits et al.
culture by normal phase-contrast microscopy because sporulating cells contain a readily visible endospore during the later stages of this process, whereas nonsporu-lating cells do not. However, many subpopulations are not characterized by pheno-types that are distinguishable by phase-contrast microscopy.
As a result, most single-cell reporters rely on fluorescence or luminescence (see Davey and Kell 1996; Kasten 1993). Fluorescence is a physicochemical property of certain molecules and compounds, and can be used to visualize individual bio-chemical, genetic, or physiological properties (Barer and Harwood 1999; Joux and Lebaron 2000). With the use of specific filters coupled to a light source, such as a mercury or xenon lamp, excitation of fluorophores and detection of fluorescent signals at certain wavelengths can be performed. Microscopic images may be cap-tured using CCD cameras. One of the most powerful ways to examine a large number of cells on their single-cell properties is by flow cytometry. In a flow cytometer, cells pass an intense light source (a laser) one by one, and the data on fluorescence and scatter (which depends on, for instance, particle size) is collected. Depending on the flow cytometer and the settings used, signals from more than 1,000 individual cells per second can easily be determined, making it an extremely valuable technique for time series analyses. Because of its sensitivity and resolution, this is the preferred method to establish whether a heterogeneous culture demon-strates a monomodal or bimodal (bistable) distribution in gene expression levels (see Sect. 12.5.2 and Chung et al. 1995; Smits et al. 2005; Veening et al. 2005).
A battery of fluorescent dyes is currently available to visualize biochemical or physiological properties of cells that may differ from cell to cell (see Brehm-Stecher and Johnson 2004). These dyes include substances that nonspecifically stain DNA (e.g., DAPI, ethidium bromide, and Hoechst), membranes/phospholip-ids (e.g., FM4-64 and Nile-red) or the cell wall (e.g., Gram staining or fluorescently labeled vancomycin) (Daniel and Errington 2003). In addition, a number of probes can be used to measure individual intracellular pH or redox state of a cell (Nebe-von-Caron et al. 2000; Vives-Rego et al. 2000; Haugland 2002). Using Nile-Red and SYTO-13 stains, phenotypic variability with respect to polyhydroxyalkanoates has been reported for Pseudomonas aeruginosa (Vidal-Mas et al. 2001).
Fluorogenic substrates for the classic beta-galactosidase reporter gene, for instance, have successfully been used to demonstrate heterogeneity in the expres-sion of a developmental regulator in Myxococcus xanthus (Russo-Marie et al. 1993), as well as to show the characteristics of sporulation bistability in B. subtilis(Chung et al. 1995; Chung and Stephanopoulos 1995). In addition, they have been used to study the dynamics of gene expression in a single cell using a microfluidic device (Cai et al. 2006).
When conjugated to a fluorescent dye, macromolecules such as antibodies or nucleic acids can be used to visualize protein localization (immunofluorescence) or the presence of specific RNA or DNA types (fluorescence in situ hybridization [FISH]) (for reviews, see Amann et al. 1995; Davey and Kell 1996; Moter and Gobel 2000; Amann and Ludwig 2000; Brehm-Stecher and Johnson 2004). In short, labeled probes are introduced to the cell, where they bind to target sequences. The high sen-sitivity of the method makes it possible to detect single molecules, and this method
12 Phenotypic Variation and Bistable Switching in Bacteria 343
has been used to demonstrate transcriptional bursting in E. coli (Golding and Cox 2004; Golding et al. 2005). Alternatively, in situ reverse transcriptase (RT) polymerase chain reaction (PCR) can be used to amplify the signals in a quantitative manner. Using this technique, nongenetic heterogeneity was demonstrated for Salmonella(Tolker-Nielsen et al. 1998) and Methanosarcina (Lange et al. 2000), for instance. It has to be noted that RT-PCR can also be used to demonstrate genetic differences between single cells, as, for instance, in the case of phase-variable phenotypes.
All of the fluorescence-based techniques described above rely on the introduc-tion of a probe into the cells, which might pose problems. A major breakthrough in molecular biology has been the use of fluorescent proteins in vivo. The green fluo-rescent protein (GFP), which was originally isolated from the jellyfish Aequorea victoria, offers a noninvasive reporter for gene activity and is now commonly used by microbiologists (Tsien 1998; Southward and Surette 2002).
Modified variants of the protein with distinct excitation and emission spectra have been developed for use in bacterial research (Shaner et al. 2005; Shaner et al. 2004), allowing the visualization of more than one protein or promoter activity simultaneously.
Using GFP and its spectral derivatives to study transcriptional regulation, phenotypic variation was demonstrated, for instance, for the expression of the structural gen e for colicin K in E. coli, and genomic islands in Salmonella(Hautefort et al. 2003) and Pseudomonas (Sentchilo et al. 2003a; Sentchilo et al. 2003b). In addition, it was shown that an exponentially growing culture of B. subtilisconsists of two subpopulations that differ in the expression of swarming/motility genes (Kearns and Losick 2005).
It has to be noted that when the gfp gene is translationally coupled to a gene of interest, it can be used to ascertain the subcellular localization of the encoded protein. Such studies have led to many groundbreaking discoveries in bacteria, including the presence of a so-called “replisome” (Lemon and Grossman 1998) and the presence of a dynamic bacterial cytoskeleton (Carballido-Lopez 2006). Additionally, they may reveal another layer of complexity with respect to phenotypic heterogeneity, because the subcellular localization of certain proteins may differ between subpopulations. It was shown, for instance, that RecA localizes to the polar competence machinery of B. subtilis cells, whereas it is associated in nucleoids in noncompetent cells (Kidane and Graumann 2005). Because competence occurs in a subpopulation of cells (see Sect. 12.5.2), the localization pattern of RecA is similarly heterogeneous.
Bioluminescence reporters based on the lux system, although in principle suita-ble for single-cell analyses, are less frequently used because the resolution is infe-rior to fluorescence. Their primary applications are in biosensors, host–pathogen interaction, and the study of circadian rhythms (Greer III and Szalay 2002).
Some cellular characteristics are more easily assessed by alternative techniques. The study of surface properties of single cells is greatly facilitated by microcapillaryelectrophoresis (reviewed in Brehm-Stecher and Johnson 2004). Surface properties may depend on cell age, cell cycle status, or cell type, and are, therefore, of interest to a broad field of researchers (Glynn Jr et al. 1998). Using capillary electrophoresis,it was shown that cultures of Enterococcus faecalis demonstrate heterogeneity in
344 W.K. Smits et al.
surface charge, which affects adhesion and biofilm formation (van Merode et al. 2006a; van Merode et al. 2006b).
Finally, cell density centrifugation deserves to be mentioned. Although technically not a single-cell technique, subpopulations with discernible buoyant density can be separated and analyzed after recovery. This type of analysis has revealed subpopula-tions during growth of E. coli (Makinoshima et al. 2002) and Vibrio parahaemolyti-cus (Nishino et al. 2003), and genetic competence of B. subtilis (Hadden and Nester 1968; Cahn and Fox 1968; Dean and Douthit 1974; Haijema et al. 2001).
12.3 Sources of Phenotypic Variation
The origins of different cell types in a culture can be as diverse as the phenotypes the cells display, and can be both genetic and nongenetic in nature.
In the stationary-growth phase, bacteria can display adaptive mutagenesis.Several genetic determinants for this process have been identified, such as DNA duplications and the expression of genes involved in DNA metabolism and genome integrity. When the mutations affect certain bacterial properties, they may lead to a growth advantage of certain cells over others (Finkel and Kolter 1999). As a result, one phenotype may overgrow the other, potentially leading to the dynamic coexist-ence of multiple phenotypes.
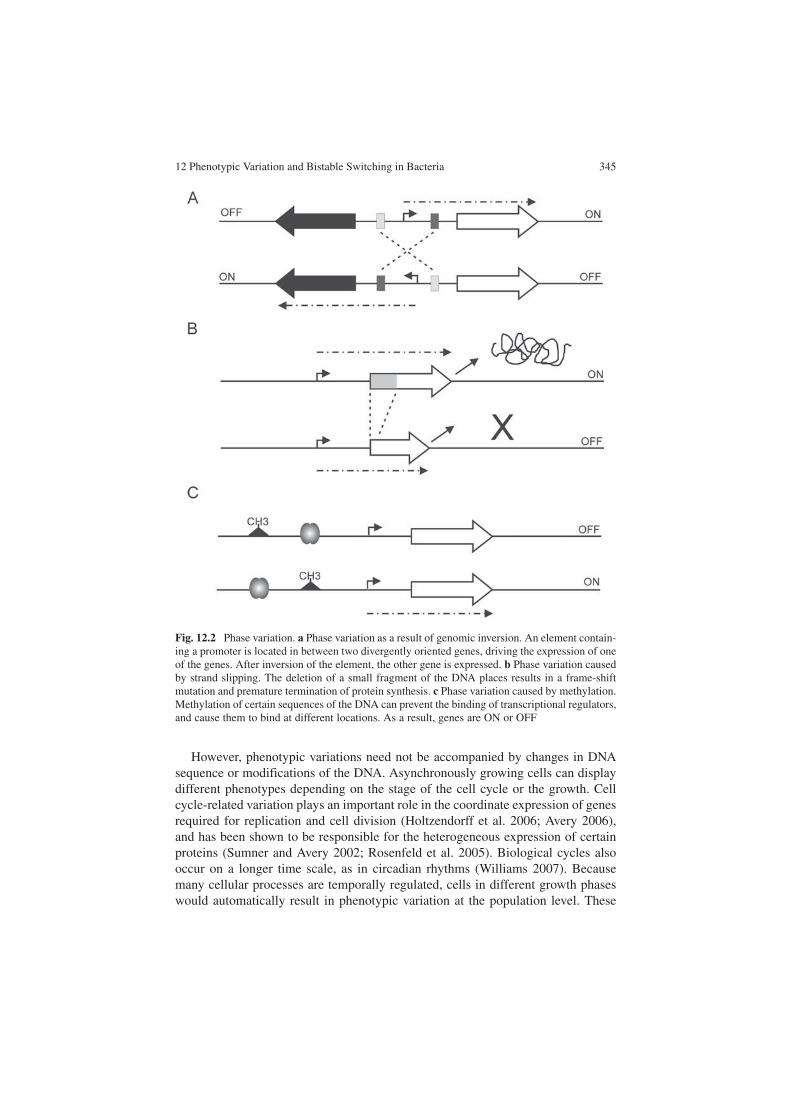
Another well-characterized mechanism to generate phenotypic variation is phase variation (for review, see Henderson et al. 1999). Phase-variation phenotypes show a binary pattern, in which genes are expressed (ON) or not expressed (OFF). Transitions between the two states are random, and occur at a relatively high frequency (>10−5 per generation). Phase variation resembles antigenic variation of pathogenic bacteria in many aspects, although these are distinct processes. The best-characterized examples of phase variation involve cellular appendages such as fimbriae and flagellae. Phase variation frequently depends on genetic changes, such as genomic inversions or strand-slippage mechanisms. For instance, the phase-variableexpression of both type I fimbriae in E. coli (Abraham et al. 1985) and flagellae in Salmonella (Zieg et al. 1977) involve the inversion of a DNA element (Fig. 12.2a), whereas the expression of certain outer membrane proteins in Neisseria (reviewed in Meyer et al. 1990) and virulence factors in Bortedella (Stibitz et al. 1989) is determined by frameshift mutations as the result of strand slippage (Fig. 12.2b).
In addition to genetic changes, the origin of phenotypic variation may reside in modifications of the DNA (Fig. 12.2c). These changes are epigenetic in nature, because they do not involve a change in DNA sequence, yet the pheno-types associated with the modification can be inherited by daughter cells after division. For instance, the phase-variable expression of the pap operon in E. coliinvolves methylation of two GATC sequences by the Dam methylase (van der Woude et al. 1996). In this case, the methylation pattern of the DNA affects the position of binding for a transcriptional regulator, resulting in repression or activation of transcription.
12 Phenotypic Variation and Bistable Switching in Bacteria 345
However, phenotypic variations need not be accompanied by changes in DNA sequence or modifications of the DNA. Asynchronously growing cells can display different phenotypes depending on the stage of the cell cycle or the growth. Cell cycle-related variation plays an important role in the coordinate expression of genes required for replication and cell division (Holtzendorff et al. 2006; Avery 2006), and has been shown to be responsible for the heterogeneous expression of certain proteins (Sumner and Avery 2002; Rosenfeld et al. 2005). Biological cycles also occur on a longer time scale, as in circadian rhythms (Williams 2007). Because many cellular processes are temporally regulated, cells in different growth phases would automatically result in phenotypic variation at the population level. These
Fig. 12.2 Phase variation. a Phase variation as a result of genomic inversion. An element contain-ing a promoter is located in between two divergently oriented genes, driving the expression of one of the genes. After inversion of the element, the other gene is expressed. b Phase variation caused by strand slipping. The deletion of a small fragment of the DNA places results in a frame-shift mutation and premature termination of protein synthesis. c Phase variation caused by methylation. Methylation of certain sequences of the DNA can prevent the binding of transcriptional regulators, and cause them to bind at different locations. As a result, genes are ON or OFF
346 W.K. Smits et al.
forms of phenotypic variation can be distinguished by the synchronization of starter cultures, as well as by correlation with known markers for the cyclic processes.
Cell age can add another level of complexity (Avery 2006). Recently, elegant data were collected suggesting that even symmetrically dividing organisms such as E. colisuffer from aging, because cells with older cell poles show lower growth rates com-pared with cells that have inherited more new poles (Stewart et al. 2005). Although the mechanistic details regarding the role of aging in phenotypic variation are unknown, it implies that cell aging also needs to be taken into account for bacterial research.
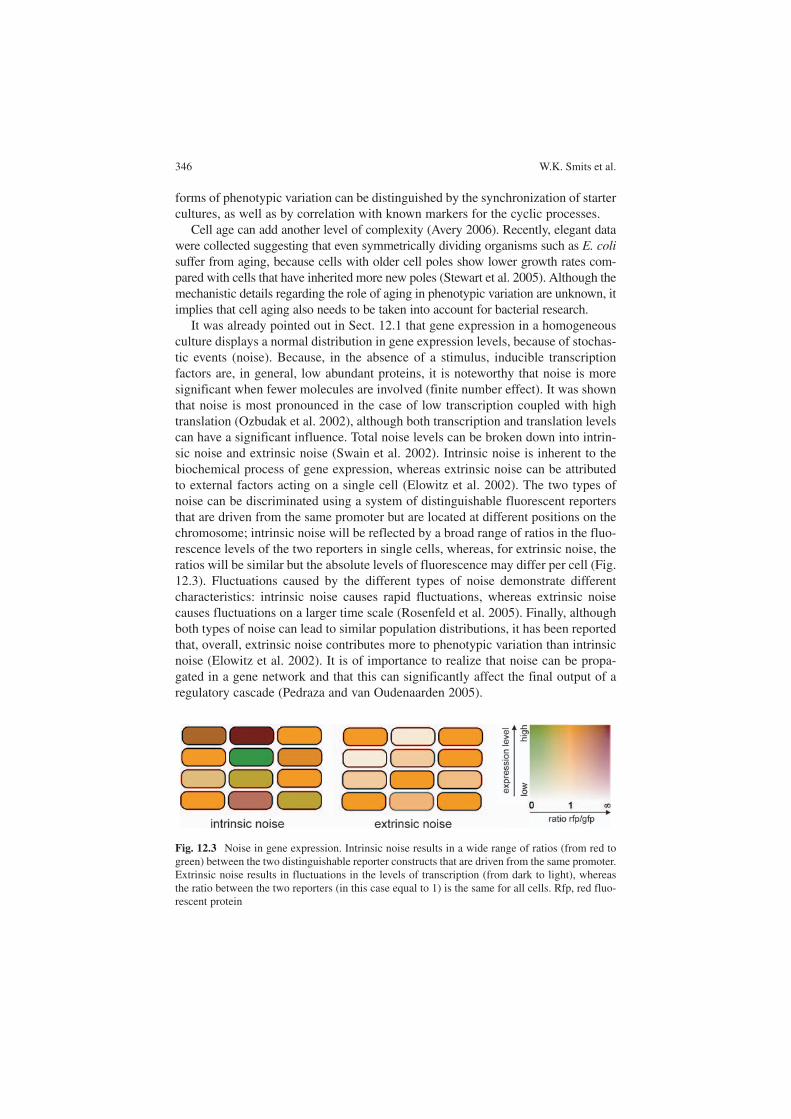
It was already pointed out in Sect. 12.1 that gene expression in a homogeneous culture displays a normal distribution in gene expression levels, because of stochas-tic events (noise). Because, in the absence of a stimulus, inducible transcription factors are, in general, low abundant proteins, it is noteworthy that noise is more significant when fewer molecules are involved (finite number effect). It was shown that noise is most pronounced in the case of low transcription coupled with high translation (Ozbudak et al. 2002), although both transcription and translation levels can have a significant influence. Total noise levels can be broken down into intrin-sic noise and extrinsic noise (Swain et al. 2002). Intrinsic noise is inherent to the biochemical process of gene expression, whereas extrinsic noise can be attributed to external factors acting on a single cell (Elowitz et al. 2002). The two types of noise can be discriminated using a system of distinguishable fluorescent reporters that are driven from the same promoter but are located at different positions on the chromosome; intrinsic noise will be reflected by a broad range of ratios in the fluo-rescence levels of the two reporters in single cells, whereas, for extrinsic noise, the ratios will be similar but the absolute levels of fluorescence may differ per cell (Fig. 12.3). Fluctuations caused by the different types of noise demonstrate different characteristics: intrinsic noise causes rapid fluctuations, whereas extrinsic noise causes fluctuations on a larger time scale (Rosenfeld et al. 2005). Finally, although both types of noise can lead to similar population distributions, it has been reported that, overall, extrinsic noise contributes more to phenotypic variation than intrinsic noise (Elowitz et al. 2002). It is of importance to realize that noise can be propa-gated in a gene network and that this can significantly affect the final output of a regulatory cascade (Pedraza and van Oudenaarden 2005).
Fig. 12.3 Noise in gene expression. Intrinsic noise results in a wide range of ratios (from red to green) between the two distinguishable reporter constructs that are driven from the same promoter. Extrinsic noise results in fluctuations in the levels of transcription (from dark to light), whereas the ratio between the two reporters (in this case equal to 1) is the same for all cells. Rfp, red fluo-rescent protein
12 Phenotypic Variation and Bistable Switching in Bacteria 347
In general, high levels of noise are regarded as detrimental for the fitness of cells. In accordance with this, essential genes were reported to exhibit lower levels of noise than non-essential genes (Fraser et al. 2004). One of the most ubiquitous and efficient ways to control the level of noise in gene expression is the introduction of a negative feedback loop (Becskei and Serrano 2000). By limiting the production as the levels of a certain protein increase, negative autoregulation limits the range over which fluctuations in the level of this protein can occur. In addition to this, the intertwinement of regulatory networks can have the ability to filter noise (Hooshangi et al. 2005).
In specific cases, however, noise is exploited to generate phenotypic variability (Rao et al. 2002, Hasty 2000). For example, it was shown that noise in the regula-tory cascade governing the chemotactic response of E. coli is responsible for behav-ioral variability of individual cells, as measured by the rotational direction of flagella (Korobkova et al. 2004). Importantly, noise can be amplified through the introduction of a positive feedback loop, resulting in bistability (or more universal: feedback-based multistability [FBM]; see Sect. 12.4 and Smits et al. 2006).
12.4 Bistability in Gene Expression
Here, we refer to bistability as the coexistence of two distinct subpopulations of cells in a culture that does not depend on modifications of the DNA. Each of these subpopulations represents a discrete level of gene expression, referred to as a state. If a gene regulatory network can lead to more than a single stable state, it is said to exhibit multistationarity. Thus, multistationarity at the cellular level can result in a bistable (or multistable) bacterial population (Smits et al. 2006). Switching between these states occurs stochastically, and is usually reversible.
As early as the 1960s, it was postulated that feedback regulation might be respon-sible for the stable states observed for all-or-none enzyme induction (Novick and Weiner 1957; Monod and Jacob 1961). Pioneering work of Thomas has highlighted the importance of feedback regulation for multistationarity (Thomas 1978, 1998). Subsequently, the prerequisites for a gene network to generate a multistable output were determined by mathematical modeling and the analysis of artificial gene net-works (Angeli et al. 2004; Ferrell Jr 2002; Friedman et al. 2006; Gardner et al. 2000; Kobayashi et al. 2004; Hasty et al. 2000; Hasty et al. 2002; Isaacs et al. 2003).
If was found that the system needs to exhibit nonlinear kinetics, implying that the response (e.g., the expression of a reporter gene) is not a linear function of the concentration of a regulator (Ferrell Jr 2002). Frequently, this is apparent from the observation of a threshold concentration of the regulator to elicit a response (Chung et al. 1994). For transcriptional regulators, nonlinearity can for instance be observed as a result of the requirement for multimerization, cooperativity in DNA binding, or phosphorylation of certain amino acid residues.
Without the introduction of complicated mathematical models, the effects of single positive feedback can easily be envisaged (Fig. 12.4). In the absence of
348 W.K. Smits et al.
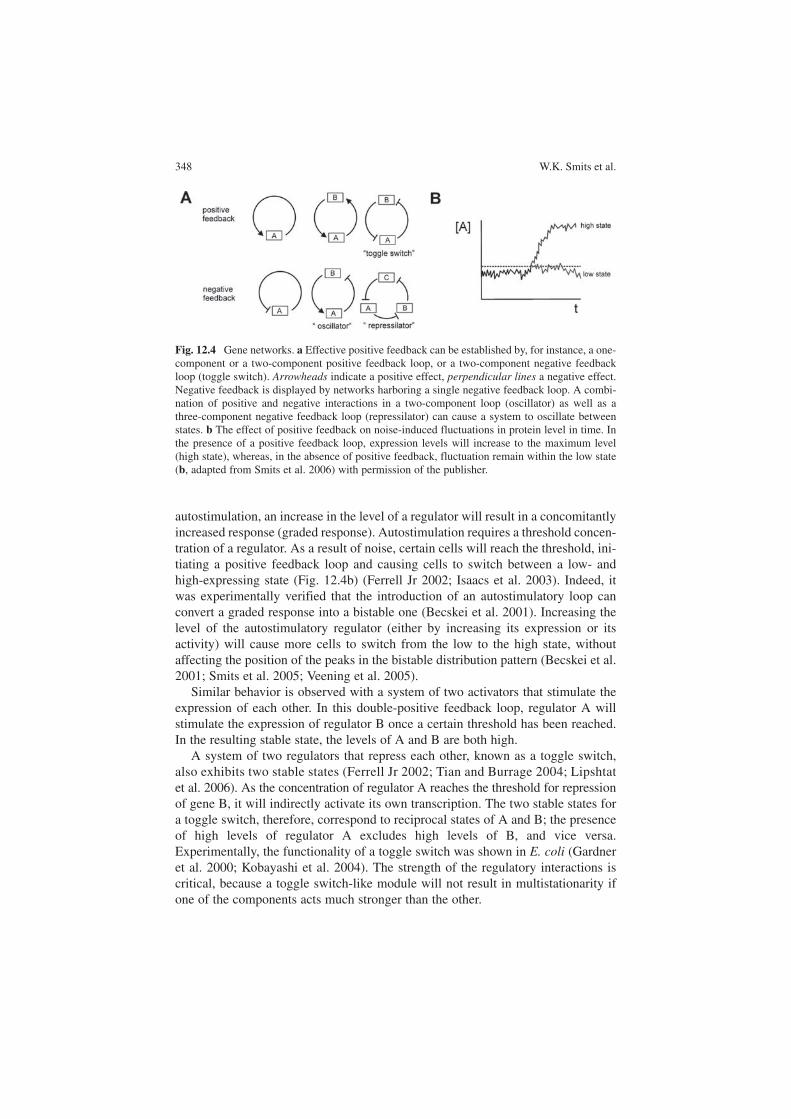
Fig. 12.4 Gene networks. a Effective positive feedback can be established by, for instance, a one-component or a two-component positive feedback loop, or a two-component negative feedback loop (toggle switch). Arrowheads indicate a positive effect, perpendicular lines a negative effect. Negative feedback is displayed by networks harboring a single negative feedback loop. A combi-nation of positive and negative interactions in a two-component loop (oscillator) as well as a three-component negative feedback loop (repressilator) can cause a system to oscillate between states. b The effect of positive feedback on noise-induced fluctuations in protein level in time. In the presence of a positive feedback loop, expression levels will increase to the maximum level (high state), whereas, in the absence of positive feedback, fluctuation remain within the low state (b, adapted from Smits et al. 2006) with permission of the publisher.
autostimulation, an increase in the level of a regulator will result in a concomitantly increased response (graded response). Autostimulation requires a threshold concen-tration of a regulator. As a result of noise, certain cells will reach the threshold, ini-tiating a positive feedback loop and causing cells to switch between a low- and high-expressing state (Fig. 12.4b) (Ferrell Jr 2002; Isaacs et al. 2003). Indeed, it was experimentally verified that the introduction of an autostimulatory loop can convert a graded response into a bistable one (Becskei et al. 2001). Increasing the level of the autostimulatory regulator (either by increasing its expression or its activity) will cause more cells to switch from the low to the high state, without affecting the position of the peaks in the bistable distribution pattern (Becskei et al. 2001; Smits et al. 2005; Veening et al. 2005).
Similar behavior is observed with a system of two activators that stimulate the expression of each other. In this double-positive feedback loop, regulator A will stimulate the expression of regulator B once a certain threshold has been reached. In the resulting stable state, the levels of A and B are both high.
A system of two regulators that repress each other, known as a toggle switch, also exhibits two stable states (Ferrell Jr 2002; Tian and Burrage 2004; Lipshtat et al. 2006). As the concentration of regulator A reaches the threshold for repressionof gene B, it will indirectly activate its own transcription. The two stable states for a toggle switch, therefore, correspond to reciprocal states of A and B; the presence of high levels of regulator A excludes high levels of B, and vice versa. Experimentally, the functionality of a toggle switch was shown in E. coli (Gardner et al. 2000; Kobayashi et al. 2004). The strength of the regulatory interactions is critical, because a toggle switch-like module will not result in multistationarity if one of the components acts much stronger than the other.
12 Phenotypic Variation and Bistable Switching in Bacteria 349
Importantly, only gene networks that demonstrate net positive feedback (i.e., including an even number of negative feedback interactions and/or any number of positive feedback loops) seem to be capable of causing multistationarity (Fig. 12.4b) (Angeli et al. 2004). As pointed out before, single-negative feedback reduces noise levels, and leads to homeostatic behavior (Becskei and Serrano 2000). In addition, a combination of a positive and a negative interaction is capable of induc-ing rhythmic oscillations. This type of regulation is a key component of both cell cycle regulation and circadian rhythms (Holtzendorff et al. 2006; Williams 2007). Finally, it was shown that a three-component negative feedback loop (repressilator) can also cause oscillatory behavior (Elowitz and Leibler 2000).
Although FBM seems to be the predominant form of bistability, one has to real-ize that the presence of positive feedback is no guarantee for multistationarity (Ferrell Jr 2002; Acar et al. 2005), and it is possible that systems exhibit bistability only within a certain range of parameters, such as inducer concentrations (Santillán et al. 2007, Ozbudak et al. 2004). In addition, mechanisms other than transcriptionalautoregulation, such as multisite phosphorylation (Lisman 1985; Ferrell Jr 1996; Ortega et al. 2006), may be capable of inducing a bistable response.
12.5 Examples of “Natural” Multistability
12.5.1 Lactose Use in E. coli
The classic example of bistability or multistability is that of the regulation of the genes responsible for lactose use in E. coli (Novick and Weiner 1957). In fact, regu-lation of the lac operon was the first genetic regulatory mechanism to be elucidated and is often used as the canonical example of prokaryotic gene regulation (Jacob and Monod 1961).
As a result of many years of research, the molecular mechanisms involved in the regulation of lactose use are now well known (for reviews, see Müller-Hill 1996; Laurent and Kellershohn 1999; Smits et al. 2006).
The lac operon comprises three genes that are required for the uptake and catab-olism of lactose: lacZ, encoding β-galactosidase; lacY, encoding lactose permease; and lacA, encoding a transacetylase.
The expression of the lac operon is negatively regulated by the LacI repressor, which is inhibited by allolactose. This molecule is an isomer of lactose, converted from intracellular lactose by the constitutively expressed β-galactosidase (β-galactosidase [LacZ] enzyme in an alternative reaction to the hydrolytic reaction).LacI is also positively regulated by the cyclic-AMP receptor protein (CRP), which is activated under low sugar availability. High levels of the sugar lactose, therefore, inhibit the LacI repressor by a dual mechanism. The system demonstrates a poten-tial positive autostimulatory loop, because the lac operon includes the structural gene for the permease for lactose uptake. However, β-galactosidase can metabolize both lactose and allolactose, interrupting the positive feedback loop (Fig. 12.5a),
350 W.K. Smits et al.
because of which, it is unclear whether the system is capable of demonstrating bistability under natural conditions (van Hoek and Hogeweg 2006). Because of the detail of characterization, however, it makes a good model system to investigate and analyze bistability as it may occur for other processes.
In 1957, Novick and Weiner showed that when a population of E. coli is induced at low levels with a gratuitous inducer (i.e., a molecule that cannot be metabolized), reculturing of single cells results in populations that either give high or low lacexpression. This phenomenon was called all-or-none enzyme induction (Novick and Weiner 1957), and is indicative of the presence of two coexisting subpopula-tions of cells in a culture (one induced for lac expression and one not induced). These subpopulations can occur at concentrations of inducer near the threshold at which stochastic fluctuations can cause part of the cells to initiate an autostimula-tory loop. Further characterization of this system by Cohn and Horibata revealed that the fraction of cells that highly expresses the lactose use genes depends on the presence of specific sugars in the growth medium and on the history of the inocu-lum (Cohn and Horibata 1959a; Cohn and Horibata 1959b). Already in 1961, Monod and Jacob hypothesized that interactions between components of the regu-latory network governing lactose use might explain the multistable behavior, by stating “[Moreover,] it is obvious from the analyses of these [regulatory, red.] mechanisms that their known elements could be connected into a wide variety of “circuits”, endowed with any desired degree of stability.”
Switching from one state to the other (from “ON” to “OFF” or vice versa) requires either an induction or a relief of inducer greater than that required for the reverse
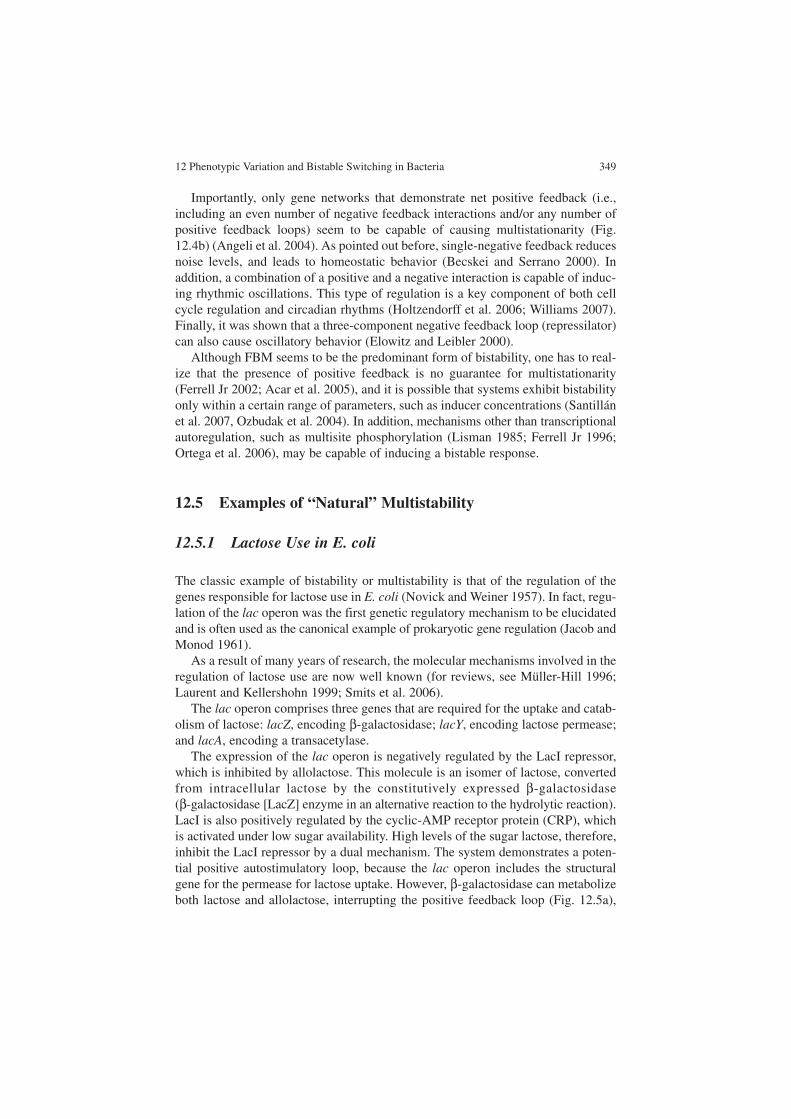
Fig. 12.5 Natural bistable systems. a Simplified scheme of the regulatory network of lactose use in E. coli. A gratuitous inducer, IPTG, is taken up by the permease LacY and inhibits the activity of the repressor LacI. As a result, transcription of the entire lac operon, including the structural gene encoding the permease, is activated, establishing a positive feedback loop. The transcription of the lac operon is additionally modified by the CRP protein, which can act as an activator or repressor. b The core of the competence regulatory network in B. subtilis. ComK stimulates its own expres-sion, and forms a putative toggle switch with Rok. Experiments have established that only ComK autoregulation is critical for the bistable expres-sion pattern and that the fraction of competent cells in a rok mutant is increased. c In C. albicans,the switch between white and opaque states depends on autostimulation of WOR-1. Switching depends on mating type: a/α cells cannot undergo switching because of repression or WOR-1 tran-scription. The gene demonstrates a basal level of transcription in a or α cells, which could lead to switching between the white and opaque states
12 Phenotypic Variation and Bistable Switching in Bacteria 351
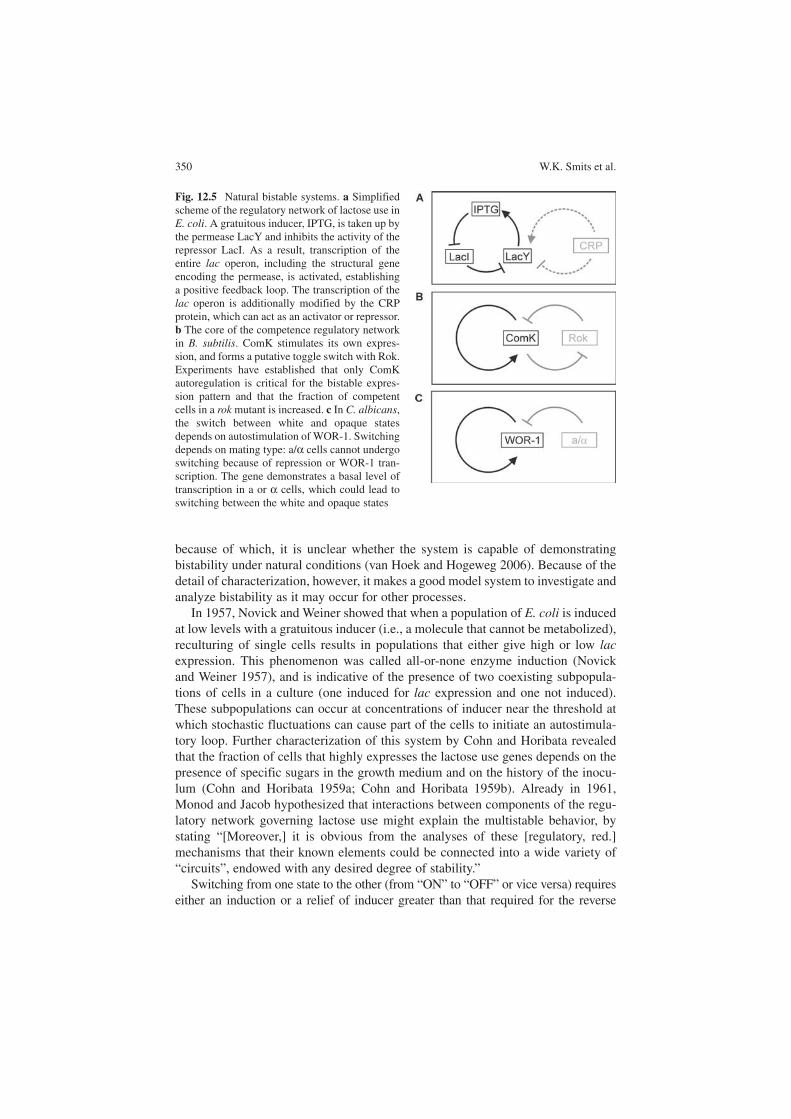
transition. This phenomenon, called hysteresis (Fig. 12.6), is responsible for the observed epigenetic inheritance of the expression state over many generations (Novick and Weiner 1957; Cohn and Horibata 1959a; Cohn and Horibata 1959b). Such an unequal force essentially acts as a buffer, making the switch robust to noise, and mini-mizing accidental switching of the system. Under certain conditions, however, switch-ing back from an ON state to an OFF state may still be possible. Hysteresis is not only observed for biological, but also for physical systems exhibiting bistability. In Fig. 12.6, at concentration α of inducer, the system can be either in an ON or OFF state, depending on the starting state. The state of a hysteretic system, thus, depends on its recent history. A neat analogy that describes memory by hysteresis was sketched in a review by Casadesus and D’Ari (2002). Microbiological agar is a polymer solution that at 60°C can be either liquid or solid. If the agar is melted by heating it to 100°C and then cooled down to 60°C, it will remain liquid, whereas, if solid agar at room temperature is warmed up to 60°C, it will remain solid. Thus, the state of agar at 60°C is a memory of its history. The origin of hysteresis can, for instance, lie in the stability of component within a gene-regulatory network. The hysteretic behavior of the lacoperon, for instance, is a consequence of the abundance and stability of the LacY per-mease (Ozbudak et al. 2004). When little permease is present, the concentration of IPTG required to trigger the autostimulatory loop is high. In contrast, when the level of permease is high (mostly corresponding to an already induced state), cells need little IPTG to maintain high levels of lac expression.
Modeling of systems and networks has a long tradition in, for instance, engineer-ing and physics, but did not become common for biological sciences until recently. This can be attributed to the relative complexity of biological systems and the inabil-ity to quantitatively analyze the data obtained from biochemical experiments. However, with the development of new experimental methods, such as single-cell analysis using fluorescent reporters, and with the increase in computational power, accurate modeling of biological systems has become possible. As a result, a number of studies combine single-cell analyses with mathematical modeling to describe the behavior of the lac operon at both the molecular and population level.
Modeling using (nonlinear) differential equations enabled dynamic simulations of the lactose use network and demonstrated that bistable hysteretic gene expression can be expected on the basis of reasonable biological parameters and indicated the impor-tance of the positive feedback loop in establishing multistability (Laurent and
Fig. 12.6 Schematic depiction of hysteresis. Changes in concentration of regulator are indi-cated by arrows. Depending on the starting state of the system, a cell can be in an ON (grey) or OFF state (white) at intermediate concentrations of the regulator (such as α)
352 W.K. Smits et al.
Kellershohn 1999; Yildirim and Mackey 2003; Yildirim et al. 2004; Ozbudak et al. 2004). Moreover, mathematically, a strong parameter sensitivity was shown. Ozbudak and colleagues demonstrated, using mathematical modeling in combination with single-cell gene expression analyses, that the lactose operon can demonstrate a graded response that can be converted to a binary response (bistability), providing a theoretical scaffold for previous unexplained observations that both states can occur in enzyme induction systems (Ozbudak et al. 2004; Biggar and Crabtree 2001). Santillan and coworkers recently showed that bistability may strongly depend on the concentrations of extracellular sugars (Santillán et al. 2007).
Whether bistability within the lac operon is physiologically relevant for E. coliremains to be tested because, when the lac operon is induced with lactose, bistabil-ity is not observed. Recent modeling studies, using in silico evolution, indicate that the wild-type lac operon indeed is not a bistable switch, but only shows bistability with artificial inducers (van Hoek and Hogeweg 2006).
Taken together, these studies show the quantitative power of using mathematical models to predict and identify key parameters within a (multistable) gene-regula-tory network.
12.5.2 Genetic Competence in B. subtilis
Competence for genetic transformation, the active acquisition of extracellular DNA and the heritable incorporation of its genetic information into the host cell, is one of the stationary phase differentiation processes in which the Gram-positive bacterium B. subtilis can engage (for reviews, see Dubnau and Lovett 2002; Hamoen et al. 2003). Competence is the transient state governed by an extensive regulatory cas-cade that, ultimately, results in the activation of ComK, the master competence tran-scription factor. ComK is responsible for the activation of the late competence genes that constitute the DNA uptake and recombination machinery, and also stimulates its own expression (van Sinderen et al. 1995; van Sinderen and Venema 1994).
Early work has demonstrated that competent cells are physiologically distinct from their noncompetent counterparts. Nester and Stocker (1963) found that there is a lag in the increase of the number of transformants after the addition of transforming DNA to a competent culture of B. subtilis. In addition, the expression of a marker on the transforming DNA was not detectable during this period (Nester and Stocker 1963). They elegantly showed that, during the observed lag phase, the number of viable cells could be reduced using penicillin G, whereas the number of transform-ants stayed constant (Nester and Stocker 1963). These results demonstrate not only a biosynthetic latency of competent cells, but also formed the first indication that a competent culture consists of at least two subpopulations. Several later studies con-firmed the presence of these subpopulations using density gradient centrifugation (Cahn and Fox 1968; Hadden and Nester 1968; Singh and Pitale 1968; Singh and Pitale 1967). These experiments demonstrated that a lower buoyant density was an inherent property of the competent cells (Cahn and Fox 1968; Hadden and Nester
12 Phenotypic Variation and Bistable Switching in Bacteria 353
1968; Dooley et al. 1971) and did not originate from or require the uptake of DNA. On the basis of density centrifugation, as well as transformation experiments using nonlinked marker genes, it was estimated that competent cells form approximately 10% of the total population (Singh and Pitale 1968; Singh and Pitale 1967; Hadden and Nester 1968; Cahn and Fox 1968). Mutagenesis of B. subtilis using a transposon that carries a promoterless copy of the reporter gene, lacZ, revealed that many genes whose deletion results in a transformation deficiency when disrupted are preferen-tially expressed in the band with a lower buoyant density (Albano et al. 1987; Hahn et al. 1987). In addition, the separation of competent and noncompetent cells was found to depend on the first open reading frame of the comG operon (Albano et al. 1987; Albano et al. 1989; Hahn et al. 1987; Albano and Dubnau 1989). To date, ComK is the only known regulator of comG expression (Hamoen et al. 1998; Susanna et al. 2004), and, indeed, the heterogeneity of competence could be traced back to comK transcription. Hahn and coworkers found that comK-lacZ activity was still associated with competent cells, whereas the expression of a gene acting upstream of ComK could be detected in both the light and heavy band of cells sepa-rated on a density gradient (Hahn et al. 1994). It was found that 5 to 10% of the cells in a wild-type culture express comK-gfp (Haijema et al. 2001), which was consistent with previous estimates (Singh and Pitale 1968; Hadden and Nester 1968; Cahn and Fox 1968). Two other important observations were made. First, the presence of the product of a late competence gene, comEA, was always found to coincide with comKexpression. Second, it became clear that there are little or no intermediate levels of ComK–GFP fluorescence. This is consistent with the presence of two distinct bands, rather then a smear, in the density centrifugation experiments. When the fluorescence from a ComK-dependent gfp reporter in individual cells is analyzed in a quantitative manner, the resultant curve shows a bimodal distribution indicative of a bistable process (Fig. 12.1).
Recently, the origin of this bistability was experimentally addressed. The regula-tory network governing competence development comprises two structural mod-ules that could cause bistability in comK expression (Figs. 12.4a and 12.5b). First, ComK stimulates its own expression by directly binding as a tetramer to its own promoter region (van Sinderen and Venema 1994; Hamoen et al. 1998). As such, it forms a single positive feedback loop. Second, ComK seems to be able to form a toggle switch with a repressor of the comK gene, rok (Hoa et al. 2002). However, on the basis of two independent studies, it was found that ComK autostimulation is the critical determinant for the bistable expression pattern. Smits and coworkers (2005) demonstrated that bistability is still observed in a strain devoid of all other levels of regulation except autostimulation, and competence is still initiated in a bistable manner. In addition, it was reported that replacement of the native copy of comK with an inducible copy of the gene results in a graded response that depends on the level of induction (Smits et al. 2005; Maamar and Dubnau 2005). Although these experiments show that ComK autostimulation is indispensable for the bista-bility of competence, they do not exclude a putative ComK–Rok toggle switch (Fig. 12.5b), because the manipulations described above would also affect such a module. Maamar and Dubnau (2005) addressed this issue by introducing a rok
354 W.K. Smits et al.
mutation in the strain with the inducible ComK. A bistable gene expression pattern was observed both the presence and absence of rok, but only in the presence of ComK autostimulation. Together, these data show that competence is initiated in a bistable manner, depending on ComK autostimulation.
Competence, however, is a transient differentiation process (Hadden and Nester 1968; Nester and Stocker 1963; Dubnau 1993), and it is not known how the reduc-tion in cellular ComK levels, necessary for the escape from the competent state, is brought about. At least partially, it was found to rely on an unexplained reduction of comK transcription (Leisner et al 2007; Maamar et al 2007). An interesting alter-native hypothesis was recently put forward, based on time-lapse microscopy (Suel et al. 2006). The authors showed that the transient differentiation observed in com-petence development resembles an excitable gene regulatory network and that such characteristics could be explained by a slow-acting negative feedback loop in com-bination with fast-acting positive autoregulation by ComK. A ComK-dependent negative feedback loop might exist (Hahn et al. 1994; Smits et al 2007), and it pro-vides an attractive hypothesis for the transience of competence. However, investiga-tions that are more detailed are required to address this question.
Modeling the competence regulatory pathway has provided support for the obser-vations that intrinsic noise in comK expression destines cells to become competent, and also provides insight into factors that affect the probability of becoming competent and the time spent in the competent state (Maamar et al. 2007; Suel et al. 2007).
Interestingly, B. subtilis is not the only organism in which competence is associ-ated with phenotypically distinct subpopulations of an isogenic culture. Competent cultures of Streptococcus pneumoniae are comprised of a “donor” and an “accep-tor” population (Steinmoen et al. 2002; Steinmoen et al. 2003). The competent Streptococcus cells are thought to actively kill noncompetent cells (Guiral et al. 2005; Kreth et al. 2005). This is strikingly similar to the cannibalism described for B. subtilis (Gonzalez-Pastor et al. 2003), which depends on the master regulator (Spo0A) of another bistable differentiation process, sporulation (Chung et al. 1995; Veening et al. 2005). It is noteworthy that the bistable response in sporulation can be fine-tuned by regulating the phosphorylation state of the Spo0A protein (Veening et al. 2005). It can be expected that other differentiation processes affected by Spo0A potentially also demonstrate bistable behavior.
12.5.3 White–Opaque Switching in C. albicans
In this section, we will summarize recent advancement in the understanding of phenotypic switching in the fungus Candida albicans. Although the inclusion of a fungal system in a book on bacterial physiology may seem inappropriate, it is of importance to realize that phenotypic switching occurs in both fungi and bacteria (Burchard et al. 1977; Chantratita et al. 2007; Guerrero et al. 2006). However, because the molecular mechanisms underlying the switching in bacteria are rela-tively poorly understood, we have chosen to discuss a fungal example.
12 Phenotypic Variation and Bistable Switching in Bacteria 355
White–opaque switching, a change between two phenotypically distinct cell types, is one of the best-characterized mechanisms of generating phenotypic diver-sity of the opportunistic fungal pathogen Candida albicans (for reviews, see Bennett and Johnson 2005; Johnson 2003; Lockhart et al. 2003). The white–opaque switch was originally identified in strain WO-1, a clinical isolate of this fungus, in which switching occurs at relatively high frequency (Slutsky et al. 1987). The two pheno-typic states can easily be discerned as white cells forming white, dome-shaped colo-nies on the plate, or opaque cells giving rise to darker and flatter colonies. In addition, white cells appear virtually spherical under the microscope, whereas opaque cells are banana shaped and demonstrate plasma membrane protrusions (Anderson and Soll 1987). It was shown that opaque cells are directly derived from white progenitor cells (Rikkerink et al. 1988). For a long time, it was assumed that Candida reproduces asexually, but the identification of a mating type locus similar to that of S. cerevisiae (Hull and Johnson 1999) led to the identification of a mating competent state (Hull et al. 2000; Magee and Magee 2000; Tsong et al. 2003). Strikingly, it was found that white–opaque switching is governed by mating-type locus homeodomain proteins (Miller and Johnson 2002). Moreover, it was shown that only opaque cells were able to mate, and that these cells were homozygous for mating type (Lockhart et al. 2002). Profiling of white and opaque cells has revealed numerous differences between the two cell types, most notably the induction of mat-ing-type genes in opaque cells (Lan et al. 2002; Tsong et al. 2003).
Recently, two independent studies identified a single transcriptional regulator responsible for the white to opaque transition (Zordan et al. 2006; Huang et al. 2006). This regulator, WOR-1, is preferentially expressed in opaque cells and, there-fore, repressed in a/α cells (Lan et al. 2002; Tsong et al. 2003). It was reported that, on induction of an ectopic copy of the gene encoding the regulator, white cells are converted to opaque cells, suggesting that the WOR-1 bypasses the repression by the a/α repressor in heterozygous cells (Huang et al. 2006; Zordan et al. 2006). WOR-1 is capable of stimulating its own expression by binding directly to its own promoter (Zordan et al. 2006), which results in a bistable expression pattern (Huang et al. 2006). Two important observations were made by Zordan et al. (2006). First, they found that, in the presence of WOR-1 autostimulation, white cells were stably con-verted into opaque cells by a pulse in expression from an ectopic copy of the regula-tor gene. Second, they observed that, in the absence of an autostimulatory loop, continuous expression of WOR-1 was required to maintain the opaque phenotype.
In conclusion, white–opaque switching is repressed by the a/α repressor in het-erozygous cells (Lockhart et al. 2002; Soll et al. 2003). In cells homozygous for mating type (which may still be white), a basal level of expression from the WOR-1locus will cause some cells to switch to the opaque state when the threshold for WOR-1 autostimulation is reached (Fig. 12.5c). It is of importance to realize that the bistable switching only refers to WOR-1 expression states, and mating type DNA rearrangement and homozygosity/heterozygosity merely set the conditions under which bistability can occur.
Feedback-based bistability may be a common mechanism for switches such as the white–opaque switch. Myxococcus xanthus displays a switch between a tan and a
356 W.K. Smits et al.
yellow phenotype, for instance, and, although this is sometimes referred to as phase variation, no genomic inversion could be demonstrated and the molecular mecha-nisms remain elusive (Burchard et al. 1977; Laue and Gill 1994). Similarly, the molecular mechanisms behind phenotypic switching of Cryptococcus neoformans(Guerrero et al. 2006) and Burkholderia pseudomallei (Chantratita et al. 2007) remain to be established. Interestingly, developing cells of this organism display a bimodal distribution in the expression of the dev locus (Russo-Marie et al. 1993), which has been suggested to originate from a positive feedback loop (Viswanathan et al 2007).
12.6 Perspectives and Implications of Bistability
Phenotypic variation, in general, and bistability, in particular, are widespread phe-nomena in the bacterial realm. This has implications for medicine, food industry, biotechnology, and bioinformatic analyses.
In medicine and the food industry, the existence of subpopulations of cells resist-ant to conventional treatments has a large impact on the control of bacterial infec-tions and contaminations. Latent bacterial infections, the occurrence of persisters, and tolerance of pathogens to a multitude of drugs are increasingly problematic (Lewis 2007).
Persistence is the well-known phenomenon that, after treatment of a bacterial strain with a specific antibiotic, rapid killing of the vast majority of cells is observed, followed by a more complex and slow killing of the remaining cells. Eventually, a small proportion of the cells can survive. This behavior has been described for Staphylococcus aureus treated with penicillin in 1944 (Bigger 1944). Persistence is a bet-hedging strategy because, under optimal conditions, a majority of cells proliferate quickly and a small subpopulation suppresses growth. During times of stress, e.g., the presence of antibiotics, these persistent cells can prevent extinction of the entire population (Kussell et al. 2005). Persisters exhibit reduced translation and topoisomerase activity, and/or reduced cell wall biosynthesis, as a result of which, the targets of many antibiotics are blocked. Thus, these cells cannot be easily killed, at the cost of nonproliferation (reviewed in Lewis 2007). The molecular mechanism underlying persistence remained obscure until recently. The use of optical microscopy for single-cell analysis showed that persistence in E. coliis a phenotypic switch, and that at least two types of persistence can be identified: stationary phase-induced persistence (type I) and spontaneous persistence (type II) (Balaban et al. 2004). The generation of persisters is most probably caused by sto-chastic fluctuation and exceeding thresholds, just as described in Sect. 12.4 of this review for the mechanisms underlying multistationarity (Lewis 2007). Possibly, the occurrence of persisters can be reduced by factors that enhance the switching rate from persister to normal growth, providing possible solutions for drug use that is more effective (Balaban et al. 2004).
Phenotypic tolerance (resistance caused by a multifactorial phenotypic adapta-tion) is closely related to persistence. When bacteria are exposed to bactericidal
12 Phenotypic Variation and Bistable Switching in Bacteria 357
concentrations of antimicrobial compounds, their sensitivity gradually decreases, and certain subpopulations survive. Usually there is also cross-tolerance to other antimicrobials (Wiuff et al. 2005). Acquired nisin resistance in Gram-positive bac-teria was shown to be fully reversible when cells were allowed to grow again in media without the bacteriocin, indicating that the increased resistance was not genetically determined (Kramer et al. 2006). Interestingly, phenotypic heterogene-ity was found to occur when cells are subjected to subinhibitory (or sublethal) amounts of bacteriocin. Listeria monocytogenes challenged by nisin or leucocin 4010 developed two subpopulations, as observed by fluorescence ratio imaging microscopy (Hornbaek et al. 2006). One of the subpopulations showed cells with a dissipated pH gradient (∆pH), whereas the other subpopulation maintained the ∆pH. The study shows that it is of great importance to use the appropriate dose of the antimicrobial compound, taking into account its bioavailability, when it is applied for food preservation.
In addition to these phenomena, it has been noted that Salmonella growing in host macrophages demonstrates fast- and slow-dividing subpopulations (Abshire and Neidhardt 1993). It remains to be established whether this is related to the pro-duction of antimicrobial compounds by the macrophages.
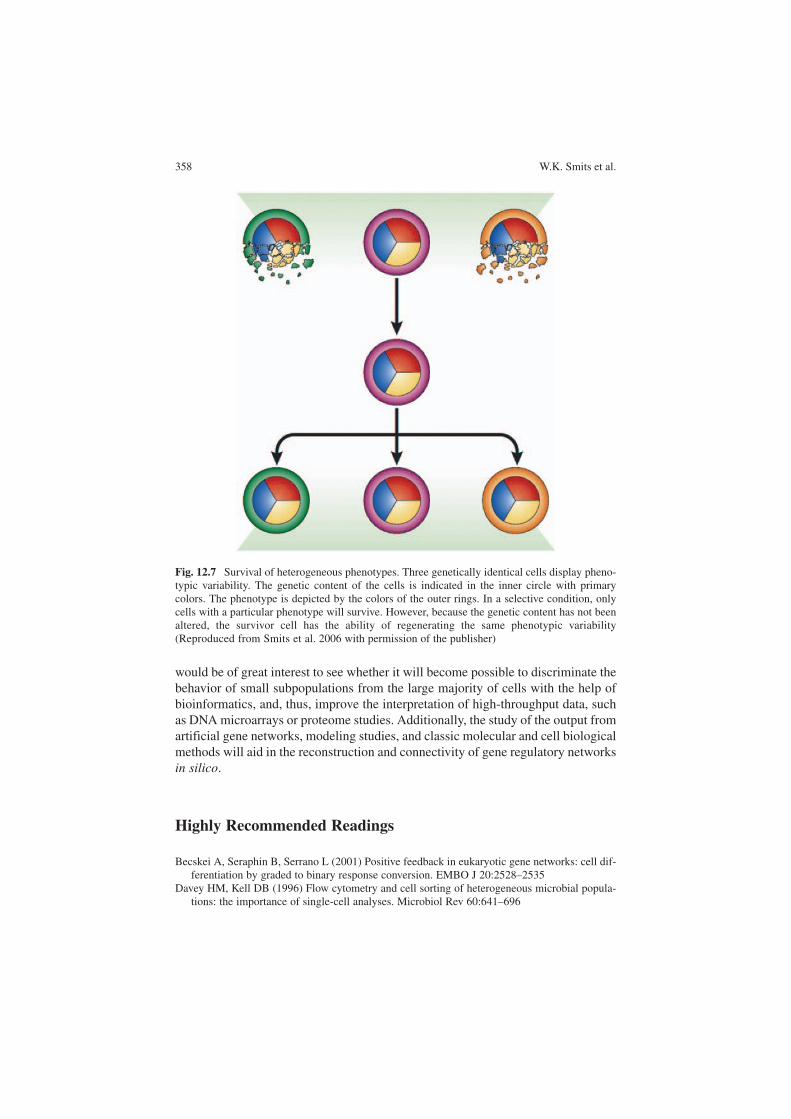
Although the mechanisms responsible for the observed phenotypic heterogeneity are not yet elucidated, it is tempting to speculate that epigenetic regulatory mecha-nisms such as bistability may play a role. It is interesting to note that, after selection of epigenetically determined phenotypes, the survivor cells retain the ability to gen-erate the same phenotypic variability (Fig. 12.7). Indeed, it was shown through mathematical modeling that cells with a variable phenotype have increased fitness under fluctuating environmental conditions (Thattai and van Oudenaarden 2004).
Besides the occurrence of resistant microbial contaminants in production sys-tems, bistability can also affect processes such as protein production. As exten-sively discussed in Sect. 12.5.1, the all-or-none enzyme induction of the lactose use operon has become a paradigm for bistability because it can occur for enzyme induction, although similar behavior has been also described for lactose use in Salmonella enterica serovar Typhimurium (Tolker-Nielsen et al. 1998). Arabinose-inducible systems are widely used for protein overproduction and purification, where the existence of a nonproducing subpopulation is unwanted. However, arab-inose use in E. coli also demonstrates a heterogeneous population distribution, most likely as a result of bursts in the synthesis of the arabinose permease, because of stochastic changes in the conformation of a transcriptional activator (Morgan-Kiss et al. 2002). To increase the yields of protein production, derivatives of production strains, in which the production of permease is uncoupled from enzyme induction and the positive feedback loop is, thus, effectively removed, have been constructed (Khlebnikov et al. 2002; Khlebnikov et al. 2001; Khlebnikov et al. 2000). In addi-tion, strains devoid of a dedicated arabinose uptake and degradation system were constructed, in which a mutated LacY permease transports arabinose into the cells (Morgan-Kiss et al. 2002).
From a fundamental point of view, the existence of subpopulations has implica-tions for the interpretation of data from bulk assays, as indicated in Sect. 12.1. It
358 W.K. Smits et al.
would be of great interest to see whether it will become possible to discriminate the behavior of small subpopulations from the large majority of cells with the help of bioinformatics, and, thus, improve the interpretation of high-throughput data, such as DNA microarrays or proteome studies. Additionally, the study of the output from artificial gene networks, modeling studies, and classic molecular and cell biological methods will aid in the reconstruction and connectivity of gene regulatory networks in silico.
Highly Recommended Readings
Becskei A, Seraphin B, Serrano L (2001) Positive feedback in eukaryotic gene networks: cell dif-ferentiation by graded to binary response conversion. EMBO J 20:2528–2535
Davey HM, Kell DB (1996) Flow cytometry and cell sorting of heterogeneous microbial popula-tions: the importance of single-cell analyses. Microbiol Rev 60:641–696
Fig. 12.7 Survival of heterogeneous phenotypes. Three genetically identical cells display pheno-typic variability. The genetic content of the cells is indicated in the inner circle with primary colors. The phenotype is depicted by the colors of the outer rings. In a selective condition, only cells with a particular phenotype will survive. However, because the genetic content has not been altered, the survivor cell has the ability of regenerating the same phenotypic variability (Reproduced from Smits et al. 2006 with permission of the publisher)
12 Phenotypic Variation and Bistable Switching in Bacteria 359
Elowitz MB, Levine AJ, Siggia ED, Swain PS (2002) Stochastic gene expression in a single cell. Science 297:1183–1186
Swain PS, Elowitz MB, Siggia ED (2002) Intrinsic and extrinsic contributions to stochasticity in gene expression. Proc Natl Acad Sci USA 99:12795–12800
Ferrell JE Jr (2002) Self-perpetuating states in signal transduction: positive feedback, double-negative feedback and bistability. Curr Opin Cell Biol 14:140–148
Monod J, Jacob F (1961) Teleonomic mechanisms in cellular metabolism, growth, and differentia-tion. Cold Spring Harb Symp Quant Biol 26:389–401
Smits WK, Kuipers OP, Veening JW (2006) Phenotypic variation in bacteria: the role of feedback regulation. Nat Rev Microbiol 4:259–271
References
Abraham JM, Freitag CS, Clements JR, Eisenstein BI (1985) An invertible element of DNA con-trols phase variation of type 1 fimbriae of Escherichia coli. Proc Natl Acad Sci USA 82:5724–5727
Abshire KZ, Neidhardt FC (1993) Growth rate paradox of Salmonella typhimurium within host macrophages. J Bacteriol 175:3744–3748
Acar M, Becskei A, van OA (2005) Enhancement of cellular memory by reducing stochastic tran-sitions. Nature 435:228–232
Albano M, Breitling R, Dubnau DA (1989) Nucleotide sequence and genetic organization of the Bacillus subtilis comG operon. J Bacteriol 171:5386–5404
Albano M, Dubnau DA (1989) Cloning and characterization of a cluster of linked Bacillus subtilislate competence mutations. J Bacteriol 171:5376–5385
Albano M, Hahn J, Dubnau D (1987) Expression of competence genes in Bacillus subtilis. J Bacteriol 169:3110–3117
Amann R, Ludwig W (2000) Ribosomal RNA-targeted nucleic acid probes for studies in micro-bial ecology. FEMS Microbiol Rev 24:555–565
Amann RI, Ludwig W, Schleifer KH (1995) Phylogenetic identification and in situ detection of individual microbial cells without cultivation. Microbiol Rev 59:143–169
Anderson JM, Soll DR (1987) Unique phenotype of opaque cells in the white-opaque transition of Candida albicans. J Bacteriol 169:5579–5588
Angeli D, Ferrell JE Jr, Sontag ED (2004) Detection of multistability, bifurcations, and hysteresis in a large class of biological positive-feedback systems. Proc Natl Acad Sci USA 101:1822–1827
Avery SV (2006) Microbial cell individuality and the underlying sources of heterogeneity. Nat Rev Microbiol 4:577–587
Balaban NQ, Merrin J, Chait R, Kowalik L, Leibler S (2004) Bacterial persistence as a phenotypic switch. Science 305:1622–1625
Barer MR, Harwood CR (1999) Bacterial viability and culturability. Adv Microb Physiol 41:93–137
Becskei A, Seraphin B, Serrano L (2001) Positive feedback in eukaryotic gene networks: cell dif-ferentiation by graded to binary response conversion. EMBO J 20:2528–2535
Becskei A, Serrano L (2000) Engineering stability in gene networks by autoregulation. Nature 405:590–593
Bennett RJ, Johnson AD (2005) Mating in Candida albicans and the search for a sexual cycle. Annu Rev Microbiol 59:233–255
Biggar SR, Crabtree GR (2001) Cell signaling can direct either binary or graded transcriptional responses. EMBO J 20:3167–3176
Brehm-Stecher BF, Johnson EA (2004) Single-cell microbiology: tools, technologies, and applica-tions. Microbiol Mol Biol Rev 68:538–559
360 W.K. Smits et al.
Burchard RP, Burchard AC, Parish JH (1977) Pigmentation phenotype instability in Myxococcusxanthus. Can J Microbiol 23:1657–1662
Cahn FH, Fox MS (1968) Fractionation of transformable bacteria from ocompetent cultures of Bacillus subtilis on renografin gradients. J Bacteriol 95:867–875
Cai L, Friedman N, Xie XS (2006) Stochastic protein expression in individual cells at the single molecule level. Nature 440:358–362
Carballido-Lopez R (2006) The bacterial actin-like cytoskeleton. Microbiol Mol Biol Rev 70:888–909
Casadesus J, D’Ari R (2002) Memory in bacteria and phage. Bioessays 24:512–518Chantratita N, Wuthiekanun V, Boonbumrung K, Tiyawisutsri R, Vesaratchavest M,
Limmathurosakul D, Chierakul W, Wongratanacheewin S, Pukritiyakamee S, White NJ, Day NP, Peacock SJ (2007) Biological relevance of colony morphology and phenotypic switching by Burkholderia pseudomallei. J Bacteriol 189:807–817
Chung JD, Conner S, Stephanopoulos G (1995) Flow cytometric study of differentiating cultures of Bacillus subtilis. Cytometry 20:324–333
Chung JD, Stephanopoulos G (1995) Studies of transcriptional state heterogeneity in sporulating cultures of Bacillus subtilis. Biotechnol Bioeng 47:234–242
Chung JD, Stephanopoulos G, Ireton K, Grossman AD (1994) Gene expression in single cells of Bacillus subtilis: evidence that a threshold mechanism controls the initiation of sporulation. J Bacteriol 176:1977–1984
Cohn M, Horibata K (1959a) Analysis of the differentiation and of the heterogeneity within a population of Escherichia coli undergoing induced beta-galactosidase synthesis. J Bacteriol 78:613–623
Cohn M, Horibata K (1959b) Inhibition by glucose of the induced synthesis of the beta-galactos-ide-enzyme system of Escherichia coli. Analysis of maintenance. J Bacteriol 78:601–612
Daniel RA, Errington J (2003) Control of cell morphogenesis in bacteria: two distinct ways to make a rod-shaped cell. Cell 113:767–776
Davey HM, Kell DB (1996) Flow cytometry and cell sorting of heterogeneous microbial popula-tions: the importance of single-cell analyses. Microbiol Rev 60:641–696
Dean DH, Douthit HA (1974) Buoyant density heterogeneity in spores of Bacillus subtilis: bio-chemical and physiological basis. J Bacteriol 117:601–610
Dooley DC, Hadden CT, Nester EW (1971) Macromolecular synthesis in Bacillus subtilis during development of the competent state. J Bacteriol 108:668–679
Dubnau D (1993) Genetic exchange and homologous recombination. In: Sonenshein AL, Hoch JA, Losick R (eds) Bacillus subtilis and other Gram-positive bacteria. American Society for Microbiology, Washington, D.C., pp 555–584
Dubnau D, Losick R (2006) Bistability in bacteria. Mol Microbiol 61:564–572Dubnau D, Lovett CM (2002) Transformation and recombination. In: Sonenshein AL, Hoch JA,
Losick R (eds) Bacillus subtilis and its Closest Relatives: from Genes to Cells. American Society for Microbiology, Washington, pp 453–472
Elowitz MB, Leibler S (2000) A synthetic oscillatory network of transcriptional regulators. Nature 403:335–338
Elowitz MB, Levine AJ, Siggia ED, Swain PS (2002) Stochastic gene expression in a single cell. Science 297:1183–1186
Ferrell JE Jr (1996) Tripping the switch fantastic: how a protein kinase cascade can convert graded inputs into switch-like outputs. Trends Biochem Sci 21:460–466
Ferrell JE Jr (2002) Self-perpetuating states in signal transduction: positive feedback, double-negative feedback and bistability. Curr Opin Cell Biol 14:140–148
Finkel SE, Kolter R (1999) Evolution of microbial diversity during prolonged starvation. Proc Natl Acad Sci USA 96:4023–4027
Fraser HB, Hirsh AE, Giaever G, Kumm J, Eisen MB (2004) Noise minimization in eukaryotic gene expression. PLoS Biol 2:e137
Friedman N, Cai L, Xie XS (2006) Linking stochastic dynamics to population distribution: an analytical framework of gene expression. Phys Rev Lett 97:168302
12 Phenotypic Variation and Bistable Switching in Bacteria 361
Gardner TS, Cantor CR, Collins JJ (2000) Construction of a genetic toggle switch in Escherichia coli. Nature 403:339–342
Glynn JR Jr, Belongia BM, Arnold RG, Ogden KL, Baygents JC (1998) Capillary electrophoresis measurements of electrophoretic mobility for colloidal particles of biological interest. Appl Environ Microbiol 64:2572–2577
Golding I, Cox EC (2004) RNA dynamics in live Escherichia coli cells. Proc Natl Acad Sci USA 101:11310–11315
Golding I, Paulsson J, Zawilski SM, Cox EC (2005) Real-time kinetics of gene activity in indi-vidual bacteria. Cell 123:1025–1036
Gonzalez-Pastor JE, Hobbs EC, Losick R (2003) Cannibalism by sporulating bacteria. Science 301:510–513
Greer LF III, Szalay AA (2002) Imaging of light emission from the expression of luciferases in living cells and organisms: a review. Luminescence 17:43–74
Guerrero A, Jain N, Goldman DL, Fries BC (2006) Phenotypic switching in Cryptococcus neo-formans. Microbiology 152:3–9
Guiral S, Mitchell TJ, Martin B, Claverys JP (2005) Competence-programmed predation of non-competent cells in the human pathogen Streptococcus pneumoniae: genetic requirements. Proc Natl Acad Sci USA 102:8710–8715
Hadden C, Nester EW (1968) Purification of competent cells in the Bacillus subtilis transforma-tion system. J Bacteriol 95:876–885
Hahn J, Albano M, Dubnau D (1987) Isolation and characterization of Tn917lac-generated com-petence mutants of Bacillus subtilis. J Bacteriol 169:3104–3109
Hahn J, Kong L, Dubnau D (1994) The regulation of competence transcription factor synthesis constitutes a critical control point in the regulation of competence in Bacillus subtilis. J Bacteriol 176:5753–5761
Haijema BJ, Hahn J, Haynes J, Dubnau D (2001) A ComGA-dependent checkpoint limits growth during the escape from competence. Mol Microbiol 40:52–64
Hamoen LW, Van-Werkhoven AF, Bijlsma JJ, Dubnau D, Venema G (1998) The competence transcription factor of Bacillus subtilis recognizes short A/T-rich sequences arranged in a unique, flexible pattern along the DNA helix. Genes Dev 12:1539–1550
Hamoen LW, Venema G, Kuipers OP (2003) Controlling competence in Bacillus subtilis: shared use of regulators. Microbiology 149:9–17
Hasty J, McMillen D, Collins JJ (2002) Engineered gene circuits. Nature 420:224–230Hasty J, Pradines J, Dolnik M, Collins JJ (2000) Noise-based switches and amplifiers for gene
expression. Proc Natl Acad Sci USA 97:2075–2080Haugland RP (2002) Handbook of fluorescent probes and research chemicals, 9 edn. Molecular
Probes, Inc., Eugene, ORHautefort I, Proenca MJ, Hinton JC (2003) Single-copy green fluorescent protein gene fusions
allow accurate measurement of Salmonella gene expression in vitro and during infection of mammalian cells. Appl Environ Microbiol 69:7480–7491
Henderson IR, Owen P, Nataro JP (1999) Molecular switches—the ON and OFF of bacterial phase variation. Mol Microbiol 33:919–932
Hoa TT, Tortosa P, Albano M, Dubnau D (2002) Rok (YkuW) regulates genetic competence in Bacillus subtilis by directly repressing comK. Mol Microbiol 43:15–26
Holtzendorff J, Reinhardt J, Viollier PH (2006) Cell cycle control by oscillating regulatory pro-teins in Caulobacter crescentus. Bioessays 28:355–361
Hooshangi S, Thiberge S, Weiss R (2005) Ultrasensitivity and noise propagation in a synthetic transcriptional cascade. Proc Natl Acad Sci USA 102:3581–3586
Hornbaek T, Brockhoff PB, Siegumfeldt H, Budde BB (2006) Two subpopulations of Listeriamonocytogenes occur at subinhibitory concentrations of leucocin 4010 and nisin. Appl Environ Microbiol 72:1631–1638
Huang G, Wang H, Chou S, Nie X, Chen J, Liu H (2006) Bistable expression of WOR1, a master regulator of white-opaque switching in Candida albicans. Proc Natl Acad Sci USA 103:12813–12818
362 W.K. Smits et al.
Hull CM, Johnson AD (1999) Identification of a mating type-like locus in the asexual pathogenic yeast Candida albicans. Science 285:1271–1275
Hull CM, Raisner RM, Johnson AD (2000) Evidence for mating of the “asexual” yeast Candidaalbicans in a mammalian host. Science 289:307–310
Isaacs FJ, Hasty J, Cantor CR, Collins JJ (2003) Prediction and measurement of an autoregulatory genetic module. Proc Natl Acad Sci USA 100:7714–7719
Jacob F, Monod J (1961) Genetic regulatory mechanisms in the synthesis of proteins. J Mol Biol 3:318–356
Johnson A (2003) The biology of mating in Candida albicans. Nat Rev Microbiol 1:106–116Joux F, Lebaron P (2000) Use of fluorescent probes to assess physiological functions of bacteria
at single-cell level. Microbes Infect 2:1523–1535Kasten FH (1993) Introduction to fluorescent probes: properties, history and applications. In:
Mason WT (ed) Fluorescent and luminescent probes for biological activity: a practical guide to technology for quantitative real-time analysis. Academic Press, Inc., New York, NY, pp 12–33
Kearns DB, Losick R (2005) Cell population heterogeneity during growth of Bacillus subtilis.Genes Dev 19:3083–3094
Kidane D, Graumann PL (2005) Intracellular protein and DNA dynamics in competent Bacillussubtilis cells. Cell 122:73–84
Khlebnikov A, Datsenko KA, Skaug T, Wanner BL, Keasling JD (2001) Homogeneous expression of the P(BAD) promoter in Escherichia coli by constitutive expression of the low-affinity high-capacity AraE transporter. Microbiology 147:3241–3247
Khlebnikov A, Risa O, Skaug T, Carrier TA, Keasling JD (2000) Regulatable arabinose-inducible gene expression system with consistent control in all cells of a culture. J Bacteriol 182:7029–7034
Khlebnikov A, Skaug T, Keasling JD (2002) Modulation of gene expression from the arabinose-inducible araBAD promoter. J Ind Microbiol Biotechnol 29:34–37
Kobayashi H, KAErn M, Araki M, Chung K, Gardner TS, Cantor CR, Collins JJ (2004) Programmable cells: interfacing natural and engineered gene networks. Proc Natl Acad Sci USA 101:8414–8419
Korobkova E, Emonet T, Vilar JM, Shimizu TS, Cluzel P (2004) From molecular noise to behav-ioural variability in a single bacterium. Nature 428:574–578
Kramer NE, van Hijum SA, Knol J, Kok J, Kuipers OP (2006) Transcriptome analysis reveals mechanisms by which Lactococcus lactis acquires nisin resistance. Antimicrob Agents Chemother 50:1753–1761
Kreth J, Merritt J, Shi W, Qi F (2005) Co-ordinated bacteriocin production and competence devel-opment: a possible mechanism for taking up DNA from neighbouring species. Mol Microbiol 57:392–404
Kussell E, Kishony R, Balaban NQ, Leibler S (2005) Bacterial persistence: a model of survival in changing environments. Genetics 169:1807–1814
Lan CY, Newport G, Murillo LA, Jones T, Scherer S, Davis RW, Agabian N (2002) Metabolic specialization associated with phenotypic switching in Candida albicans. Proc Natl Acad Sci USA 99:14907–14912
Lange M, Tolker-Nielsen T, Molin S, Ahring BK (2000) In situ reverse transcription-PCR for monitoring gene expression in individual Methanosarcina mazei S-6 cells. Appl Environ Microbiol 66:1796–1800
Laue BE, Gill RE (1994) Use of a phase variation-specific promoter of Myxococcus xanthus in a strategy for isolating a phase-locked mutant. J Bacteriol 176:5341–5349
Laurent M, Kellershohn N (1999) Multistability: a major means of differentiation and evolution in biological systems. Trends Biochem Sci 24:418–422
Leisner M, Stingl K, Radler JO, Maier B (2007) Basal expression rate of comK sets a ‘switching window’ into the K-state of Bacillus subtilis. Mol Microbiol 63: 1806–1816
Lemon KP, Grossman AD (1998) Localization of bacterial DNA polymerase: evidence for a fac-tory model of replication. Science 282:1516–1519
12 Phenotypic Variation and Bistable Switching in Bacteria 363
Lewis K (2007) Persister cells, dormancy and infectious disease. Nat Rev Microbiol 5:48–56Lipshtat A, Loinger A, Balaban NQ, Biham O (2006) Genetic toggle switch without cooperative
binding. Phys Rev Lett 96:188101Lisman JE (1985) A mechanism for memory storage insensitive to molecular turnover: a bistable
autophosphorylating kinase. Proc Natl Acad Sci USA 82:3055–3057Lockhart SR, Daniels KJ, Zhao R, Wessels D, Soll DR (2003) Cell biology of mating in Candida
albicans. Eukaryot Cell 2:49–61Lockhart SR, Pujol C, Daniels KJ, Miller MG, Johnson AD, Pfaller MA, Soll DR (2002) In
Candida albicans, white-opaque switchers are homozygous for mating type. Genetics 162:737–745
Maamar H, Dubnau D (2005) Bistability in the Bacillus subtilis K-state (competence) system requires a positive feedback loop. Mol Microbiol 56:615–624
Maamar H, Raj A, Dubnau D (2007) Noise in gene expression determines cell fate in Bacillussubtilis. Science Jun 14 (Epub ahead of print).
Magee BB, Magee PT (2000) Induction of mating in Candida albicans by construction of MTLa and MTLalpha strains. Science 289:310–313
Makinoshima H, Nishimura A, Ishihama A (2002) Fractionation of Escherichia coli cell populations at different stages during growth transition to stationary phase. Mol Microbiol 43:269–279
Meyer TF, Gibbs CP, Haas R (1990) Variation and control of protein expression in Neisseria.Annu Rev Microbiol 44:451–477
Miller MG, Johnson AD (2002) White-opaque switching in Candida albicans is controlled by mating-type locus homeodomain proteins and allows efficient mating. Cell 110:293–302
Monod J, Jacob F (1961) Teleonomic mechanisms in cellular metabolism, growth, and differentia-tion. Cold Spring Harb Symp Quant Biol 26:389–401
Morgan-Kiss RM, Wadler C, Cronan JE Jr (2002) Long-term and homogeneous regulation of the Escherichia coli araBAD promoter by use of a lactose transporter of relaxed specificity. Proc Natl Acad Sci USA 99:7373–7377
Moter A, Gobel UB (2000) Fluorescence in situ hybridization (FISH) for direct visualization of microorganisms. J Microbiol Methods 41:85–112
Muller-Hill B (1996) The Lac Operon: A Short History of a Genetic Paradigm. Walter de Gruyter, Berlin
Nebe-von-Caron G, Stephens PJ, Hewitt CJ, Powell JR, Badley RA (2000) Analysis of bacterial function by multi-colour fluorescence flow cytometry and single cell sorting. J Microbiol Methods 42:97–114
Nester EW, Stocker BA (1963) Biosynthetic latency in early stages of deoxyribonucleic acid transformation in Bacillus subtilis. J Bacteriol 86:785–796
Nishino T, Nayak BB, Kogure K (2003) Density-dependent sorting of physiologically different cells of Vibrio parahaemolyticus. Appl Environ Microbiol 69:3569–3572
Novick A, Weiner M (1957) Enzyme induction as an all-or-none phenomenon. Proc Natl Acad Sci USA 43:553–566
Ortega F, Garces JL, Mas F, Kholodenko BN, Cascante M (2006) Bistability from double phos-phorylation in signal transduction. FEBS J 273:3915–3926
Ozbudak EM, Thattai M, Kurtser I, Grossman AD, van Oudenaarden A (2002) Regulation of noise in the expression of a single gene. Nat Genet 31:69–73
Ozbudak EM, Thattai M, Lim HN, Shraiman BI, van Oudenaarden A (2004) Multistability in the lactose utilization network of Escherichia coli. Nature 427:737–740
Pedraza JM, van Oudenaarden A (2005) Noise propagation in gene networks. Science 307:1965–1969
Rikkerink EH, Magee BB, Magee PT (1988) Opaque-white phenotype transition: a programmed morphological transition in Candida albicans. J Bacteriol 170:895–899
Rosenfeld N, Young JW, Alon U, Swain PS, Elowitz MB (2005) Gene regulation at the single-cell level. Science 307:1962–1965
Russo-Marie F, Roederer M, Sager B, Herzenberg LA, Kaiser D (1993) Beta- galactosidase activ-ity in single differentiating bacterial cells. Proc Natl Acad Sci USA 90:8194–8198
364 W.K. Smits et al.
Santillán M, Mackey MC, Zeron ES (2007) Origin of bistability in the lac operon. Biophys J 92: 3830–3842
Sentchilo V, Ravatn R, Werlen C, Zehnder AJ, van der Meer Jr (2003a) Unusual integrase gene expression on the clc genomic island in Pseudomonas sp. strain B13. J Bacteriol 185:4530–4538
Sentchilo V, Zehnder AJ, van der Meer Jr (2003b) Characterization of two alternative promoters for integrase expression in the clc genomic island of Pseudomonas sp. strain B13. Mol Microbiol 49:93–104
Shaner NC, Campbell RE, Steinbach PA, Giepmans BN, Palmer AE, Tsien RY (2004) Improved monomeric red, orange and yellow fluorescent proteins derived from Discosoma sp. red fluo-rescent protein. Nat Biotechnol 22:1567–1572
Shaner NC, Steinbach PA, Tsien RY (2005) A guide to choosing fluorescent proteins. Nat Methods 2:905–909
Singh RN, Pitale MP (1967) Enrichment of bacillus subtilis transformants by zonal centrifugation. Nature 213:1262
Singh RN, Pitale MP (1968) Competence and deoxyribonucleic acid uptake in Bacillus subtilis.J Bacteriol 95:864–866
Slutsky B, Staebell M, Anderson J, Risen L, Pfaller M, Soll DR (1987) “White-opaque transition”: a second high-frequency switching system in Candida albicans. J Bacteriol 169:189–197
Smits WK, Eschevins CC, Susanna KA, Bron S, Kuipers OP, Hamoen LW (2005) Stripping Bacillus: ComK auto-stimulation is responsible for the bistable response in competence devel-opment. Mol Microbiol 56:604–614
Smits WK, Kuipers OP, Veening JW (2006) Phenotypic variation in bacteria: the role of feedback regulation. Nat Rev Microbiol 4:259–271
Smits WK, Bongiorni C, Veening JW, Hamoen LW, Kuipers OP, Perego M (2007) Temporal sepa-ration of distinct differentiation pathways by a dual specificity Rap-phr in Bacillus subtilis.Mol Microbiol 65:103–120
Soll DR, Lockhart SR, Zhao R (2003) Relationship between switching and mating in Candidaalbicans. Eukaryot Cell 2:390–397
Southward CM, Surette MG (2002) The dynamic microbe: green fluorescent protein brings bac-teria to light. Mol Microbiol 45:1191–1196
Steinmoen H, Knutsen E, Havarstein LS (2002) Induction of natural competence in Streptococcus pneumoniae triggers lysis and DNA release from a subfraction of the cell population. Proc Natl Acad Sci USA 99:7681–7686
Steinmoen H, Teigen A, Havarstein LS (2003) Competence-induced cells of Streptococcus pneu-moniae lyse competence-deficient cells of the same strain during cocultivation. J Bacteriol 185:7176–7183
Stewart EJ, Madden R, Paul G, Taddei F (2005) Aging and death in an organism that reproduces by morphologically symmetric division. PLoS Biol 3:e45
Stibitz S, Aaronson W, Monack D, Falkow S (1989) Phase variation in Bordetella pertussis by frameshift mutation in a gene for a novel two-component system. Nature 338:266–269
Suel GM, Garcia-Ojalvo J, Liberman LM, Elowitz MB (2006) An excitable gene regulatory cir-cuit induces transient cellular differentiation. Nature 440:545–550
Suel GM, Kulkarni RP, Dworkin J, Garcia-Ojalvo J, Elowitz MB (2007) Tunability and noise dependency in differentiation dynamics. Science 315:1716–1719
Sumner ER, Avery SV (2002) Phenotypic heterogeneity: differential stress resistance among indi-vidual cells of the yeast Saccharomyces cerevisiae. Microbiology 148:345–351
Susanna KA, van der Werff AF, den Hengst CD, Calles B, Salas M, Venema G, Hamoen LW, Kuipers OP (2004) Mechanism of transcription activation at the comG promoter by the com-petence transcription factor ComK of Bacillus subtilis. J Bacteriol 186:1120–1128
Swain PS, Elowitz MB, Siggia ED (2002) Intrinsic and extrinsic contributions to stochasticity in gene expression. Proc Natl Acad Sci USA 99:12795–12800
Thattai M, van Oudenaarden A (2004) Stochastic gene expression in fluctuating environments. Genetics 167:523–530
12 Phenotypic Variation and Bistable Switching in Bacteria 365
Thomas R (1998) Laws for the dynamics of regulatory networks. Int J Dev Biol 42:479–485Thomas R (1978) Logical analysis of systems comprising feedback loops. J Theor Biol
73:631–656Tian T, Burrage K (2004) Bistability and switching in the lysis/lysogeny genetic regulatory net-
work of bacteriophage lambda. J Theor Biol 227:229–237Tolker-Nielsen T, Holmstrom K, Boe L, Molin S (1998) Non-genetic population heterogeneity
studied by in situ polymerase chain reaction. Mol Microbiol 27:1099–1105Tsien RY (1998) The green fluorescent protein. Annu Rev Biochem 67:509–544Tsong AE, Miller MG, Raisner RM, Johnson AD (2003) Evolution of a combinatorial transcrip-
tional circuit: a case study in yeasts. Cell 115:389–399van der Woude M, Braaten B, Low D (1996) Epigenetic phase variation of the pap operon in
Escherichia coli. Trends Microbiol 4:5–9van Hoek MJ, Hogeweg P (2006) In silico evolved lac operons exhibit bistability for artificial
inducers, but not for lactose. Biophys J 91:2833–2843van Merode AE, van der Mei HC, Busscher HJ, Waar K, Krom BP (2006a) Enterococcus faecalis
strains show culture heterogeneity in cell surface charge. Microbiology 152:807–814van Merode AE, van der Mei HC, Busscher HJ, Krom BP (2006b) Influence of culture heteroge-
neity in cell surface charge on adhesion and biofilms formation by Enterococcus faecalis. J Bacteriol 188:2421–2426
van Sinderen D, Luttinger A, Kong L, Dubnau D, Venema G, Hamoen L (1995) comK encodes the competence transcription factor, the key regulatory protein for competence development in Bacillus subtilis. Mol Microbiol 15:455–462
van Sinderen D, Venema G (1994) comK acts as an autoregulatory control switch in the signal transduction route to competence in Bacillus subtilis. J Bacteriol 176:5762–5770
Veening JW, Hamoen LW, Kuipers OP (2005) Phosphatases modulate the bistable sporulation gene expression pattern in Bacillus subtilis. Mol Microbiol 56:1481–1494
Vidal-Mas J, Resina P, Haba E, Comas J, Manresa A, Vives-Rego J (2001) Rapid flow cytome-try—Nile red assessment of PHA cellular content and heterogeneity in cultures of Pseudomonas aeruginosa 47T2 (NCIB 40044) grown in waste frying oil. Antonie Van Leeuwenhoek 80:57–63
Viswanathan P, Ueki T, Inouye S, Kroos L (2007) Combinatorial regulation of genes essential for Myxococcus xanthus development requires a response regulator and a LysR-type regulator. Proc Natl Acad Sci USA 104(19):7969–7974
Vives-Rego J, Lebaron P, Nebe-von CG (2000) Current and future applications of flow cytometry in aquatic microbiology. FEMS Microbiol Rev 24:429–448
Williams SB (2007) A circadian timing mechanism in the cyanobacteria. Adv Microb Physiol 52:229–296
Wiuff C, Zappala RM, Regoes RR, Garner KN, Baquero F, Levin BR (2005) Phenotypic toler-ance: antibiotic enrichment of noninherited resistance in bacterial populations. Antimicrob Agents Chemother 49:1483–1494
Yildirim N, Mackey MC (2003) Feedback regulation in the lactose operon: a mathematical mode-ling study and comparison with experimental data. Biophys J 84:2841–2851
Yildirim N, Santillan M, Horike D, Mackey MC (2004) Dynamics and bistability in a reduced model of the lac operon. Chaos 14:279–292
Zieg J, Silverman M, Hilmen M, Simon M (1977) Recombinational switch for gene expression. Science 196:170–172
Zordan RE, Galgoczy DJ, Johnson AD (2006) Epigenetic properties of white-opaque switching in Candida albicans are based on a self-sustaining transcriptional feedback loop. Proc Natl Acad Sci USA 103:12807–12812