Embed Size (px)
Citation preview
Carol Jacobson MN, RN www.cardionursing.com 1
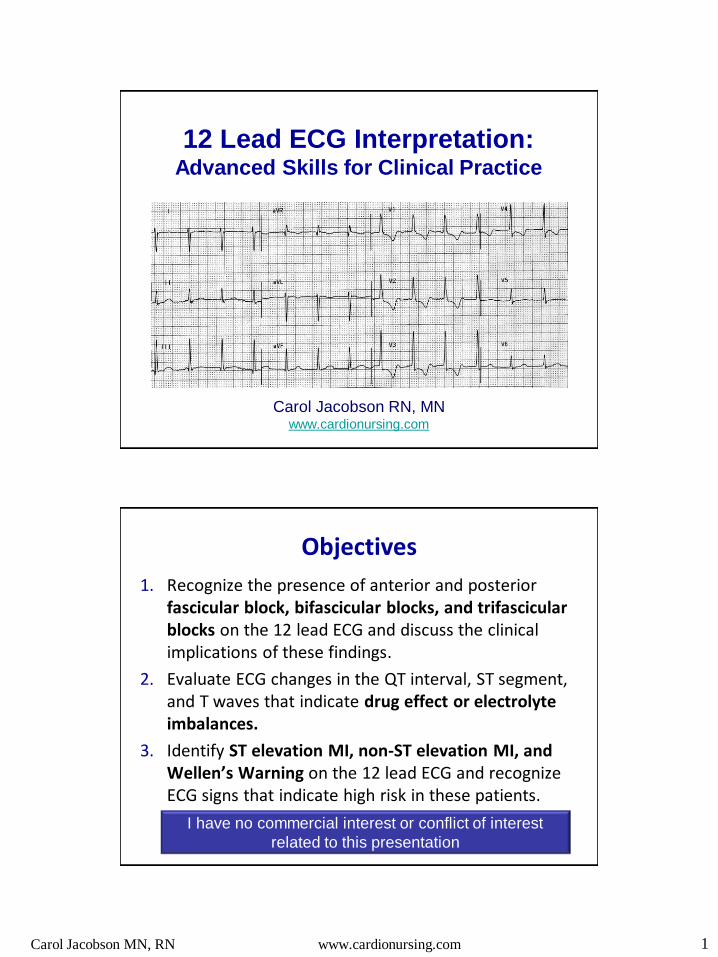
12 Lead ECG Interpretation: Advanced Skills for Clinical Practice
Carol Jacobson RN, MN www.cardionursing.com
Objectives
1. Recognize the presence of anterior and posterior fascicular block, bifascicular blocks, and trifascicular blocks on the 12 lead ECG and discuss the clinical implications of these findings.
2. Evaluate ECG changes in the QT interval, ST segment, and T waves that indicate drug effect or electrolyte imbalances.
3. Identify ST elevation MI, non-ST elevation MI, and Wellen’s Warning on the 12 lead ECG and recognize ECG signs that indicate high risk in these patients.
I have no commercial interest or conflict of interest
related to this presentation
Carol Jacobson MN, RN www.cardionursing.com 2
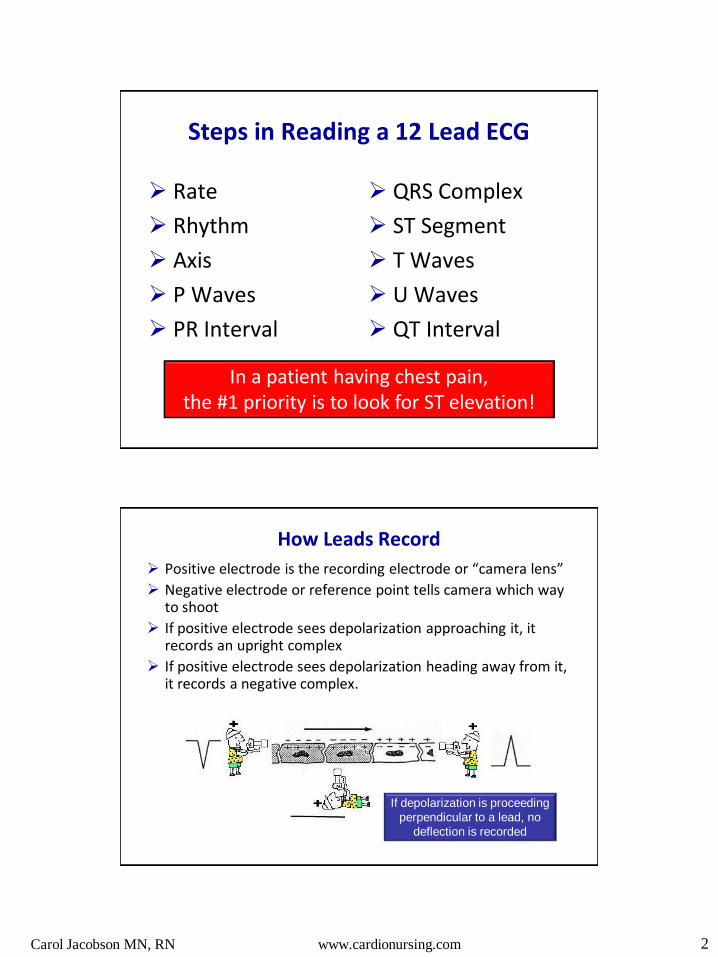
Steps in Reading a 12 Lead ECG
Rate
Rhythm
Axis
P Waves
PR Interval
QRS Complex
ST Segment
T Waves
U Waves
QT Interval
In a patient having chest pain, the #1 priority is to look for ST elevation!
How Leads Record
Positive electrode is the recording electrode or “camera lens”
Negative electrode or reference point tells camera which way to shoot
If positive electrode sees depolarization approaching it, it records an upright complex
If positive electrode sees depolarization heading away from it, it records a negative complex.
If depolarization is proceeding
perpendicular to a lead, no
deflection is recorded

Carol Jacobson MN, RN www.cardionursing.com 3
Fascicular Blocks
(Hemiblock)
Conduction System Anatomy
Posterior Fascicle
Anterior Fascicle AV Node
Bundle of His
Main Left Bundle Branch
Right Bundle Branch
RV
LV
Carol Jacobson MN, RN www.cardionursing.com 4
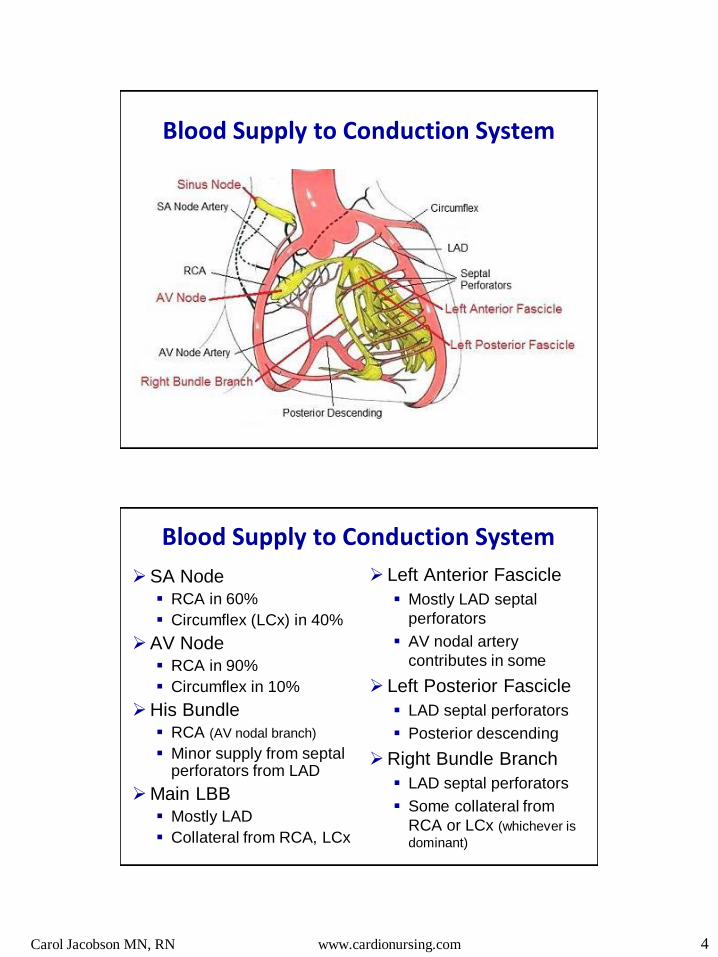
Blood Supply to Conduction System
Blood Supply to Conduction System
SA Node RCA in 60%
Circumflex (LCx) in 40%
AV Node RCA in 90%
Circumflex in 10%
His Bundle RCA (AV nodal branch)
Minor supply from septal perforators from LAD
Main LBB Mostly LAD
Collateral from RCA, LCx
Left Anterior Fascicle
Mostly LAD septal
perforators
AV nodal artery
contributes in some
Left Posterior Fascicle
LAD septal perforators
Posterior descending
Right Bundle Branch
LAD septal perforators
Some collateral from
RCA or LCx (whichever is
dominant)
Carol Jacobson MN, RN www.cardionursing.com 5
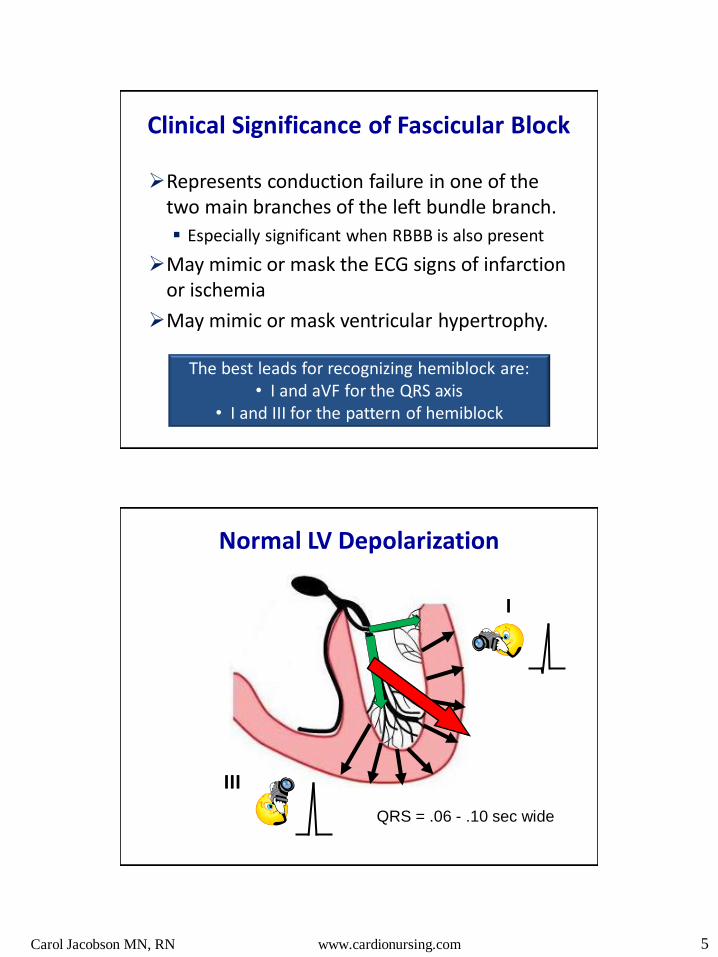
Clinical Significance of Fascicular Block
Represents conduction failure in one of the two main branches of the left bundle branch.
Especially significant when RBBB is also present
May mimic or mask the ECG signs of infarction or ischemia
May mimic or mask ventricular hypertrophy.
The best leads for recognizing hemiblock are: • I and aVF for the QRS axis
• I and III for the pattern of hemiblock
Normal LV Depolarization
III
I
QRS = .06 - .10 sec wide
Carol Jacobson MN, RN www.cardionursing.com 6
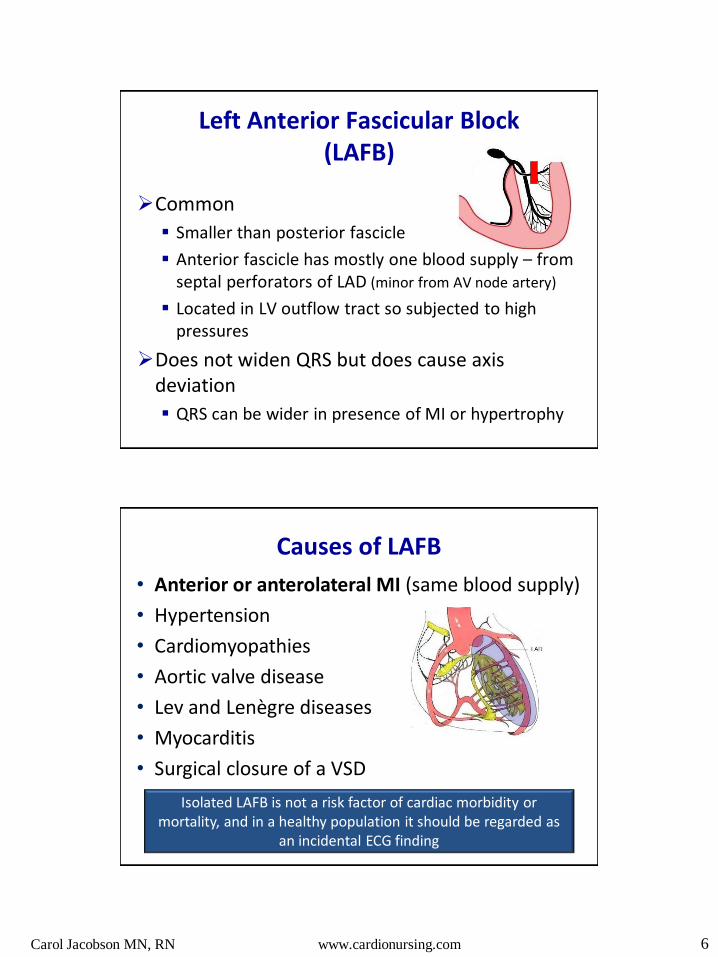
Left Anterior Fascicular Block (LAFB)
Common
Smaller than posterior fascicle
Anterior fascicle has mostly one blood supply – from septal perforators of LAD (minor from AV node artery)
Located in LV outflow tract so subjected to high pressures
Does not widen QRS but does cause axis deviation
QRS can be wider in presence of MI or hypertrophy
Causes of LAFB
• Anterior or anterolateral MI (same blood supply)
• Hypertension
• Cardiomyopathies
• Aortic valve disease
• Lev and Lenègre diseases
• Myocarditis
• Surgical closure of a VSD
Isolated LAFB is not a risk factor of cardiac morbidity or mortality, and in a healthy population it should be regarded as
an incidental ECG finding

Carol Jacobson MN, RN www.cardionursing.com 7
Left Anterior Fascicular Block
III & aVF
I or aVL
QRS = .06 - .11 sec wide
Criteria for LAFB
Left Axis Deviation: -45⁰ to -90⁰
qR in lead I (and aVL)
rS in II, III, aVF (deeper S in III than in II)
QRS width < .12 sec
Often increased QRS voltage due to unopposed forces in LV (can mimic LV hypertrophy)
Left axis deviation, QI, SIII
Carol Jacobson MN, RN www.cardionursing.com 8
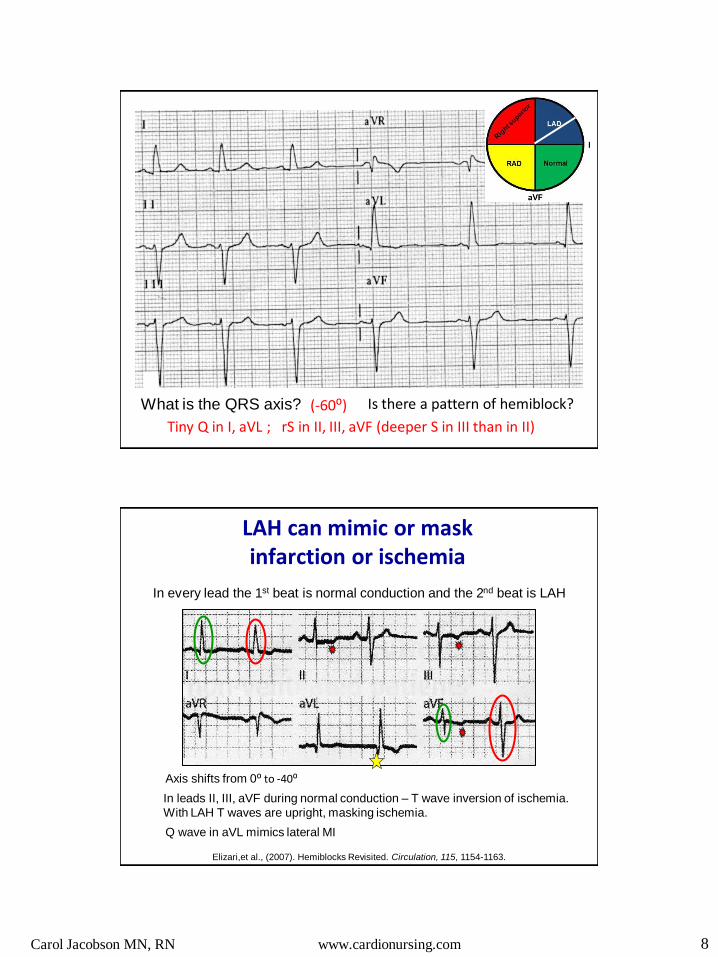
What is the QRS axis? (-60⁰) Is there a pattern of hemiblock?
Tiny Q in I, aVL ; rS in II, III, aVF (deeper S in III than in II)
In every lead the 1st beat is normal conduction and the 2nd beat is LAH
In leads II, III, aVF during normal conduction – T wave inversion of ischemia.
With LAH T waves are upright, masking ischemia.
Axis shifts from 0⁰ to -40⁰
LAH can mimic or mask infarction or ischemia
Q wave in aVL mimics lateral MI
Elizari,et al., (2007). Hemiblocks Revisited. Circulation, 115, 1154-1163.

Carol Jacobson MN, RN www.cardionursing.com 9
Causes of Left Axis Deviation
Left anterior hemiblock
Left ventricular hypertrophy
Inferolateral MI
CAD
Ventricular beats, VT
Ventricular pacing
WPW syndrome - R sided accessory pathway
Emphysema
Horizontal heart position: pregnancy, short build
If the S wave in lead II is deeper than the S wave
in lead III, LAH is very unlikely
Left Posterior Fascicular Block
Rare – especially in isolation
Thicker than anterior fascicle
Located in LV inflow tract so low pressures
Has two blood supplies: LAD and posterior descending artery
More often seen with RBBB: dangerous!
Does not widen QRS but does cause axis deviation
Carol Jacobson MN, RN www.cardionursing.com 10
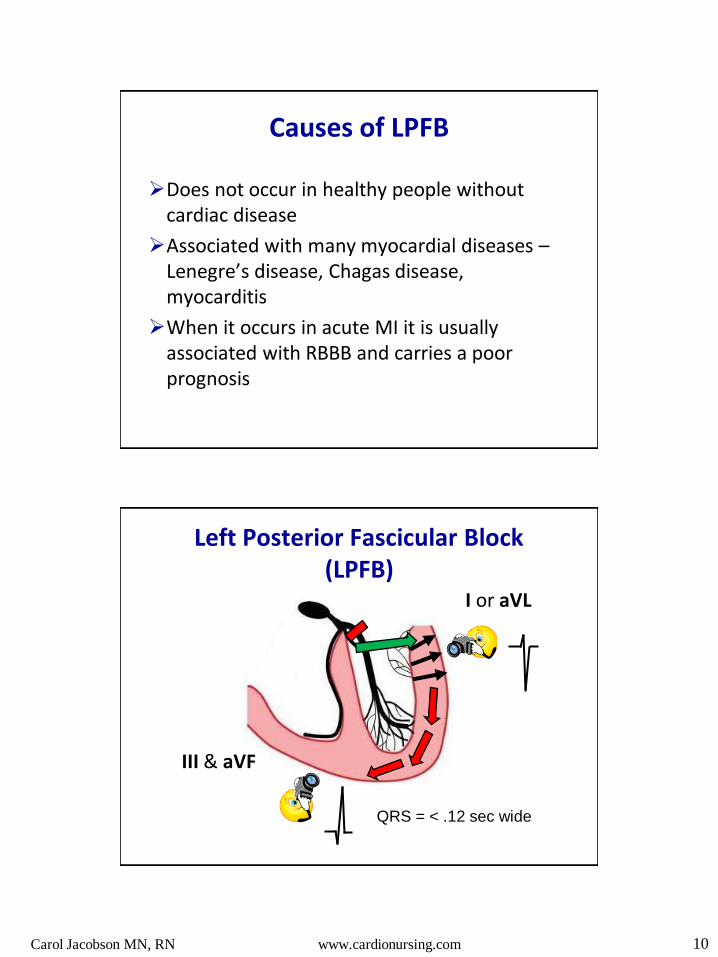
Causes of LPFB
Does not occur in healthy people without cardiac disease
Associated with many myocardial diseases – Lenegre’s disease, Chagas disease, myocarditis
When it occurs in acute MI it is usually associated with RBBB and carries a poor prognosis
Left Posterior Fascicular Block (LPFB)
III & aVF
I or aVL
QRS = < .12 sec wide
Carol Jacobson MN, RN www.cardionursing.com 11
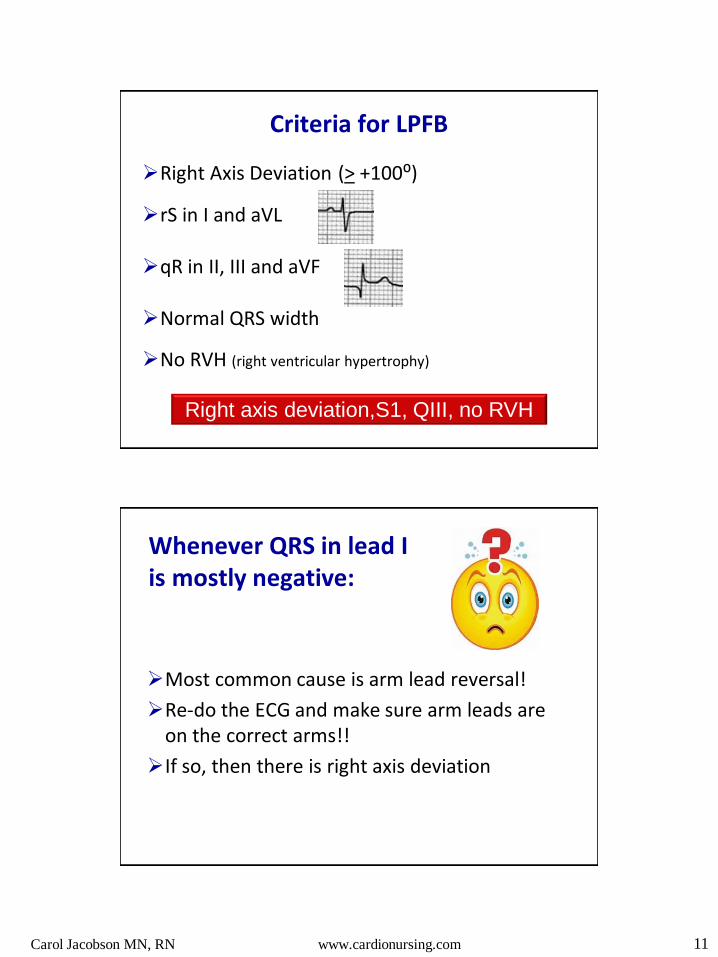
Criteria for LPFB
Right Axis Deviation (> +100⁰)
rS in I and aVL
qR in II, III and aVF
Normal QRS width
No RVH (right ventricular hypertrophy)
Right axis deviation,S1, QIII, no RVH
Whenever QRS in lead I is mostly negative:
Most common cause is arm lead reversal!
Re-do the ECG and make sure arm leads are on the correct arms!!
If so, then there is right axis deviation

Carol Jacobson MN, RN www.cardionursing.com 12
Limb Leads
What is the QRS axis? (RAD)
Is there a pattern of hemiblock? rS in lead I; Q in lead III
V Leads: evaluate R wave progression
Any signs of RVH? No. R wave progression is normal

Carol Jacobson MN, RN www.cardionursing.com 13
I
rS in I and aVL, and qR in III and aVF = typical of LPH
What is the axis? Right axis deviation
Is there a pattern of hemiblock?
V leads show huge R wave in V1 and reversal of precordial pattern = RVH
Causes of Right Axis Deviation
Normal in children and tall thin adults Left posterior hemiblock Right ventricular hypertrophy Right bundle branch block Chronic lung disease Pulmonary hypertension Lateral myocardial infarction Pulmonary embolus WPW syndrome - L sided accessory pathway Dextrocardia
Rightward shift of prior normal axis: think PE

Carol Jacobson MN, RN www.cardionursing.com 14
Hemiblock Practice #1
Hemiblock Practice #2
Limb Leads

Carol Jacobson MN, RN www.cardionursing.com 15
V Leads
Hemiblock Practice #3
Carol Jacobson MN, RN www.cardionursing.com 16
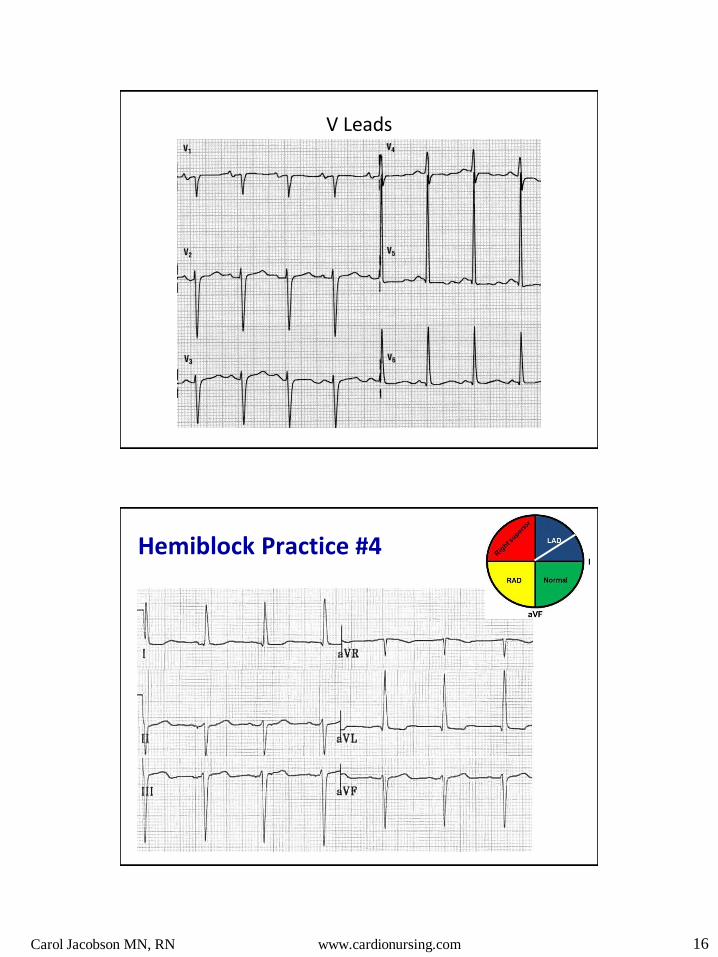
V Leads
Hemiblock Practice #4
Carol Jacobson MN, RN www.cardionursing.com 17
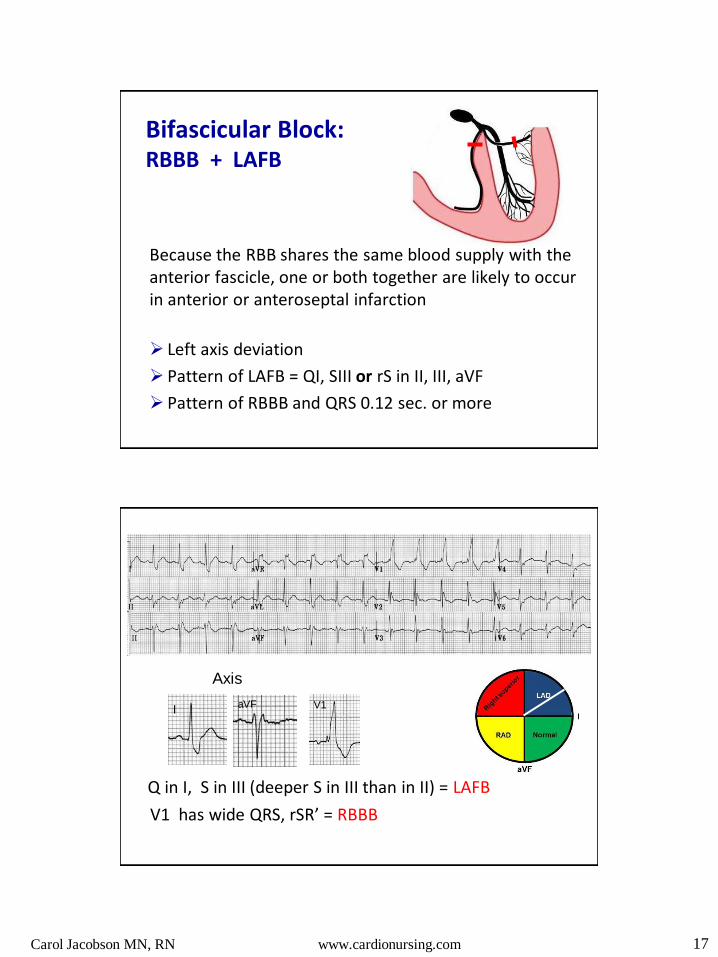
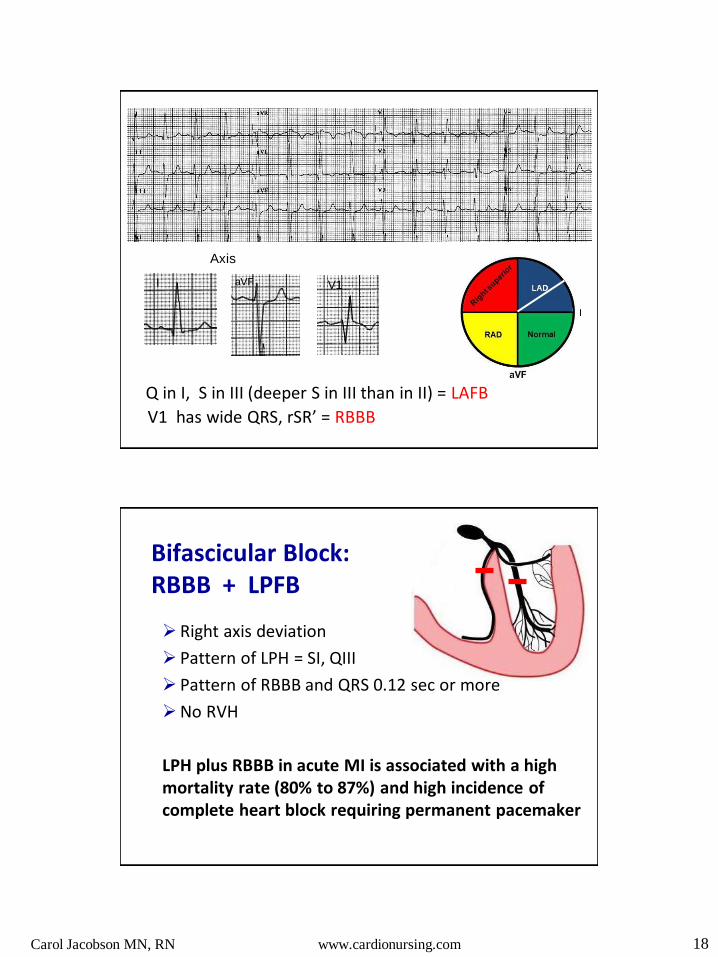
Bifascicular Block: RBBB + LAFB
Because the RBB shares the same blood supply with the anterior fascicle, one or both together are likely to occur in anterior or anteroseptal infarction
Left axis deviation
Pattern of LAFB = QI, SIII or rS in II, III, aVF
Pattern of RBBB and QRS 0.12 sec. or more
I aVF V1
Q in I, S in III (deeper S in III than in II) = LAFB
V1 has wide QRS, rSR’ = RBBB
Axis
Carol Jacobson MN, RN www.cardionursing.com 18
V1
Q in I, S in III (deeper S in III than in II) = LAFB
V1 has wide QRS, rSR’ = RBBB
I aVF
Axis
Bifascicular Block: RBBB + LPFB
Right axis deviation
Pattern of LPH = SI, QIII
Pattern of RBBB and QRS 0.12 sec or more
No RVH
LPH plus RBBB in acute MI is associated with a high mortality rate (80% to 87%) and high incidence of complete heart block requiring permanent pacemaker
Carol Jacobson MN, RN www.cardionursing.com 19
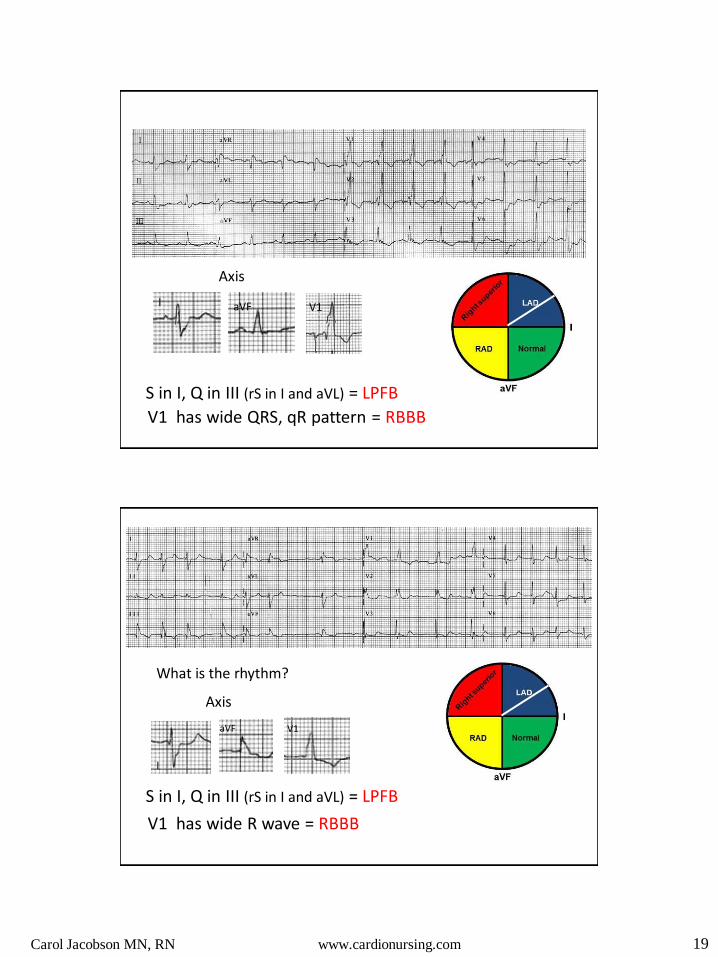
I aVF V1
Axis
S in I, Q in III (rS in I and aVL) = LPFB
V1 has wide QRS, qR pattern = RBBB
What is the rhythm?
Axis
I
aVF V1
S in I, Q in III (rS in I and aVL) = LPFB
V1 has wide R wave = RBBB

Carol Jacobson MN, RN www.cardionursing.com 20
Trifascicular Block
Can be complete or incomplete
What would complete trifascicular block look like?
Incomplete Trifascicular Block
Bifascicular block with evidence of delayed conduction in the 3rd fascicle
RBBB with either LAFB or LPFB and 1st degree AVB
RBBB with either LAFB or LPFB and intermittent blocked P waves
RBBB with alternating LAFB and LPFB
Carol Jacobson MN, RN www.cardionursing.com 21
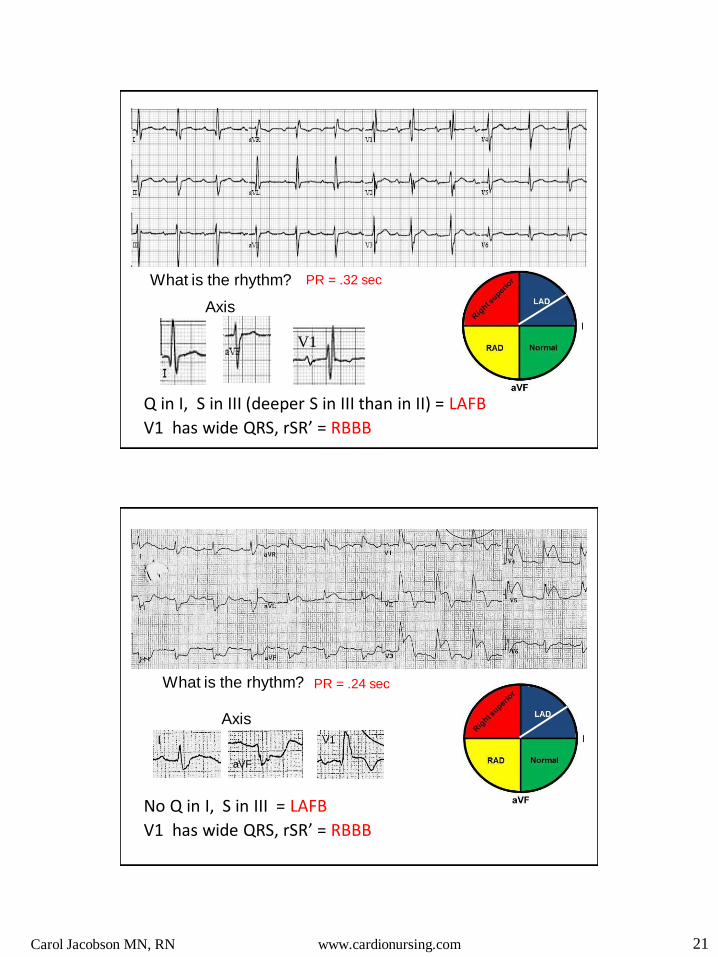
V1
Q in I, S in III (deeper S in III than in II) = LAFB
V1 has wide QRS, rSR’ = RBBB
What is the rhythm?
Axis
PR = .32 sec
What is the rhythm? PR = .24 sec
I
aVF
V1
No Q in I, S in III = LAFB
V1 has wide QRS, rSR’ = RBBB
Axis
Carol Jacobson MN, RN www.cardionursing.com 22
Drug and Electrolyte Effects
ECG changes are nonspecific and many can occur with either drug effect or electrolyte imbalances
QRS width
ST segment
T waves
QT interval
ECG is suggestive but not diagnostic
Carol Jacobson MN, RN www.cardionursing.com 23
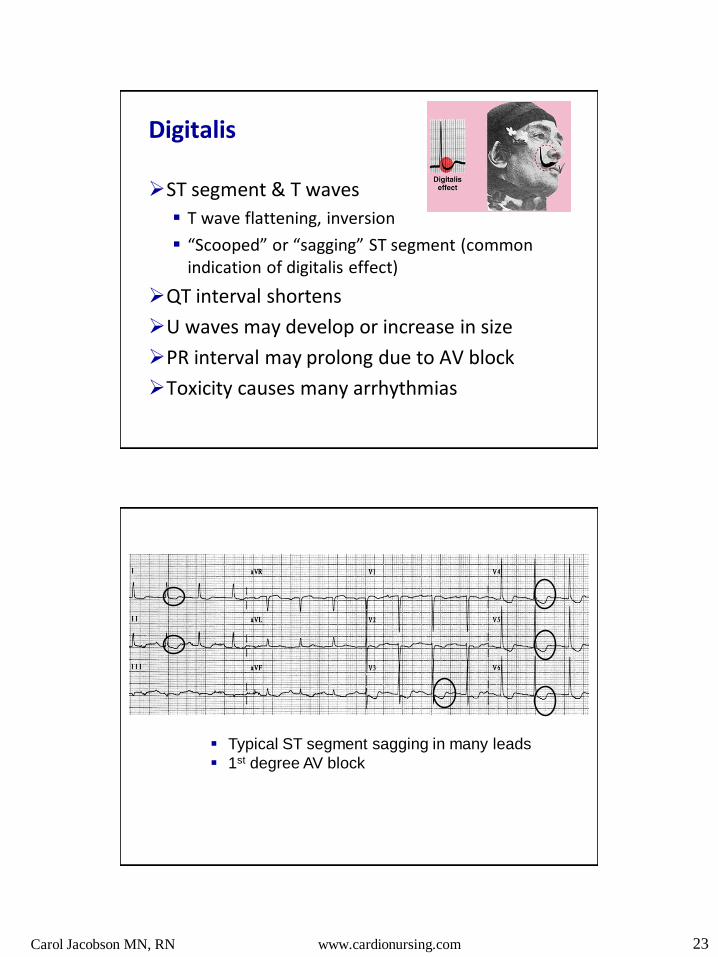
Digitalis
ST segment & T waves
T wave flattening, inversion
“Scooped” or “sagging” ST segment (common indication of digitalis effect)
QT interval shortens
U waves may develop or increase in size
PR interval may prolong due to AV block
Toxicity causes many arrhythmias
Typical ST segment sagging in many leads
1st degree AV block
Carol Jacobson MN, RN www.cardionursing.com 24
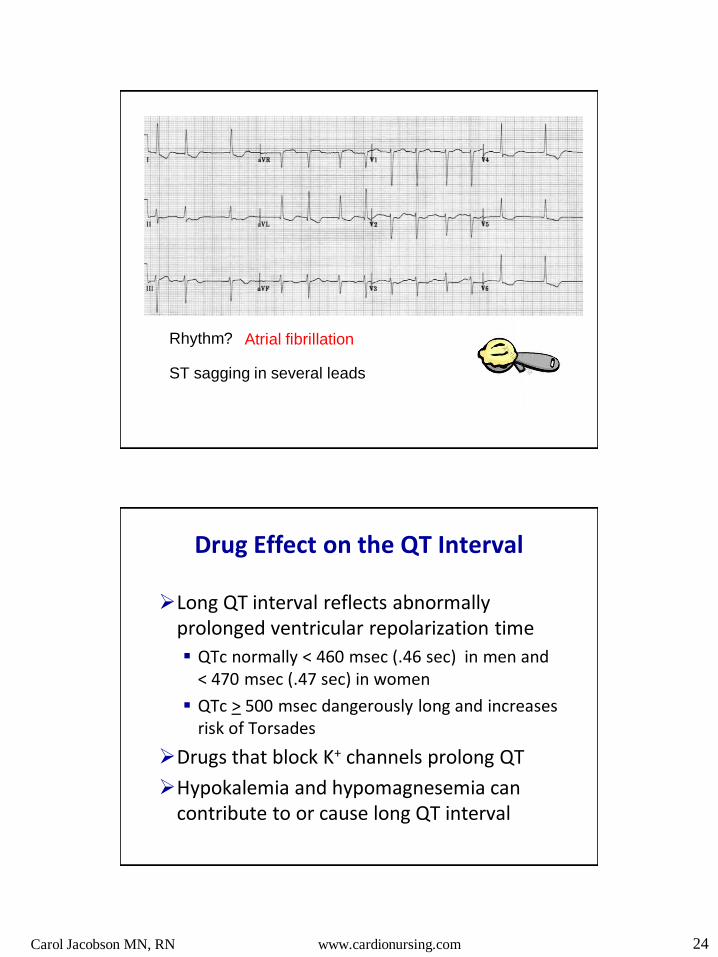
Rhythm? Atrial fibrillation
ST sagging in several leads
Drug Effect on the QT Interval
Long QT interval reflects abnormally prolonged ventricular repolarization time
QTc normally < 460 msec (.46 sec) in men and < 470 msec (.47 sec) in women
QTc > 500 msec dangerously long and increases risk of Torsades
Drugs that block K+ channels prolong QT
Hypokalemia and hypomagnesemia can contribute to or cause long QT interval

Carol Jacobson MN, RN www.cardionursing.com 25
What You Should Know About the QT Interval
QT interval is heart rate dependent
Shortens at fast heart rates (short R-R interval)
Lengthens at slow heart rates (long R-R interval)
Measurement must be corrected for heart rate
Bazett formula often used for correction
Guestimate: QT should be no more than half the preceding R-R interval
QTc = QT
√ R-R All measurements in seconds
Drugs That Prolong the QT Interval www.crediblemeds.org
Antiarrhythmics Class IA: quinidine, procainamide, disopyramide
Class III: sotalol, ibutilide, dofetilide, amiodarone
Antidepressants (tricyclics most common)
Anti-psychotics (thorazine, haldol, many others)
Antibiotics (erythromycin, pentamidine, levaquin, many others)
Anticonvulsants (carbamazepine)
Anti-fungals
Carol Jacobson MN, RN www.cardionursing.com 26
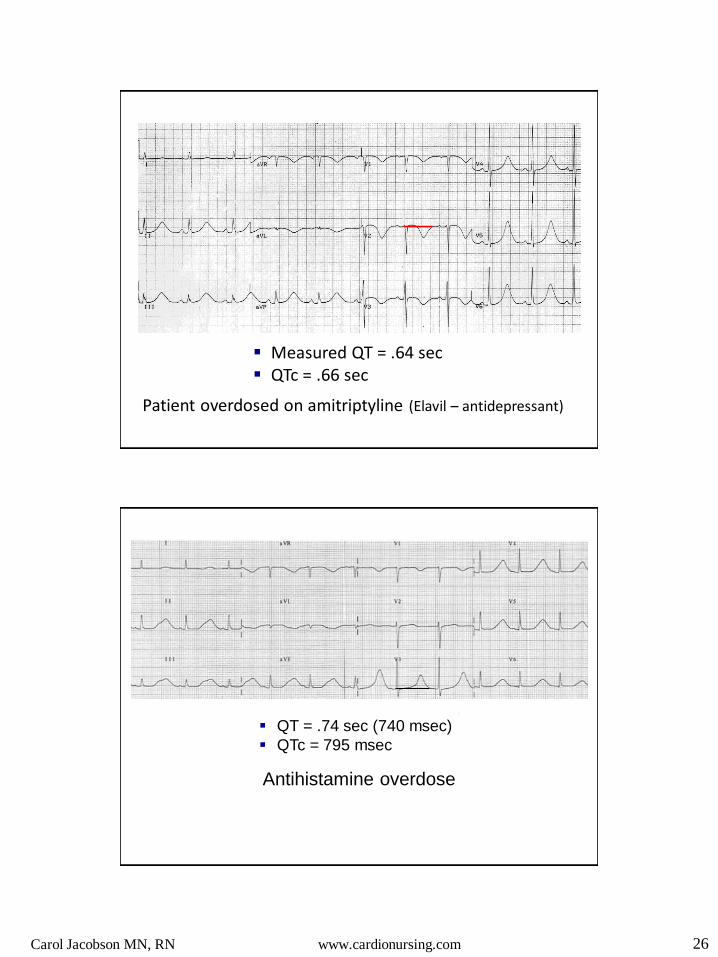
Patient overdosed on amitriptyline (Elavil – antidepressant)
Measured QT = .64 sec QTc = .66 sec
Antihistamine overdose
QT = .74 sec (740 msec)
QTc = 795 msec
Carol Jacobson MN, RN www.cardionursing.com 27
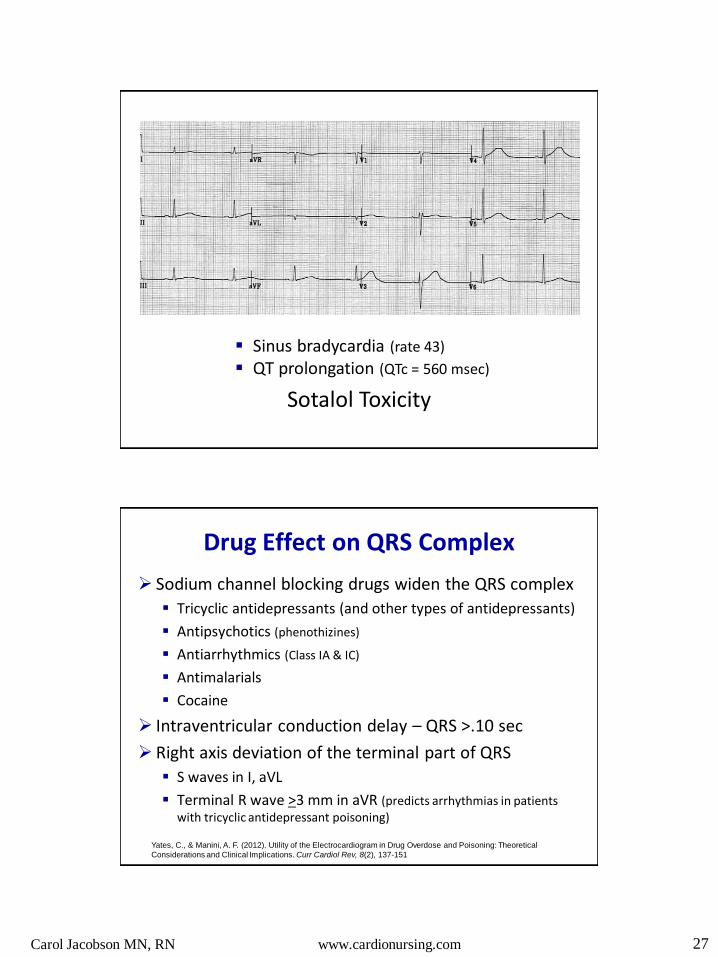
Sinus bradycardia (rate 43)
QT prolongation (QTc = 560 msec)
Sotalol Toxicity
Drug Effect on QRS Complex
Sodium channel blocking drugs widen the QRS complex
Tricyclic antidepressants (and other types of antidepressants)
Antipsychotics (phenothizines)
Antiarrhythmics (Class IA & IC)
Antimalarials
Cocaine
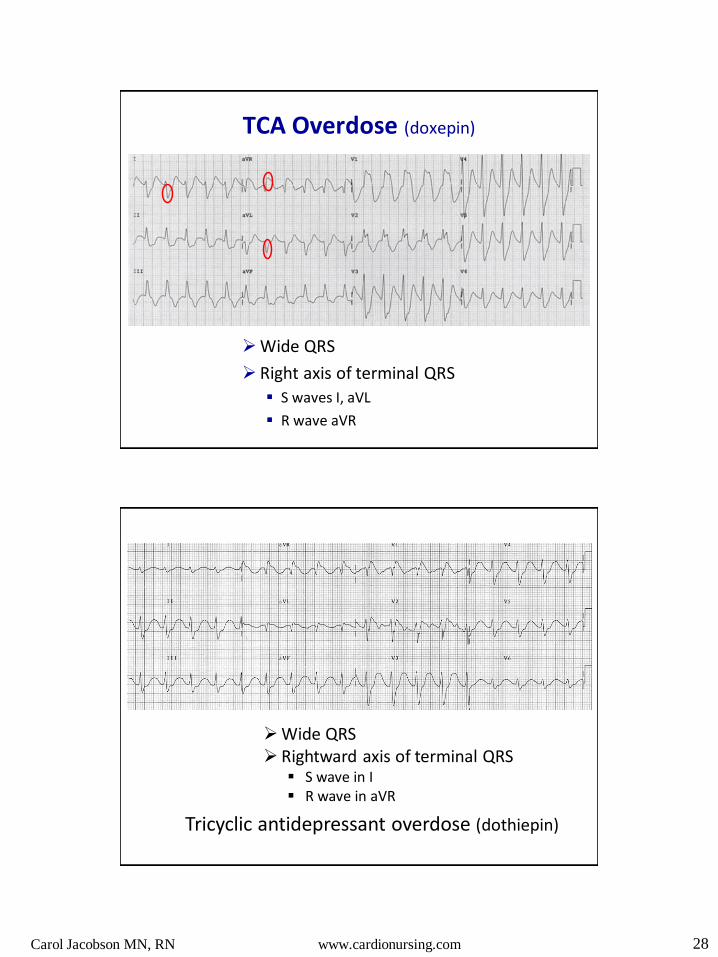
Intraventricular conduction delay – QRS >.10 sec
Right axis deviation of the terminal part of QRS
S waves in I, aVL
Terminal R wave >3 mm in aVR (predicts arrhythmias in patients with tricyclic antidepressant poisoning)
Yates, C., & Manini, A. F. (2012). Utility of the Electrocardiogram in Drug Overdose and Poisoning: Theoretical
Considerations and Clinical Implications. Curr Cardiol Rev, 8(2), 137-151
Carol Jacobson MN, RN www.cardionursing.com 28
TCA Overdose (doxepin)
Wide QRS
Right axis of terminal QRS
S waves I, aVL
R wave aVR
Tricyclic antidepressant overdose (dothiepin)
Wide QRS Rightward axis of terminal QRS
S wave in I R wave in aVR

Carol Jacobson MN, RN www.cardionursing.com 29
Drug Effect on ST Segment, T waves, U waves
Nonspecific ST-T wave changes
T wave flattening or inversion
ST segment sagging
These are primary ST-T changes due to changes in repolarization of the cardiac action potential (not secondary to abnormal depolarization)
Enlarged U waves
U
U U
Patient on digoxin and quinidine Rollercoaster appearance of ST-T waves Hypokalemia can cause large U waves too
Carol Jacobson MN, RN www.cardionursing.com 30
Potassium
Calcium
Magnesium
Electrolyte Effects
Nonspecific ST-T changes
ECG is suggestive, not diagnostic
K+ and Ca++ imbalances can cause ECG changes
Heart is significantly affected by too much or too little potassium
Mg++ imbalances don’t affect ECG but can cause arrhythmias
Carol Jacobson MN, RN www.cardionursing.com 31
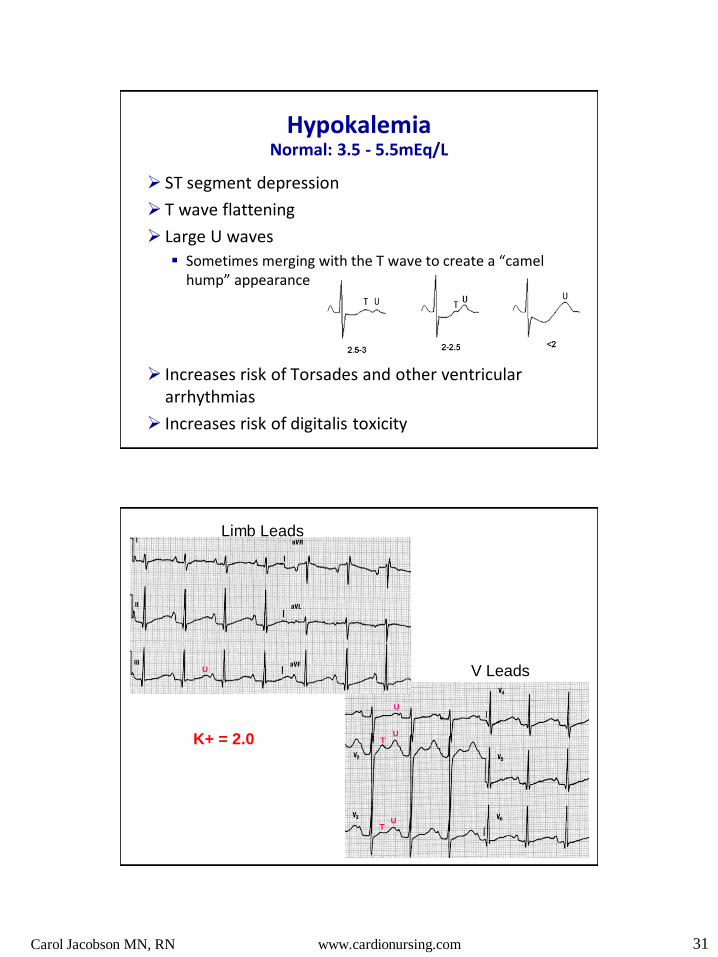
Hypokalemia Normal: 3.5 - 5.5mEq/L
ST segment depression
T wave flattening
Large U waves
Sometimes merging with the T wave to create a “camel hump” appearance
Increases risk of Torsades and other ventricular arrhythmias
Increases risk of digitalis toxicity
U
U T
U T
U
Limb Leads
V Leads
K+ = 2.0
Carol Jacobson MN, RN www.cardionursing.com 32
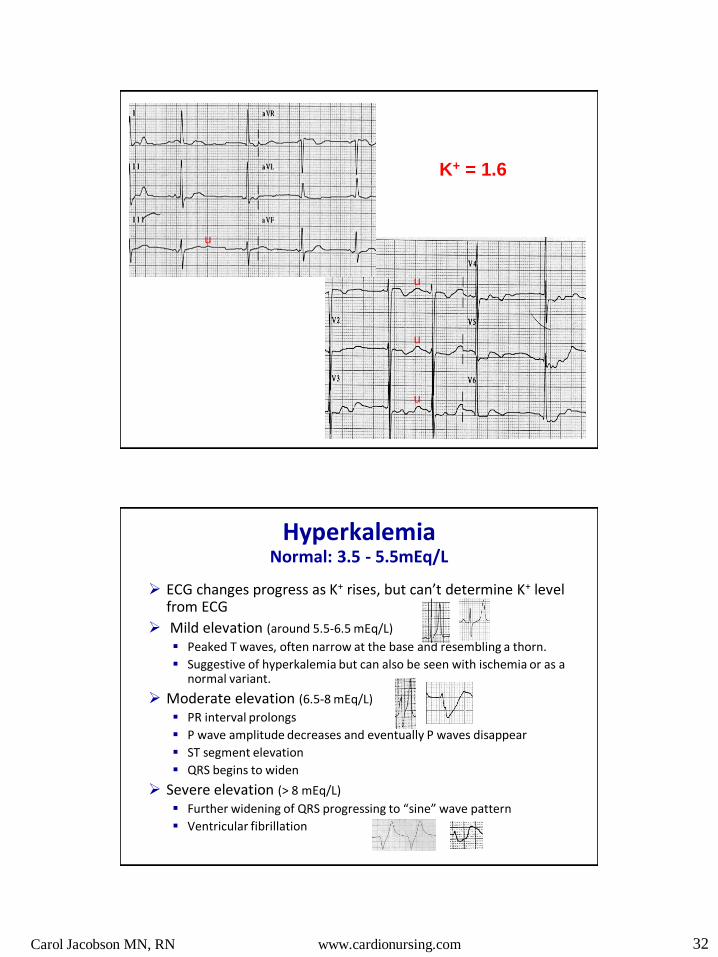
K+ = 1.6
u
u
u
u
Hyperkalemia Normal: 3.5 - 5.5mEq/L
ECG changes progress as K+ rises, but can’t determine K+ level from ECG
Mild elevation (around 5.5-6.5 mEq/L) Peaked T waves, often narrow at the base and resembling a thorn.
Suggestive of hyperkalemia but can also be seen with ischemia or as a normal variant.
Moderate elevation (6.5-8 mEq/L) PR interval prolongs
P wave amplitude decreases and eventually P waves disappear
ST segment elevation
QRS begins to widen
Severe elevation (> 8 mEq/L)
Further widening of QRS progressing to “sine” wave pattern
Ventricular fibrillation

Carol Jacobson MN, RN www.cardionursing.com 33
K+ = 7.8 mEq/L
K+ = 9.6 mEq/L
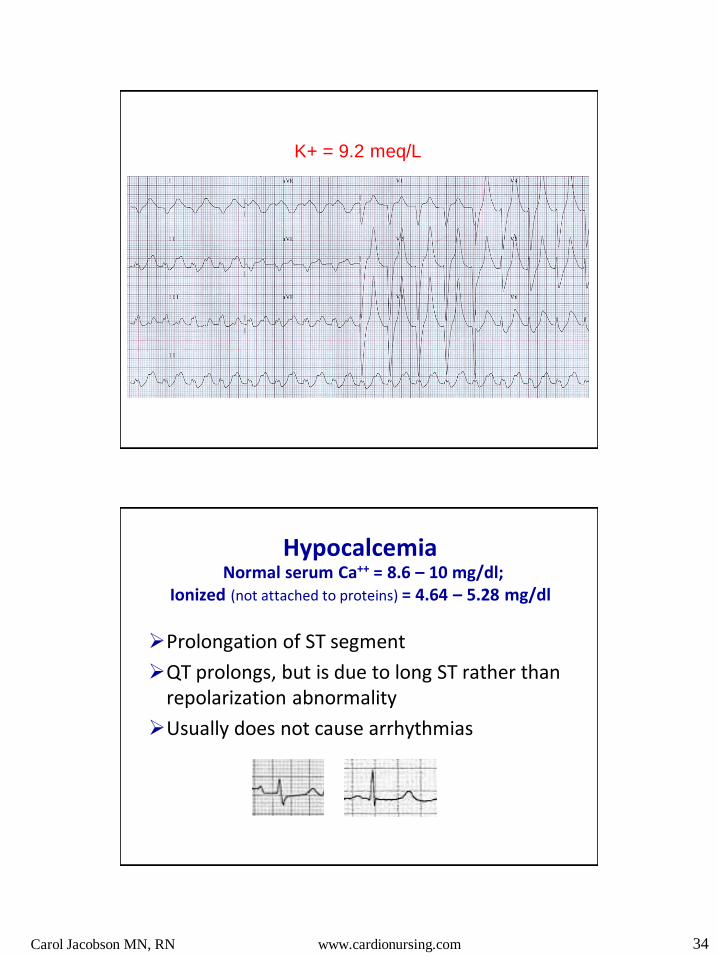
Carol Jacobson MN, RN www.cardionursing.com 34
K+ = 9.2 meq/L
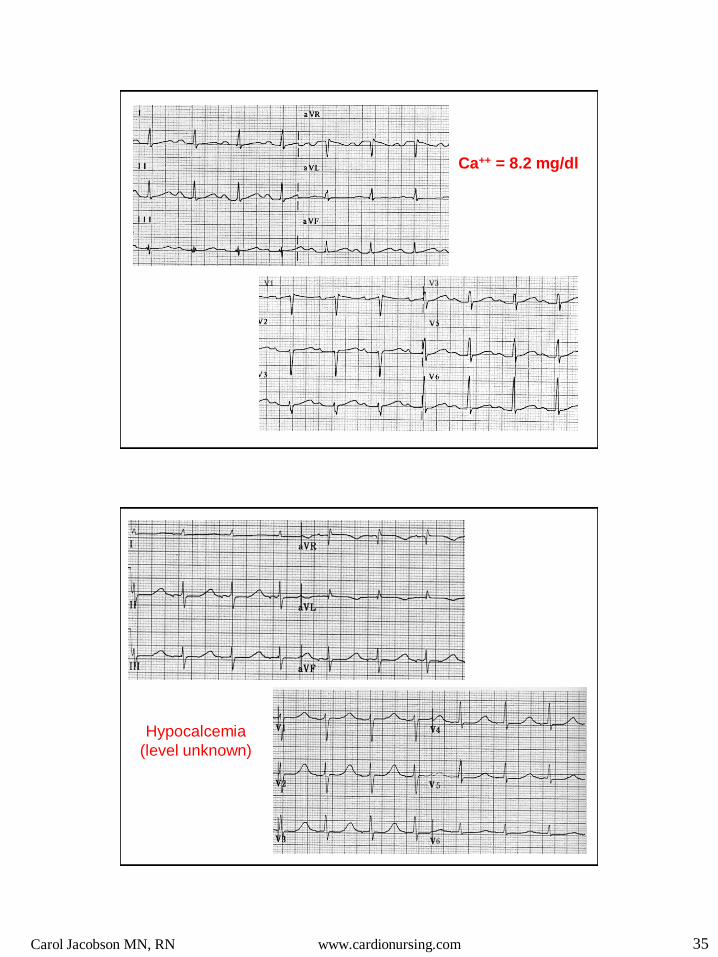
Hypocalcemia Normal serum Ca++ = 8.6 – 10 mg/dl;
Ionized (not attached to proteins) = 4.64 – 5.28 mg/dl
Prolongation of ST segment
QT prolongs, but is due to long ST rather than repolarization abnormality
Usually does not cause arrhythmias
Carol Jacobson MN, RN www.cardionursing.com 35
Ca++ = 8.2 mg/dl
V1 V3
Hypocalcemia
(level unknown)

Carol Jacobson MN, RN www.cardionursing.com 36
Hypercalcemia
Short ST segment
End of QRS takes off to peak of T wave
This can also occur with acute STEMI
Short QT interval
Osbourn waves (J waves) at end of QRS with severe hypercalcemia
VF can occur with severe hypercalcemia
Hypercalcemia

Carol Jacobson MN, RN www.cardionursing.com 37
ECG of a 41-year old man with parathyroid cancer who
presented to ED with a serum calcium of 24.4 mg/dl.
He had a VF arrest not long after this ECG was taken.
The ECG in Acute
Coronary Syndromes Signs of Increased Risk for Complications

Carol Jacobson MN, RN www.cardionursing.com 38
ECG Changes in ACS
ECG Criteria for STEMI: ST elevation at the J point of 1mm or more in at least two contiguous leads
I
II
III
aVR
aVL
aVF
V1
V2
V3
V4
V5
V6
Inferior Wall:
II, III, aVF
Lateral Wall:
I, aVL, V5, V6
Anterior Wall: V1-V4
Septum: V1, V2
(Circ)
(Circ) (Circ)
(Circ)
(RCA)
(RCA) (RCA)
(LAD)
(LAD)
(LAD)
(LAD)

Carol Jacobson MN, RN www.cardionursing.com 39
Threshold Values for Abnormal ST Changes (J point elevation)
Men > 40 years old 2 mm in V2 and V3 1 mm in all other leads
Men < 40 years old 2.5 mm in V2 and V3
Women 1.5 mm in V2 and V3 1 mm in all other leads
Men and women 0.5 mm in V3R and V4R (right ventricle) 0.5 mm in V7-V9 (posterior wall)
Men and women: J point depression 0.5 mm
in V2 and V3 1 mm in all other leads
Wagner, G. S., et al. (2009). AHA/ACCF/HRS recommendations for the standardization and
interpretation of the electrocardiogram: part VI: acute ischemia/infarction. Circulation, 119, e262– e270.
There should be no ST
elevation in limb leads and
no ST depression in V leads
Primary versus Secondary ST Segment and T Wave Changes
Secondary ST-T wave abnormalities
Repolarization abnormality due to depolarization abnormality (BBB, WPW, ventricular beats, ventricular hypertrophy)
ST segment and T waves directed opposite to terminal QRS (discordant)
Primary ST-T wave abnormalities
Due to abnormalities unrelated to abnormal depolarization (ischemia, drug effect, electrolytes, pericarditis, PE, Wellens Syndrome)
V1
V1
V2
Hanna, E. B., & Glancy, D. L. (2011). ST-segment depression and T-wave inversion: Classification, differential
diagnosis, and caveats. Cleveland Clinic Journal of Medicine, 78, 404- 414

Carol Jacobson MN, RN www.cardionursing.com 40
Terminal T wave
inversion
• Wellen’s Syndrome when seen with unstable angina in
V2, V3 = ischemia due to critical proximal LAD stenosis
• Expected during evolution of STEMI as ST elevation
resolves and T waves invert
Deep symmetrical T wave Inversion
V2
• Ischemia if no Q waves of infarction
• Commonly follows terminal T wave inversion
in Wellen’s Syndrome
• Expected evolution of T waves following
infarction
T wave inversion where it should be upright
• Ischemia
• Ventricular hypertrophy
aVF aVL
T Wave Inversion
ST Segment
Depression
Carol Jacobson MN, RN www.cardionursing.com 41
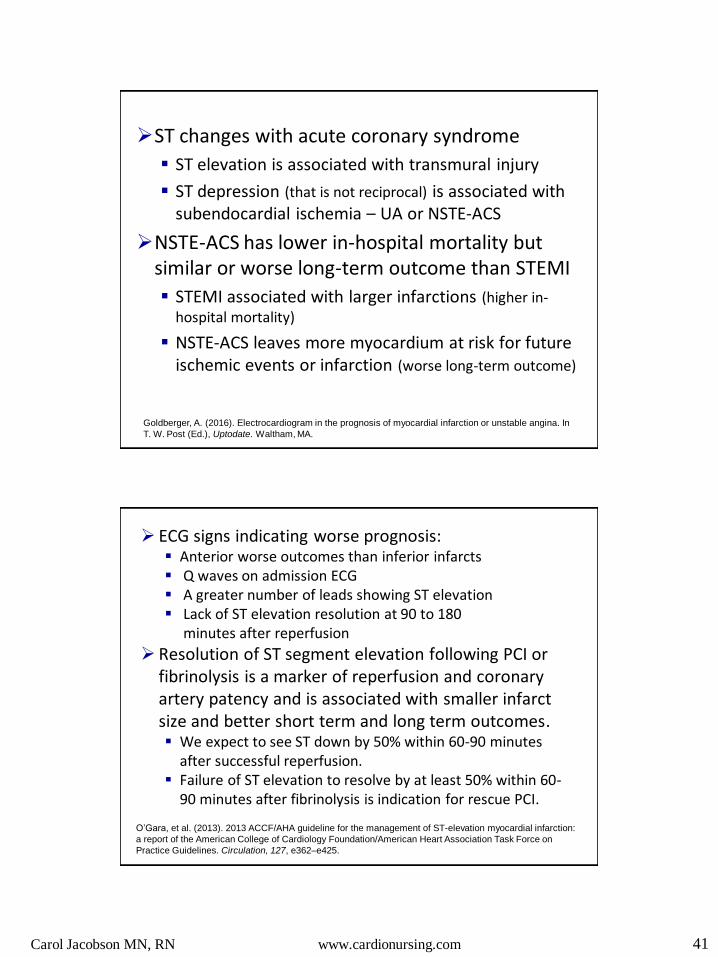
ST changes with acute coronary syndrome
ST elevation is associated with transmural injury
ST depression (that is not reciprocal) is associated with subendocardial ischemia – UA or NSTE-ACS
NSTE-ACS has lower in-hospital mortality but similar or worse long-term outcome than STEMI
STEMI associated with larger infarctions (higher in-hospital mortality)
NSTE-ACS leaves more myocardium at risk for future ischemic events or infarction (worse long-term outcome)
Goldberger, A. (2016). Electrocardiogram in the prognosis of myocardial infarction or unstable angina. In
T. W. Post (Ed.), Uptodate. Waltham, MA.
ECG signs indicating worse prognosis: Anterior worse outcomes than inferior infarcts Q waves on admission ECG A greater number of leads showing ST elevation Lack of ST elevation resolution at 90 to 180
minutes after reperfusion
Resolution of ST segment elevation following PCI or fibrinolysis is a marker of reperfusion and coronary artery patency and is associated with smaller infarct size and better short term and long term outcomes. We expect to see ST down by 50% within 60-90 minutes
after successful reperfusion. Failure of ST elevation to resolve by at least 50% within 60-
90 minutes after fibrinolysis is indication for rescue PCI.
O’Gara, et al. (2013). 2013 ACCF/AHA guideline for the management of ST-elevation myocardial infarction:
a report of the American College of Cardiology Foundation/American Heart Association Task Force on
Practice Guidelines. Circulation, 127, e362–e425.
Carol Jacobson MN, RN www.cardionursing.com 42
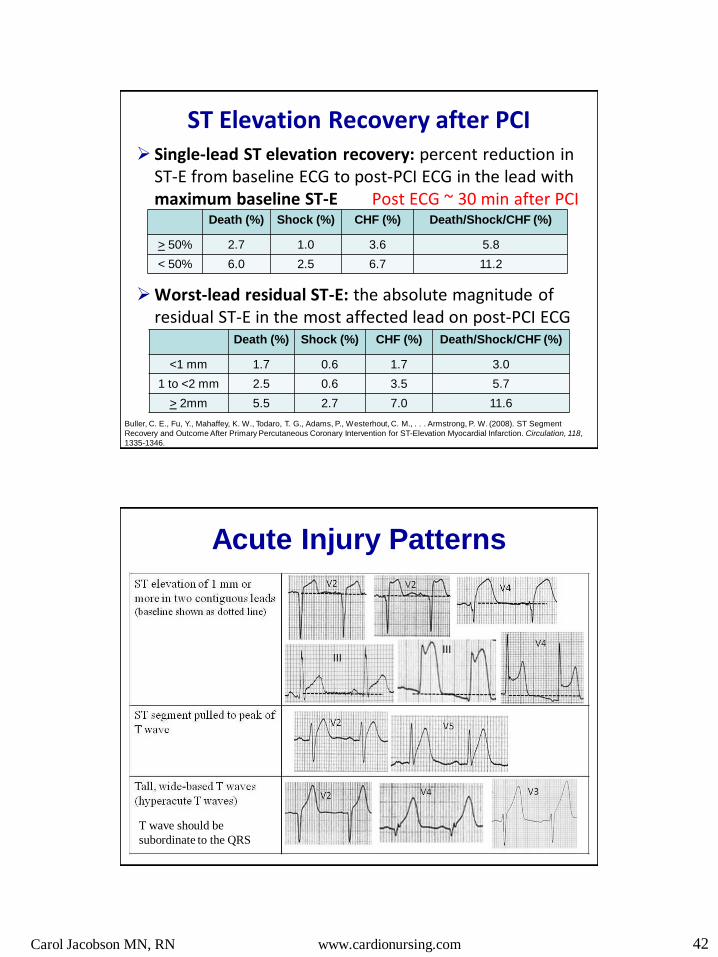
ST Elevation Recovery after PCI Single-lead ST elevation recovery: percent reduction in
ST-E from baseline ECG to post-PCI ECG in the lead with maximum baseline ST-E Post ECG ~ 30 min after PCI
Worst-lead residual ST-E: the absolute magnitude of residual ST-E in the most affected lead on post-PCI ECG
Buller, C. E., Fu, Y., Mahaffey, K. W., Todaro, T. G., Adams, P., Westerhout, C. M., . . . Armstrong, P. W. (2008). ST Segment
Recovery and Outcome After Primary Percutaneous Coronary Intervention for ST-Elevation Myocardial Infarction. Circulation, 118,
1335-1346.
Death (%) Shock (%) CHF (%) Death/Shock/CHF (%)
> 50% 2.7 1.0 3.6 5.8
< 50% 6.0 2.5 6.7 11.2
Death (%) Shock (%) CHF (%) Death/Shock/CHF (%)
<1 mm 1.7 0.6 1.7 3.0
1 to <2 mm 2.5 0.6 3.5 5.7
> 2mm 5.5 2.7 7.0 11.6
Acute Injury Patterns
T wave should be
subordinate to the QRS

Carol Jacobson MN, RN www.cardionursing.com 43
Progressive Changes of Infarction
ST elevation usually first Appears within minutes of pain and can last 3-4 days
(early reperfusion drastically shortens time)
Q waves can appear immediately but more commonly appear within hours of pain Usually permanent but may disappear with early
reperfusion
T wave inversion occurs within hours and can last for months. Can return upright or remain inverted
Early return to upright is NOT a good sign!
Hyperacute T stage ST elevation stage
Evolution: T wave inversion
following reperfusion
Serial ECGs from same patient
Carol Jacobson MN, RN www.cardionursing.com 44
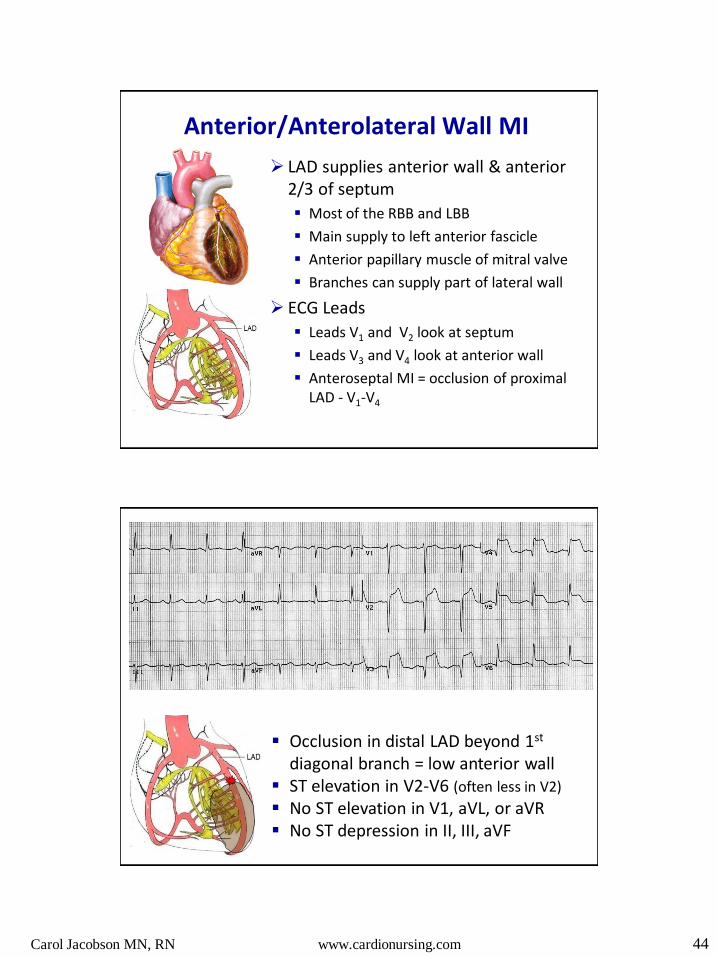
Anterior/Anterolateral Wall MI
LAD supplies anterior wall & anterior 2/3 of septum
Most of the RBB and LBB
Main supply to left anterior fascicle
Anterior papillary muscle of mitral valve
Branches can supply part of lateral wall
ECG Leads
Leads V1 and V2 look at septum
Leads V3 and V4 look at anterior wall
Anteroseptal MI = occlusion of proximal LAD - V1-V4
Occlusion in distal LAD beyond 1st diagonal branch = low anterior wall
ST elevation in V2-V6 (often less in V2)
No ST elevation in V1, aVL, or aVR No ST depression in II, III, aVF
Carol Jacobson MN, RN www.cardionursing.com 45
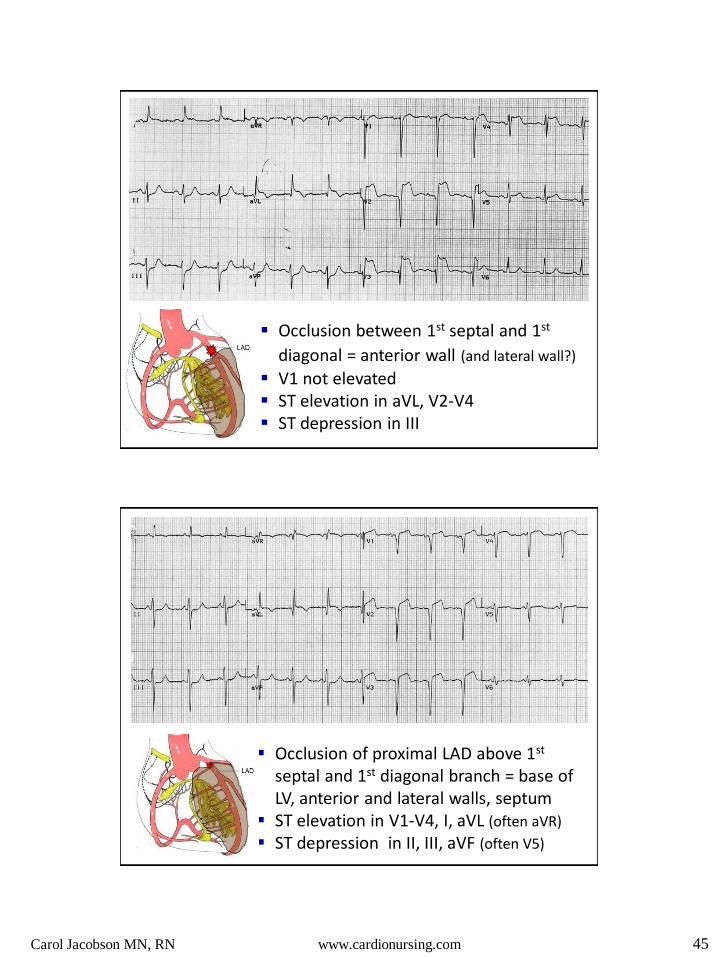
Occlusion between 1st septal and 1st
diagonal = anterior wall (and lateral wall?)
V1 not elevated ST elevation in aVL, V2-V4 ST depression in III
Occlusion of proximal LAD above 1st septal and 1st diagonal branch = base of LV, anterior and lateral walls, septum
ST elevation in V1-V4, I, aVL (often aVR)
ST depression in II, III, aVF (often V5)

Carol Jacobson MN, RN www.cardionursing.com 46
ST elevation in anterior and inferior leads
Wellens Syndrome
History of unstable angina ECG Changes (present without chest pain)
Terminal T wave inversion V1-V4 (especially V2,V3) (24%) OR deep symmetrical T wave inversion V1-V4 (76%)
No Q waves No or minimal (<1 mm) ST elevation Normal R wave progression
Normal or minimally elevated cardiac biomarkers Indicates critical proximal LAD stenosis It not treated can result in large anterior MI
75% of patients in original study infarcted within a mean of 8 days if not reperfused
de Zwaan C, Bar FW, Wellens HJ. Characteristic electrocardiographic pattern indicating a critical stenosis
high in left anterior descending coronary artery in patients admitted because of impending myocardial
infarction. Am Heart J. 1982 Apr. 103(4 Pt 2):730-6.
Carol Jacobson MN, RN www.cardionursing.com 47
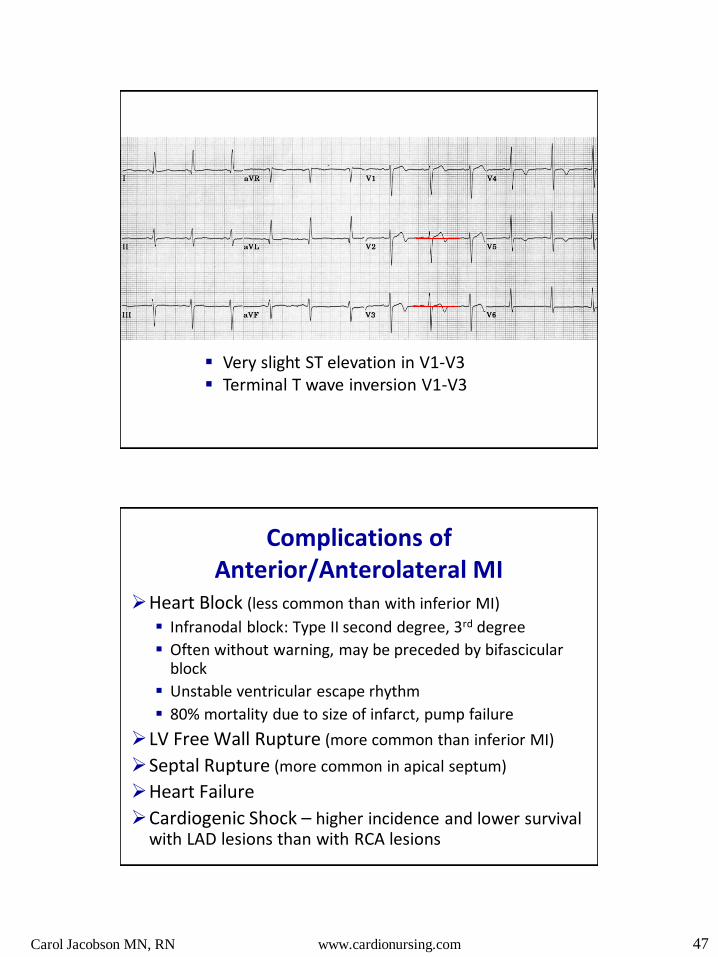
Very slight ST elevation in V1-V3 Terminal T wave inversion V1-V3
Complications of Anterior/Anterolateral MI
Heart Block (less common than with inferior MI)
Infranodal block: Type II second degree, 3rd degree
Often without warning, may be preceded by bifascicular block
Unstable ventricular escape rhythm
80% mortality due to size of infarct, pump failure
LV Free Wall Rupture (more common than inferior MI)
Septal Rupture (more common in apical septum)
Heart Failure
Cardiogenic Shock – higher incidence and lower survival with LAD lesions than with RCA lesions

Carol Jacobson MN, RN www.cardionursing.com 48
Inferior Wall Blood Supply RCA is the dominant artery in ~ 90% of people
Circumflex is dominant in ~ 10% of people
The dominant artery provides the posterior descending artery that supplies the inferior wall, posterior 1/3 of septum, and the AV node
RCA
Posterior Descending
Circumflex
Posterior
Descending
Inferior STEMI ST elevation only in II, III, aVF can be due to RCA or
Circumflex occlusion (whichever is dominant) With RCA occlusion, ST elevation in III > II and there is
reciprocal ST depression in aVL and lead I With LCx occlusion, ST elevation in II often > III and there
may be ST elevation in I and aVL (lateral wall involvement)
ST depression in V1-V3 can be due to RCA or LCx occlusion and is indicative of posterior wall MI Absence of ST depression in V1-V3 more common with RCA
occlusion
ST depression in V leads is associated with larger infarcts, higher incidence of 3-vessel disease, and more complications
Wagner, G. S., et al. (2009). AHA/ACCF/HRS recommendations for the standardization and interpretation of
the electrocardiogram: part VI: acute ischemia/infarction. Circulation, 119, e262– e270.
Carol Jacobson MN, RN www.cardionursing.com 49
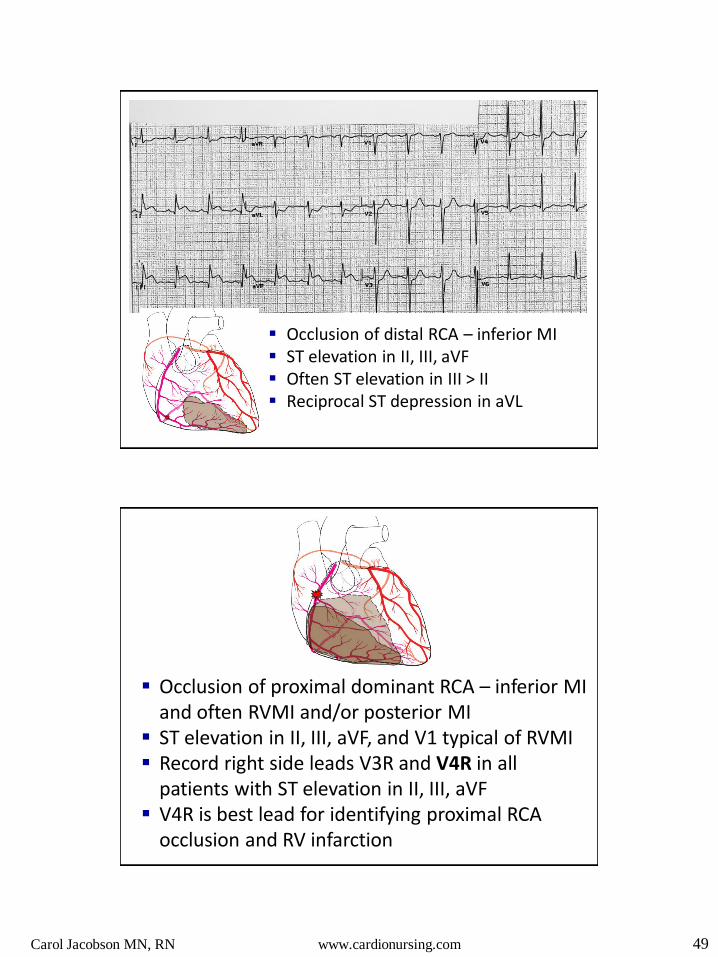
Occlusion of distal RCA – inferior MI ST elevation in II, III, aVF Often ST elevation in III > II Reciprocal ST depression in aVL
Occlusion of proximal dominant RCA – inferior MI and often RVMI and/or posterior MI
ST elevation in II, III, aVF, and V1 typical of RVMI Record right side leads V3R and V4R in all
patients with ST elevation in II, III, aVF V4R is best lead for identifying proximal RCA
occlusion and RV infarction

Carol Jacobson MN, RN www.cardionursing.com 50
12 Lead Clues to RV Infarction
ST elevation in II, III, AVF, V1
ST elevation in III > II or AVF
ST discordance between V1 and V2
ST elevation II, III, aVF, V1 ST III > II ST discordant between V1 and V2 Reciprocal ST depression I, aVL

Carol Jacobson MN, RN www.cardionursing.com 51
Occlusion of circumflex – lateral MI if RCA is dominant artery (isolated lateral MI is rare)
• ST elevation in I, aVL, V5, V6 Occlusion of circumflex if it is dominant – lateral,
posterior, and inferior MI • ST elevation in II, III, aVF, ST depression in V1-
V3 = posterior MI
ST elevation I, aVL Reciprocal ST depression in II, III, aVF Lateral MI due to non-dominant
circumflex

Carol Jacobson MN, RN www.cardionursing.com 52
ST elevation II, III, aVF (inferior) ST elevation in V4-V6 (lateral) ST depression I, AVL (reciprocal to
inferior wall)
ST depression in V1-V3 (reciprocal to posterior wall)
Inferior / lateral MI due to dominant circumflex
ST elevation in I, V4-V6 = lateral wall ST elevation in II, III, aVF = inferior wall ST depression V1-V3 = posterior wall
(reciprocal)
Dominant circumflex artery
Carol Jacobson MN, RN www.cardionursing.com 53
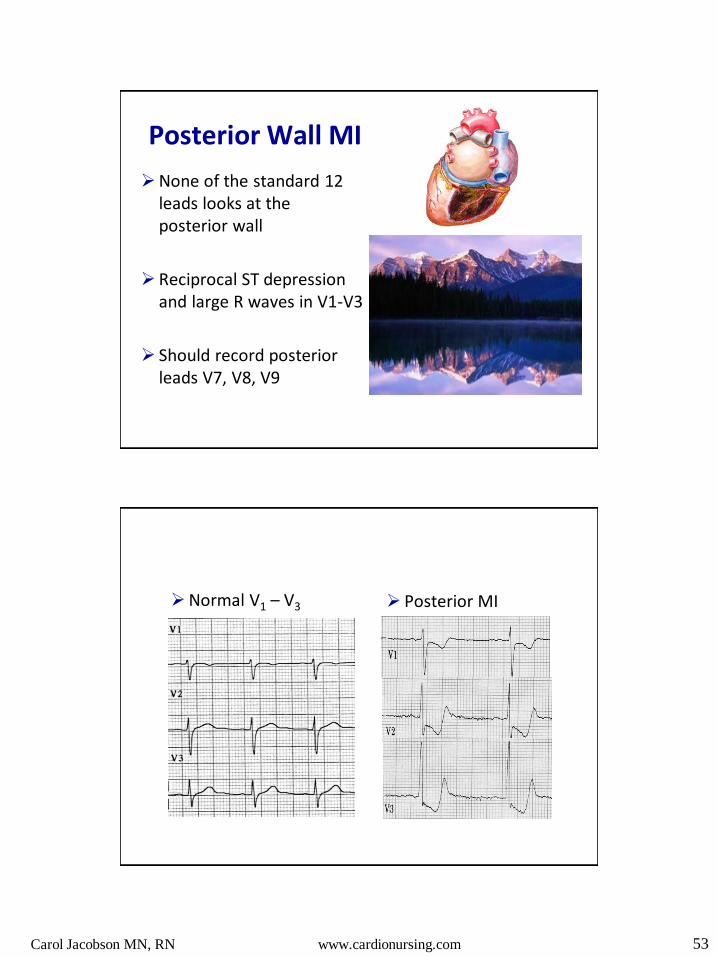
Posterior Wall MI
None of the standard 12 leads looks at the posterior wall
Reciprocal ST depression and large R waves in V1-V3
Should record posterior leads V7, V8, V9
Normal V1 – V3 Posterior MI
Carol Jacobson MN, RN www.cardionursing.com 54
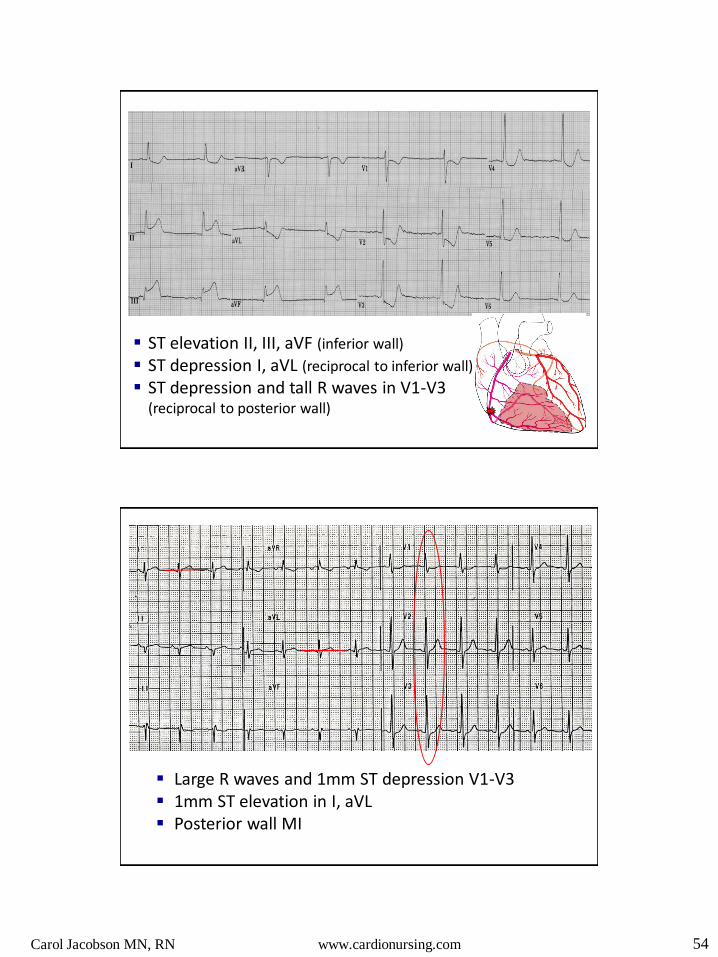
ST elevation II, III, aVF (inferior wall)
ST depression I, aVL (reciprocal to inferior wall)
ST depression and tall R waves in V1-V3 (reciprocal to posterior wall)
Large R waves and 1mm ST depression V1-V3 1mm ST elevation in I, aVL Posterior wall MI
Carol Jacobson MN, RN www.cardionursing.com 55
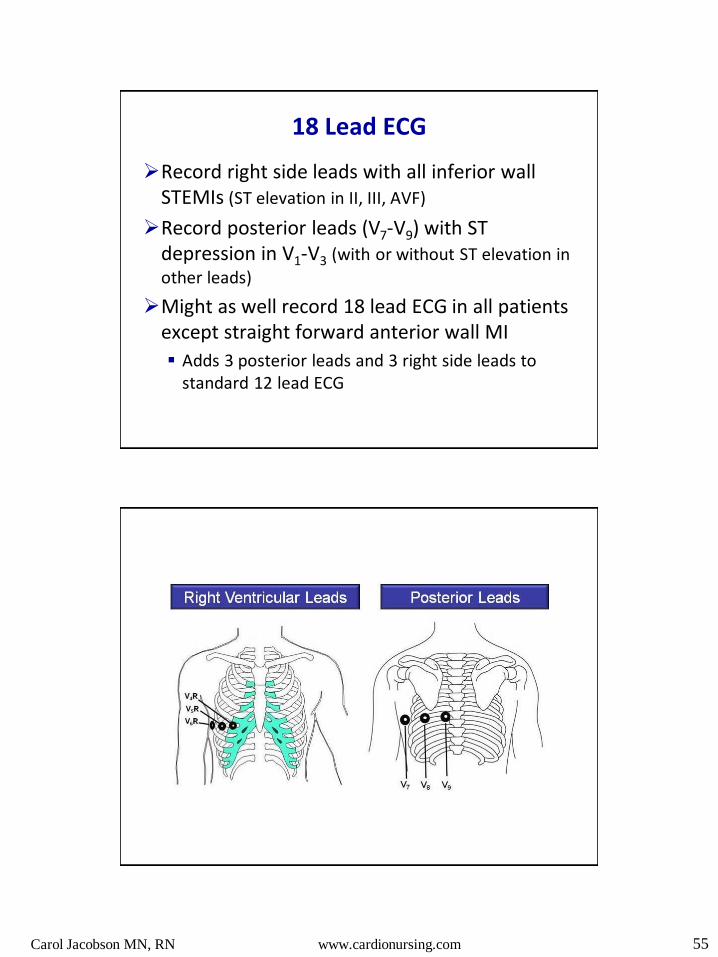
18 Lead ECG
Record right side leads with all inferior wall STEMIs (ST elevation in II, III, AVF)
Record posterior leads (V7-V9) with ST depression in V1-V3 (with or without ST elevation in
other leads)
Might as well record 18 lead ECG in all patients except straight forward anterior wall MI
Adds 3 posterior leads and 3 right side leads to standard 12 lead ECG
Carol Jacobson MN, RN www.cardionursing.com 56
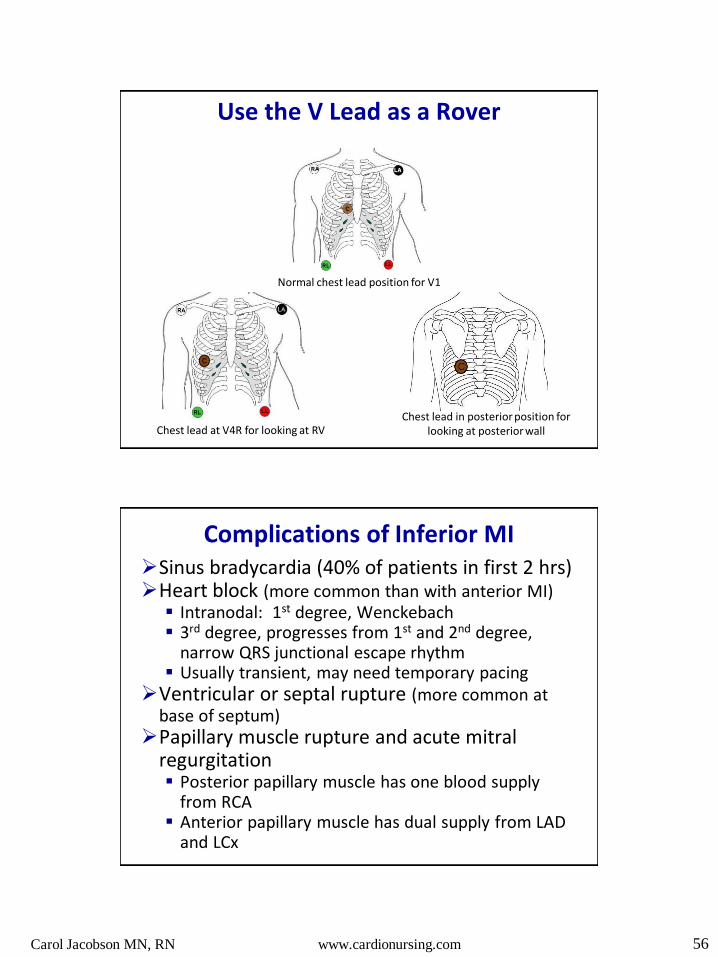
Use the V Lead as a Rover
Normal chest lead position for V1
Chest lead at V4R for looking at RV Chest lead in posterior position for
looking at posterior wall
Complications of Inferior MI Sinus bradycardia (40% of patients in first 2 hrs) Heart block (more common than with anterior MI)
Intranodal: 1st degree, Wenckebach 3rd degree, progresses from 1st and 2nd degree,
narrow QRS junctional escape rhythm Usually transient, may need temporary pacing
Ventricular or septal rupture (more common at base of septum)
Papillary muscle rupture and acute mitral regurgitation Posterior papillary muscle has one blood supply
from RCA Anterior papillary muscle has dual supply from LAD
and LCx
Carol Jacobson MN, RN www.cardionursing.com 57
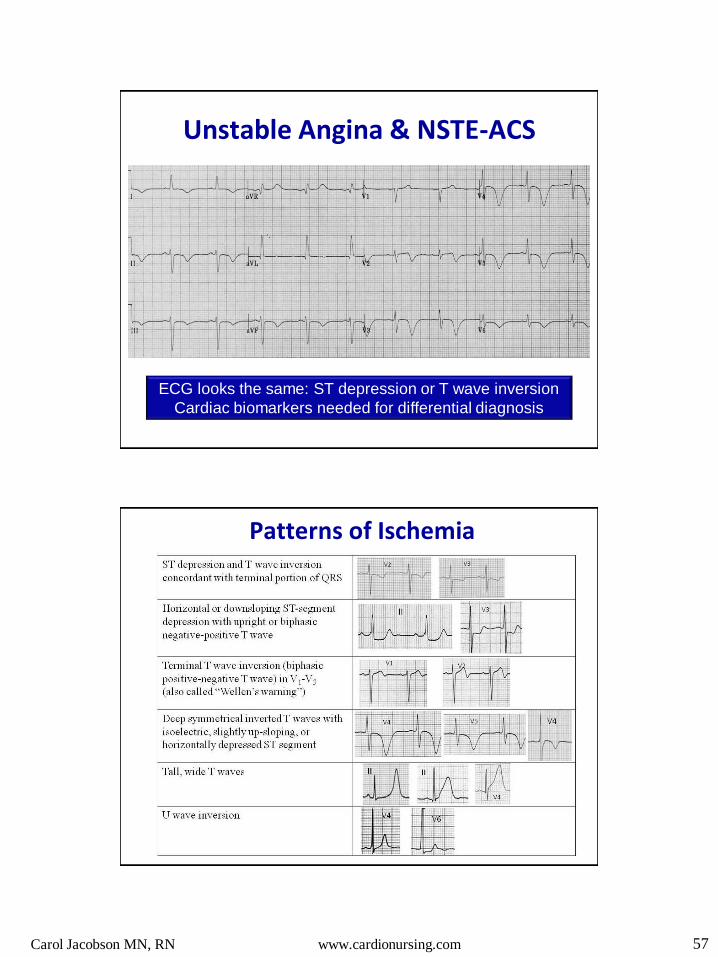
ECG looks the same: ST depression or T wave inversion
Cardiac biomarkers needed for differential diagnosis
Unstable Angina & NSTE-ACS
Patterns of Ischemia
Carol Jacobson MN, RN www.cardionursing.com 58
ECG in UA/NSTEMI
Major ECG factors that predict risk are the # of leads and location of ST segment depression.
ST depression > 2mm increases risk of death at 1 year
The more leads with ST depression the higher the 30 day mortality
ST depression is associated with worse outcome than T wave inversion alone.
Patients with ST depression more likely to benefit from early invasive strategy than those with T wave inversion
Two patterns of ST-segment depression reflect STEMI rather than NSTE-ACS ST-segment depression that is reciprocal to a
subtle and often overlooked ST-segment elevation ST-segment depression that is maximal in leads
V1-V3, suggesting true posterior infarction.
T-wave inversion in the inferior and anterior precordial leads can be seen in acute PE
Flattened T waves with prominent U waves and ST-segment depression may reflect hypokalemia or digitalis therapy.
Hanna, E. B., & Glancy, D. L. (2011). ST-segment depression and T-wave inversion: Classification,
differential diagnosis, and caveats. Cleveland Clinic Journal of M
Carol Jacobson MN, RN www.cardionursing.com 59
I
II
III
aVR
aVL
aVF
V1
V2
V3
V4
V5
V6
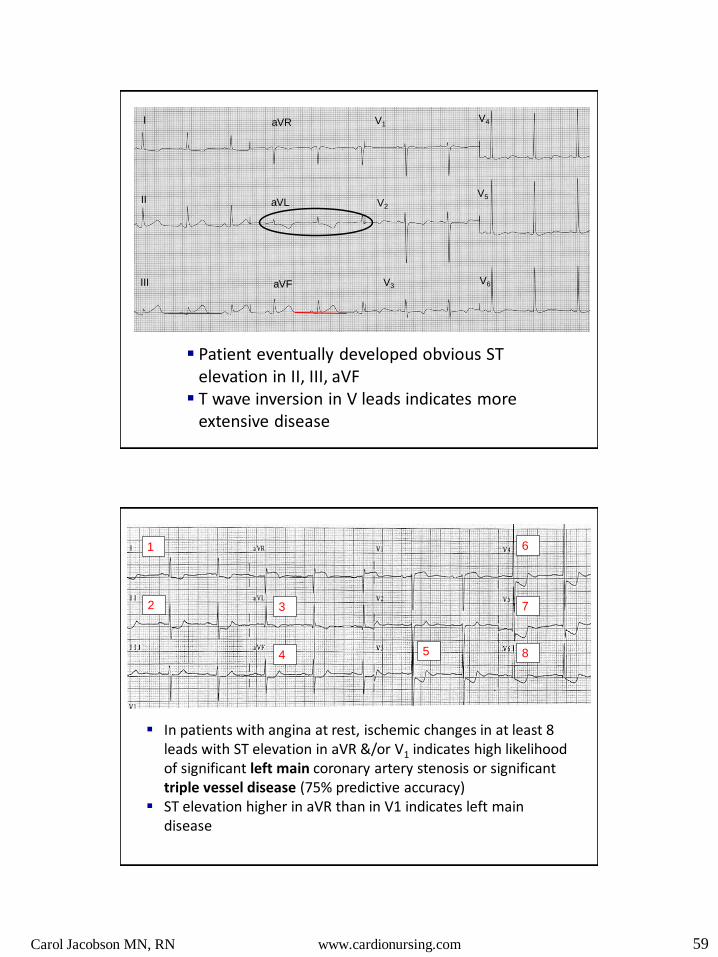
Patient eventually developed obvious ST elevation in II, III, aVF
T wave inversion in V leads indicates more extensive disease
In patients with angina at rest, ischemic changes in at least 8 leads with ST elevation in aVR &/or V1 indicates high likelihood of significant left main coronary artery stenosis or significant triple vessel disease (75% predictive accuracy)
ST elevation higher in aVR than in V1 indicates left main disease
1
2 3
4 5
6
7
8

Carol Jacobson MN, RN www.cardionursing.com 60
Why ST Elevation in aVR?
84 year old woman with chest pain and elevated troponin
1
3 4
6
5
7
8
2

Carol Jacobson MN, RN www.cardionursing.com 61
A quick case study Admission ECG
Rhythm?
Axis?
BBB?
Any signs of ischemia or infarction?
While waiting to go to cath lab a repeat ECG was
done about 15 minutes later
Axis?
BBB?
What is the risk?
Carol Jacobson MN, RN www.cardionursing.com 62
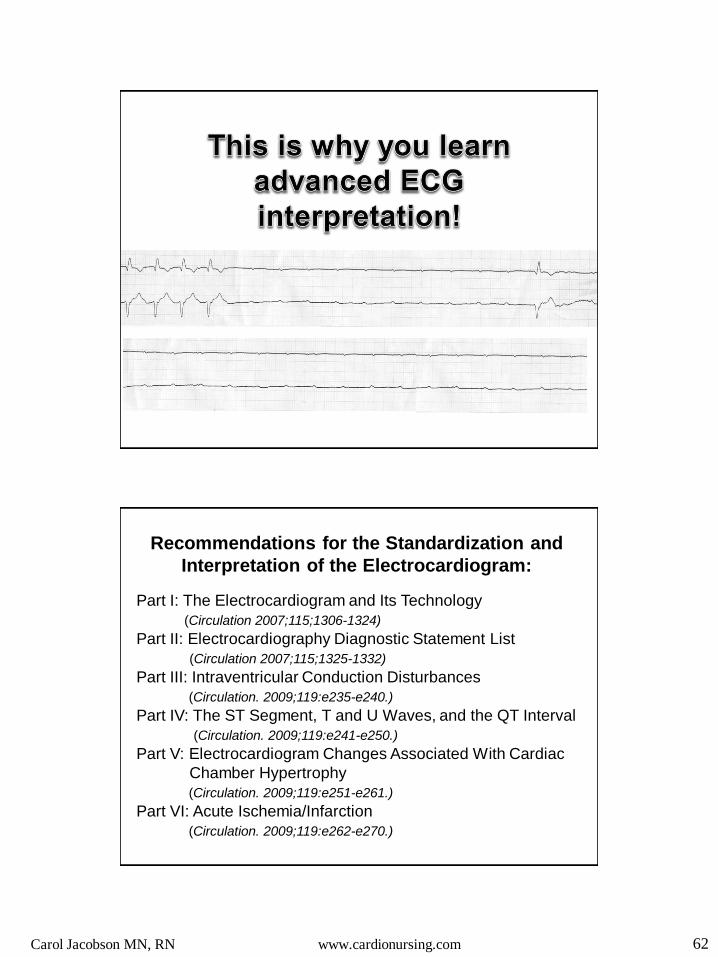
Recommendations for the Standardization and
Interpretation of the Electrocardiogram:
Part I: The Electrocardiogram and Its Technology
(Circulation 2007;115;1306-1324)
Part II: Electrocardiography Diagnostic Statement List
(Circulation 2007;115;1325-1332)
Part III: Intraventricular Conduction Disturbances
(Circulation. 2009;119:e235-e240.)
Part IV: The ST Segment, T and U Waves, and the QT Interval
(Circulation. 2009;119:e241-e250.)
Part V: Electrocardiogram Changes Associated With Cardiac
Chamber Hypertrophy
(Circulation. 2009;119:e251-e261.)
Part VI: Acute Ischemia/Infarction
(Circulation. 2009;119:e262-e270.)