Embed Size (px)
Citation preview
Environmental Evaluation
Gold Line Foothill Extension – Pasadena to Montclair Final EIR page 3-8-1 February 2007
3-8 GEOLOGIC-SEISMIC
Changes Since the Draft EIS/EIR
Subsequent to the release of the Draft EIS/EIR in April 2004, the Gold Line Phase II project has undergone several updates:
Name Change: To avoid confusion expressed about the terminology used in the Draft EIS/EIR (e.g., Phase I; Phase II, Segments 1 and 2), the proposed project is referred to in the Final EIS/EIR as the Gold Line Foothill Extension.
Selection of a Locally Preferred Alternative and Updated Project Definition: Following the release of the Draft EIS/EIR, the public comment period, and input from the cities along the alignment, the Construction Authority Board approved a Locally Preferred Alternative (LPA) in August 2004. This LPA included the Triple Track Alternative (2 LRT and 1 freight track) that was defined and evaluated in the Draft EIS/EIR, a station in each city, and the location of the Maintenance and Operations Facility. Segment 1 was changed to extend eastward to Azusa. A Project Definition Report (PDR) was prepared to define refined station and parking lot locations, grade crossings and two rail grade separations, and traction power substation locations. The Final EIS/EIR and engineering work that support the Final EIS/EIR are based on the project as identified in the Final PDR (March 2005), with the following modifications. Following the PDR, the Construction Authority Board approved a Revised LPA in June 2005. Between March and August 2005, station options in Arcadia and Claremont were added.
Changes in the Discussions: To make the Final EIS/EIR more reader-friendly, the following format and text changes have been made:
Discussion of a Transportation Systems Management (TSM) Alternative has been deleted since the LPA decision in August 2004 eliminated it as a potential preferred alternative.
Discussions of the LRT Alternatives have eliminated the breakout of the two track configurations used in the Draft EIS/EIR (Double Track and Triple Track). The Final EIS/EIR reports the impacts of a modified triple track configuration (2 LRT tracks and 1 freight track with two rail grade separations) but focuses on the phasing/geographic boundaries included in the LPA decisions.
Two LRT alternatives in the Final EIS/EIR are discussed under the general heading “Build Alternatives,” and are defined as:
1. Full Build (Pasadena to Montclair) Alternative: This alternative would extend LRT service from the existing Sierra Madre Villa Station in Pasadena through the cities of Arcadia, Monrovia, Duarte, Irwindale, Azusa, Glendora, San Dimas, La Verne, Pomona, and Claremont, terminating in Montclair. The cities from Pasadena to Azusa are also referred to in the Final EIS/EIR as Segment 1. The cities from Glendora to Montclair are also referred to in the Final EIS/EIR as Segment 2. Key changes from the Draft EIS/EIR are the inclusion of Azusa in Segment 1, the elimination of the Pacific Electric right-of-way option between Claremont and Montclair, the inclusion of a 24-acre Maintenance and Operations facility in Irwindale (the site is smaller than in the Draft EIS/EIR), and the addition of two rail grade separations. Note that the Maintenance and Operations Facility is located in Segment 1 but is part of the Full Build Alternative. In other words, it would not be constructed as an element of the Build LRT to Azusa Alternative (described below). The length of the alternative is approximately 24 miles. One station (and parking) would be located in each city, except for
Environmental Evaluation
Gold Line Foothill Extension – Pasadena to Montclair Final EIR page 3-8-2 February 2007
Azusa, which would have two. There are two options for the station locations in Arcadia and Claremont. Segment 1 would include 2 LRT tracks throughout and 1 freight track between the Miller Brewing Company in Irwindale and the eastern boundary of Azusa. The freight track that now exists west of Miller Brewing, which serves a single customer in Monrovia, would be removed from service following relocation of that customer by the City of Monrovia. Segment 2 would include two LRT tracks throughout and 1 freight track between the eastern boundary of Azusa and Claremont. In Claremont, the single freight track joins up with the double Metrolink tracks (which are also used for freight movement) and continues through to Montclair (and beyond). This alternative also includes two railroad grade separations (in Azusa and in Pomona) so that LRT tracks would pass above the at-grade freight track. These allow the LRT and freight services to operate independently (thus eliminating the time-constrained double track option discussed in the Draft EIS/EIR). Implementation of the alternative would include relocation of the existing freight track within the rail right-of-way, but there would be no changes in the service provided to customers. The alternative includes 8 new traction power substations in Segment 2, as well as the 8 in Segment 1.
2. Build LRT to Azusa Alternative: This alternative (also referred to as Segment 1) would extend LRT service from the existing Sierra Madre Villa Station in Pasadena through the cities of Arcadia, Monrovia, Duarte, Irwindale, and to the eastern boundary of Azusa. (The main change from the Draft EIS/EIR is the inclusion of the City of Azusa.) The length of the alternative is approximately 11 miles. One station (and parking facility) would be located in each city, except for Azusa, which would have two. There are two options for the station location in Arcadia. Segment 1 would include two LRT tracks throughout and 1 freight track between the Miller Brewing Company in Irwindale and the eastern boundary of Azusa. The freight track that now exists west of Miller Brewing, which serves a single customer in Monrovia, would be removed from service following relocation of that customer by the City of Monrovia. This alternative also includes the railroad grade separation in Azusa so that LRT tracks would pass above the at-grade freight track. This allows the LRT and freight services to operate independently (thus eliminating the time-constrained double track option discussed in the Draft EIS/EIR). Implementation of the alternative would include relocation of the existing freight track within the rail right-of-way, but there would be no changes in the service provided to customers. The alternative also includes 8 new traction power substations.
As in the Draft EIS/EIR, impact forecasts use 2025 conditions, except for traffic impacts, which reflects a 2030 forecast based on the recently adopted 2004 SCAG Regional Transportation Plan.
Summary of Impacts
The No Build Alternative would not have adverse/significant impact related to geologic or seismic issues.
The LRT alternatives cross areas of seismic activities and potentially unstable geomorphology that underlie the entire study area. During Preliminary engineering ongoing design studies, specific design studies would be undertaken to determine the appropriate specific design solutions. Compliance with applicable design standards should result in less than adverse/less than significant impacts.
Environmental Evaluation
Gold Line Foothill Extension – Pasadena to Montclair Final EIR page 3-8-3 February 2007
3-8.1 Existing Conditions
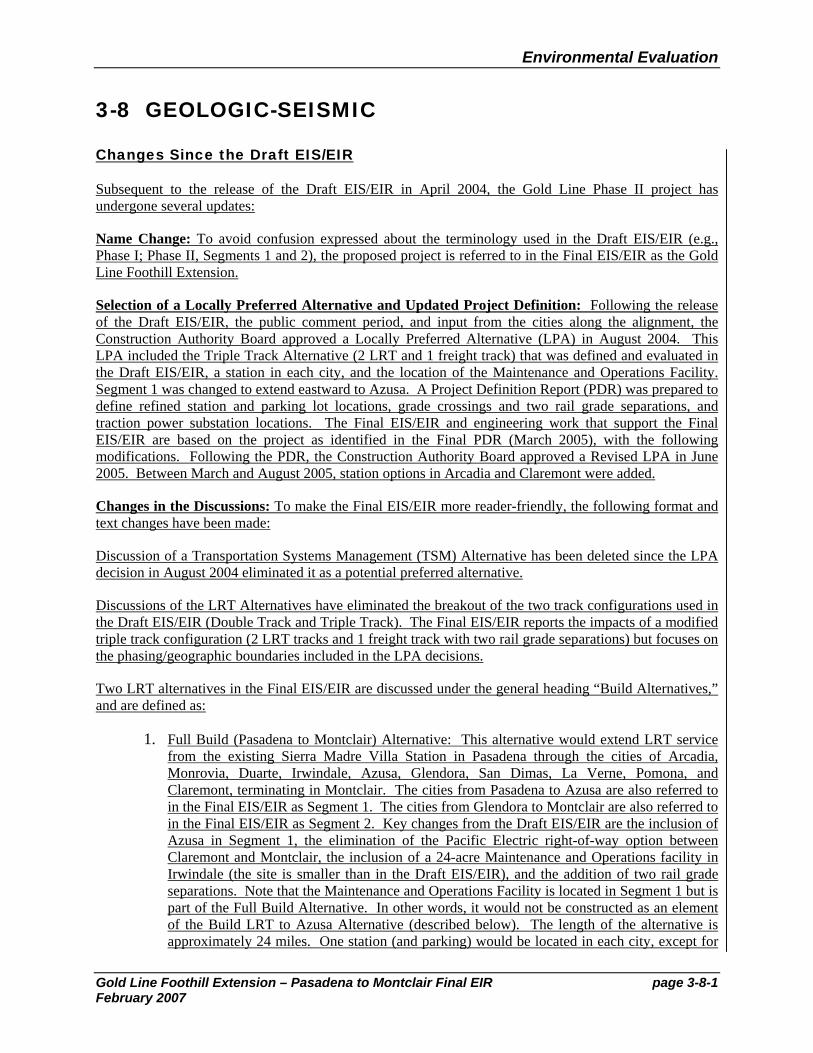
The Gold Line Phase II Foothill Extension project site is located along the Atchison-Topeka railroad right-of-way in the San Gabriel Valley (SGV). The project site consists of the existing rail alignment and an adjacent buffer zone extending 1,000 feet along both sides of the railroad. Although most of the project site lies within areas of commercial and residential development, a portion of the site is located in an open space as it crosses the San Gabriel River floodplain.
3-8.1.1 Site Description
The project site is located on generally flat to gently inclined terrain along its 24-mile length. Elevations along the alignment range from approximately 440 feet above mean sea level (msl), just west of the San Gabriel River in Duarte Alta Vista Wash in Monrovia, to 1,220 1,200 feet above msl, at the end of the line in Montclair. Elevations vary locally across major washes and rivers. The San Gabriel Mountain front lies north of the project site. Three isolated hills, South Hills, Way Hill, and the San Jose Hills, are elevated above the valley south of the mountains along the project site.
3-8.1.2 Regional Geologic Setting
The Gold Line Phase II Foothill Extension alignment is located in the Transverse Ranges geomorphic province of southern California, which extends 500 kilometers westward from the Mojave Desert to the Pacific Ocean. The project site lies within the northeastern portion of the Los Angeles Basin at the base of the San Gabriel Mountains. The Los Angeles basin is a large trough, filled with marine and non-marine sediments. Deposition of marine sediments began approximately 65 million years in a deep, structural trough that existed off the coast of southern California1. Over time, sedimentation slowly filled the trough with tremendous amounts of sediments. About 7 million years ago, as sedimentation continued, an eastward shift of the boundary between the Pacific and North American plates to its present position would begin shaping the Los Angeles Basin from this deep trough. Deformation of the basin along contractional faults acted to shorten the basin in a north-south direction and uplift the bedrock units to form hills and mountains. The Elysian, Repetto, Puente Hills, were uplifted along thrust faults beginning approximately 2 to 5 million years ago.2 Shortening of the Los Angeles Basin and San Gabriel Valley continues today along generally east-west trending faults.3
a. Local Geology
The project site passes from east to west along the northern part of the San Gabriel Valley, a structural basin extending from downtown Los Angeles to the upper Santa Ana River Valley. The San Gabriel Valley is bound to the southeast by the San Jose Hills, and to the north by the San Gabriel Mountains. It is an almost closed basin drained by three rivers, the San Gabriel River, Rio Hondo, and Arroyo Seco, from east to west, respectively. The deepest part of the San Gabriel Valley is beneath the San Gabriel River where approximately 4,000 feet of Upper Pleistocene to Holocene age (approximately 1 million years ago to recent) sediments are deposited.4 During the last few thousand years, the San Gabriel Valley has been receiving sediments shed from the surrounding mountains. Much of this sediment is transported
1 Yerkes 1972 2 Shaw and Suppe 1996 3 Shaw and Suppe 1996; Shaw et al. 2002; Fuis et al. 2001 4 California Department Water Resources 1966
Environmental Evaluation
Gold Line Foothill Extension – Pasadena to Montclair Final EIR page 3-8-4 February 2007
along the San Gabriel River and deposited as sand and gravel within the river channel and as finer sand, silt and clay on the river floodplain. In addition to these unconsolidated surficial units are bedrock units. The bedrock units underlying the variable thickness of alluvial deposits are marine and nonmarine sedimentary rocks, and extrusive and plutonic igneous rocks. The bedrock units are exposed at the foothills of the San Gabriel Mountains and in the hills south of the main mountain front (i.e., South Hills, Way Hill, and San Jose Hills) adjacent to the project site.
b. Local Geologic Units
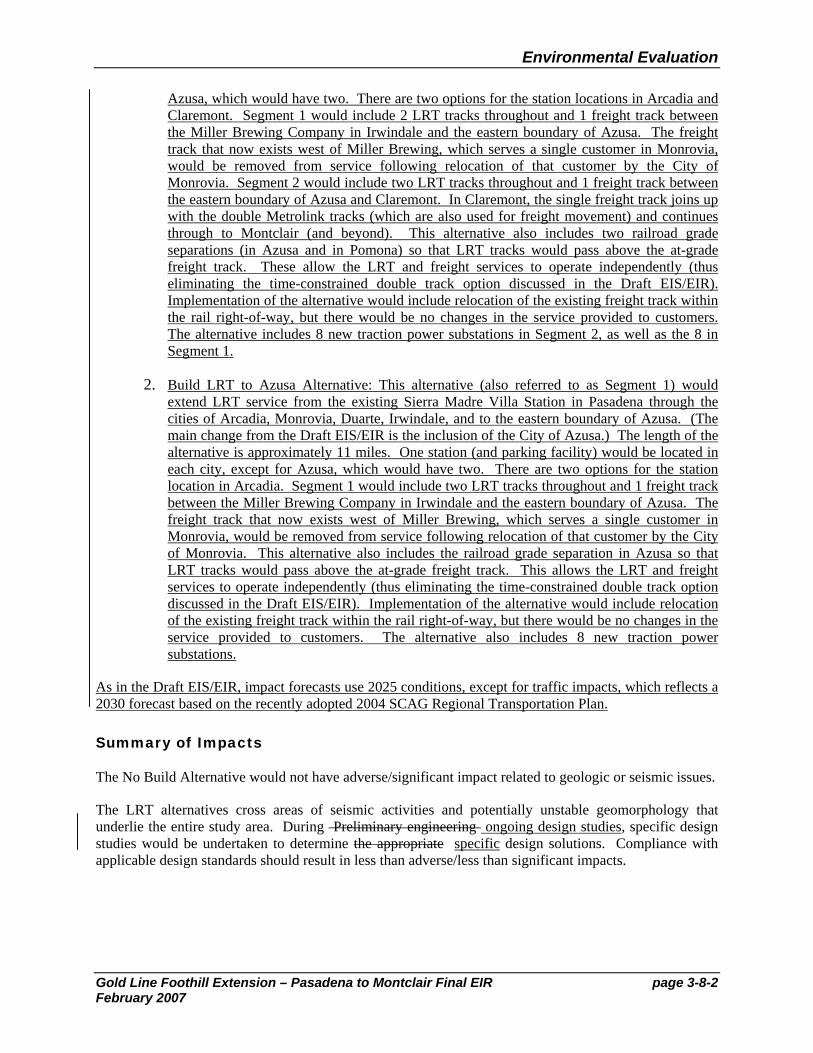
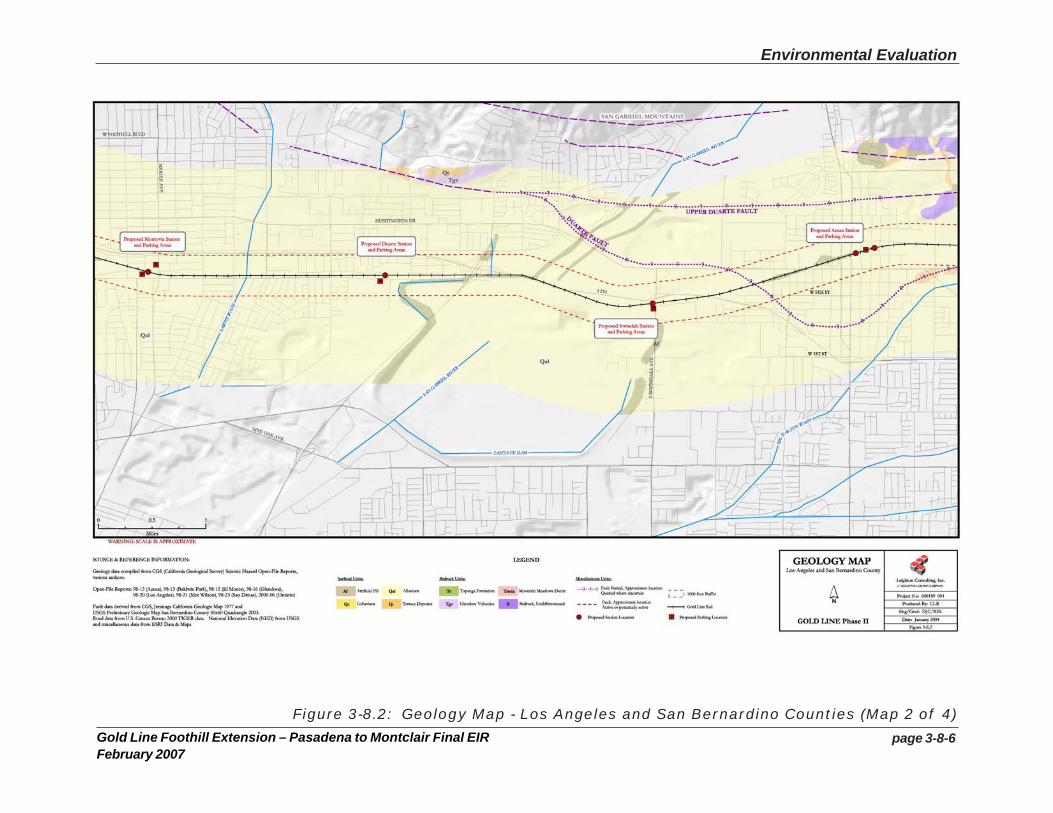
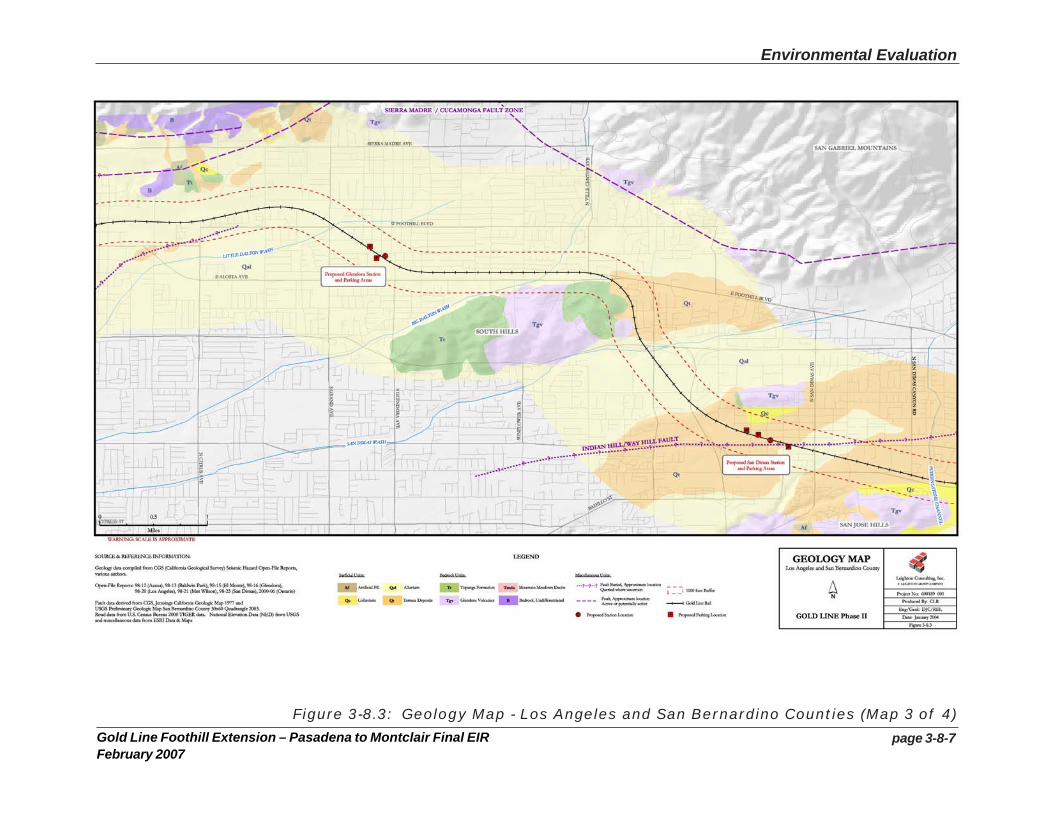
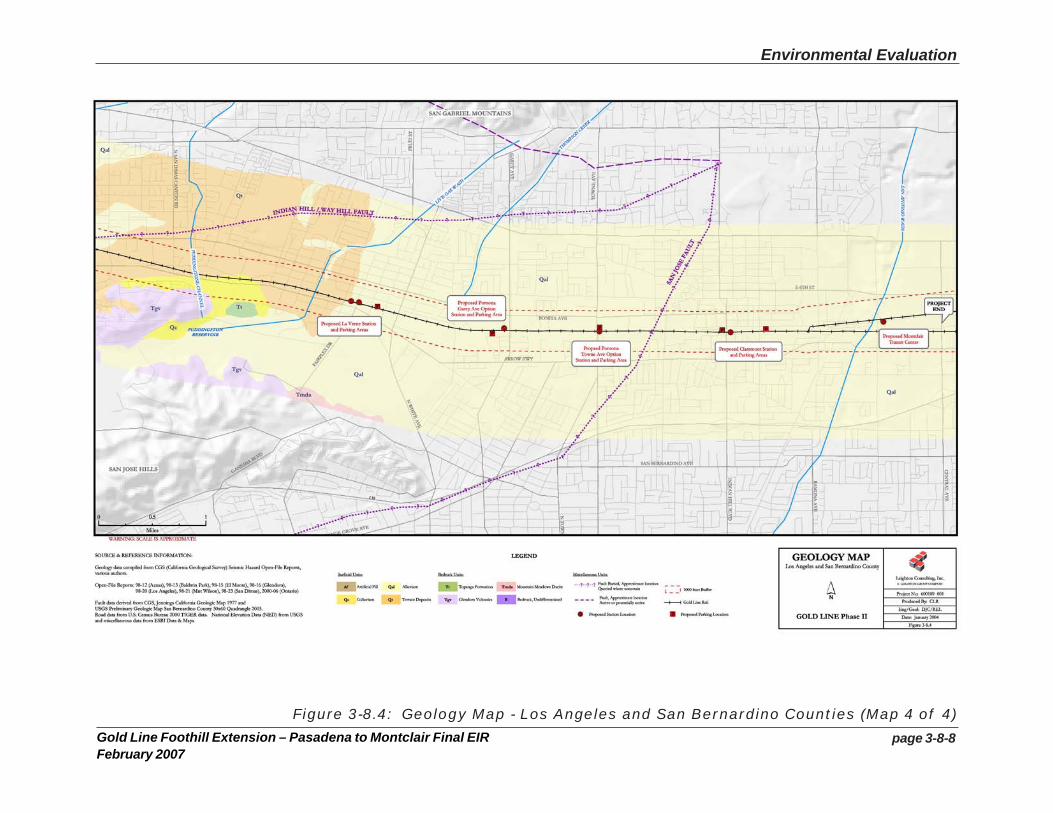
The aerial extent of the geologic units (surficial and bedrock) is shown on Figures 3-8.1 through 3-8.4 and is discussed in more detail below. The geologic units presented in Table 3-8.1 are a compilation of many lithologic units described in the California Geologic Survey’s Open-File Reports (98-12, 98-13, 98-15, 98-16, 98-20, 98-21, 98-23, and 2000-06).
TABLE 3-8.1 GEOLOGICAL UNITS IN THE STUDY AREA
Type Map Symbol*
Surficial Units Artificial Fill Af Quaternary Alluvium Qal Quaternary Colluvium Qc Quaternary Terrace Deposits Qt
Bedrock Units Glendora Volcanics Tgv Topanga Formation Tt Mountain Meadows Dacite Tmda Bedrock Undifferentiated B
* See Figures 3.8-1 through 3-8.4. Source: Leighton Consulting, 2004.
Environmental Evaluation
page 3-8-5Gold Line Foothill Extension – Pasadena to Montclair Final EIRFebruary 2007
Figure 3-8.1: Geology Map - Los Angeles and San Bernardino Counties (Map 1 of 4)
Environmental Evaluation
page 3-8-6Gold Line Foothill Extension – Pasadena to Montclair Final EIRFebruary 2007
Figure 3-8.2: Geology Map - Los Angeles and San Bernardino Counties (Map 2 of 4)
Environmental Evaluation
page 3-8-7Gold Line Foothill Extension – Pasadena to Montclair Final EIRFebruary 2007
Figure 3-8.3: Geology Map - Los Angeles and San Bernardino Counties (Map 3 of 4)
Environmental Evaluation
page 3-8-8Gold Line Foothill Extension – Pasadena to Montclair Final EIRFebruary 2007
Figure 3-8.4: Geology Map - Los Angeles and San Bernardino Counties (Map 4 of 4)
Environmental Evaluation
Gold Line Foothill Extension – Pasadena to Montclair Final EIR page 3-8-9 February 2007
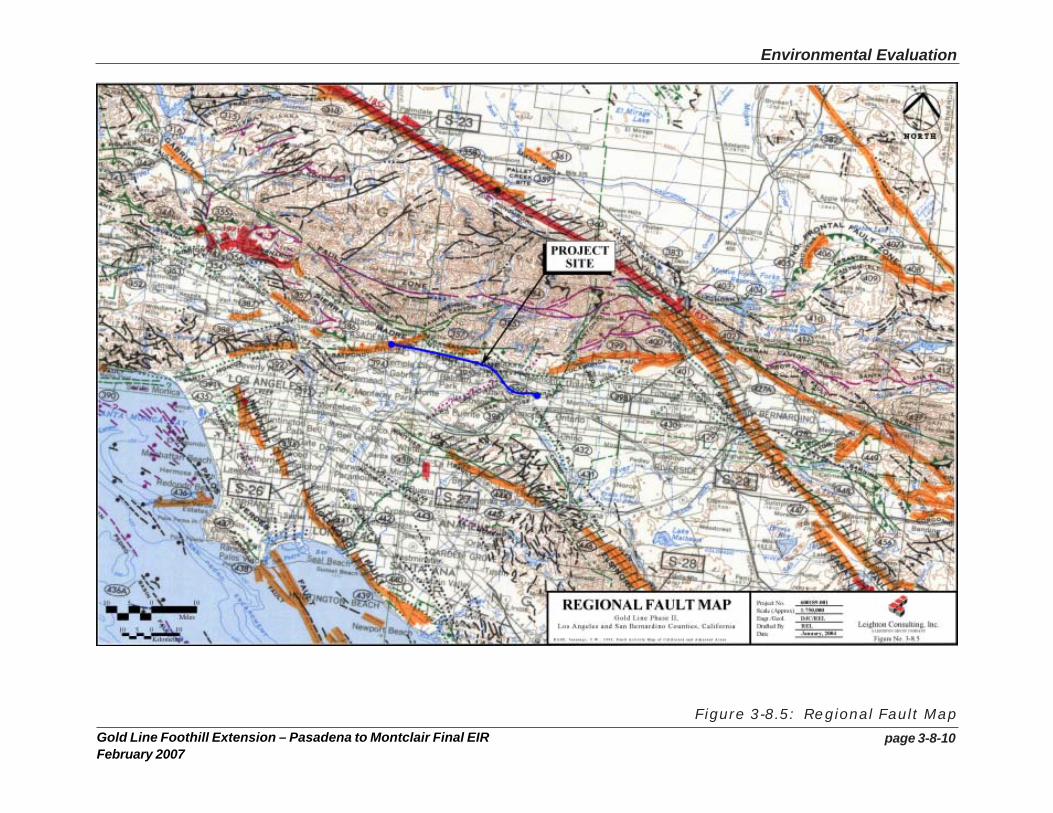
3-8.1.3 Regional Faulting and Seismicity
The two principal seismic considerations for most sites in southern California are surface rupture along active fault traces and damage to structures due to seismically induced ground shaking. Surface rupture occurs during an earthquake when movement along an active fault breaks the ground surface. Strong ground motion may also affect any area of southern California to varying degree due to the proximity and earthquake potential of nearby active faults, and to the local geologic and topographic conditions, that can either amplify or attenuate the seismic waves. Seismic hazards that may affect the project site include primary hazards from surface rupturing of the ground surface along active fault traces, and secondary hazards resulting from strong ground shaking (see Figure 3-8.5).
a. Surface Rupture
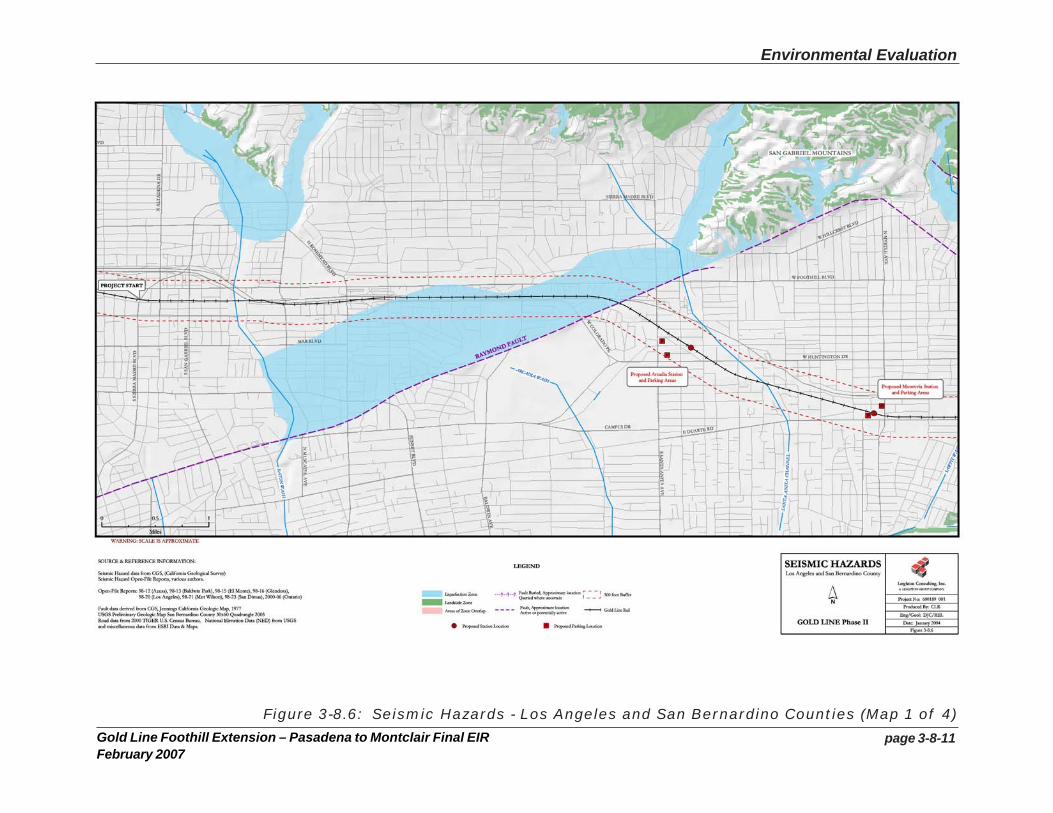
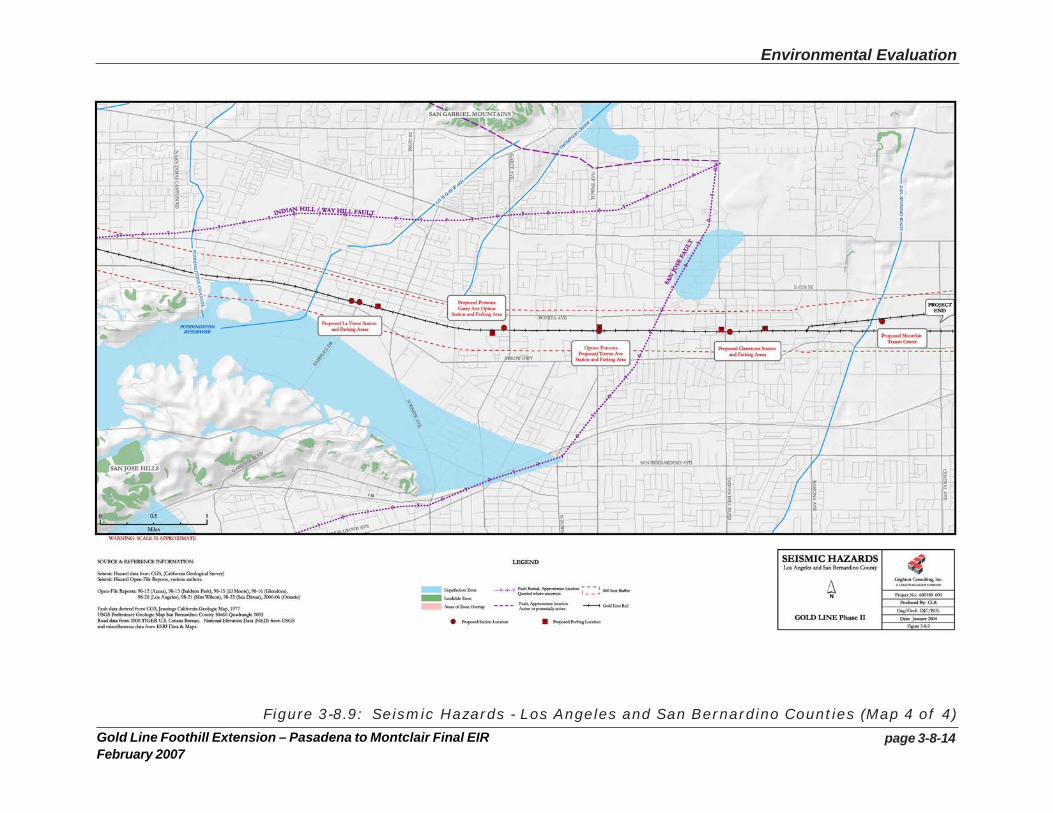
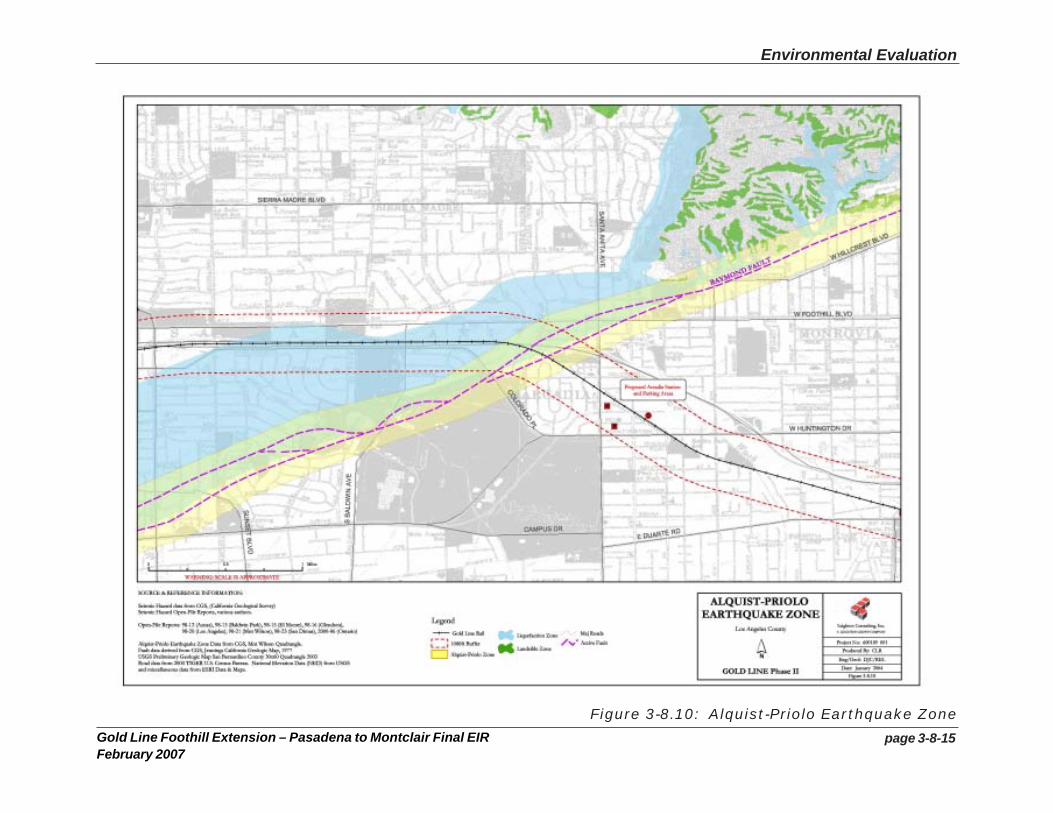
Surface rupture can be very devastating to structures built across an active fault. To protect structures from the hazard of ground surface rupture along a fault, the California Geologic Survey (CGS), under the State-mandated Alquist-Priolo Act of 1972, has delineated “Earthquake Fault Zones” along well-defined active or potentially active faults.5 A fault is considered active if there is evidence of movement along one or more of its segments in the last 11,000 years that is either directly observable or inferred. Figures 3-8.6 through 3-8.9 show the project site and the active and potentially active faults in the region. A well-defined fault is one in which “its trace can be clearly detectable by a trained geologist as a physical feature at or just below the ground surface.” The well-defined fault may be identified by either direct or indirect methods. If a site is located within an Earthquake Fault Zone, a detailed fault investigation is required prior to construction. An Earthquake Fault Zone has been delineated for the Raymond fault, which crosses the alignment in Arcadia approximately 0.5 mile (0.3 kilometer) west of the proposed Arcadia Station and Parking areas (see Figure 3-8.10). No other Other active faults are known to cross the project site, although and numerous active faults are located in the region (see Figure 3-8.5). Ground rupture from these regional faults are not likely to affect the project site although strong ground shaking from an earthquake on one of these faults could adversely affect the project site.
b. Seismic Shaking
The project area is likely to be subjected to strong ground shaking during its lifetime. The intensity of ground shaking at a given location along the alignment would depend primarily upon the earthquake’s magnitude, faulting mechanism, distance from the seismic source (focus), and the site response characteristics.6 The intensity of shaking is generally amplified in areas underlain by deep deposits of loose, unconsolidated soils. Ground shaking is also known to be enhanced by topographic highs, but this phenomenon is poorly understood at this time. The most common effects of strong seismic shaking include liquefaction and its related ground deformations, dynamic settlement, and landsliding (see Section 3-8.3.2 for a detailed discussion of these terms). To evaluate the ground motion and determine an appropriate level of peak ground acceleration (PGA) that the project site will likely experience, a site-specific analysis would be performed for the alignment during Preliminary ongoing engineering studies. PGA is the greatest acceleration an earthquake causes the ground surface to move. However, for the purposes of this general evaluation of the project alignment, a deterministic seismic hazard analysis was performed. This analysis estimated the PGA values to be expected along the alignment. The PGA values are based on amount of ground shaking the site will experience during an earthquake the type of material
5 Hart and Bryant 1999 6 Petersen et al. 1998
Environmental Evaluation
page 3-8-10Gold Line Foothill Extension – Pasadena to Montclair Final EIRFebruary 2007
Figure 3-8.5: Regional Fault Map
Environmental Evaluation
page 3-8-11Gold Line Foothill Extension – Pasadena to Montclair Final EIRFebruary 2007
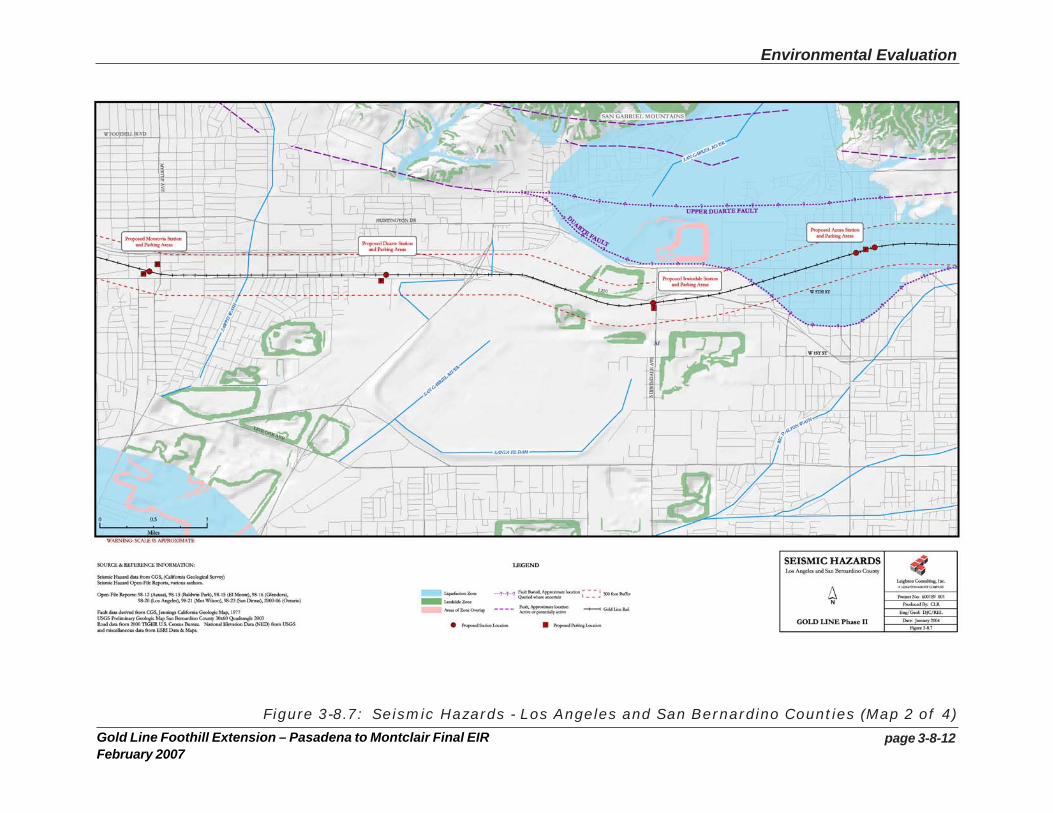
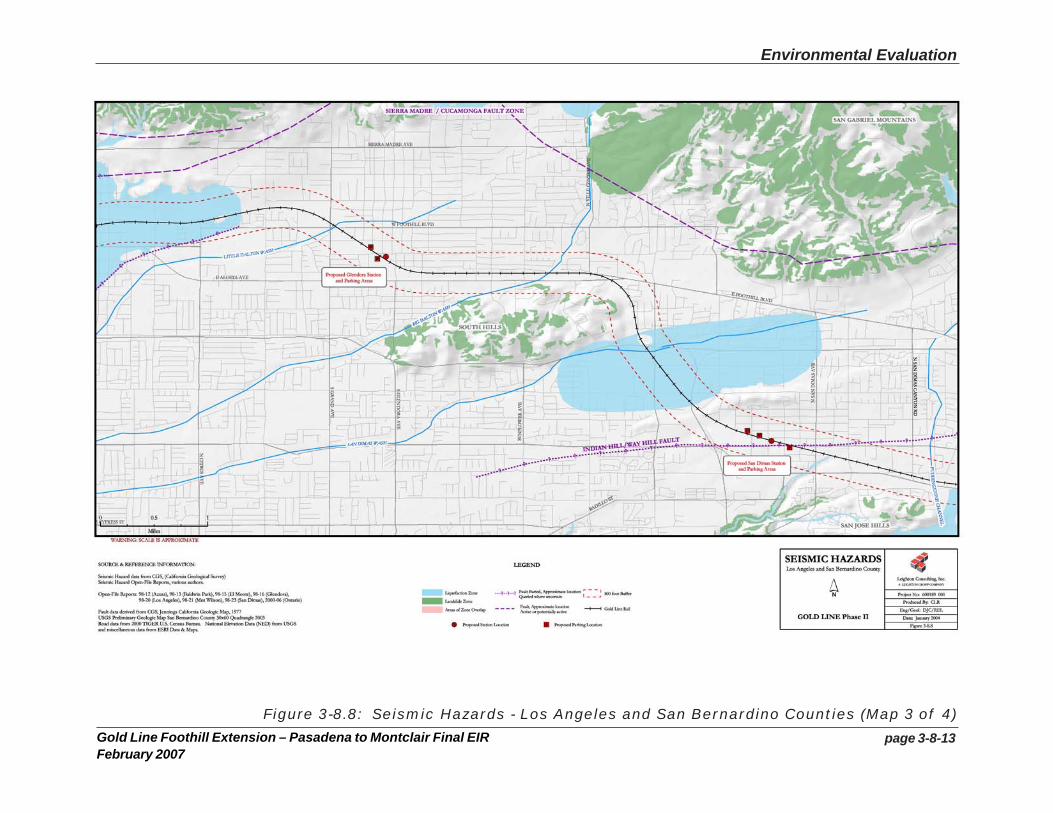
Figure 3-8.6: Seismic Hazards - Los Angeles and San Bernardino Counties (Map 1 of 4)
Environmental Evaluation
page 3-8-12Gold Line Foothill Extension – Pasadena to Montclair Final EIRFebruary 2007
Figure 3-8.7: Seismic Hazards - Los Angeles and San Bernardino Counties (Map 2 of 4)
Environmental Evaluation
page 3-8-13Gold Line Foothill Extension – Pasadena to Montclair Final EIRFebruary 2007
Figure 3-8.8: Seismic Hazards - Los Angeles and San Bernardino Counties (Map 3 of 4)
Environmental Evaluation
page 3-8-14Gold Line Foothill Extension – Pasadena to Montclair Final EIRFebruary 2007
Figure 3-8.9: Seismic Hazards - Los Angeles and San Bernardino Counties (Map 4 of 4)
Environmental Evaluation
page 3-8-15Gold Line Foothill Extension – Pasadena to Montclair Final EIRFebruary 2007
Figure 3-8.10: Alquist-Priolo Earthquake Zone
Environmental Evaluation
Gold Line Foothill Extension – Pasadena to Montclair Final EIR page 3-8-16 February 2007
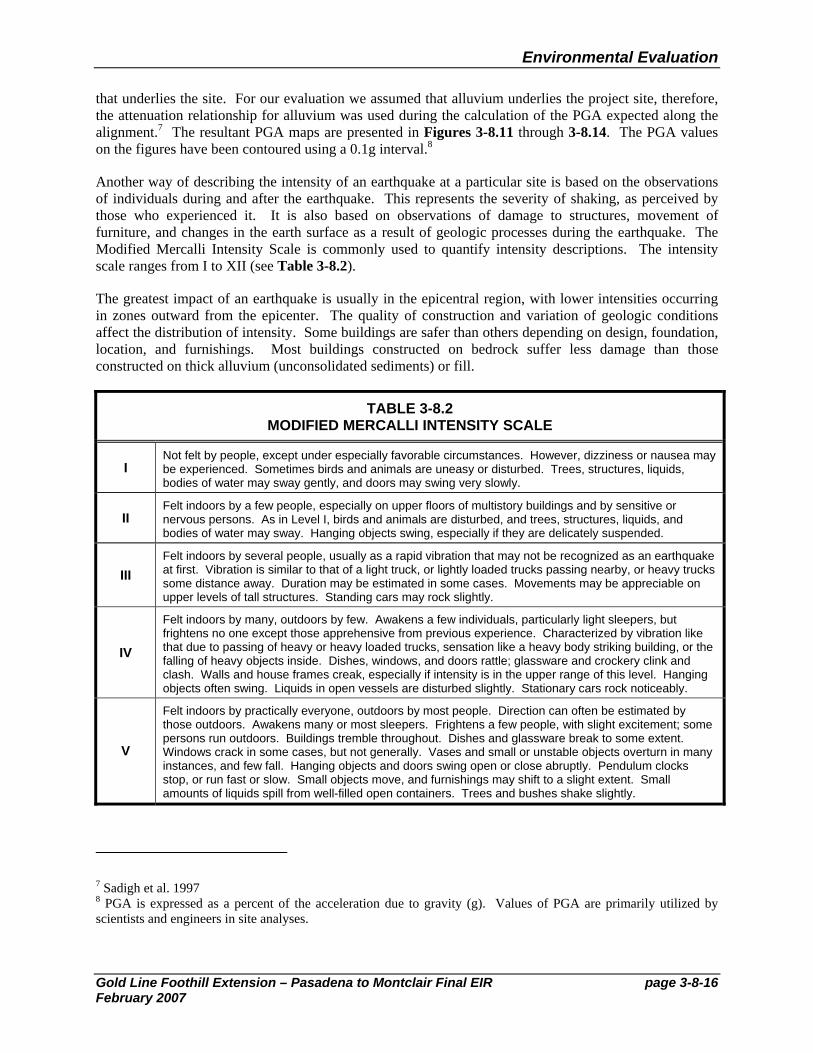
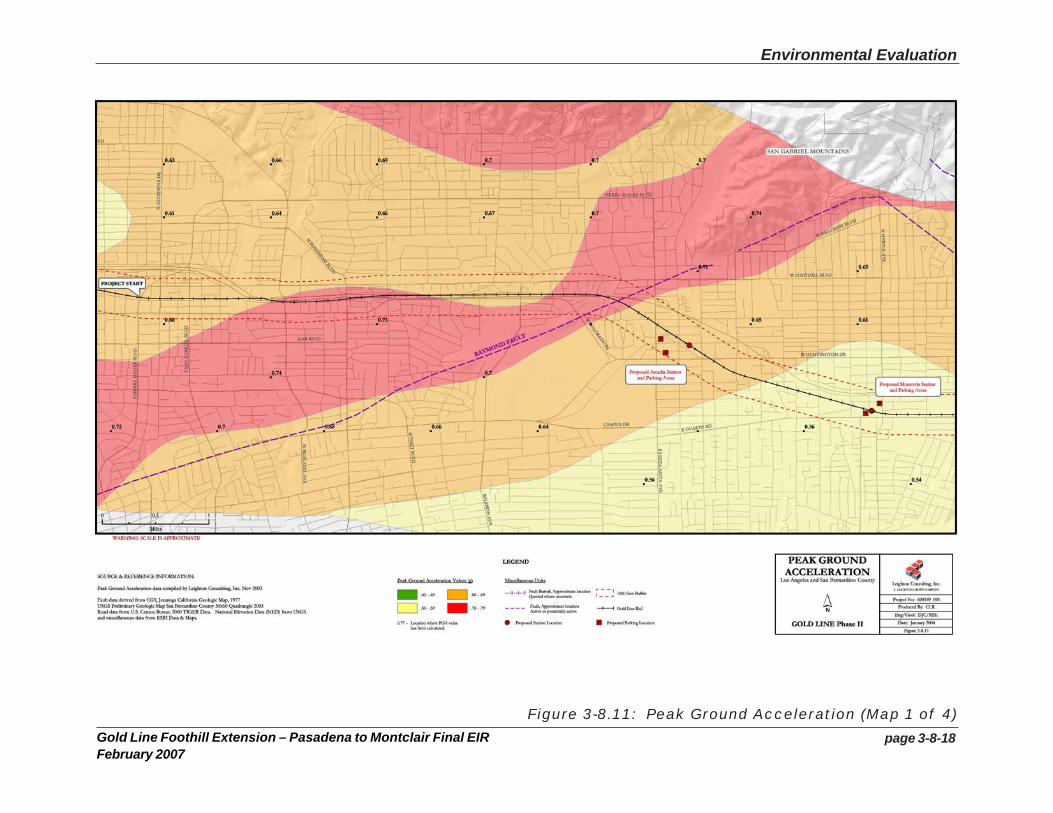
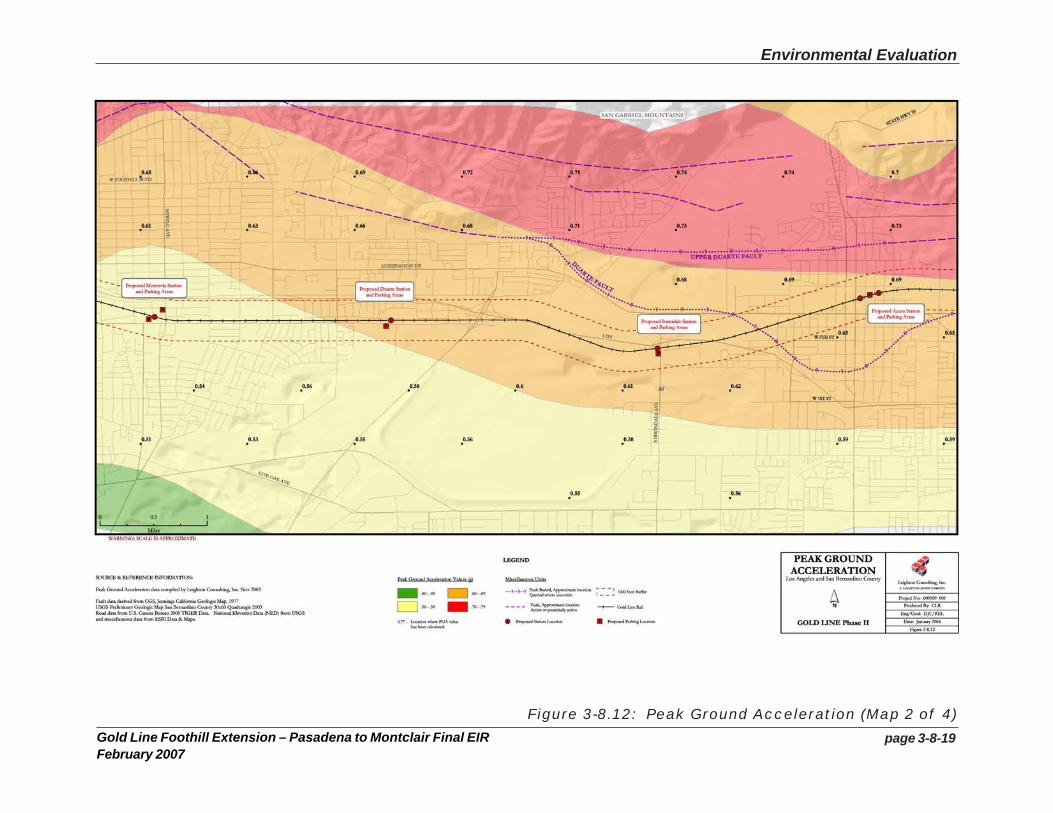
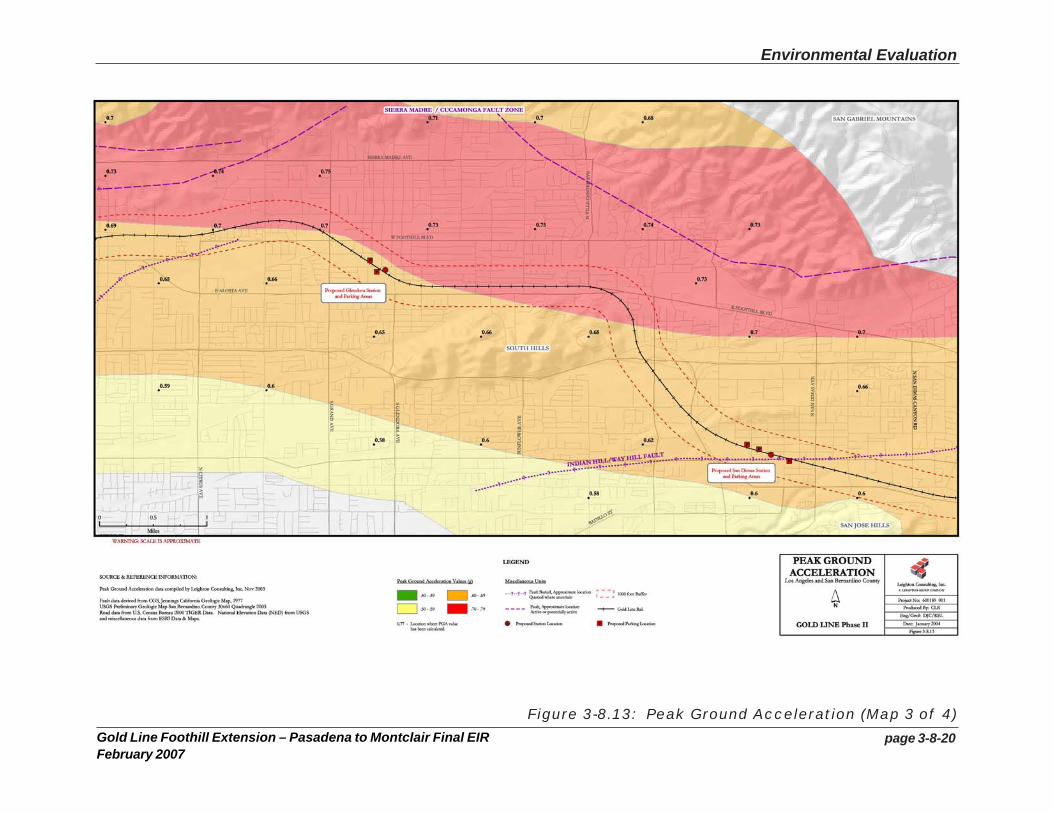
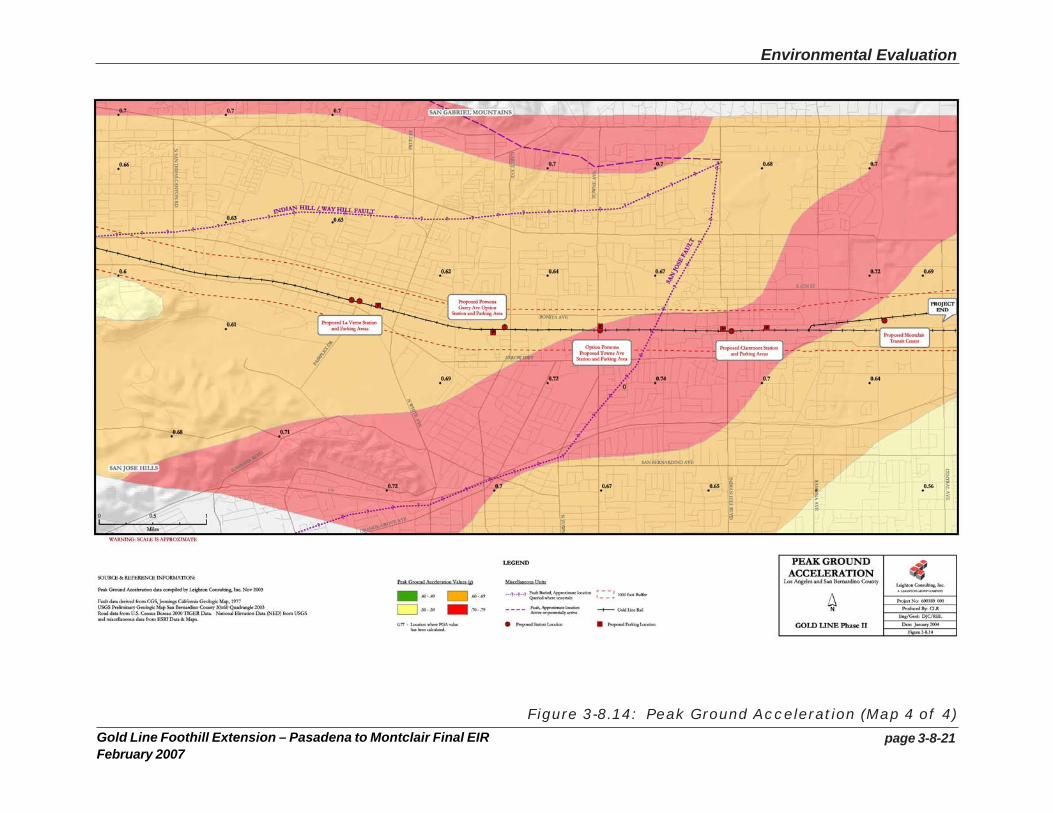
that underlies the site. For our evaluation we assumed that alluvium underlies the project site, therefore, the attenuation relationship for alluvium was used during the calculation of the PGA expected along the alignment.7 The resultant PGA maps are presented in Figures 3-8.11 through 3-8.14. The PGA values on the figures have been contoured using a 0.1g interval.8
Another way of describing the intensity of an earthquake at a particular site is based on the observations of individuals during and after the earthquake. This represents the severity of shaking, as perceived by those who experienced it. It is also based on observations of damage to structures, movement of furniture, and changes in the earth surface as a result of geologic processes during the earthquake. The Modified Mercalli Intensity Scale is commonly used to quantify intensity descriptions. The intensity scale ranges from I to XII (see Table 3-8.2).
The greatest impact of an earthquake is usually in the epicentral region, with lower intensities occurring in zones outward from the epicenter. The quality of construction and variation of geologic conditions affect the distribution of intensity. Some buildings are safer than others depending on design, foundation, location, and furnishings. Most buildings constructed on bedrock suffer less damage than those constructed on thick alluvium (unconsolidated sediments) or fill.
TABLE 3-8.2 MODIFIED MERCALLI INTENSITY SCALE
I Not felt by people, except under especially favorable circumstances. However, dizziness or nausea may be experienced. Sometimes birds and animals are uneasy or disturbed. Trees, structures, liquids, bodies of water may sway gently, and doors may swing very slowly.
II Felt indoors by a few people, especially on upper floors of multistory buildings and by sensitive or nervous persons. As in Level I, birds and animals are disturbed, and trees, structures, liquids, and bodies of water may sway. Hanging objects swing, especially if they are delicately suspended.
III Felt indoors by several people, usually as a rapid vibration that may not be recognized as an earthquake at first. Vibration is similar to that of a light truck, or lightly loaded trucks passing nearby, or heavy trucks some distance away. Duration may be estimated in some cases. Movements may be appreciable on upper levels of tall structures. Standing cars may rock slightly.
IV
Felt indoors by many, outdoors by few. Awakens a few individuals, particularly light sleepers, but frightens no one except those apprehensive from previous experience. Characterized by vibration like that due to passing of heavy or heavy loaded trucks, sensation like a heavy body striking building, or the falling of heavy objects inside. Dishes, windows, and doors rattle; glassware and crockery clink and clash. Walls and house frames creak, especially if intensity is in the upper range of this level. Hanging objects often swing. Liquids in open vessels are disturbed slightly. Stationary cars rock noticeably.
V
Felt indoors by practically everyone, outdoors by most people. Direction can often be estimated by those outdoors. Awakens many or most sleepers. Frightens a few people, with slight excitement; some persons run outdoors. Buildings tremble throughout. Dishes and glassware break to some extent. Windows crack in some cases, but not generally. Vases and small or unstable objects overturn in many instances, and few fall. Hanging objects and doors swing open or close abruptly. Pendulum clocks stop, or run fast or slow. Small objects move, and furnishings may shift to a slight extent. Small amounts of liquids spill from well-filled open containers. Trees and bushes shake slightly.
7 Sadigh et al. 1997 8 PGA is expressed as a percent of the acceleration due to gravity (g). Values of PGA are primarily utilized by scientists and engineers in site analyses.
Environmental Evaluation
Gold Line Foothill Extension – Pasadena to Montclair Final EIR page 3-8-17 February 2007
TABLE 3-8.2 MODIFIED MERCALLI INTENSITY SCALE
VI
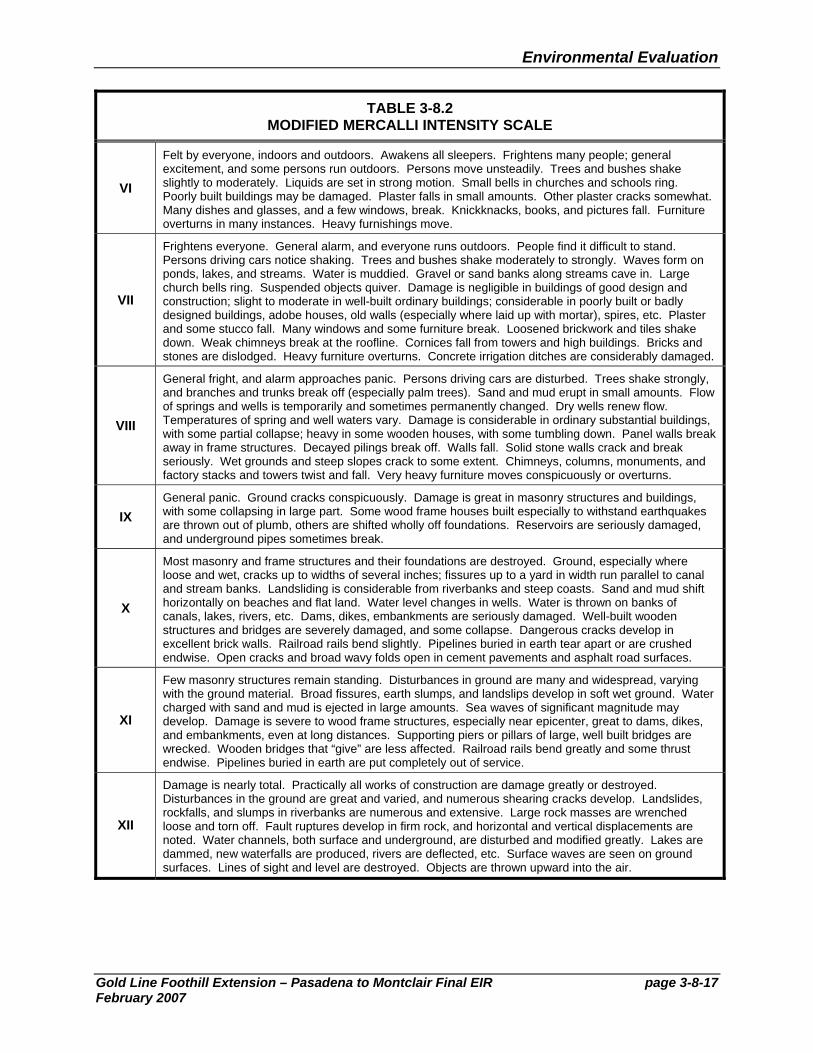
Felt by everyone, indoors and outdoors. Awakens all sleepers. Frightens many people; general excitement, and some persons run outdoors. Persons move unsteadily. Trees and bushes shake slightly to moderately. Liquids are set in strong motion. Small bells in churches and schools ring. Poorly built buildings may be damaged. Plaster falls in small amounts. Other plaster cracks somewhat. Many dishes and glasses, and a few windows, break. Knickknacks, books, and pictures fall. Furniture overturns in many instances. Heavy furnishings move.
VII
Frightens everyone. General alarm, and everyone runs outdoors. People find it difficult to stand. Persons driving cars notice shaking. Trees and bushes shake moderately to strongly. Waves form on ponds, lakes, and streams. Water is muddied. Gravel or sand banks along streams cave in. Large church bells ring. Suspended objects quiver. Damage is negligible in buildings of good design and construction; slight to moderate in well-built ordinary buildings; considerable in poorly built or badly designed buildings, adobe houses, old walls (especially where laid up with mortar), spires, etc. Plaster and some stucco fall. Many windows and some furniture break. Loosened brickwork and tiles shake down. Weak chimneys break at the roofline. Cornices fall from towers and high buildings. Bricks and stones are dislodged. Heavy furniture overturns. Concrete irrigation ditches are considerably damaged.
VIII
General fright, and alarm approaches panic. Persons driving cars are disturbed. Trees shake strongly, and branches and trunks break off (especially palm trees). Sand and mud erupt in small amounts. Flow of springs and wells is temporarily and sometimes permanently changed. Dry wells renew flow. Temperatures of spring and well waters vary. Damage is considerable in ordinary substantial buildings, with some partial collapse; heavy in some wooden houses, with some tumbling down. Panel walls break away in frame structures. Decayed pilings break off. Walls fall. Solid stone walls crack and break seriously. Wet grounds and steep slopes crack to some extent. Chimneys, columns, monuments, and factory stacks and towers twist and fall. Very heavy furniture moves conspicuously or overturns.
IX General panic. Ground cracks conspicuously. Damage is great in masonry structures and buildings, with some collapsing in large part. Some wood frame houses built especially to withstand earthquakes are thrown out of plumb, others are shifted wholly off foundations. Reservoirs are seriously damaged, and underground pipes sometimes break.
X
Most masonry and frame structures and their foundations are destroyed. Ground, especially where loose and wet, cracks up to widths of several inches; fissures up to a yard in width run parallel to canal and stream banks. Landsliding is considerable from riverbanks and steep coasts. Sand and mud shift horizontally on beaches and flat land. Water level changes in wells. Water is thrown on banks of canals, lakes, rivers, etc. Dams, dikes, embankments are seriously damaged. Well-built wooden structures and bridges are severely damaged, and some collapse. Dangerous cracks develop in excellent brick walls. Railroad rails bend slightly. Pipelines buried in earth tear apart or are crushed endwise. Open cracks and broad wavy folds open in cement pavements and asphalt road surfaces.
XI
Few masonry structures remain standing. Disturbances in ground are many and widespread, varying with the ground material. Broad fissures, earth slumps, and landslips develop in soft wet ground. Water charged with sand and mud is ejected in large amounts. Sea waves of significant magnitude may develop. Damage is severe to wood frame structures, especially near epicenter, great to dams, dikes, and embankments, even at long distances. Supporting piers or pillars of large, well built bridges are wrecked. Wooden bridges that “give” are less affected. Railroad rails bend greatly and some thrust endwise. Pipelines buried in earth are put completely out of service.
XII
Damage is nearly total. Practically all works of construction are damage greatly or destroyed. Disturbances in the ground are great and varied, and numerous shearing cracks develop. Landslides, rockfalls, and slumps in riverbanks are numerous and extensive. Large rock masses are wrenched loose and torn off. Fault ruptures develop in firm rock, and horizontal and vertical displacements are noted. Water channels, both surface and underground, are disturbed and modified greatly. Lakes are dammed, new waterfalls are produced, rivers are deflected, etc. Surface waves are seen on ground surfaces. Lines of sight and level are destroyed. Objects are thrown upward into the air.
Environmental Evaluation
page 3-8-18Gold Line Foothill Extension – Pasadena to Montclair Final EIRFebruary 2007
Figure 3-8.11: Peak Ground Acceleration (Map 1 of 4)
Environmental Evaluation
page 3-8-19Gold Line Foothill Extension – Pasadena to Montclair Final EIRFebruary 2007
Figure 3-8.12: Peak Ground Acceleration (Map 2 of 4)
Environmental Evaluation
page 3-8-20Gold Line Foothill Extension – Pasadena to Montclair Final EIRFebruary 2007
Figure 3-8.13: Peak Ground Acceleration (Map 3 of 4)
Environmental Evaluation
page 3-8-21Gold Line Foothill Extension – Pasadena to Montclair Final EIRFebruary 2007
Figure 3-8.14: Peak Ground Acceleration (Map 4 of 4)
Environmental Evaluation
Gold Line Foothill Extension – Pasadena to Montclair Final EIR page 3-8-22 February 2007
c. Nearby Active Faults
There are numerous active and potentially active faults within a few miles of the project site. Below is a description of the more prominent faults near the site and a few which cross the alignment.
Chino Fault
The Chino fault, located about 3.7 miles from the eastern terminus of the project site, is the northward extension of the Elsinore Fault Zone, north of the Puente Hills (see Figure 3-8.5). Offset drainages, fault scarps and trench excavations show that this is an active fault.9 It has been estimated that the Chino fault is capable of generating an earthquake of maximum moment magnitude (Mw) 6.7. Moment magnitude (Mw) is a measurement of an earthquake's magnitude based on area of the fault, amount of movement during the earthquake, and the strength of the rocks ruptured during the earthquake.
Clamshell-Sawpit Fault
The Clamshell-Sawpit fault is located 2.4 miles north of the project site near Arcadia and Monrovia (see Figure 3-8.5). It is a 16-kilometer long, north to northeast dipping fault zone that branches northeastward from the Sierra Madre fault zone.10 It has a slip rate of 1.5 to 2.5 mm/yr and is capable of producing and earthquake with an estimated maximum moment magnitude (Mw) of 6.5.11
Duarte Fault
The Duarte fault is a southern splay of the Sierra Madre-Cucamonga Fault Zone that crosses the project site in Azusa (see Figures 3-8.2 and 3-8.7), approximately 1 mile west of the proposed Irwindale Station and Parking area. It has been mapped12 as scarps within the older and younger alluvial fan deposits emanating from Bradbury, Spinks, and Monrovia Canyons north of the cities of Duarte and Azusa. The fault extends through the San Gabriel River and into Azusa based on vegetation lineaments observed on aerial photographs, geophysical evidence, and a groundwater barrier observed through water table variations.13 Multiple groundwater barriers present north of Azusa indicate the presence of an Upper Duarte fault, which has an inferred trace a few thousand feet north of the Duarte fault.14 The Upper Duarte and Duarte faults have not been zoned under the Alquist-Priolo Act because the timing of its latest movement has not yet been determined; however, the Duarte fault is considered active by the County of Los Angeles.15 The CGS has not delineated this as an active fault at this time.
Hollywood Fault
The Hollywood fault is located 7.3 miles from the western terminus of the project site (see Figure 3-8.5). It extends for 8.7 miles from the Los Angeles River to Beverly Hills along the eastern Santa Monica Mountains. This fault places older bedrock of the Santa Monica Mountains next to young (late
9 Dolan et al. 2001 10 Cao et al. 2003, Leighton 1990 11 Cao et al. 2003, Dolan et al. 1995 12 Morton 1973, Crook et al. 1987 13 Crook et al. 1987 14 Crook et al. 1987 15 Leighton 1990
Environmental Evaluation
Gold Line Foothill Extension – Pasadena to Montclair Final EIR page 3-8-23 February 2007
Pleistocene to Holocene age; i.e., a few hundred thousand years old) alluvial fan deposits of the adjacent basin.16 The Hollywood fault has an estimated slip rate of 0.5 to 1.5 mm/yr and is capable of producing an earthquake with a maximum moment magnitude (Mw) 6.4.17
Puente Hills Blind-Thrust Fault
Movement on the Puente Hills Blind-Thrust Fault (PHT) caused the 1987 Mw 6.0 Whittier Narrows earthquake. Blind thrust faults are located in the subsurface with no mapped fault trace at the ground surface. The focus of the 1987 event was at depth of approximately 13 kilometers below the San Gabriel Valley near Whittier Narrows. The PHT does not reach the surface, however, upward movement along the fault has produced a fold above it and just below the ground surface.18 To the north of the 1987 focus, the fault flattens and continues beneath the San Gabriel Mountains and merges with the Sierra Madre-Cucamonga Fault System.19 The PHT is located approximately 8 miles from the western terminus of the project site and is capable of producing an earthquake with an estimated maximum moment magnitude (Mw) of 7.1.20
Raymond Fault
The Raymond fault extends across the Los Angeles Basin from the Los Angeles River to the foot of the San Gabriel Mountains in Monrovia. Its trace is arcuate, convex to the south, and trends roughly east-west at the western portion, and then curves to east-northeast trend in the eastern portion (see Figures 3-8.1, 3-8.6, and 3-8.11). It crosses the project site in Arcadia approximately 0.5 miles (0.3 kilometers) west of the Arcadia Station and Parking areas (see Figure 3-8.10). This fault has been delineated as an Earthquake Fault Zone under the Alquist-Priolo Act.21
Geomorphic features along the surface trace of the Raymond fault indicate it is predominately a left-lateral strike-slip fault.22 A left-lateral strike-slip fault is one in which the left side will move away from an observer straddling the fault. Seismic evidence and aftershock analyses indicate that the Mw 4.9 1988 Pasadena earthquake occurred on the Raymond fault.23 This fault is capable of producing a Mw 6.5, and has a slip rate of 1.5 ± 1.0 mm/yr.24 Evidence from paleoseismologic fault trenching25 suggests the most recent surface-rupturing event occurred more than 1,000 years ago.
16 Dolan et al. 1997 17 Cao et al. 2003, Petersen et al. 1996 18 Shaw and Shearer 1999, Pratt et al. 2001, Christofferson et al. 2001, Dolan et al. 2003 19 Fuis et al 2001 20 Cao et al. 2003, Petersen et al. 1996 21 Hart and Bryant 1999 22 Crook et al. 1987, Jones et al. 1990, Weaver and Dolan 2000 23 Jones et al. 1990 24 Cao et al. 2003, Marin et al. 2000 25 Crook et al. 1987, Weaver and Dolan 2000
Environmental Evaluation
Gold Line Foothill Extension – Pasadena to Montclair Final EIR page 3-8-24February 2007
San Andreas Fault Zone
The San Andreas Fault is the longest and most well known fault in California. Its activity is known from historic earthquakes, most notable are the 1857 and 1906 magnitude 8 earthquakes, and from many fault studies that have shown that the San Andreas offsets, or displaces, recently deposited sediments. The closest portion of the San Andreas Fault to the project site is the southern segment, which is located about 16 miles to the east-northeast. This segment is capable of producing an earthquake of a maximum moment magnitude (Mw) 7.1.26
San Jacinto Fault
The San Jacinto fault zone extends for over 200 kilometers northwest from El Centro to Cajon Pass, California, where it intersects with the San Andreas Fault. This fault zone is segmented along its entire length into smaller sub-parallel strands and cross faults. The closest segment to the project site is the San Bernardino segment, which is approximately 12.5 miles from the eastern terminus of the project site. The San Jacinto Fault Zone has produced more moderate to large earthquakes than any other fault zone is southern California.27 The most recent earthquake occurred in on November 23 1987 on the Superstition Hills fault segment approximately 90 miles east of San Diego. Up to 12.5 cm (approximately 5 inches) of surface displacement was observed for this Mw 6.2 seismic event. Along the length of the fault slip rate data is variable, ranging from approximately 2 to almost 20 mm/yr. A rate of 12 ± 6 mm/yr has been estimated for the San Bernardino segment of the fault with an earthquake of moment magnitude of Mw 6.7 possible.28
San Jose Fault
The San Jose Fault is an 11 to 14 mile-long fault that branches southwestward from the Cucamonga-Sierra Madre Fault Zone in the Upland area and continues southwest along the southern boundary of the San Jose Hills. The fault crosses the alignment approximately 0.5 mile west of the Pomona Towne Avenue Station. The fault has been mapped based on a water barrier in the vicinity of the project site where it reportedly impedes the flow of ground water, with ground water levels on the north side of the fault higher than water levels to the south of the fault.29
Two Upland earthquakes of 1988 and 1990, magnitude 4.6 and 5.2, respectively, have been attributed to this fault.30 Analyses of these earthquakes indicate the San Jose Fault has left-lateral strike-slip motion on a northeast oriented fault.31 An earthquake on this fault, rupturing the entire length of the fault, could result in an earthquake of moment magnitude (Mw) 6.5.32
26 Petersen et al. 1996; Cao et al. 2003 27 Petersen and Wesnousky 1994 28 Petersen et al. 1996; Cao et al. 2003 29 Tinsley et al. 1985, Los Angeles County Department of Public Works 1996 30 Hauksson and Jones 1991 31 Yeats 2001, Hauksson and Jones 1991 32 Cao et al. 2003
Environmental Evaluation
Gold Line Foothill Extension – Pasadena to Montclair Final EIR page 3-8-25February 2007
Sierra Madre-Cucamonga Fault Zone
The Sierra Madre-Cucamonga Fault Zone includes several fault segments extending for over 86 miles along the southern margin of the San Gabriel Mountains. The two main portions of the Sierra Madre-Cucamonga Fault Zone include the Sierra Madre Fault to the west and the Cucamonga Fault to the east. The fault zone is inclined to the north, dipping below the San Gabriel Mountains and uplifting them above the Los Angeles Basin. The fault zone was responsible for the 1971 Mw 6.6 San Fernando earthquake on its westernmost segment near the town of Sylmar, California. The Sierra Madre Fault passes through the northern portions of Pasadena, Arcadia, Monrovia, Duarte, Azusa, and portions of San Dimas. The Sierra Madre Fault is approximately 1 mile at its closest point to the project alignment north of Glendora. This fault segment has an estimated maximum moment magnitude of Mw 7.0.33
The Cucamonga Fault is the eastern extent of the Sierra Madre-Cucamonga Fault Zone and lies to the north of Pomona, Claremont, and Montclair. It is located 2.2 miles north of Claremont at its closest point to the project site. This segment of the Sierra Madre-Cucamonga Fault Zone is capable of producing an estimated maximum moment magnitude earthquake of Mw 7.0.34
Upper Elysian Park Blind-Thrust Fault
The upper Elysian Park Fault is, like the Puente Hills blind thrust fault, a fault that does not intersect with the ground surface. The fault is expressed as an elongated group of low hills (Elysian Park Hills, Repetto Hills and Monterey Hills) extending for approximately 12.4 miles from northern Los Angeles to San Gabriel.35 These hills are Pliocene to Quaternary-aged (approximately 2 million years old) folded sediments that have been uplifted along the fault. The Elysian Park Fault has a slip rate of 0.9 to 1.7 mm/yr and is capable of producing a maximum moment magnitude earthquake of Mw 6.4.36 It is near the western terminus of the project site, approximately 5.7 miles away.
Verdugo Fault
The Verdugo Fault lies along the southeastern edge of the Pacoima Hills and Verdugo Mountains, north of the San Fernando Valley. It is a northwest-southeast striking fault, following the orientation of the Pacoima Hills to the north, and dips north below the hills. It is located approximately 3 miles from the western terminus of the project site. The estimated maximum moment magnitude earthquake this fault is capable of producing is an Mw 6.7.37
Whittier Fault
The Whittier Fault is the northwestward extension of the Elsinore Fault Zone, a 250-kilometer long fault zone that is traced from Los Angeles to northern Baja California (Mexico). The Whittier segment is approximately 24.8 miles long and extends from the Whittier Narrows section of the San Gabriel River southeastward to the Santa Ana River. Although no major historical earthquakes have been attributed to the Whittier fault, studies completed by several investigators, most of which included trenching, have
33 Cao et al. 2003, Petersen et al. 1996 34 Cao et al. 2003, Petersen et al. 1996 35 Dolan et al. 2001 36 Cao et al. 2003, Oskin et al. 2000 37 Cao et al. 2003, Petersen et al. 1996
Environmental Evaluation
Gold Line Foothill Extension – Pasadena to Montclair Final EIR page 3-8-26February 2007
documented movement on this fault in the last 11,000 years.38 The closest section of this fault lies approximately 10.5 miles from the project site. A maximum moment magnitude of Mw 6.8 has been estimated for this fault.39
Local faults
Local faults include short, inferred faults that cross the project site and are not considered active or their activity has yet to be determined because of their inaccessibility to a detail study (i.e., buried). In the northeastern San Gabriel Valley three faults have been identified based on groundwater barriers observed by the California Department of Water Resources. The San Jose Fault, discussed above, is oriented northeast - southwest along the southern edge of the San Jose Hills and has been determined to be the causative fault of the 1988 and 1990 Upland Earthquakes.40 Walnut Creek Fault has an inferred location on the north side of the San Jose Hills and is oriented roughly parallel to the San Jose fault. The Indian Hill fault, also called the Way Hill-Lone Hill Fault, is known to exist based on differences in groundwater levels across this part of the San Gabriel Valley.41 The fault has been mapped along the trend of Way and Lone Hills east to the Cucamonga fault.
3-8.1.4 Subsidence
In California, subsidence related to man’s activities has been attributed to withdrawal of subsurface fluids such as oil and groundwater, oxidation of subsurface organic material such as peat and coal, and by hydroconsolidation (from excessive irrigation) of loose, dry soils in a semi-arid climate.
Withdrawal of groundwater has occurred in the San Gabriel Valley and along the alignment for agricultural purposes. This practice has been greatly reduced in recent years, due to the urbanization of the area. As a result, groundwater elevations in the SGV have risen or remained constant in recent years.42 A majority of the San Gabriel Valley and alignment is underlain by alluvial deposits that can include isolated organic-rich soils and floodplain deposits. Subsidence due to oxidation of these deposits is possible. The extent or exact locality of such subsidence would be determined during investigations for the proposed stations and alignment during Preliminary ongoing engineering studies. Given that groundwater withdrawal is highly regulated, the potential for subsidence to be a substantive concern are very low.
3-8.1.5 Volcanic Hazards
Hazards from nearby volcanic activity may include surface rupture, lava flows and ash falls. Amboy Crater is the closest potentially active volcano to the project site. It lies approximately 100 miles to the northeast of the alignment. It includes a complex of cinder cone volcanoes that last erupted approximately 6,000 years ago; and that have erupted many times in the past 10,000 years.43 The project
38 Leighton et al. 1987, Rockwell et al. 1988, Gath et al. 1992, Patterson and Rockwell 1993 39 Cao et al. 2003, Petersen et al. 1996 40 Hauksson and Jones 1991 41 California Department of Water Resources 2003 and 1966 42 California Department of Water Resources 2003 43 Parker 1963, Miller 1989
Environmental Evaluation
Gold Line Foothill Extension – Pasadena to Montclair Final EIR page 3-8-27February 2007
site is not within the potential hazard area of the Amboy Crater volcanic area.44 Accordingly, volcanic hazards would be considered less than significant under NEPA/less than significant under CEQA.
3-8.1.6 Existing Slope Stability
Most of the alignment, particularly east of the proposed Arcadia Station, is located on flat terrain. The few slopes that exist are those constructed for railroad bridges to cross above local roads and streams. Currently these man-made slopes appear in good stable condition. However, within the alignment buffer zone exist a few areas where slope instability could exist, particularly during an earthquake (see Figures 3-8.7 through 3-8.9). These areas are mapped as potential seismically induced landslide zones on the Seismic Hazard Zones Maps and Reports.45 A seismically induced landslide zone is an area where previous landslides have occurred or an area where conditions exist for potential permanent ground displacement such that mitigation as defined in Public Resources Code Section 2693(c) would be required. These areas include some of the quarried slopes near the Santa Fe Dam and along the northern slopes of the South Hills. In these areas, seismically induced landslides could occur if shaking from an earthquake causes pre-existing landslides to reactivate or triggers new landslides along planes of weakness. Potential landslide hazard along the areas zoned by the State would be considered high. For the rest of the alignment, which is not within the seismically induced landslide zones, the potential for this hazard would be low.
3-8.1.7 Groundwater
The San Gabriel Valley Groundwater Basin is structurally bound by the Raymond fault to the north, the Puente and Repetto Hills to the south and the San Jose and Chino faults to the southeast. Groundwater is contained in the older and more recent alluvium shed from the San Gabriel Mountains and transported to the basin by the Rio Hondo and San Gabriel River drainages.46 Groundwater elevations are highest near the range front of the San Gabriel Mountains with decreasing elevations to the southwest, as groundwater flows southwesterly along the topographic slope through the Whittier Narrows.
Historical shallow groundwater levels vary across the basin due, in part, to faults that act as groundwater barriers.47 North of the Raymond fault shallow ground water ranges from 10 feet below ground surface (bgs) at the north side of the Raymond fault to 100 feet bgs south of the fault in Pasadena.48 Shallow groundwater in Monrovia and Arcadia south of the Raymond fault is between 100-200 feet bgs.49 Where the alignment passes the San Gabriel River historically high groundwater levels are reported at depths of almost 200 feet bgs, however, there is an abrupt change to a shallow groundwater level to about 30 feet bgs north of the 210 freeway in Arcadia and Duarte.50 The Sierra Madre Fault Zone creates a ground water barrier at this location juxtaposing basement igneous and metamorphic rocks against porous alluvium. In the Glendora area, north of the South Hills, historic shallow groundwater is between 100 to 150 feet bgs (Loyd and Wills 1998c). To the south of South Hills there is an area where the historic groundwater levels are anomalously high at less 30 feet bgs. South and east of the San Jose Hills the San
44 Miller 1989 45 California Division of Mine and Geology 1999a, 1999b, 1999c, and 1999d; Perez et al. 1998; Schlosser and Wills 1998a and 1998b 46 California Department of Water Resources 2003 47 California Department of Water Resources 1966 and 2003 48 Loyd and Wills 1998a 49 Loyd and Wills 1998a 50 Loyd and Wills 1998b
Environmental Evaluation
Gold Line Foothill Extension – Pasadena to Montclair Final EIR page 3-8-28February 2007
Jose and Indian Hill faults act as barriers to groundwater flow and historic high ground water levels differ by more than 300 feet across the fault zone.51
3-8.1.8 Soils
Soils in the study area have been heavily disturbed by urban development, which often includes the importation of soils for fill. Since soils underlying the right-of-way have proven capable of supporting rail infrastructure for over 100 years, no analysis of their characteristics was undertaken. Areas proposed for stations and parking have been previously developed; soils on these sites would be are being evaluated during Preliminary ongoing engineering studies to ascertain any conditions which would require special construction techniques to meet current building codes.
Of concern in California is whether soils are prone to liquefaction during seismic events. Liquefaction often occurs in earthquake-prone areas underlain by young alluvium where the groundwater table is within 50 feet of the ground surface. The impact section discusses the presence or absence of liquefaction soils for each station/parking location.
3-8.2 Environmental Impacts
The potential environmental (geotechnical) impacts that could affect the project site are discussed below. These potential geotechnical impacts are similar for each of the construction alternatives for any given location along the alignment. However, potentially significant hazards, their impact and severity will differ along the alignment and have been presented below for specific locations within each city, from west to east. Potential impacts from subsidence, tsunamis and volcanic hazards are low to nil along the alignment and are not discussed any further.
3-8.2.1 Evaluation Methodology
This preliminary geotechnical assessment was conducted in accordance with the guidelines set forth by the California Geological Survey (formerly know as the California Division of Mines and Geology) in Notes 46 and 52, for preparation of Environmental Impact Reports.52 These guidelines identify geologic problems, such as earthquake damage, loss of mineral resources, slope instability, and erosion and flooding, that must be evaluated for their potential impact on the proposed development. The assessment includes:
• A review of available published documents and unpublished reports, including each city’s general plan was conducted. A review of vintage historical aerial photographs from numerous flights between 1928 and 1979 was made.
• An evaluation and review of data collected during previous geotechnical investigations of the site was also conducted.
• The discussion of the geologic, seismic, groundwater, and soil engineering aspects of the site.
• A deterministic seismic hazard analysis for the major active and potentially active faults in the region was performed. The analysis is a site-specific evaluation of the potential ground motion expected for
51 Loyd 1998 52 California Division of Mines and Geology 1982 and 2001
Environmental Evaluation
Gold Line Foothill Extension – Pasadena to Montclair Final EIR page 3-8-29February 2007
the site, which would be caused by the maximum earthquake expected to occur along any fault within about 62.5 mile radius of the site. The seismic hazard analysis estimates the peak horizontal ground acceleration (PGA) to be expected along the alignment, based on the shortest distance to the fault, the maximum expected earthquake magnitude, and the attenuation of the seismic energy. The expected PGA values along the alignment have been contoured and are presented on Figures 3-8.11 through 3-8.14.
3-8.2.2 Impact Criteria
The potential impact that each condition may have on the site was evaluated and assessed as being either less-than-significant or potentially significant. The California Geological Survey guidelines for geologic and seismic considerations in environmental impact reports were utilized to identify potential geologic hazards and assist in recognizing data needed for design analysis and mitigation measures. The guidelines address the following sections.
a. Fault-Induced Ground Rupture
During a moderate to large earthquake differential movement of blocks of the earth’s crust along a fault can cause the ground surface to break. This results in a localized area of intense cracking and offset of surface features such as buildings and roads.
b. Seismic Shaking
During an earthquake, ground shaking at a given location depends primarily on the earthquake magnitude, the distance from the earthquake focus to the site, and the response characteristics of the soils or bedrock units. Seismic shaking is described by the peak ground acceleration (PGA) relative to the gravitational constant of the earth. For example, 0.5g represents a PGA of 0.5 times gravity. Tables 3-8.3 to 3-8.6 (Foothill Extension Segment 1 proposed stations) and Tables 3-8.7 to 3-8.13 (Foothill Extension Segment 2 proposed stations) provide a summary of faults, fault distances, magnitudes, expected PGA values, and estimated intensity values (Modified Mercalli) for each proposed station.
c. Secondary Effects of Seismic Shaking
Secondary effects are non-tectonic processes that are directly related to strong seismic shaking.53 Ground deformation, including fissures, settlement, displacement and loss of bearing strength are common expressions of these processes, and is one of the leading causes of damage to structures during a moderate to large earthquake. Secondary effects leading to ground deformation include liquefaction, lateral spreading, settlement, and landsliding. Other hazards indirectly related to seismic shaking are inundation, tsunamis, and seiches.
d. Liquefaction
Liquefaction occurs when loose, cohesionless, water-saturated soils (generally fine-grained sand and silt) are subjected to strong seismic ground motion of significant duration. These soils essentially behave similar to liquids, losing bearing strength. Structures built on these soils may tilt or sink when the soils
53 Yeats et al. 1997
Environmental Evaluation
Gold Line Foothill Extension – Pasadena to Montclair Final EIR page 3-8-30February 2007
liquefy. Liquefaction more often occurs in earthquake-prone areas underlain by young alluvium where the groundwater table is within 50 feet of the ground surface. Areas where possible liquefaction can occur have been mapped as potential liquefaction zones on the Seismic Hazard Zones Maps and Reports by the CGS. A liquefaction zone is an area where historic liquefaction has occurred or an area where conditions exist for potential permanent ground displacement such that mitigation as defined in Public Resources Code Section 2693(c) would be required. We have delineated possible liquefaction zones on Figures 3-8.6 through 3-8.9.
e. Lateral Spreading
Lateral spreading is a phenomenon where large blocks of intact, non-liquefied soil move down-slope on a large area of liquefied substrate.54 The mass moves toward an unconfined area, such as a descending slope or stream-cut bluff, and is known to move on slope gradients as gentle as one degree.
f. Seismically Induced Landslides
Marginally stable slopes (including existing landslides) may be subject to landsliding caused by seismic shaking. The seismically induced landslide hazard depends on many factors including existing slope stability, shaking potential, and presence of existing landslides. We have delineated possible seismically induced landslide zones on Figures 3-8.6 through 3-8.9.
g. Seismically Induced Settlement
Strong ground shaking can cause settlement by allowing sediment particles to become more tightly packed, thereby reducing pore space. Unconsolidated, loosely packed granular alluvial deposits are especially susceptible to this phenomenon. Poorly compacted artificial fills may also experience seismically induced settlement.
h. Seismically Induced Inundation
Strong seismic ground motion can cause dams and levees to fail, resulting in damage to structures and properties located downstream. Flood control and water-storage facilities can also fail as a result of flaws not recognized in the feasibility studies, design or construction phases of the facilities.
NEPA Impact Criteria
There are no separate NEPA criteria for assessing geologic-seismic impacts. Accordingly, CEQA criteria are used.
CEQA Impact Criteria
The CEQA Environmental Checklist Guidelines focus on whether a proposed project would have significant affect on geologic and seismic resources by exposing people or structures to potential substantial adverse effects involving rupture of a known earthquake fault, strong seismic ground shaking,
54 Yeats et al. 1997, Tinsley et al. 1985
Environmental Evaluation
Gold Line Foothill Extension – Pasadena to Montclair Final EIR page 3-8-31February 2007
or landslides. The Guidelines also inquire about whether a project would be located in an area of erosive soils, liquefaction, and expansive soils.
3-8.2.3 Construction-Period Impacts
a. No Build Alternative
There are no elements of the No Build Alternative that would be expected to result in adverse effects or significant impacts to geologic or seismic resources underlying the cities in Phase I, Phase II Foothill Extension Segment 1,or Phase II Foothill Extension Segment 2. Projects in the No Build Alternative would be subject to geologic and seismic influences. It is assumed that all construction would be in accordance with the latest federal and state seismic requirements. By compliance with these standards, potential impacts would be less than adverse under NEPA and less than significant under CEQA.
b. Build Alternatives
The Build Alternatives do not have any elements that would affect geologic-seismic resources. Project elements would be subject to geologic and seismic influences. It is assumed that all construction would be in accordance with the latest federal and state seismic requirements. Data that would influence design development that would occur in the Preliminary ongoing engineering studies is reported for each affected city.
Phase I – The Cities Affected and the Effects
There are no elements of the proposed project in Los Angeles, South Pasadena, or east of the Sierra Madre Villa Station in Pasadena. Accordingly, there would be no construction-period impacts.
Foothill Extension, Segment 1 – The Cities Affected and the Effects
The cities in Foothill Extension Segment 1 are Pasadena, Arcadia, Monrovia, Duarte, Irwindale, and Azusa.
Pasadena
The project alignment begins in Pasadena along I-210 near Sierra Madre Boulevard and trends eastward along the freeway into Arcadia. The San Gabriel Mountain front lies to the north, approximately 2 miles away, and the San Rafael Hills are located a few miles to the south. This portion of the site is underlain by artificial fill that has been placed over Quaternary age sand and gravel alluvial fan and valley deposits.
The Safety Element of the City of Pasadena’s General Plan (2002) describes geologic hazards that can be found in Pasadena. These include hazards within the city but not necessarily in the vicinity of the project site. Potential hazards include ground rupture and seismic shaking due to earthquakes on the Sierra Madre and Raymond faults and secondary seismic shaking effects due to earthquakes on a number of Southern California's major faults. These secondary effects may include liquefaction, seismically induced landslides, and possible dam failure of the Devils Gate and Eaton Wash Dams.
Environmental Evaluation
Gold Line Foothill Extension – Pasadena to Montclair Final EIR page 3-8-32February 2007
Liquefaction is a potentially significant hazard along the project alignment as shown on Seismic Hazard Zones Map and accompanying report.55 The liquefaction potential is primarily found north of the Raymond fault.56 Here, the fault acts as a barrier to groundwater flow away from the San Gabriel Mountains. The fault impedes the southerly flow of the groundwater, which rises on the northern side of the fault and saturates the shallow, loose sand and gravel deposits. Seismic shaking during an earthquake can cause the water to escape from the porous sands and create a temporarily liquefied surface.
Seismically-Induced Inundation is a potentially adverse/significant hazard for the project alignment. The Eaton Wash Dam lies less than 1.5 miles north of the site. Failure of this dam during an earthquake could potentially flood the downstream area. This would include the project alignment from Daisy Avenue to Rosemead Boulevard.57 The Morris S. Jones Dam and Reservoir No. 19-3 could also be compromised during shaking. However, flooding from failure of this dam would be less momentous and only affect a small area along Rosemead Boulevard and a small area along Michellinda Avenue.58 If flooding of the alignment were to occur, there would be an adverse effect under NEPA and a significant impact under CEQA.
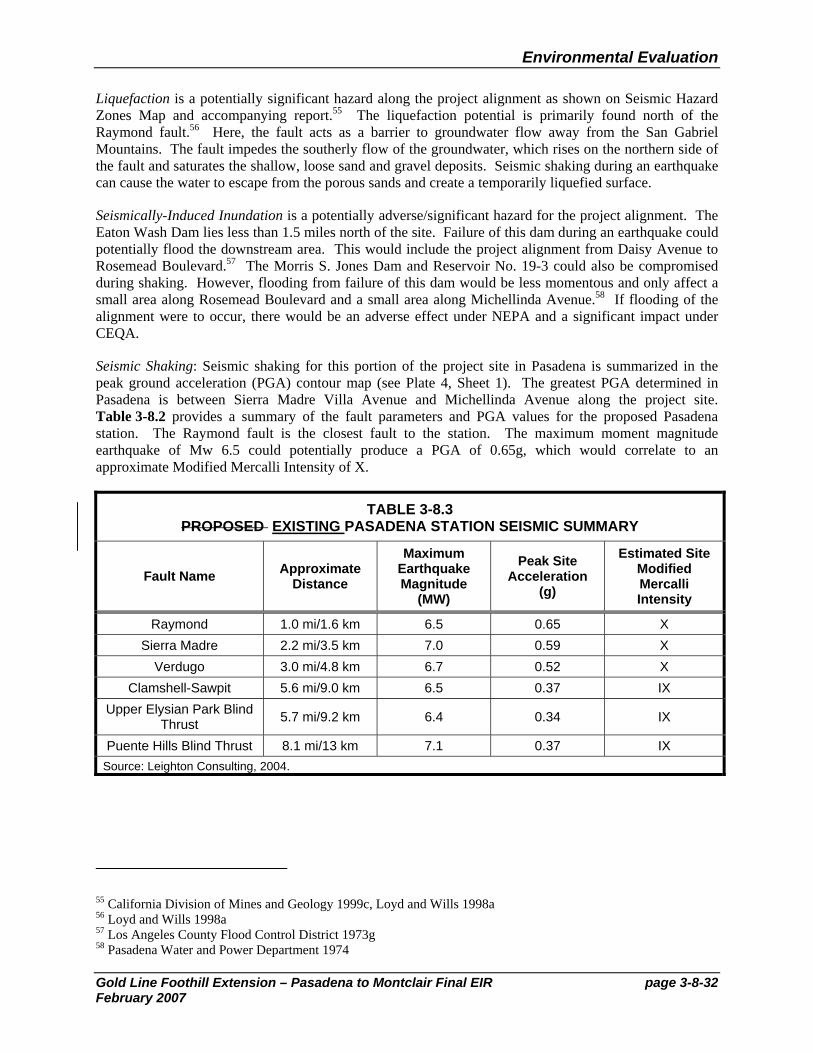
Seismic Shaking: Seismic shaking for this portion of the project site in Pasadena is summarized in the peak ground acceleration (PGA) contour map (see Plate 4, Sheet 1). The greatest PGA determined in Pasadena is between Sierra Madre Villa Avenue and Michellinda Avenue along the project site. Table 3-8.2 provides a summary of the fault parameters and PGA values for the proposed Pasadena station. The Raymond fault is the closest fault to the station. The maximum moment magnitude earthquake of Mw 6.5 could potentially produce a PGA of 0.65g, which would correlate to an approximate Modified Mercalli Intensity of X.
TABLE 3-8.3 PROPOSED EXISTING PASADENA STATION SEISMIC SUMMARY
Fault Name Approximate Distance
Maximum Earthquake Magnitude
(MW)
Peak Site Acceleration
(g)
Estimated Site Modified Mercalli Intensity
Raymond 1.0 mi/1.6 km 6.5 0.65 X Sierra Madre 2.2 mi/3.5 km 7.0 0.59 X
Verdugo 3.0 mi/4.8 km 6.7 0.52 X Clamshell-Sawpit 5.6 mi/9.0 km 6.5 0.37 IX
Upper Elysian Park Blind Thrust 5.7 mi/9.2 km 6.4 0.34 IX
Puente Hills Blind Thrust 8.1 mi/13 km 7.1 0.37 IX Source: Leighton Consulting, 2004.
55 California Division of Mines and Geology 1999c, Loyd and Wills 1998a 56 Loyd and Wills 1998a 57 Los Angeles County Flood Control District 1973g 58 Pasadena Water and Power Department 1974
Environmental Evaluation
Gold Line Foothill Extension – Pasadena to Montclair Final EIR page 3-8-33February 2007
Arcadia
The project site in Arcadia is coincident with I-210 to the East Branch Arcadia Wash where it diverges from the freeway and turns to the southeast. Alluvial fan and valley deposits consisting mainly of sand and gravel underlie the project site. The Raymond fault crosses the alignment in Arcadia near Santa Anita Avenue, approximately 0.5 miles west of the Arcadia Station.
The City of Arcadia’s General Plan (1996) recognizes that the significant threat to the city property is posed by future earthquakes on the Raymond and/or Sierra Madre Faults, as well as other nearby faults. The Raymond and Sierra Madre Faults have a surface expression within the city and therefore represent a ground rupture hazard.
The potentially significant geologic hazards in the City of Arcadia include fault-induced ground rupture, liquefaction, seismically induced flooding, and seismic shaking. As described in the city’s General Plan, seismic hazards are the most important geologic hazard within Arcadia, and also at the project site.
Fault-induced ground rupture due to an earthquake on the Raymond fault could result in property damage at the project site. The Raymond Fault has been delineated as an Earthquake Fault Zone under the Alquist-Priolo Act.59 It is approximately 2000 feet wide, extending from Rancho Road to Colorado Boulevard across the site (California Division of Mines and Geology 1977). Within this zone two fault traces have been identified to pose a threat of surface rupture.
Liquefaction presents a potentially significant hazard to the project site in a localized area along the Raymond Fault.60 The area susceptible to liquefaction lies approximately between Michellinda Avenue and Colorado Boulevard as mapped on the Mt. Wilson and Azusa Quadrangle Seismic Hazard Zones Map and accompanying report. This is an area where a shallow ground water condition occurs on the northwest side of the Raymond fault. As groundwater flows in the subsurface from the San Gabriel Mountains it encounters the impermeable Raymond Fault Zone and ‘ponds’ against the north side of the fault, saturating loose, sand and gravel deposits. These sediments are then susceptible to liquefaction during seismic shaking.
Seismically Induced Inundation is a potentially significant hazard at the project site in Arcadia. If the Santa Anita Dam, which has a capacity of 1,376 acre-feet, were compromised due to seismic shaking or other impacts, the flooding would cover 11 square miles and would possibly inundate the project site from the East Branch of Arcadia Wash to Myrtle Avenue in Monrovia.61 If flooding of the alignments were to occur, there would be an adverse effect under NEPA and a significant impact under CEQA.
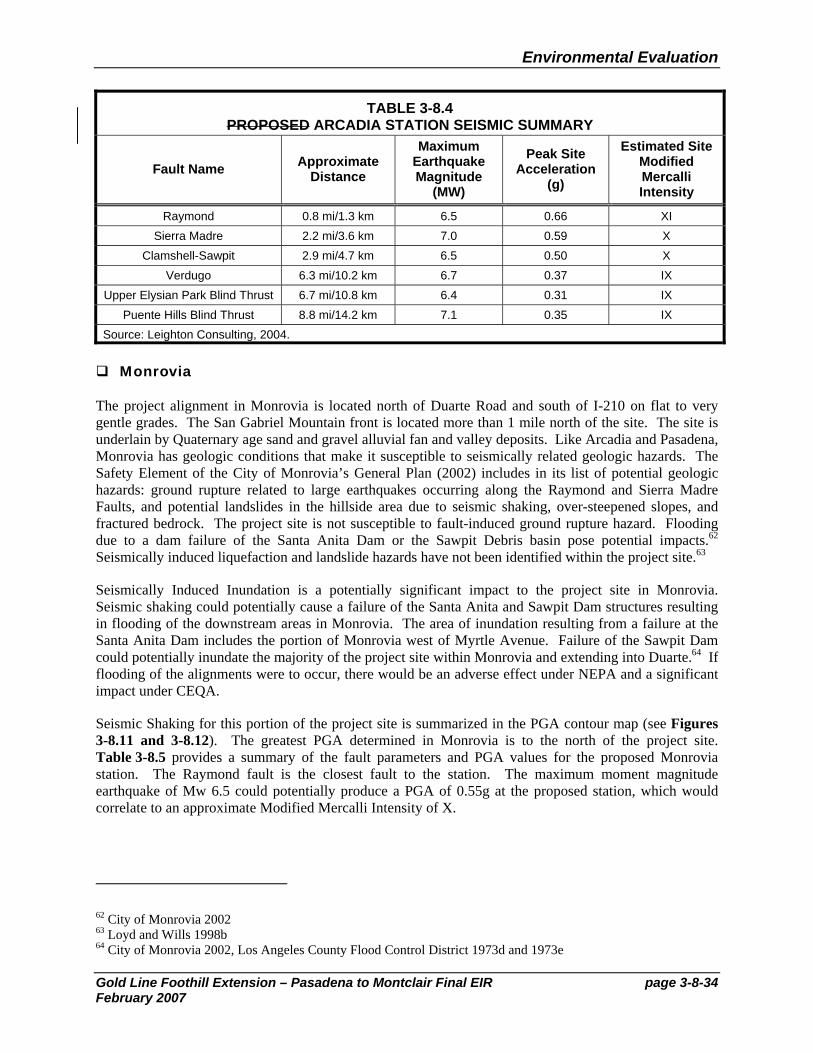
Seismic Shaking for the portion of the project site in Arcadia is summarized in a PGA contour map. The greatest PGA determined in Arcadia is between Baldwin Avenue and Santa Anita Avenue. Table 3-8.4 provides a summary of the fault parameters and PGA values for the proposed Arcadia station. The Raymond fault is the closest fault to the station. The maximum moment magnitude earthquake of Mw 6.5 could potentially produce PGA of 0.66g, which would correlate to an approximate Modified Mercalli Intensity of XI.
59 Hart and Bryant 1999 60 California Division of Mines and Geology 1999a and 1999c, Loyd and Wills 1998b 61 Los Angeles County Flood Control District 1973e
Environmental Evaluation
Gold Line Foothill Extension – Pasadena to Montclair Final EIR page 3-8-34February 2007
TABLE 3-8.4 PROPOSED ARCADIA STATION SEISMIC SUMMARY
Fault Name Approximate Distance
Maximum Earthquake Magnitude
(MW)
Peak Site Acceleration
(g)
Estimated Site Modified Mercalli Intensity
Raymond 0.8 mi/1.3 km 6.5 0.66 XI Sierra Madre 2.2 mi/3.6 km 7.0 0.59 X
Clamshell-Sawpit 2.9 mi/4.7 km 6.5 0.50 X Verdugo 6.3 mi/10.2 km 6.7 0.37 IX
Upper Elysian Park Blind Thrust 6.7 mi/10.8 km 6.4 0.31 IX Puente Hills Blind Thrust 8.8 mi/14.2 km 7.1 0.35 IX
Source: Leighton Consulting, 2004.
Monrovia
The project alignment in Monrovia is located north of Duarte Road and south of I-210 on flat to very gentle grades. The San Gabriel Mountain front is located more than 1 mile north of the site. The site is underlain by Quaternary age sand and gravel alluvial fan and valley deposits. Like Arcadia and Pasadena, Monrovia has geologic conditions that make it susceptible to seismically related geologic hazards. The Safety Element of the City of Monrovia’s General Plan (2002) includes in its list of potential geologic hazards: ground rupture related to large earthquakes occurring along the Raymond and Sierra Madre Faults, and potential landslides in the hillside area due to seismic shaking, over-steepened slopes, and fractured bedrock. The project site is not susceptible to fault-induced ground rupture hazard. Flooding due to a dam failure of the Santa Anita Dam or the Sawpit Debris basin pose potential impacts.62 Seismically induced liquefaction and landslide hazards have not been identified within the project site.63
Seismically Induced Inundation is a potentially significant impact to the project site in Monrovia. Seismic shaking could potentially cause a failure of the Santa Anita and Sawpit Dam structures resulting in flooding of the downstream areas in Monrovia. The area of inundation resulting from a failure at the Santa Anita Dam includes the portion of Monrovia west of Myrtle Avenue. Failure of the Sawpit Dam could potentially inundate the majority of the project site within Monrovia and extending into Duarte.64 If flooding of the alignments were to occur, there would be an adverse effect under NEPA and a significant impact under CEQA.
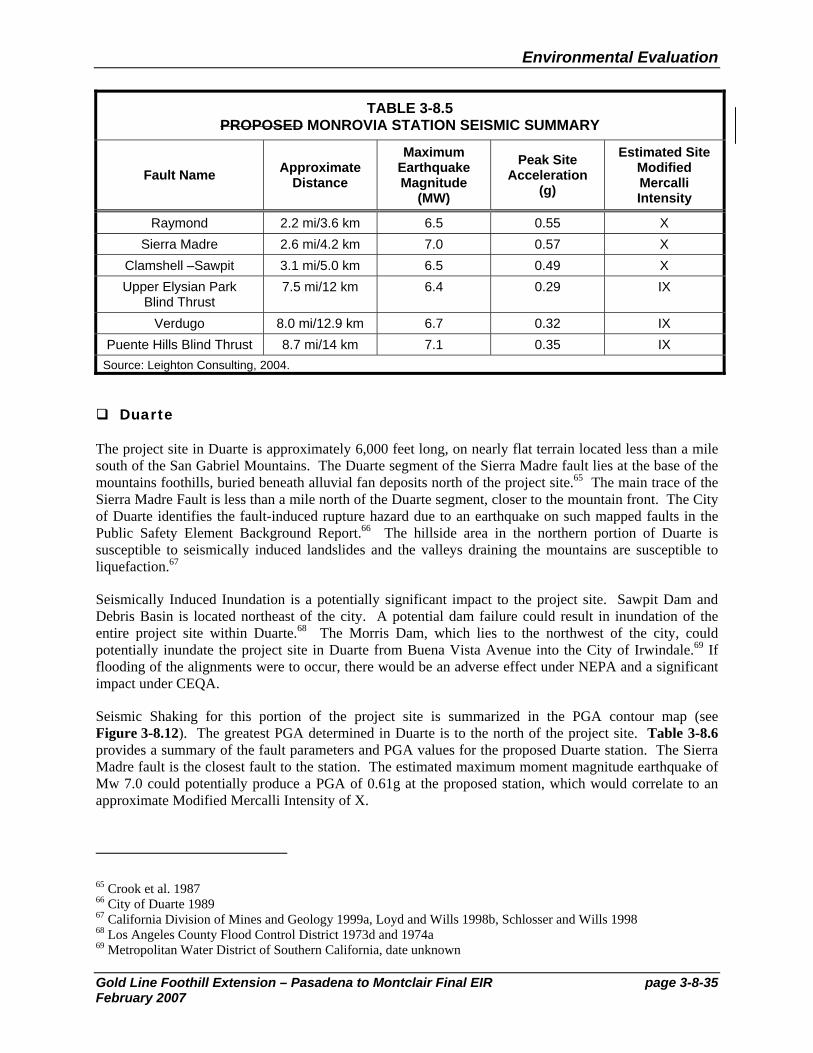
Seismic Shaking for this portion of the project site is summarized in the PGA contour map (see Figures 3-8.11 and 3-8.12). The greatest PGA determined in Monrovia is to the north of the project site. Table 3-8.5 provides a summary of the fault parameters and PGA values for the proposed Monrovia station. The Raymond fault is the closest fault to the station. The maximum moment magnitude earthquake of Mw 6.5 could potentially produce a PGA of 0.55g at the proposed station, which would correlate to an approximate Modified Mercalli Intensity of X.
62 City of Monrovia 2002 63 Loyd and Wills 1998b 64 City of Monrovia 2002, Los Angeles County Flood Control District 1973d and 1973e
Environmental Evaluation
Gold Line Foothill Extension – Pasadena to Montclair Final EIR page 3-8-35February 2007
TABLE 3-8.5 PROPOSED MONROVIA STATION SEISMIC SUMMARY
Fault Name Approximate Distance
Maximum Earthquake Magnitude
(MW)
Peak Site Acceleration
(g)
Estimated Site Modified Mercalli Intensity
Raymond 2.2 mi/3.6 km 6.5 0.55 X Sierra Madre 2.6 mi/4.2 km 7.0 0.57 X
Clamshell –Sawpit 3.1 mi/5.0 km 6.5 0.49 X Upper Elysian Park
Blind Thrust 7.5 mi/12 km 6.4 0.29 IX
Verdugo 8.0 mi/12.9 km 6.7 0.32 IX Puente Hills Blind Thrust 8.7 mi/14 km 7.1 0.35 IX
Source: Leighton Consulting, 2004.
Duarte
The project site in Duarte is approximately 6,000 feet long, on nearly flat terrain located less than a mile south of the San Gabriel Mountains. The Duarte segment of the Sierra Madre fault lies at the base of the mountains foothills, buried beneath alluvial fan deposits north of the project site.65 The main trace of the Sierra Madre Fault is less than a mile north of the Duarte segment, closer to the mountain front. The City of Duarte identifies the fault-induced rupture hazard due to an earthquake on such mapped faults in the Public Safety Element Background Report.66 The hillside area in the northern portion of Duarte is susceptible to seismically induced landslides and the valleys draining the mountains are susceptible to liquefaction.67
Seismically Induced Inundation is a potentially significant impact to the project site. Sawpit Dam and Debris Basin is located northeast of the city. A potential dam failure could result in inundation of the entire project site within Duarte.68 The Morris Dam, which lies to the northwest of the city, could potentially inundate the project site in Duarte from Buena Vista Avenue into the City of Irwindale.69 If flooding of the alignments were to occur, there would be an adverse effect under NEPA and a significant impact under CEQA.
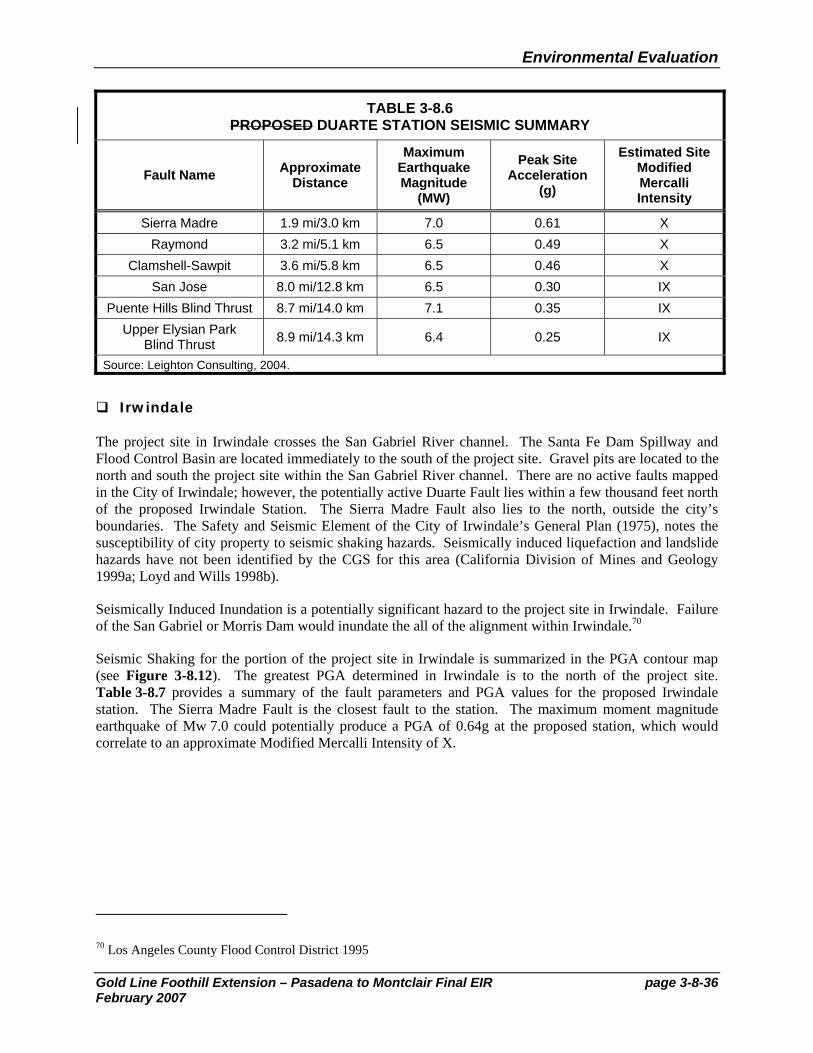
Seismic Shaking for this portion of the project site is summarized in the PGA contour map (see Figure 3-8.12). The greatest PGA determined in Duarte is to the north of the project site. Table 3-8.6 provides a summary of the fault parameters and PGA values for the proposed Duarte station. The Sierra Madre fault is the closest fault to the station. The estimated maximum moment magnitude earthquake of Mw 7.0 could potentially produce a PGA of 0.61g at the proposed station, which would correlate to an approximate Modified Mercalli Intensity of X.
65 Crook et al. 1987 66 City of Duarte 1989 67 California Division of Mines and Geology 1999a, Loyd and Wills 1998b, Schlosser and Wills 1998 68 Los Angeles County Flood Control District 1973d and 1974a 69 Metropolitan Water District of Southern California, date unknown
Environmental Evaluation
Gold Line Foothill Extension – Pasadena to Montclair Final EIR page 3-8-36February 2007
TABLE 3-8.6 PROPOSED DUARTE STATION SEISMIC SUMMARY
Fault Name Approximate Distance
Maximum Earthquake Magnitude
(MW)
Peak Site Acceleration
(g)
Estimated Site Modified Mercalli Intensity
Sierra Madre 1.9 mi/3.0 km 7.0 0.61 X Raymond 3.2 mi/5.1 km 6.5 0.49 X
Clamshell-Sawpit 3.6 mi/5.8 km 6.5 0.46 X San Jose 8.0 mi/12.8 km 6.5 0.30 IX
Puente Hills Blind Thrust 8.7 mi/14.0 km 7.1 0.35 IX Upper Elysian Park
Blind Thrust 8.9 mi/14.3 km 6.4 0.25 IX
Source: Leighton Consulting, 2004.
Irwindale
The project site in Irwindale crosses the San Gabriel River channel. The Santa Fe Dam Spillway and Flood Control Basin are located immediately to the south of the project site. Gravel pits are located to the north and south the project site within the San Gabriel River channel. There are no active faults mapped in the City of Irwindale; however, the potentially active Duarte Fault lies within a few thousand feet north of the proposed Irwindale Station. The Sierra Madre Fault also lies to the north, outside the city’s boundaries. The Safety and Seismic Element of the City of Irwindale’s General Plan (1975), notes the susceptibility of city property to seismic shaking hazards. Seismically induced liquefaction and landslide hazards have not been identified by the CGS for this area (California Division of Mines and Geology 1999a; Loyd and Wills 1998b).
Seismically Induced Inundation is a potentially significant hazard to the project site in Irwindale. Failure of the San Gabriel or Morris Dam would inundate the all of the alignment within Irwindale.70
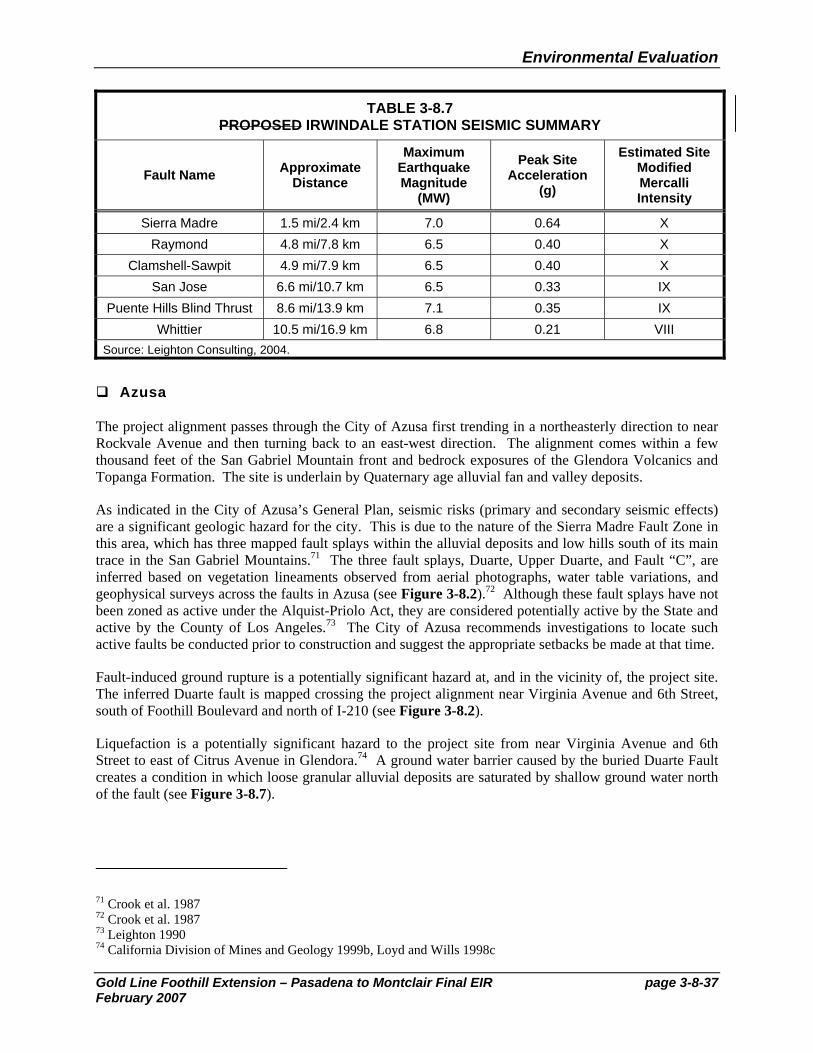
Seismic Shaking for the portion of the project site in Irwindale is summarized in the PGA contour map (see Figure 3-8.12). The greatest PGA determined in Irwindale is to the north of the project site. Table 3-8.7 provides a summary of the fault parameters and PGA values for the proposed Irwindale station. The Sierra Madre Fault is the closest fault to the station. The maximum moment magnitude earthquake of Mw 7.0 could potentially produce a PGA of 0.64g at the proposed station, which would correlate to an approximate Modified Mercalli Intensity of X.
70 Los Angeles County Flood Control District 1995
Environmental Evaluation
Gold Line Foothill Extension – Pasadena to Montclair Final EIR page 3-8-37February 2007
TABLE 3-8.7 PROPOSED IRWINDALE STATION SEISMIC SUMMARY
Fault Name Approximate Distance
Maximum Earthquake Magnitude
(MW)
Peak Site Acceleration
(g)
Estimated Site Modified Mercalli Intensity
Sierra Madre 1.5 mi/2.4 km 7.0 0.64 X Raymond 4.8 mi/7.8 km 6.5 0.40 X
Clamshell-Sawpit 4.9 mi/7.9 km 6.5 0.40 X San Jose 6.6 mi/10.7 km 6.5 0.33 IX
Puente Hills Blind Thrust 8.6 mi/13.9 km 7.1 0.35 IX Whittier 10.5 mi/16.9 km 6.8 0.21 VIII
Source: Leighton Consulting, 2004.
Azusa
The project alignment passes through the City of Azusa first trending in a northeasterly direction to near Rockvale Avenue and then turning back to an east-west direction. The alignment comes within a few thousand feet of the San Gabriel Mountain front and bedrock exposures of the Glendora Volcanics and Topanga Formation. The site is underlain by Quaternary age alluvial fan and valley deposits.
As indicated in the City of Azusa’s General Plan, seismic risks (primary and secondary seismic effects) are a significant geologic hazard for the city. This is due to the nature of the Sierra Madre Fault Zone in this area, which has three mapped fault splays within the alluvial deposits and low hills south of its main trace in the San Gabriel Mountains.71 The three fault splays, Duarte, Upper Duarte, and Fault “C”, are inferred based on vegetation lineaments observed from aerial photographs, water table variations, and geophysical surveys across the faults in Azusa (see Figure 3-8.2).72 Although these fault splays have not been zoned as active under the Alquist-Priolo Act, they are considered potentially active by the State and active by the County of Los Angeles.73 The City of Azusa recommends investigations to locate such active faults be conducted prior to construction and suggest the appropriate setbacks be made at that time.
Fault-induced ground rupture is a potentially significant hazard at, and in the vicinity of, the project site. The inferred Duarte fault is mapped crossing the project alignment near Virginia Avenue and 6th Street, south of Foothill Boulevard and north of I-210 (see Figure 3-8.2).
Liquefaction is a potentially significant hazard to the project site from near Virginia Avenue and 6th Street to east of Citrus Avenue in Glendora.74 A ground water barrier caused by the buried Duarte Fault creates a condition in which loose granular alluvial deposits are saturated by shallow ground water north of the fault (see Figure 3-8.7).
71 Crook et al. 1987 72 Crook et al. 1987 73 Leighton 1990 74 California Division of Mines and Geology 1999b, Loyd and Wills 1998c
Environmental Evaluation
Gold Line Foothill Extension – Pasadena to Montclair Final EIR page 3-8-38February 2007
Seismically Induced Inundation is a potentially significant hazard due to possible failure of the San Gabriel and Morris Dams, located north of the project site. The flooding could possibly engulf the entire project alignment in this area in less than one hour.75 If flooding of the alignments were to occur, there would be an adverse effect under NEPA and a significant impact under CEQA.
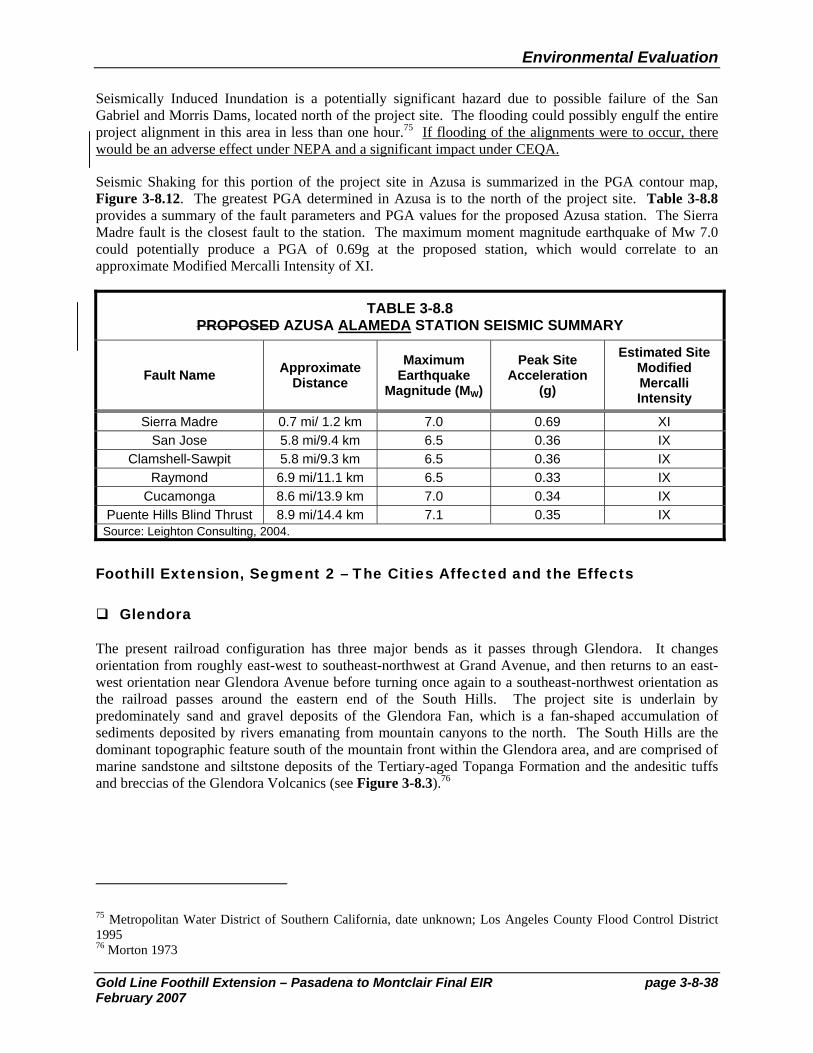
Seismic Shaking for this portion of the project site in Azusa is summarized in the PGA contour map, Figure 3-8.12. The greatest PGA determined in Azusa is to the north of the project site. Table 3-8.8 provides a summary of the fault parameters and PGA values for the proposed Azusa station. The Sierra Madre fault is the closest fault to the station. The maximum moment magnitude earthquake of Mw 7.0 could potentially produce a PGA of 0.69g at the proposed station, which would correlate to an approximate Modified Mercalli Intensity of XI.
TABLE 3-8.8 PROPOSED AZUSA ALAMEDA STATION SEISMIC SUMMARY
Fault Name Approximate Distance
Maximum Earthquake
Magnitude (MW)
Peak Site Acceleration
(g)
Estimated Site Modified Mercalli Intensity
Sierra Madre 0.7 mi/ 1.2 km 7.0 0.69 XI San Jose 5.8 mi/9.4 km 6.5 0.36 IX
Clamshell-Sawpit 5.8 mi/9.3 km 6.5 0.36 IX Raymond 6.9 mi/11.1 km 6.5 0.33 IX
Cucamonga 8.6 mi/13.9 km 7.0 0.34 IX Puente Hills Blind Thrust 8.9 mi/14.4 km 7.1 0.35 IX
Source: Leighton Consulting, 2004.
Foothill Extension, Segment 2 – The Cities Affected and the Effects
Glendora
The present railroad configuration has three major bends as it passes through Glendora. It changes orientation from roughly east-west to southeast-northwest at Grand Avenue, and then returns to an east-west orientation near Glendora Avenue before turning once again to a southeast-northwest orientation as the railroad passes around the eastern end of the South Hills. The project site is underlain by predominately sand and gravel deposits of the Glendora Fan, which is a fan-shaped accumulation of sediments deposited by rivers emanating from mountain canyons to the north. The South Hills are the dominant topographic feature south of the mountain front within the Glendora area, and are comprised of marine sandstone and siltstone deposits of the Tertiary-aged Topanga Formation and the andesitic tuffs and breccias of the Glendora Volcanics (see Figure 3-8.3).76
75 Metropolitan Water District of Southern California, date unknown; Los Angeles County Flood Control District 1995 76 Morton 1973
Environmental Evaluation
Gold Line Foothill Extension – Pasadena to Montclair Final EIR page 3-8-39February 2007
Geologic hazards within the City of Glendora, as described by the General Plan77, include landslides and other slope failures, faulting, seismic shaking, and expansive soils. Numerous landslides have been mapped along the slopes of the San Gabriel Mountain front and the South Hills. The Sierra Madre Fault zone extends along the San Gabriel Mountain front from Azusa into Glendora presenting a possible ground rupture hazard to specific areas of the city and a potential for large ground accelerations (i.e., PGA values) during seismic events on nearby faults.78
Fault-Induced ground rupture is a potentially significant hazard due to the Duarte fault. The presence of the Duarte Fault has been inferred from differences in groundwater elevations, lineaments observed in aerial photographs and geophysical surveys.79 The fault as mapped by Crook et al. (1987) crosses the project alignment near Barranca Avenue and is shown on Figure 3-8.8 coincident with the liquefaction zone boundary. This fault is not considered active by the State, however, is considered active by the County of Los Angeles. The City of Glendora does not recognize this fault in its General Plan.80
Liquefaction is a potentially significant hazard in two locations at the project site in Glendora (see Figure 3-8.8). The Seismic Hazard Zones Map and accompanying report for the Glendora Quadrangle shows that the potential liquefaction extends from Citrus Avenue to just west of Barranca Avenue, and from just north of I-210 into San Dimas.81
Seismically Induced Inundation is a potentially significant impact to the project site. Failure of the Big Dalton Dam has a flood area that extends from Little Dalton Wash to San Dimas Wash. This possible flood would inundate the project site from Grand Avenue to Lone Hill Avenue in less than 30 minutes.82 If flooding of the alignments were to occur, there would be an adverse effect under NEPA and a significant impact under CEQA.
Seismic Shaking for the portion of the project site in Glendora is summarized in the PGA contour map, Figure 3-8.13. The greatest PGA determined in Glendora is along the project site between Lone Hill Avenue and Lorraine Avenue and west of Grand Avenue. Table 3-8.9 provides a summary of the fault parameters and PGA values for the proposed Glendora station. The Sierra Madre fault is the closest fault to the proposed station. The maximum moment magnitude earthquake of Mw 7.0 could potentially produce a PGA of 0.69g at the proposed station, which would correlate to an approximate Modified Mercalli Intensity of XI.
77 City of Glendora 1990 78 Leighton 1973, City of Glendora 1990 79 Crook et al. 1987 80 City of Glendora 1990 81 California Division of Mines and Geology 1999b, Loyd and Wills 1998c 82 Los Angeles County Flood Control District 1973c
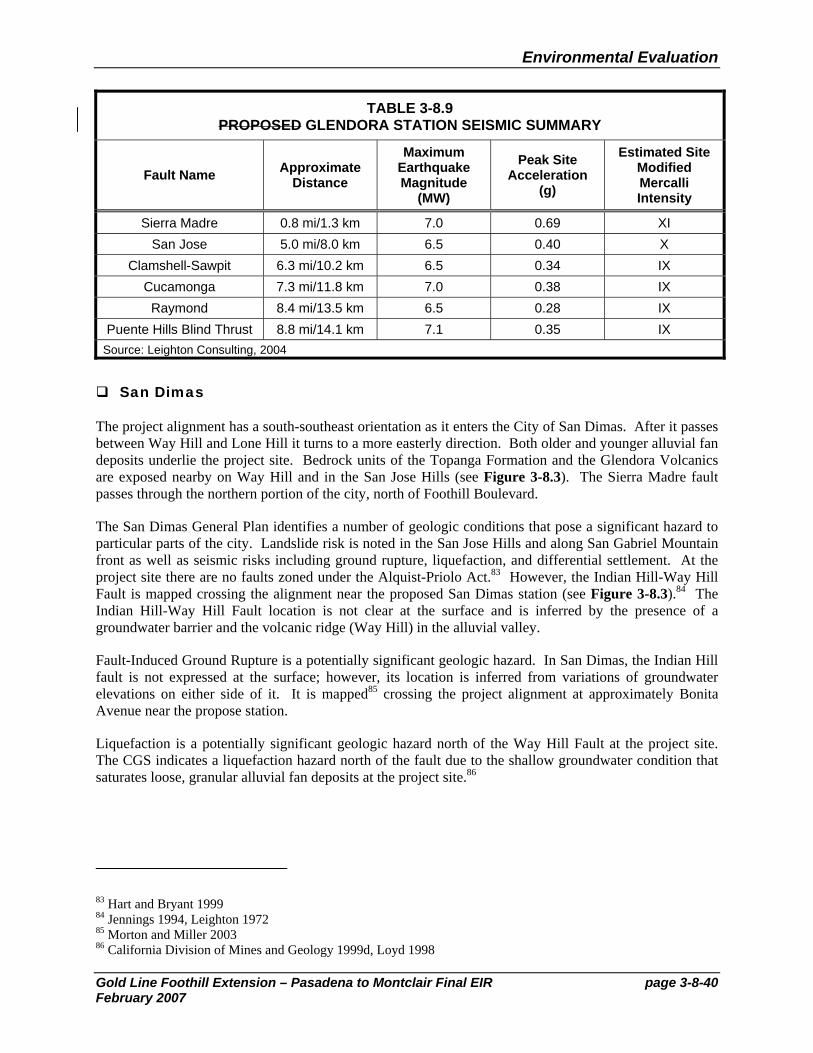
Environmental Evaluation
Gold Line Foothill Extension – Pasadena to Montclair Final EIR page 3-8-40February 2007
TABLE 3-8.9 PROPOSED GLENDORA STATION SEISMIC SUMMARY
Fault Name Approximate Distance
Maximum Earthquake Magnitude
(MW)
Peak Site Acceleration
(g)
Estimated Site Modified Mercalli Intensity
Sierra Madre 0.8 mi/1.3 km 7.0 0.69 XI San Jose 5.0 mi/8.0 km 6.5 0.40 X
Clamshell-Sawpit 6.3 mi/10.2 km 6.5 0.34 IX Cucamonga 7.3 mi/11.8 km 7.0 0.38 IX
Raymond 8.4 mi/13.5 km 6.5 0.28 IX Puente Hills Blind Thrust 8.8 mi/14.1 km 7.1 0.35 IX
Source: Leighton Consulting, 2004
San Dimas
The project alignment has a south-southeast orientation as it enters the City of San Dimas. After it passes between Way Hill and Lone Hill it turns to a more easterly direction. Both older and younger alluvial fan deposits underlie the project site. Bedrock units of the Topanga Formation and the Glendora Volcanics are exposed nearby on Way Hill and in the San Jose Hills (see Figure 3-8.3). The Sierra Madre fault passes through the northern portion of the city, north of Foothill Boulevard.
The San Dimas General Plan identifies a number of geologic conditions that pose a significant hazard to particular parts of the city. Landslide risk is noted in the San Jose Hills and along San Gabriel Mountain front as well as seismic risks including ground rupture, liquefaction, and differential settlement. At the project site there are no faults zoned under the Alquist-Priolo Act.83 However, the Indian Hill-Way Hill Fault is mapped crossing the alignment near the proposed San Dimas station (see Figure 3-8.3).84 The Indian Hill-Way Hill Fault location is not clear at the surface and is inferred by the presence of a groundwater barrier and the volcanic ridge (Way Hill) in the alluvial valley.
Fault-Induced Ground Rupture is a potentially significant geologic hazard. In San Dimas, the Indian Hill fault is not expressed at the surface; however, its location is inferred from variations of groundwater elevations on either side of it. It is mapped85 crossing the project alignment at approximately Bonita Avenue near the propose station.
Liquefaction is a potentially significant geologic hazard north of the Way Hill Fault at the project site. The CGS indicates a liquefaction hazard north of the fault due to the shallow groundwater condition that saturates loose, granular alluvial fan deposits at the project site.86
83 Hart and Bryant 1999 84 Jennings 1994, Leighton 1972 85 Morton and Miller 2003 86 California Division of Mines and Geology 1999d, Loyd 1998
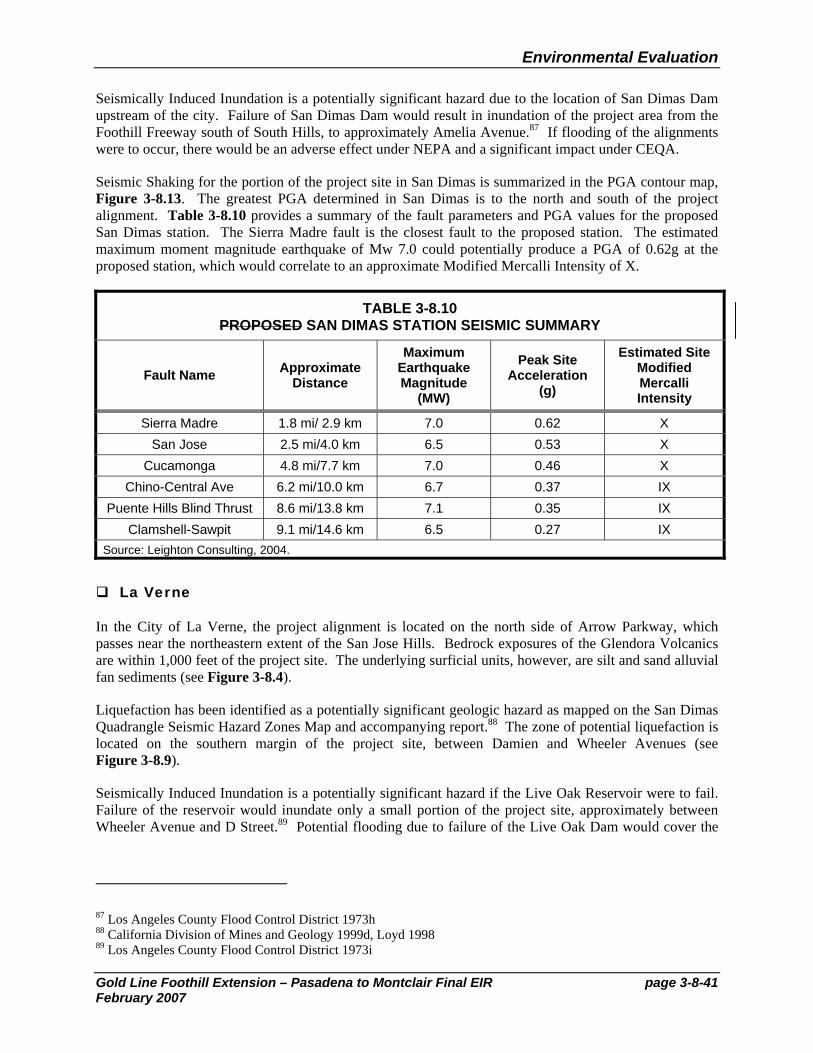
Environmental Evaluation
Gold Line Foothill Extension – Pasadena to Montclair Final EIR page 3-8-41February 2007
Seismically Induced Inundation is a potentially significant hazard due to the location of San Dimas Dam upstream of the city. Failure of San Dimas Dam would result in inundation of the project area from the Foothill Freeway south of South Hills, to approximately Amelia Avenue.87 If flooding of the alignments were to occur, there would be an adverse effect under NEPA and a significant impact under CEQA.
Seismic Shaking for the portion of the project site in San Dimas is summarized in the PGA contour map, Figure 3-8.13. The greatest PGA determined in San Dimas is to the north and south of the project alignment. Table 3-8.10 provides a summary of the fault parameters and PGA values for the proposed San Dimas station. The Sierra Madre fault is the closest fault to the proposed station. The estimated maximum moment magnitude earthquake of Mw 7.0 could potentially produce a PGA of 0.62g at the proposed station, which would correlate to an approximate Modified Mercalli Intensity of X.
TABLE 3-8.10 PROPOSED SAN DIMAS STATION SEISMIC SUMMARY
Fault Name Approximate Distance
Maximum Earthquake Magnitude
(MW)
Peak Site Acceleration
(g)
Estimated Site Modified Mercalli Intensity
Sierra Madre 1.8 mi/ 2.9 km 7.0 0.62 X San Jose 2.5 mi/4.0 km 6.5 0.53 X
Cucamonga 4.8 mi/7.7 km 7.0 0.46 X Chino-Central Ave 6.2 mi/10.0 km 6.7 0.37 IX
Puente Hills Blind Thrust 8.6 mi/13.8 km 7.1 0.35 IX Clamshell-Sawpit 9.1 mi/14.6 km 6.5 0.27 IX
Source: Leighton Consulting, 2004.
La Verne
In the City of La Verne, the project alignment is located on the north side of Arrow Parkway, which passes near the northeastern extent of the San Jose Hills. Bedrock exposures of the Glendora Volcanics are within 1,000 feet of the project site. The underlying surficial units, however, are silt and sand alluvial fan sediments (see Figure 3-8.4).
Liquefaction has been identified as a potentially significant geologic hazard as mapped on the San Dimas Quadrangle Seismic Hazard Zones Map and accompanying report.88 The zone of potential liquefaction is located on the southern margin of the project site, between Damien and Wheeler Avenues (see Figure 3-8.9).
Seismically Induced Inundation is a potentially significant hazard if the Live Oak Reservoir were to fail. Failure of the reservoir would inundate only a small portion of the project site, approximately between Wheeler Avenue and D Street.89 Potential flooding due to failure of the Live Oak Dam would cover the
87 Los Angeles County Flood Control District 1973h 88 California Division of Mines and Geology 1999d, Loyd 1998 89 Los Angeles County Flood Control District 1973i
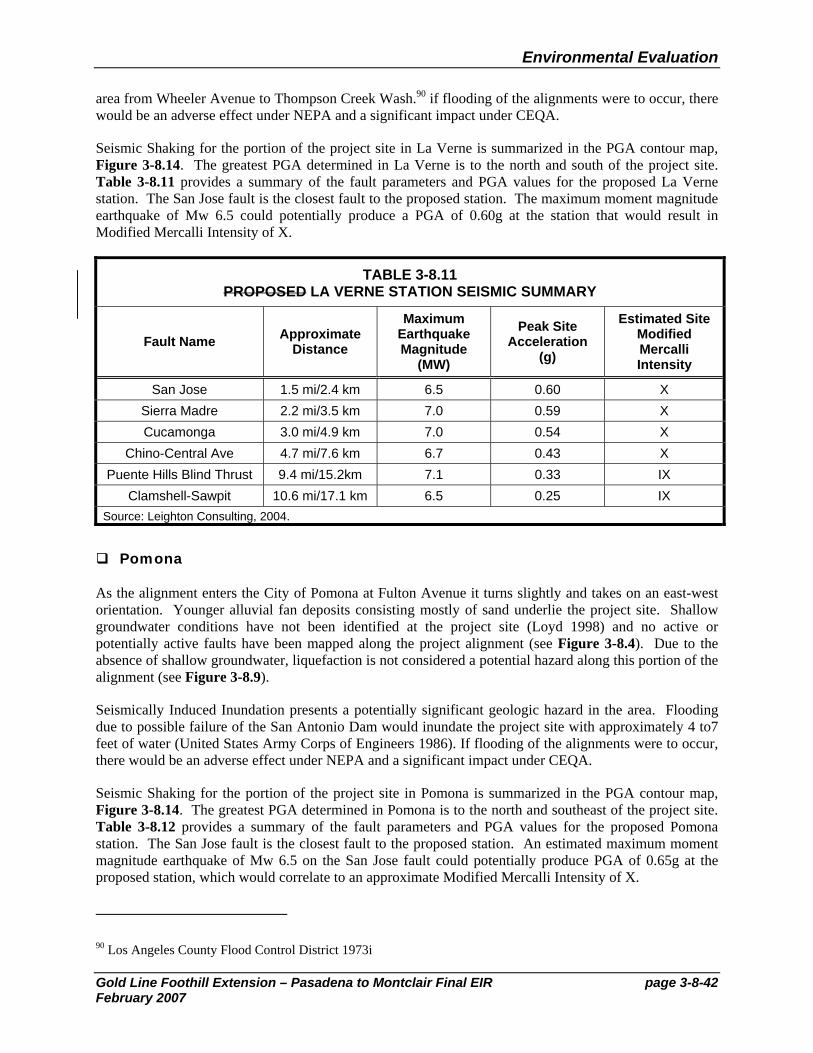
Environmental Evaluation
Gold Line Foothill Extension – Pasadena to Montclair Final EIR page 3-8-42February 2007
area from Wheeler Avenue to Thompson Creek Wash.90 if flooding of the alignments were to occur, there would be an adverse effect under NEPA and a significant impact under CEQA.
Seismic Shaking for the portion of the project site in La Verne is summarized in the PGA contour map, Figure 3-8.14. The greatest PGA determined in La Verne is to the north and south of the project site. Table 3-8.11 provides a summary of the fault parameters and PGA values for the proposed La Verne station. The San Jose fault is the closest fault to the proposed station. The maximum moment magnitude earthquake of Mw 6.5 could potentially produce a PGA of 0.60g at the station that would result in Modified Mercalli Intensity of X.
TABLE 3-8.11 PROPOSED LA VERNE STATION SEISMIC SUMMARY
Fault Name Approximate Distance
Maximum Earthquake Magnitude
(MW)
Peak Site Acceleration
(g)
Estimated Site Modified Mercalli Intensity
San Jose 1.5 mi/2.4 km 6.5 0.60 X Sierra Madre 2.2 mi/3.5 km 7.0 0.59 X Cucamonga 3.0 mi/4.9 km 7.0 0.54 X
Chino-Central Ave 4.7 mi/7.6 km 6.7 0.43 X Puente Hills Blind Thrust 9.4 mi/15.2km 7.1 0.33 IX
Clamshell-Sawpit 10.6 mi/17.1 km 6.5 0.25 IX Source: Leighton Consulting, 2004.
Pomona
As the alignment enters the City of Pomona at Fulton Avenue it turns slightly and takes on an east-west orientation. Younger alluvial fan deposits consisting mostly of sand underlie the project site. Shallow groundwater conditions have not been identified at the project site (Loyd 1998) and no active or potentially active faults have been mapped along the project alignment (see Figure 3-8.4). Due to the absence of shallow groundwater, liquefaction is not considered a potential hazard along this portion of the alignment (see Figure 3-8.9).
Seismically Induced Inundation presents a potentially significant geologic hazard in the area. Flooding due to possible failure of the San Antonio Dam would inundate the project site with approximately 4 to7 feet of water (United States Army Corps of Engineers 1986). If flooding of the alignments were to occur, there would be an adverse effect under NEPA and a significant impact under CEQA.
Seismic Shaking for the portion of the project site in Pomona is summarized in the PGA contour map, Figure 3-8.14. The greatest PGA determined in Pomona is to the north and southeast of the project site. Table 3-8.12 provides a summary of the fault parameters and PGA values for the proposed Pomona station. The San Jose fault is the closest fault to the proposed station. An estimated maximum moment magnitude earthquake of Mw 6.5 on the San Jose fault could potentially produce PGA of 0.65g at the proposed station, which would correlate to an approximate Modified Mercalli Intensity of X.
90 Los Angeles County Flood Control District 1973i
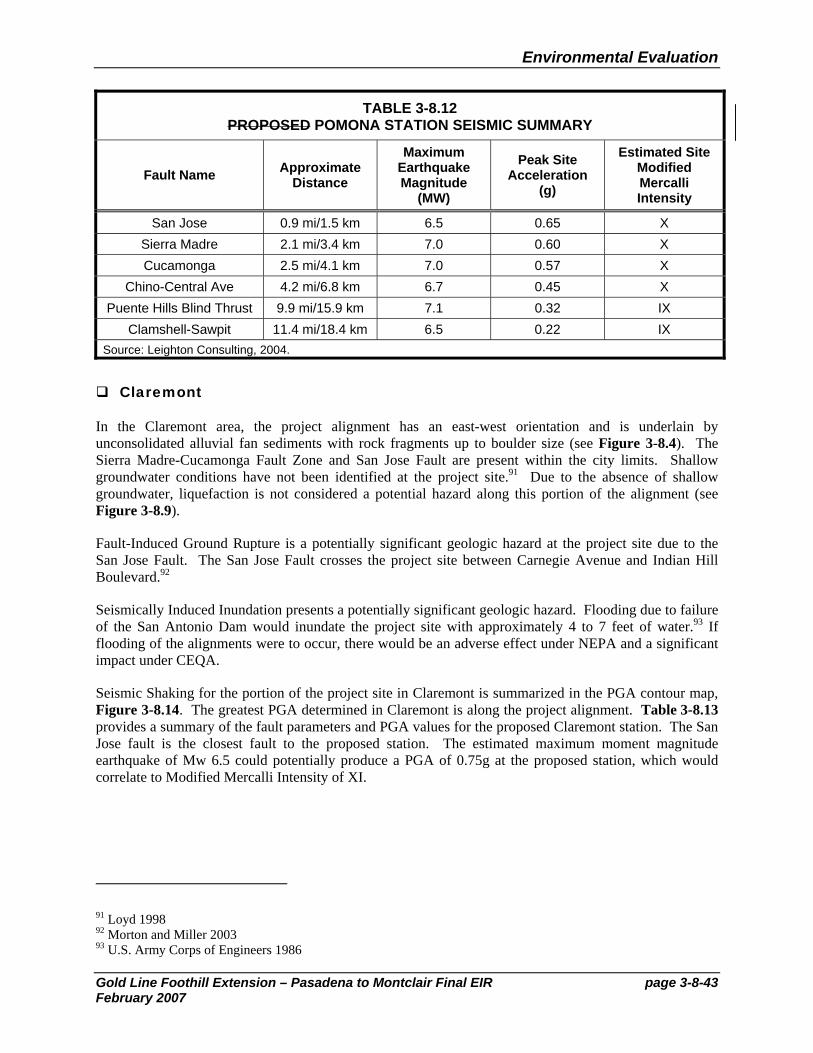
Environmental Evaluation
Gold Line Foothill Extension – Pasadena to Montclair Final EIR page 3-8-43February 2007
TABLE 3-8.12 PROPOSED POMONA STATION SEISMIC SUMMARY
Fault Name Approximate Distance
Maximum Earthquake Magnitude
(MW)
Peak Site Acceleration
(g)
Estimated Site Modified Mercalli Intensity
San Jose 0.9 mi/1.5 km 6.5 0.65 X Sierra Madre 2.1 mi/3.4 km 7.0 0.60 X Cucamonga 2.5 mi/4.1 km 7.0 0.57 X
Chino-Central Ave 4.2 mi/6.8 km 6.7 0.45 X Puente Hills Blind Thrust 9.9 mi/15.9 km 7.1 0.32 IX
Clamshell-Sawpit 11.4 mi/18.4 km 6.5 0.22 IX Source: Leighton Consulting, 2004.
Claremont
In the Claremont area, the project alignment has an east-west orientation and is underlain by unconsolidated alluvial fan sediments with rock fragments up to boulder size (see Figure 3-8.4). The Sierra Madre-Cucamonga Fault Zone and San Jose Fault are present within the city limits. Shallow groundwater conditions have not been identified at the project site.91 Due to the absence of shallow groundwater, liquefaction is not considered a potential hazard along this portion of the alignment (see Figure 3-8.9).
Fault-Induced Ground Rupture is a potentially significant geologic hazard at the project site due to the San Jose Fault. The San Jose Fault crosses the project site between Carnegie Avenue and Indian Hill Boulevard.92
Seismically Induced Inundation presents a potentially significant geologic hazard. Flooding due to failure of the San Antonio Dam would inundate the project site with approximately 4 to 7 feet of water.93 If flooding of the alignments were to occur, there would be an adverse effect under NEPA and a significant impact under CEQA.
Seismic Shaking for the portion of the project site in Claremont is summarized in the PGA contour map, Figure 3-8.14. The greatest PGA determined in Claremont is along the project alignment. Table 3-8.13 provides a summary of the fault parameters and PGA values for the proposed Claremont station. The San Jose fault is the closest fault to the proposed station. The estimated maximum moment magnitude earthquake of Mw 6.5 could potentially produce a PGA of 0.75g at the proposed station, which would correlate to Modified Mercalli Intensity of XI.
91 Loyd 1998 92 Morton and Miller 2003 93 U.S. Army Corps of Engineers 1986
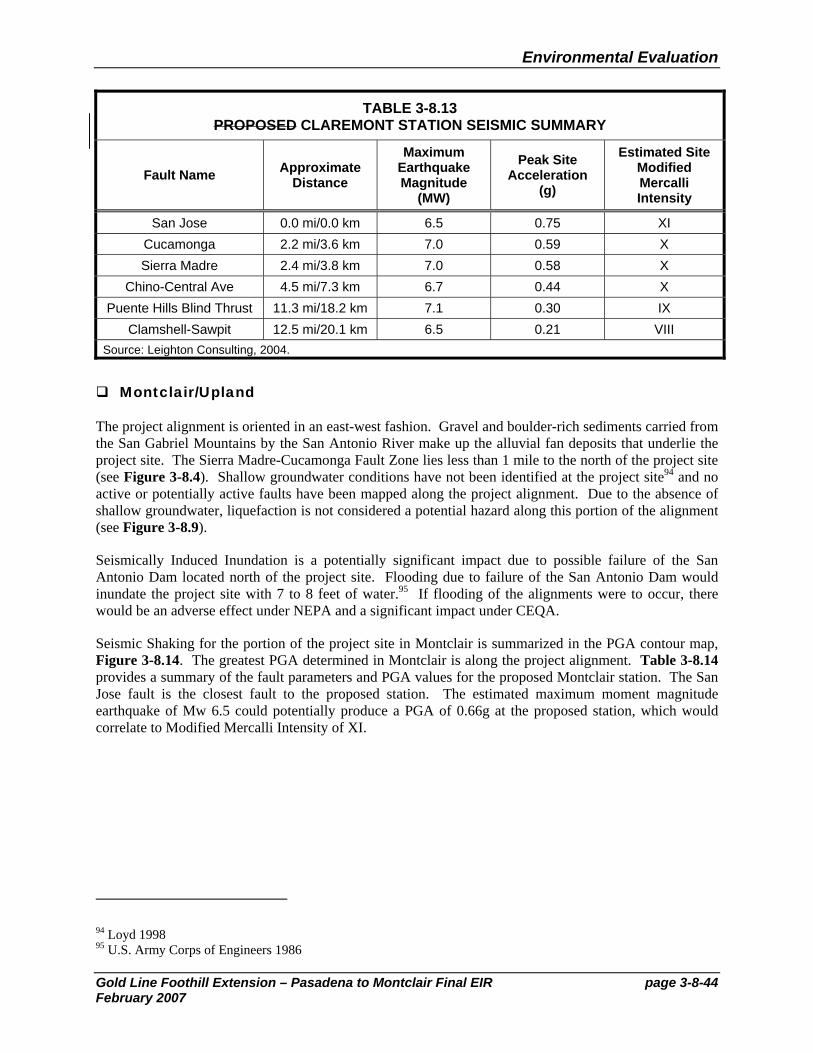
Environmental Evaluation
Gold Line Foothill Extension – Pasadena to Montclair Final EIR page 3-8-44February 2007
TABLE 3-8.13 PROPOSED CLAREMONT STATION SEISMIC SUMMARY
Fault Name Approximate Distance
Maximum Earthquake Magnitude
(MW)
Peak Site Acceleration
(g)
Estimated Site Modified Mercalli Intensity
San Jose 0.0 mi/0.0 km 6.5 0.75 XI Cucamonga 2.2 mi/3.6 km 7.0 0.59 X Sierra Madre 2.4 mi/3.8 km 7.0 0.58 X
Chino-Central Ave 4.5 mi/7.3 km 6.7 0.44 X Puente Hills Blind Thrust 11.3 mi/18.2 km 7.1 0.30 IX
Clamshell-Sawpit 12.5 mi/20.1 km 6.5 0.21 VIII Source: Leighton Consulting, 2004.
Montclair/Upland
The project alignment is oriented in an east-west fashion. Gravel and boulder-rich sediments carried from the San Gabriel Mountains by the San Antonio River make up the alluvial fan deposits that underlie the project site. The Sierra Madre-Cucamonga Fault Zone lies less than 1 mile to the north of the project site (see Figure 3-8.4). Shallow groundwater conditions have not been identified at the project site94 and no active or potentially active faults have been mapped along the project alignment. Due to the absence of shallow groundwater, liquefaction is not considered a potential hazard along this portion of the alignment (see Figure 3-8.9).
Seismically Induced Inundation is a potentially significant impact due to possible failure of the San Antonio Dam located north of the project site. Flooding due to failure of the San Antonio Dam would inundate the project site with 7 to 8 feet of water.95 If flooding of the alignments were to occur, there would be an adverse effect under NEPA and a significant impact under CEQA.
Seismic Shaking for the portion of the project site in Montclair is summarized in the PGA contour map, Figure 3-8.14. The greatest PGA determined in Montclair is along the project alignment. Table 3-8.14 provides a summary of the fault parameters and PGA values for the proposed Montclair station. The San Jose fault is the closest fault to the proposed station. The estimated maximum moment magnitude earthquake of Mw 6.5 could potentially produce a PGA of 0.66g at the proposed station, which would correlate to Modified Mercalli Intensity of XI.
94 Loyd 1998 95 U.S. Army Corps of Engineers 1986
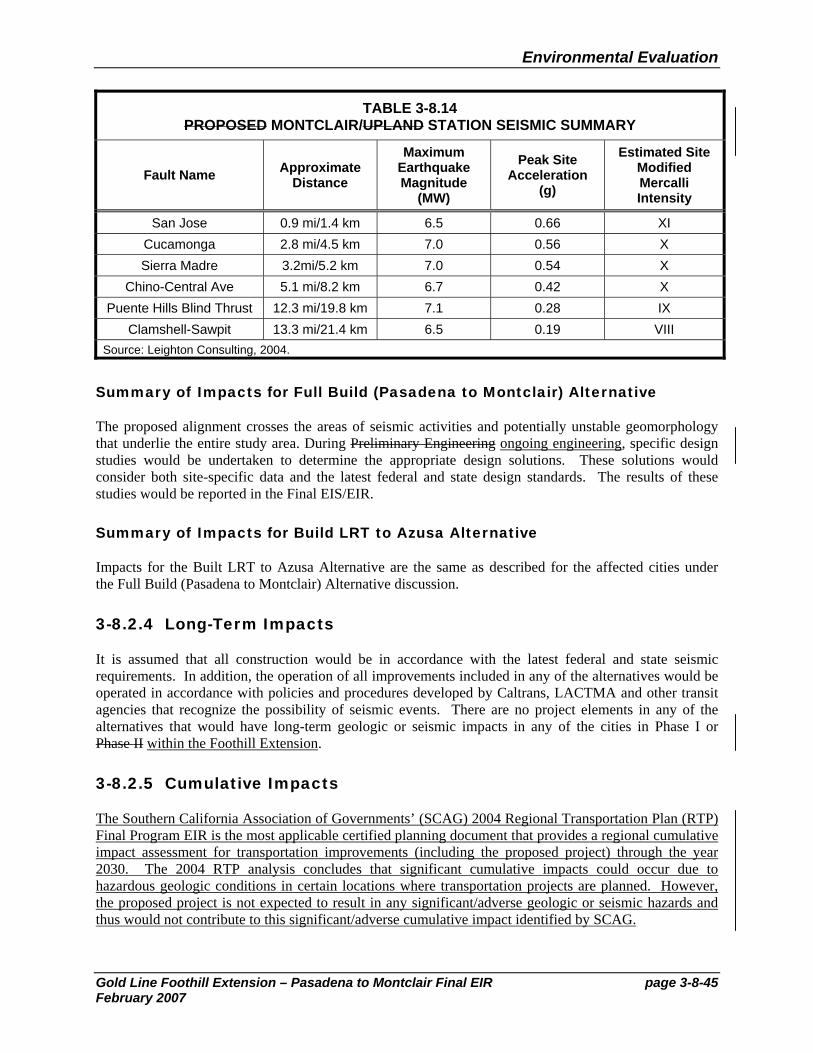
Environmental Evaluation
Gold Line Foothill Extension – Pasadena to Montclair Final EIR page 3-8-45February 2007
TABLE 3-8.14 PROPOSED MONTCLAIR/UPLAND STATION SEISMIC SUMMARY
Fault Name Approximate Distance
Maximum Earthquake Magnitude
(MW)
Peak Site Acceleration
(g)
Estimated Site Modified Mercalli Intensity
San Jose 0.9 mi/1.4 km 6.5 0.66 XI Cucamonga 2.8 mi/4.5 km 7.0 0.56 X Sierra Madre 3.2mi/5.2 km 7.0 0.54 X
Chino-Central Ave 5.1 mi/8.2 km 6.7 0.42 X Puente Hills Blind Thrust 12.3 mi/19.8 km 7.1 0.28 IX
Clamshell-Sawpit 13.3 mi/21.4 km 6.5 0.19 VIII Source: Leighton Consulting, 2004.
Summary of Impacts for Full Build (Pasadena to Montclair) Alternative
The proposed alignment crosses the areas of seismic activities and potentially unstable geomorphology that underlie the entire study area. During Preliminary Engineering ongoing engineering, specific design studies would be undertaken to determine the appropriate design solutions. These solutions would consider both site-specific data and the latest federal and state design standards. The results of these studies would be reported in the Final EIS/EIR.
Summary of Impacts for Build LRT to Azusa Alternative
Impacts for the Built LRT to Azusa Alternative are the same as described for the affected cities under the Full Build (Pasadena to Montclair) Alternative discussion.
3-8.2.4 Long-Term Impacts
It is assumed that all construction would be in accordance with the latest federal and state seismic requirements. In addition, the operation of all improvements included in any of the alternatives would be operated in accordance with policies and procedures developed by Caltrans, LACTMA and other transit agencies that recognize the possibility of seismic events. There are no project elements in any of the alternatives that would have long-term geologic or seismic impacts in any of the cities in Phase I or Phase II within the Foothill Extension.
3-8.2.5 Cumulative Impacts
The Southern California Association of Governments’ (SCAG) 2004 Regional Transportation Plan (RTP) Final Program EIR is the most applicable certified planning document that provides a regional cumulative impact assessment for transportation improvements (including the proposed project) through the year 2030. The 2004 RTP analysis concludes that significant cumulative impacts could occur due to hazardous geologic conditions in certain locations where transportation projects are planned. However, the proposed project is not expected to result in any significant/adverse geologic or seismic hazards and thus would not contribute to this significant/adverse cumulative impact identified by SCAG.
Environmental Evaluation
Gold Line Foothill Extension – Pasadena to Montclair Final EIR page 3-8-46February 2007
There are no project elements in any of the alternatives that would contribute to cumulative geologic or seismic impacts.
3-8.2.6 Impacts Addressed by Regulatory Compliance
a. Construction-Period Impacts
Impacts that would arise from construction of any of the alternatives were identified in Section 3-8.3.3, above. Elimination or reduction of these construction-period impacts would occur through two steps, as follows: (1) compliance with local, state or federal regulations or permits that have been developed by agencies to manage construction impacts, to meet legally established environmental impact criteria or thresholds, and/or to ensure that actions occurring under agency approvals or permits are in compliance with laws and policies, and (2) implementation of the proposed alternatives with any additional construction-period mitigation measures defined in Section 3-8.3. Following is a discussion of the construction-period impacts for each of the alternatives that would be addressed by the first step, regulatory compliance.
Geologic and seismic issues would be addressed during Preliminary ongoing engineering and implemented during Construction. Potential impacts associated with geologic and seismic conditions require a greater degree of design development that is available during preparing of the Draft EIS/EIR. During Preliminary Engineering, Subsequent to the circulation of the Draft EIS/EIR, specific design studies would be were undertaken to determine appropriate design solutions. These solutions would consider both site-specific data and the latest federal and state regulations and design standards. The results of these studies would be reported in the Final EIS/EIR. Based on the fact that there are numerous functioning railroad facilities in the Los Angeles region that have been designed with the same geologic and seismic considerations, it is anticipated that the level of design conducted during Preliminary ongoing engineering would result in less than adverse effects under NEPA and less than significant impacts under CEQA.
Table 3-8.15 provides a list of recommendations for matters to be addressed in the special design studies. During Preliminary ongoing engineering studies, subject to the results of detailed studies, these recommendations may be have been transposed into design standards. and/or mitigation measures that would be reported in the FEIS/FEIR.
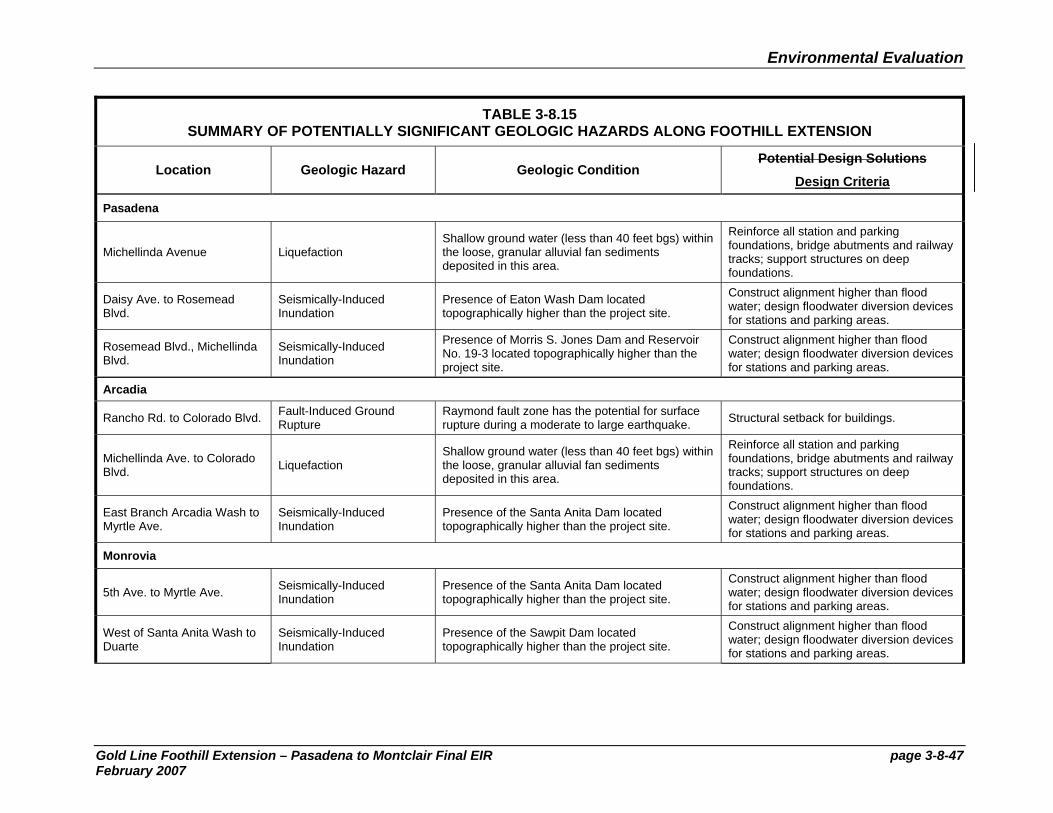
Environmental Evaluation
Gold Line Foothill Extension – Pasadena to Montclair Final EIR page 3-8-47 February 2007
TABLE 3-8.15 SUMMARY OF POTENTIALLY SIGNIFICANT GEOLOGIC HAZARDS ALONG FOOTHILL EXTENSION
Location Geologic Hazard Geologic Condition Potential Design Solutions
Design Criteria
Pasadena
Michellinda Avenue Liquefaction Shallow ground water (less than 40 feet bgs) within the loose, granular alluvial fan sediments deposited in this area.
Reinforce all station and parking foundations, bridge abutments and railway tracks; support structures on deep foundations.
Daisy Ave. to Rosemead Blvd.
Seismically-Induced Inundation
Presence of Eaton Wash Dam located topographically higher than the project site.
Construct alignment higher than flood water; design floodwater diversion devices for stations and parking areas.
Rosemead Blvd., Michellinda Blvd.
Seismically-Induced Inundation
Presence of Morris S. Jones Dam and Reservoir No. 19-3 located topographically higher than the project site.
Construct alignment higher than flood water; design floodwater diversion devices for stations and parking areas.
Arcadia
Rancho Rd. to Colorado Blvd. Fault-Induced Ground Rupture
Raymond fault zone has the potential for surface rupture during a moderate to large earthquake. Structural setback for buildings.
Michellinda Ave. to Colorado Blvd. Liquefaction
Shallow ground water (less than 40 feet bgs) within the loose, granular alluvial fan sediments deposited in this area.
Reinforce all station and parking foundations, bridge abutments and railway tracks; support structures on deep foundations.
East Branch Arcadia Wash to Myrtle Ave.
Seismically-Induced Inundation
Presence of the Santa Anita Dam located topographically higher than the project site.
Construct alignment higher than flood water; design floodwater diversion devices for stations and parking areas.
Monrovia
5th Ave. to Myrtle Ave. Seismically-Induced Inundation
Presence of the Santa Anita Dam located topographically higher than the project site.
Construct alignment higher than flood water; design floodwater diversion devices for stations and parking areas.
West of Santa Anita Wash to Duarte
Seismically-Induced Inundation
Presence of the Sawpit Dam located topographically higher than the project site.
Construct alignment higher than flood water; design floodwater diversion devices for stations and parking areas.
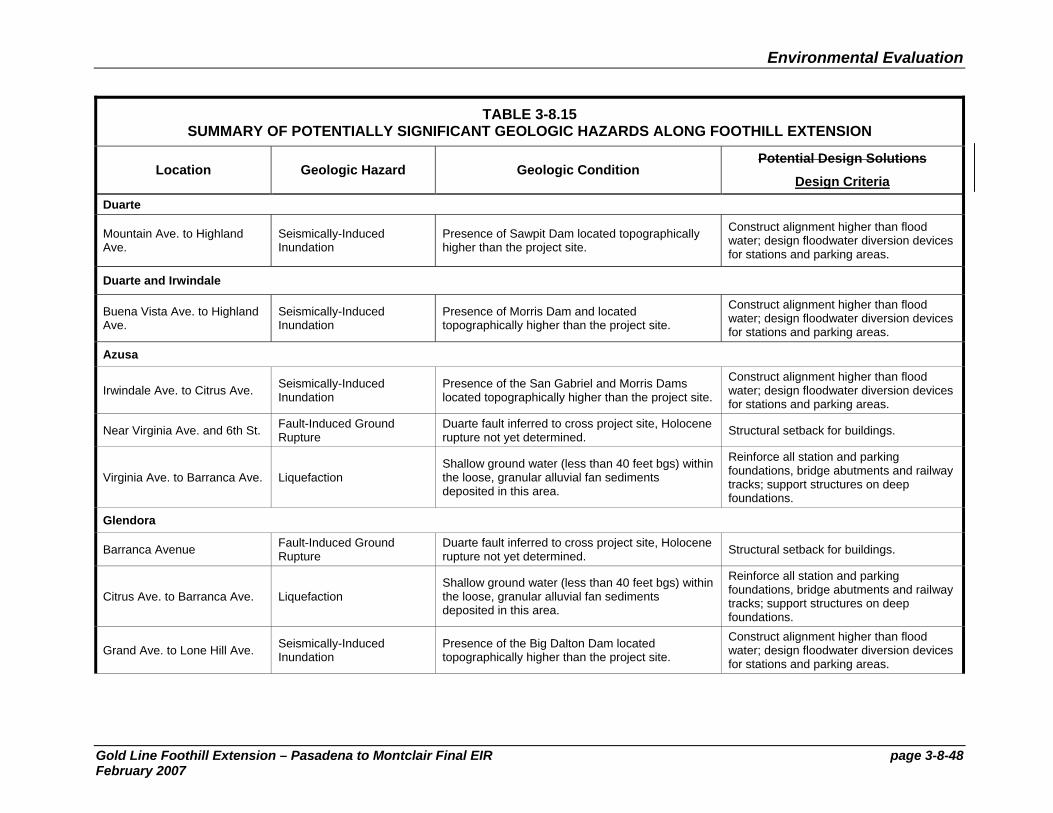
Environmental Evaluation
Gold Line Foothill Extension – Pasadena to Montclair Final EIR page 3-8-48 February 2007
TABLE 3-8.15 SUMMARY OF POTENTIALLY SIGNIFICANT GEOLOGIC HAZARDS ALONG FOOTHILL EXTENSION
Location Geologic Hazard Geologic Condition Potential Design Solutions
Design Criteria Duarte
Mountain Ave. to Highland Ave.
Seismically-Induced Inundation
Presence of Sawpit Dam located topographically higher than the project site.
Construct alignment higher than flood water; design floodwater diversion devices for stations and parking areas.
Duarte and Irwindale
Buena Vista Ave. to Highland Ave.
Seismically-Induced Inundation
Presence of Morris Dam and located topographically higher than the project site.
Construct alignment higher than flood water; design floodwater diversion devices for stations and parking areas.
Azusa
Irwindale Ave. to Citrus Ave. Seismically-Induced Inundation
Presence of the San Gabriel and Morris Dams located topographically higher than the project site.
Construct alignment higher than flood water; design floodwater diversion devices for stations and parking areas.
Near Virginia Ave. and 6th St. Fault-Induced Ground Rupture
Duarte fault inferred to cross project site, Holocene rupture not yet determined. Structural setback for buildings.
Virginia Ave. to Barranca Ave. Liquefaction Shallow ground water (less than 40 feet bgs) within the loose, granular alluvial fan sediments deposited in this area.
Reinforce all station and parking foundations, bridge abutments and railway tracks; support structures on deep foundations.
Glendora
Barranca Avenue Fault-Induced Ground Rupture
Duarte fault inferred to cross project site, Holocene rupture not yet determined. Structural setback for buildings.
Citrus Ave. to Barranca Ave. Liquefaction Shallow ground water (less than 40 feet bgs) within the loose, granular alluvial fan sediments deposited in this area.
Reinforce all station and parking foundations, bridge abutments and railway tracks; support structures on deep foundations.
Grand Ave. to Lone Hill Ave. Seismically-Induced Inundation
Presence of the Big Dalton Dam located topographically higher than the project site.
Construct alignment higher than flood water; design floodwater diversion devices for stations and parking areas.
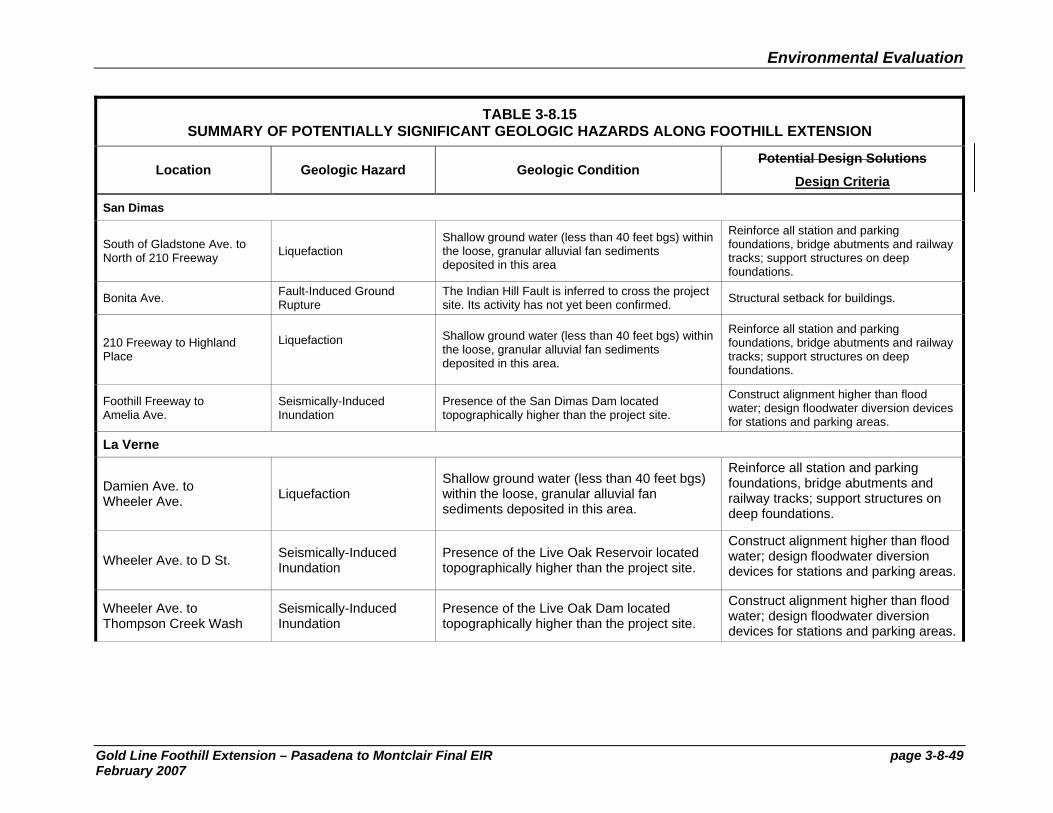
Environmental Evaluation
Gold Line Foothill Extension – Pasadena to Montclair Final EIR page 3-8-49 February 2007
TABLE 3-8.15 SUMMARY OF POTENTIALLY SIGNIFICANT GEOLOGIC HAZARDS ALONG FOOTHILL EXTENSION
Location Geologic Hazard Geologic Condition Potential Design Solutions
Design Criteria
San Dimas
South of Gladstone Ave. to North of 210 Freeway Liquefaction
Shallow ground water (less than 40 feet bgs) within the loose, granular alluvial fan sediments deposited in this area
Reinforce all station and parking foundations, bridge abutments and railway tracks; support structures on deep foundations.
Bonita Ave. Fault-Induced Ground Rupture
The Indian Hill Fault is inferred to cross the project site. Its activity has not yet been confirmed. Structural setback for buildings.
210 Freeway to Highland Place
Liquefaction
Shallow ground water (less than 40 feet bgs) within the loose, granular alluvial fan sediments deposited in this area.
Reinforce all station and parking foundations, bridge abutments and railway tracks; support structures on deep foundations.
Foothill Freeway to Amelia Ave.
Seismically-Induced Inundation
Presence of the San Dimas Dam located topographically higher than the project site.
Construct alignment higher than flood water; design floodwater diversion devices for stations and parking areas.
La Verne
Damien Ave. to Wheeler Ave. Liquefaction
Shallow ground water (less than 40 feet bgs) within the loose, granular alluvial fan sediments deposited in this area.
Reinforce all station and parking foundations, bridge abutments and railway tracks; support structures on deep foundations.
Wheeler Ave. to D St. Seismically-Induced Inundation
Presence of the Live Oak Reservoir located topographically higher than the project site.
Construct alignment higher than flood water; design floodwater diversion devices for stations and parking areas.
Wheeler Ave. to Thompson Creek Wash
Seismically-Induced Inundation
Presence of the Live Oak Dam located topographically higher than the project site.
Construct alignment higher than flood water; design floodwater diversion devices for stations and parking areas.
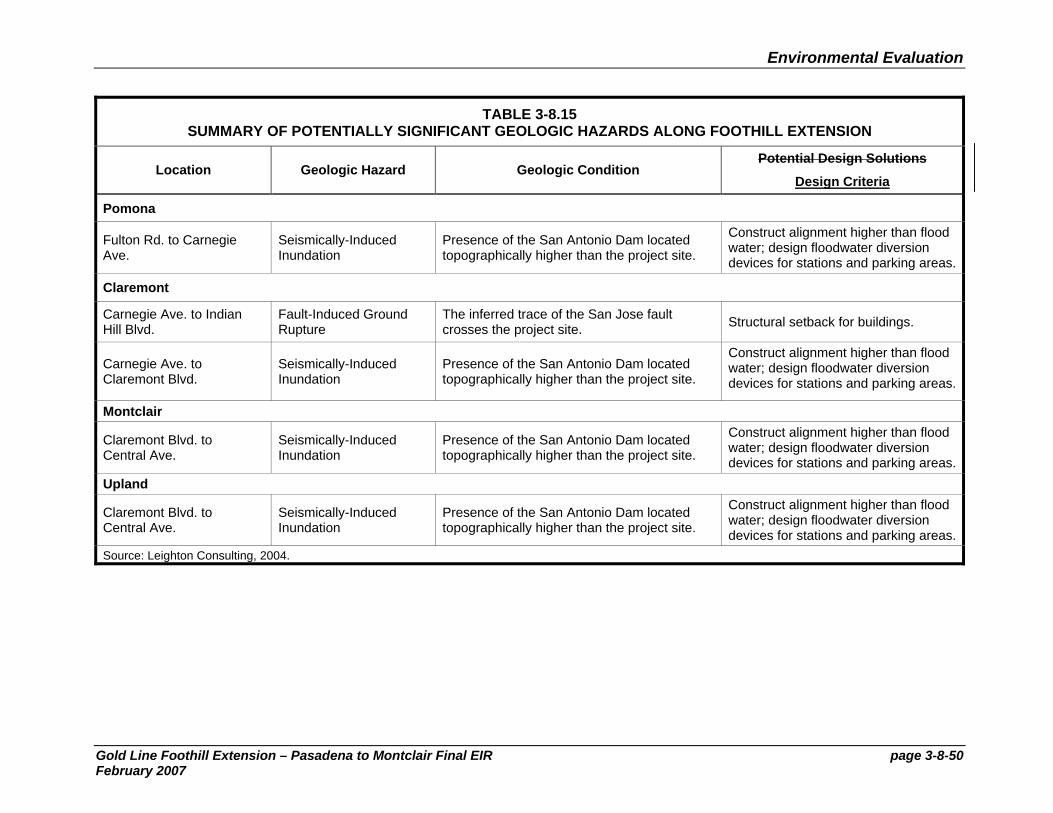
Environmental Evaluation
Gold Line Foothill Extension – Pasadena to Montclair Final EIR page 3-8-50 February 2007
TABLE 3-8.15 SUMMARY OF POTENTIALLY SIGNIFICANT GEOLOGIC HAZARDS ALONG FOOTHILL EXTENSION
Location Geologic Hazard Geologic Condition Potential Design Solutions
Design Criteria
Pomona
Fulton Rd. to Carnegie Ave.
Seismically-Induced Inundation
Presence of the San Antonio Dam located topographically higher than the project site.
Construct alignment higher than flood water; design floodwater diversion devices for stations and parking areas.
Claremont
Carnegie Ave. to Indian Hill Blvd.
Fault-Induced Ground Rupture
The inferred trace of the San Jose fault crosses the project site. Structural setback for buildings.
Carnegie Ave. to Claremont Blvd.
Seismically-Induced Inundation
Presence of the San Antonio Dam located topographically higher than the project site.
Construct alignment higher than flood water; design floodwater diversion devices for stations and parking areas.
Montclair
Claremont Blvd. to Central Ave.
Seismically-Induced Inundation
Presence of the San Antonio Dam located topographically higher than the project site.
Construct alignment higher than flood water; design floodwater diversion devices for stations and parking areas.
Upland
Claremont Blvd. to Central Ave.
Seismically-Induced Inundation
Presence of the San Antonio Dam located topographically higher than the project site.
Construct alignment higher than flood water; design floodwater diversion devices for stations and parking areas.
Source: Leighton Consulting, 2004.
Environmental Evaluation
Gold Line Foothill Extension – Pasadena to Montclair Final EIR page 3-8-51 February 2007
b. Long-Term Impacts
There are no regulations related to long-term impacts. Additionally, there are no anticipated long-term impacts for any of the alternatives related to geological or seismic issues.
3-8.3 Mitigation Measures
3-8.3.1 Construction-Period Mitigation Measures
Construction-period impacts would be eliminated or reduced to less than adverse/less than to significant by complying with the federal and state regulatory requirements and/or permits identified in Section 3-8.3.6, so no additional measures to mitigate impacts are anticipated.
3-8.3.2 Long-Term Mitigation
Since no long-term impacts were identified, no long-term mitigation measures are required.
3-8.4 Impact Results with Mitigation
The following sections report the result of complying with regulatory requirements and proposed mitigation measures. The intent of this section is to summarize where identified impacts have been eliminated or reduced to less than adverse/less than significant levels, or whether there may be remainder impacts.
3-8.4.1 Construction Period
Construction-period impacts would be eliminated or reduced to less than adverse/less than significant levels by complying with federal and state regulatory requirements and/or permits identified in Section 3-8.3.6. No mitigation measures are necessary. As a result of these two conditions, construction-period impacts would be not adverse under NEPA and not significant under CEQA.
3-8.4.2 Long-Term Mitigation
No long-term impacts were identified, and no mitigation measures are required.
Environmental Evaluation
Gold Line Foothill Extension – Pasadena to Montclair Final EIR page 3-8-52 February 2007
THIS PAGE INTENTIONALLY BLANK