Embed Size (px)
Citation preview
www.advhealthmat.dewww.MaterialsViews.com
FULL P
APER
Michael Gasik,* Lieve Van Mellaert, Dorothée Pierron, Annabel Braem, Dorien Hofmans, Evelien De Waelheyns, Jozef Anné, Marie-Françoise Harmand, and Jozef Vleugels
Reduction of Biofi lm Infection Risks and Promotion of Osteointegration for Optimized Surfaces of Titanium Implants
© 2012 WILEY-VCH Verlag GmbH & Co. KGaA, WeinheimAdv. Healthcare Mater. 2012, 1, 117–127
Prof. M. Gasik Aalto University FoundationSchool of Chemical TechnologyP. O. Box 16200, FIN-00076 AALTO, Finland E-mail: [email protected] Prof. L. Van Mellaert , D. Hofmans , E. De Waelheyns , Prof. J. Anné Laboratory of BacteriologyRega Institute for medical researchKatholieke Universiteit LeuvenMinderbroedersstraat 10, B-3000 Leuven, Belgium Dr. D. Pierron , Prof. M.-F. Harmand LEMI–Laboratoire d’Evaluation des Matériels ImplantablesTechnopole Bordeaux-Montesquieu2 allée François Magendie, F-33650 Martillac, France A. Braem , Prof. J. Vleugels Department of Metallurgy and Materials EngineeringKatholieke Universiteit LeuvenKasteelpark Arenberg 44, B-3001 Heverlee, Belgium
DOI: 10.1002/adhm.201100006
Titanium-based implants are widely used in modern clinical practice; however, complications associated with implants due to bacterial-induced infections arise frequently, caused mainly by staphylococci, streptococci, Pseudomonas spp. and coliform bacteria. Although increased hydrophilicity of the biomaterial surface is known to be benefi cial in minimizing the biofi lm, quantitative analyses between the actual implant parameters and bacterial development are scarce. Here, the results of in vitro studies of Staphylococcus aureus and Staphylococcus epidermidis proliferation on uncoated and coated titanium materials with different roughness, porosity, topology, and hydrophilicity are shown. The same materials have been tested in parallel with respect to human osteogenic and endothelial cell adhesion, proliferation, and differentiation. The experimental data proc-essed by meta-analysis are indicating the possibility of decreasing the biofi lm formation by 80–90% for fl at substrates versus untreated plasma-sprayed porous titanium and by 65–95% for other porous titanium coatings. It is also shown that optimized surfaces would lead to 10–50% enhanced cell proliferation and differentiation versus reference porous titanium coat-ings. This presents an opportunity to manufacture implants with intrinsic reduced infection risk, yet without the additional use of antibacterial substances.
1. Introduction
Infections associated with implantations remain a potentially serious complication, even if their incidence is relatively low. [ 1–3 ] For total hip arthroplasty (THA) operations being on the rise (from over 260 000 made in 2004 to ∼ 423 000 in 2008 in the US alone) up to 1.3% were treated for reasons of infection. For total knee arthroplasty (TKA), “primary” infections were reported up to 2% of ∼ 490 000 cases in 2004 and more than 600 000 in 2008. [ 1 , 3 , 4 ] About 10% of the arthroplasties were revised later due to implant failures; [ 5 ] 8–15% of which were reported to be a direct result of an infec-tion. [ 1 , 5 ] These “primary” and “secondary” infections together indicate a failure about 2.4% of revised THA and 2.3% of revised TKA (various numbers could be found in different sources). Implant-related infec-tions were linked with a mortality rate of 7–63% for THA and of 2.5% for TKA. Furthermore for 80% of the infected cases for TKA, the implants were no more functional. [ 3 ] Most of the published data suggest the percentage of the direct
infection-caused complications and the following revisions to be ∼ 1–2%, which has been stable for many years. However, the rising total number of orthopedic operations worldwide clearly means more patients would potentially suffer from these infec-tions, unless that percentage will be signifi cantly reduced.
Most of the microorganisms causing implant infections are present in the host fl ora, of which the most frequent are staphylococci ( Staphylococcus aureus and Staphylococcus epider-midis ) and enteric bacteria. [ 2 , 3 ] Staphylococci infections are par-ticularly associated with metallic and polymer implants and it is a common practice to apply an antibiotic treatment to prevent them. However, with emerging amount of multiple antibiotic-resistant strains (MRSA and others), the effi cacy of antibiotic treatment might be low and being even further suppressed due to biofi lm formation. [ 1 , 3 , 6 ] The biofi lm is formed after microbial attachment and further colonization of the surface. During for-mation of microcolonies, microbes are encapsulated in an extra-cellular polymeric substance layer existing of polysaccharides,
wileyonlinelibrary.com 117

www.MaterialsViews.com
118
FULL
PAPER
www.advhealthmat.de
proteins, and other products, possibly making bacteria up to thousand times more resistant to antibiotics compared to their planktonic counterparts and inaccessible for the host immune system. [ 3 , 4 , 6–9 ] The biofi lm is extremely stable and virulent with little possibilities to be removed from the implant surface. It is generally understood that the key factor in preventing biofi lm formation is the bacterial adhesion to the surface. Therefore, if the bacterial adhesion to an implant surface is being properly understood and controlled, there is a potential to signifi cantly reduce risks of infections since lower adhesion potential practi-cally means less driving force for biofi lm formation and there-fore higher effi cacy of applied antibiotic treatment. [ 1 , 2 , 9 ]
The attachment of bacteria to the implant surface is a very complex process. Different factors such as intermolecular forces (surface potential, surface energy, charge, and activity), local environment variables (pH, ionic strength, and competi-tive species such as proteins), surface topography, porosity, hydrophobic properties, and microfl uidics (shear rates, vorticity, and velocity) are all affecting the adhesion. Because of the huge variety of these factors, most of the studies directed at bacterial attachment to the implant surface were limited to specifi c sur-face conditioning only (e.g., micro- or nanotopology, patterned surface treatment, hydrophilic treatment, etc.) since it is diffi cult to vary many parameters at the same time. [ 1 , 3 , 4 , 7–10 ] Studies have also demonstrated that surface roughness might be modifi ed in a way to decrease bacterial adhesion, [ 1 , 7 , 8 , 11 ] but the approach of optimized “biofi lm-inert” implants still remains largely unex-ploited. [ 3 , 9 ] Many recent studies also focused on nanotopology on micro-fl at and macro-fl at surfaces, and good results were obtained at specifi c nanopatterned surfaces. [ 1 , 10 ] However, other studies showed more biofi lm formation on nanocrystalline sur-faces. [ 12 ] Exact nanopatterning in mass production might be too complex and diffi cult to implement at the implant manufac-turers facilities, adding costs and uncertainty in the implant’s “intrinsic” ability to really minimize bacterial adhesion. In ortho-pedic implants, however, proper porosity and pore topology are also important to enhance osteoblast activity, improve the bone-to-implant contact, provide proper biomechanical properties, and fi nally improve the osteointegration. [ 9 , 13 ]
This is particularly challenging when data were gathered on bacterial adhesion in vitro for one to three varied parameters, which might not be fully relevant for in vivo situations. Never-theless, several parameters, such as low roughness and wetting of the surface (hydrophilicity), were identifi ed to be favorable for biofi lm prevention. [ 1 , 4 , 10 ] Unfortunately, some of the studies have involved either too exotic surfaces, or treated data in a semiquantitative way, which makes it diffi cult to compare them to and extrapolate them on real implants, of which specifi c surface parameters might be not so easy to check and monitor from case to case.
Analysis of bacterial adhesion and biofi lm formation inside porous coatings is very challenging and might not be feasible with some standard techniques. Besides the “optimal” implant anti-bacterial function (here, drug-carrying surfaces are not considered), the requirements for osteoblast fi xation, mechan-ical, and biomechanical constraints set additional challenges for implant developers, because in many cases almost incom-patible demands have to be met. For osteointegration, whether it is described by biomechanics, contact osteogenesis or surface
wileyonlinelibrary.com © 2012 WILEY-VCH Verlag
signaling theories, [ 10 ] it is important to promote osteoblast fi xation and to avoid bacterial adhesion at the same time. As pointed out by Wu et al., [ 4 ] cells and bacteria respond differently to implant surface parameters and this gives an opportunity to look for an “optimal” solution: would it be possible to create a robust, proper implant surface capable of repelling bacteria and attracting osteogenic cells, at least immediately after implanta-tion (within few minutes or hours)?
At the present state-of-the-art, it is known (at least qualitatively) that roughness, wettability, porosity, pore topology, and other sur-face conditions are the key factors to adjust. However, it is not easy to produce numbers of specifi c surfaces for which these parameters are independently varied and their specifi c effect on both bacteria and cells is properly evaluated and extracted.
Statistical analysis of data from biomaterial studies is usually limited to a very simple one for single hypothesis. This is diffi -cult to apply to scattered data, depending on several cross-linked variables (particularly when the error distribution is unknown or clearly being different from the norm). Thus, taking into account the variety of the factors affecting the implant behavior, it is not straightforward to elaborate the “best” or “optimized” specimen. The term “optimization” is often being understood in the narrowest way, i.e., just as a selection of the proper solu-tion from the list of few results. Mathematically defi ned opti-mization is the task of fi nding one or more solutions, which minimize (or maximize) one or more specifi ed objectives, sat-isfying all existing constraints (if any). A multiobjective optimi-zation task considers several confl icting objectives simultane-ously: in such a case, there is usually a set of alternative solu-tions with different trade-offs (“Pareto optimal” solutions). [ 14 ] The advanced meta-analytical methods applied to experimental data have an improved ability to determine the relative infl u-ence of different parameters on a given phenomenon, to fi nd existing relationships among the considered variables, and to resolve the unavoidable noise present within a vast set of numerical data. The challenge of applying meta-analysis to the testing of biomaterials is to overcome limitations due to a con-siderable amount of time needed to perform an optimization analysis, [ 14–16 ] when the number of free parameters is notice-ably high, when these parameters are linked with each other, and when output functions (e.g., bacterial colony features) are unknown or not quantifi ed.
The present study is aimed towards the vitro analysis of S. aureus and S. epidermidis bacterial biofi lm formation kinetics on selected commercial and experimental titanium implants surfaces, combined with parallel analysis of cell adhesion, pro-liferation, and gene expression (cell differentiation). By meta-analysis application to these test data, the effect of the para-meters of the surfaces is revealed and the “optimal” implant surface is suggested.
2. Materials and Methods
2.1. Titanium Specimens: Preparation and Treatment
Commercial purity titanium (grade 2, UNS R50400, marked as Ti2) and Ti-6Al-4V (grade 5, UNS R56400, marked as Ti5)
GmbH & Co. KGaA, Weinheim Adv. Healthcare Mater. 2012, 1, 117–127

www.MaterialsViews.com
FULL P
APER
www.advhealthmat.de
Table 1. Key parameters of the titanium specimens (numbers “ ± value” where marked, are standard deviations; IPC shows three values for minimal, mean and maximal interconnective pore channel diameter respectively).
Material R a [ μ m]
R z [ μ m]
Porosity Wetting angle [deg.]
Max pore size [ μ m]
IPC [ μ m]
min mean max
Ti5 machined (M) 1.0 ± 0.0 4.5 ± 0.36 0 54.7 0 0 0 0
Ti5 beadblasted (B) 4.9 ± 0.6 45.1 ± 1.4 0 44.7 ± 8.8 0 0 0 0
Ti5 polished (P) 0.05 ± 0.0 0.2 ± 0.02 0 41.1 ± 8.3 0 0 0 0
Ti5 treated (HT) a) 1.1 ± 0.0 4.8 ± 0.36 0 41.0 ± 5.0 0 0 0 0
Ti2 machined (M) 0.32 ± 0.05 3.24 ± 0.38 0 75.5 ± 6.2 0 0 0 0
Ti2 anodized (A) a) 0.32 ± 0.04 3.49 ± 0.61 0 45.1 ± 10.0 0 0 0 0
Plasma sprayed Ti (VPS) 27.9 ± 1.5 221.7 ± 15.0 0.208 143.0 ± 5.2 100 1 10 30
Ti VPS treated (VPS-HT) a) 27.9 ± 1.5 221.7 ± 15.0 0.208 15.0 ± 5.0 100 1 10 30
EPD, grade P 4.4 ± 0.3 40.8 ± 2.4 0.510 100.5 ± 3.1 30 2 7.5 8
EPD, grade VM 1.8 ± 0.1 29.3 ± 7.1 0.378 89.1 ± 5.6 10 1 3 4
EPD, grade U 3.9 ± 0.3 37.7 ± 1.3 0.471 81.2 ± 2.7 20 2 6.5 7
EPD, mixed (EPDTi) 7.1 ± 0.9 82.0 ± 7.0 0.597 102.7 ± 4.9 50 1 8.3 30
a) Ti5-HT specimens have TiO 2 layer of 100–350 nm thickness, Ti2-A specimens ∼ 60 nm, and VPS-HT ∼ 100 nm.
alloys certifi ed for orthopedic applications have been supplied by three independent implants producers (Lima Lto Ltd., Italy; Helipro Ltd., Slovenia; Alhenia Ltd., Switzerland) in a form of disks (15.5 mm diameter, 2 mm thick).
The surface of the titanium disks has been as-received (machined (M), bead-blasted (B) and polished (P) according to the manufacturers own protocols), Table 1 . The part of the disks was hydrothermally treated (index -HT) by a procedure developed in Jozef Stefan Institute, Slovenia [ 17 ] to create a thin layer of anatase TiO 2 (confi rmed by phase analysis) with thick-ness up to 350 nm (characterized by X-ray photoelectron spec-troscopy, XPS). Specimen types and their surface properties are listed in Table 1 . The addition of a thin anatase nano-layer did not signifi cantly affect the roughness neither porosity topology parameters, but substantially changed hydrophilic properties.
For porous coated specimens, state-of-the-art vacuum-plasma sprayed (VPS) titanium-coated disks (Alhenia Ltd.) were used as the reference. In addition, a new technology of manufacturing porous titanium coatings with characteristics similar to VPS-Ti coatings from titanium hydride by elec-trophoretic deposition (EPD) of TiH 2 powder suspensions followed by dehydrogenation (500–550 ° C) and sintering in vacuum (850 ° C) was applied. [ 18 , 19 ] Distinct TiH 2 powder grades of different particle sizes, all supplied by Chemetall GmbH (Germany), have been used: grade type P (average par-ticle size 8.0 ± 2.0 μ m, maximal 60 μ m), type U (5.0 ± 1.0 μ m, maximal 45 μ m) and type VM (1.8 ± 0.2 μ m, maximal 45 μ m). The same technique was applied on TiH 2 powder stabilized emulsions in order to obtain additional spherical pores in the pure Ti coating. [ 20 ] For the emulsion technique, TiH 2 type VM emulsions and type U suspensions were co-deposited by EPD. Specimens with mixture of these powders were made to get different porosity and porosity topology distribution (Table 1). All specimens were gamma-sterilized (25 kGy) by Helipro Ltd. prior to testing.
© 2012 WILEY-VCH Verlag GmAdv. Healthcare Mater. 2012, 1, 117–127
2.2. Surface Characterization
The surface roughness ( R a and R z ) was measured by white light interferometry (WLI) with Wyko NT 3300 Optical Profi ler (Veeco Metrology Inc., USA). A total of four equidistant loca-tions were measured per every disc. The surface wettability, i.e., the contact angle with demineralized water, was measured from the sessile drop tests using optical imaging (CaM200, KSV, USA). The mean contact angle was determined by averaging ten measurements obtained from three different disc samples, taking into account three different areas on each surface. The wetting properties of the specimens are shown in Table 1 .
Characterization of the porosity and porosity topology was done by image analysis (PPM2OOF software, NIST, USA) in combination with the mercury intrusion porosimetry (MIP) using AutoPore IV 9500 (Micromeritics, Germany). For all porous specimens, the total open porosity and maximal pore size was determined by image analysis of backscattered electron images obtained by scanning electron microscopy (SEM, XL30-FEG, FEI, The Netherlands) of representative metallographic cross-sections while MIP was used to assess the minimal, mean and maximal interconnecting pore channel sizes.
2.3. Bacterial Strains and Growth Conditions
Bacterial strains S. aureus ATCC25923 and S. epidermidis 1457 were grown in Bacto tryptic soy broth (TSB, Becton Dickinson) or on BBL tryptic soy agar (TSA, Becton Dickinson) plates. Prior to testing biofi lm formation on Ti-based discs, an overnight cul-ture grown in TSB (5 mL) at 37 ° C and 250 rpm, was 25-fold diluted in TSB and re-incubated for 1 h at the same conditions. The early exponential-growth-phase culture was next adjusted to OD600 of 0.3 and further 10000-fold diluted in TSB, giving a bacterial suspension of (1–3) · 10 4 cells mL − 1 and this suspen-sion (2.5 mL) was added to a disc placed in a 12-well CELLSTAR
wileyonlinelibrary.com 119bH & Co. KGaA, Weinheim

www.MaterialsViews.com
120
FULL
PAPER
www.advhealthmat.de
cell culture suspension plate (Greiner Bio-One, Germany). To allow bacterial adhesion to the test discs, plates were fi rst incu-bated for 2 h at 37 ° C under static conditions. Thereafter, plates were further incubated at 30 ° C on a 3D-rotating platform (Belly Dancer, Stovall Live Sciences).
2.4. Evaluation of Biofi lm Formation
Upon 24, 48 and 72 h (1, 2, and 3 days), three discs of each type were removed from wells and carefully rinsed by dip-ping the disc in saline (40 mL). Upon repeating the latter step for 2 times, the discs were fi nally placed in saline (10 mL). Detachment of the biofi lm-embedded bacterial cells occurred by sonifi cation twice (2 min at 40 kHz, Bransonic 2510E-MT, Branson, USA) followed by mixing (15 sec; longer sonifi ca-tion might cause bacterial cell killing). Biofi lm formation was quantitatively evaluated fi rst by viable colony forming unit (cfu) counts upon incubation (20 h) at 37 ° C via plating 10-fold serial dilutions of the obtained bacterial suspension on TSA. A more qualitative evaluation of the biofi lms after 2 days was additionally done by CLSM (confocal laser scan-ning microscopy) and SEM visualizations. Biofi lms were ana-lyzed in function of time taking the VPS discs as reference and setting the number of viable bacteria recovered from the VPS discs to a unity. The “LIVE/DEAD BacLight bacterial viability and counting kit” (Molecular Probes) was used to quantify biofi lm formation and to simultaneously get an idea of the ratio of live/dead cells within a biofi lm. Biofi lm-derived cells are stained with Syto9 (green; stains all cells, live and dead) and propidium iodide (PI, red; only enters dead cells with a damaged membrane) and mixed with 10 6 microspheres ( ∼ 6 μ m). The concentration of cells was determined from the ratio of bacterial events to microsphere events during laser fl ow cytometry (LFC) using a FACSCalibur apparatus (Becton Dickinson). To test the suitability of this method in compar-ison to viable cfu counts, biofi lms formed on 3 VPS-Ti discs were evaluated by both methods with measurements done in triplicate for each disk. The LFC was found to produce highly adequate result compared to cfu count method with differ-ences less than standard deviation.
2.5. Cell Culture and Viability Analysis
Cell cultures used were human osteogenic cells (HOC) [ 21 ] arising from bone marrow (6 th passage) and human endothelial cells (HEC) (9 th passage). [ 22 ] Samples were completely covered up with Iscove’s Modifi ed Dulbecco’s Medium (IMDM, Gibco) supplemented for HOC with fetal calf serum (FSC, 10% vol.; Gibco) and for HEC - with 20% FCS and 0.4% of endothelial cell growth supplement/hepatin (ECGS/H, Promocell), incu-bated at 37 ° C. Pre-coating with serum proteins mimics an in vivo situation following implantation (adsorbed protein layer). HOC and HEC were seeded (100 μ L) onto the disc specimens at 10 4 and 2.0 · 10 4 cells cm − 2 , respectively. Thereafter, the com-plete culture medium was carefully added to the samples, and plates were incubated at 37 ° C in a humidifi ed atmosphere con-taining 5% vol. CO 2 .
wileyonlinelibrary.com © 2012 WILEY-VCH Verlag
Quantitative tests were made at the end of the incubation period (1, 3, 9, 15, and 27 days). The culture medium was removed and discarded and cells were detached using trypsin (0.2%wt.) in Hank’s balanced solution (Ca 2 + and Mg 2 + free), incubated for 2 min with trypan blue (0.2%wt., Sigma–Aldrich) in NaCl (0.15 M ). Thereafter, dead cells (blue) and living cells (uncolored) were counted using a hemocytometer.
Following the above precoating process, the study of HOC and HEC adhesion to the coating or substrate system was eval-uated using the “LIVE/DEAD cell viability/cytotoxicity kit” (Inv-itrogen; Molecular Probes), where live cells are distinguished by the presence of ubiquitous intracellular esterase activity, determined by the enzymatic conversion of the nonfl uorescent cell-permeant calcein AM to the intensely fl uorescent calcein. Nuclei of dead cells are stained by passive transport and sub-sequent binding of ethidium homodimer-1 (EthD-1). These qualitative tests (LIVE–DEAD iconography) were made after the same incubation periods (1, 3, 9, 15, and 27 days). Samples were incubated for 20 min at 37 ° C in the dark, within “LIVE–DEAD” solution (calcein AM and EthD-1; 4 μ M of each in PBS). After incubation, the samples were analyzed by fl uorescence microscopy. Plastic of the culture wells was used as the nega-tive control in these tests. The experiments were performed in triplicate for each time point.
The analysis of cytoskeleton and focal adhesion formation was also performed for HOC and HEC, using 24 h incubation times. The detection of α -tubulin, β -actin, integrin α v β 3, and vinculin was performed using specifi c monoclonal antibodies conjugated to fl uorescein isothiocyanate, isomer I (FITC; Sigma–Aldrich) for α -tubulin, β -actin, integrin α v β 3, or crys-talline tetramethylrhodamine isothiocyanate (TRITC; Sigma–Aldrich) for vinculin. Monoclonal concentrations were used: for integrin α v β 3 1/300, α -tubulin 1/200, β -actin 1/800, and vin-culin 1/200. A nuclear labeling was performed at the same time using Hoechst staining (50 ng mL − 1 ). The data obtained for the cytoskeleton were used for additional qualitative and semiquan-titative analysis and for control of the HOC and HEC reactions, but they were not numerically analyzed.
2.6. Cells Differentiation Analysis
HOC and HEC differentiation analysis was performed with the same cells cultures following the precoating process described above. A concentrate of cells (10 5 cells cm − 2 ) in 100 μ L was seeded on the samples. Thereafter complete culture medium was carefully added and the plates were incubated at 37 ° C in a humidifi ed atmosphere with 5% vol. CO 2 . Total RNA was iso-lated from HOC and HEC after 1 and 3 days of contact using the RNeasy Micro kit (Qiagen). cDNA was synthesized from total RNA (1 ng), using the cDNA Synthesis kit (Thermo Sci-entifi c Verso).
Polymerase chain reaction (PCR) was performed (Thermocycler-Techne TC 3000G) with of cDNA (1 μ L) to analyze the genes related to HOC and HEC. [ 23 ] Analyzes of genes related to HOC (collagen type I (here marked as ColI), alkaline phosphatase (here marked as APh), and for HEC: CD31 and von Willebrand factor (vWF)) were carried out. Specifi c primers and annealing temperatures are used for each target gene, Table 2 . Products
GmbH & Co. KGaA, Weinheim Adv. Healthcare Mater. 2012, 1, 117–127
www.MaterialsViews.com
FULL P
APER
www.advhealthmat.de
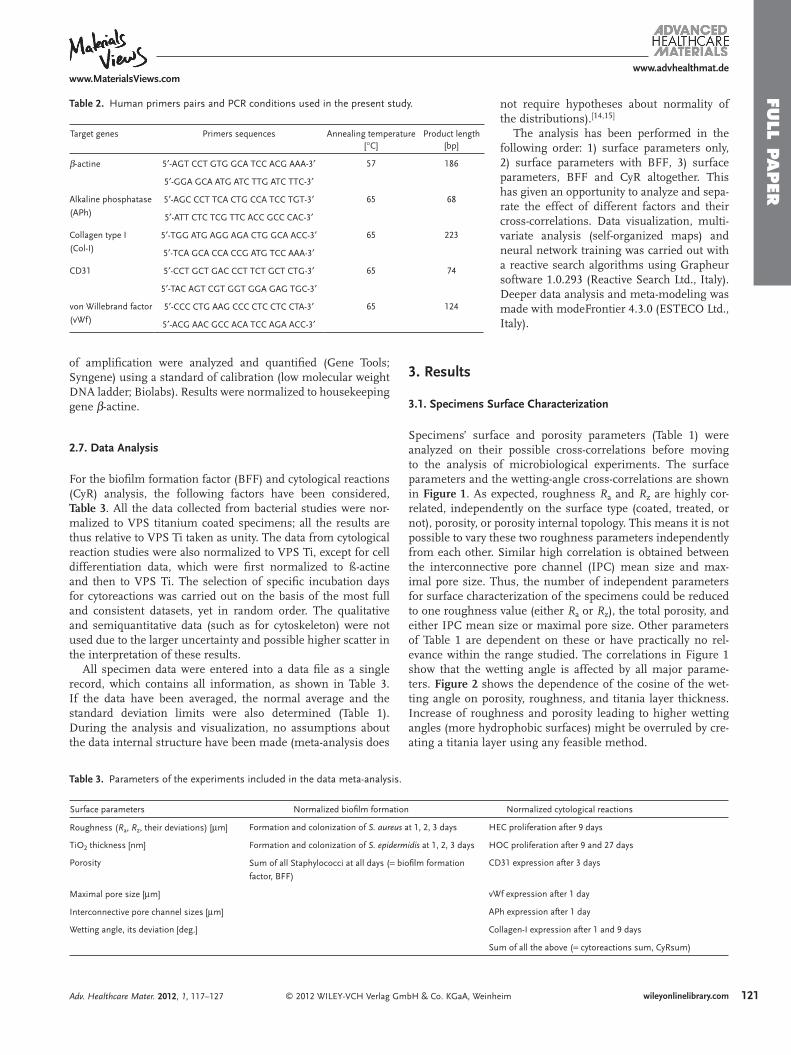
Table 2. Human primers pairs and PCR conditions used in the present study.
Target genes Primers sequences Annealing temperature [ ° C]
Product length [bp]
β -actine 5 ′ -AGT CCT GTG GCA TCC ACG AAA-3 ′ 57 186
5 ′ -GGA GCA ATG ATC TTG ATC TTC-3 ′
Alkaline phosphatase
(APh)5 ′ -AGC CCT TCA CTG CCA TCC TGT-3 ′ 65 68
5 ′ -ATT CTC TCG TTC ACC GCC CAC-3 ′
Collagen type I
(Col-I)5 ′ -TGG ATG AGG AGA CTG GCA ACC-3 ′ 65 223
5 ′ -TCA GCA CCA CCG ATG TCC AAA-3 ′
CD31 5 ′ -CCT GCT GAC CCT TCT GCT CTG-3 ′ 65 74
5 ′ -TAC AGT CGT GGT GGA GAG TGC-3 ′
von Willebrand factor
(vWf)5 ′ -CCC CTG AAG CCC CTC CTC CTA-3 ′ 65 124
5 ′ -ACG AAC GCC ACA TCC AGA ACC-3 ′
of amplifi cation were analyzed and quantifi ed (Gene Tools; Syngene) using a standard of calibration (low molecular weight DNA ladder; Biolabs). Results were normalized to housekeeping gene β -actine.
2.7. Data Analysis
For the biofi lm formation factor (BFF) and cytological reactions (CyR) analysis, the following factors have been considered, Table 3 . All the data collected from bacterial studies were nor-malized to VPS titanium coated specimens; all the results are thus relative to VPS Ti taken as unity. The data from cytological reaction studies were also normalized to VPS Ti, except for cell differentiation data, which were fi rst normalized to ß-actine and then to VPS Ti. The selection of specifi c incubation days for cytoreactions was carried out on the basis of the most full and consistent datasets, yet in random order. The qualitative and semiquantitative data (such as for cytoskeleton) were not used due to the larger uncertainty and possible higher scatter in the interpretation of these results.
All specimen data were entered into a data fi le as a single record, which contains all information, as shown in Table 3 . If the data have been averaged, the normal average and the standard deviation limits were also determined (Table 1 ). During the analysis and visualization, no assumptions about the data internal structure have been made (meta-analysis does
© 2012 WILEY-VCH Verlag GmbH & Co. KGaA, WeinAdv. Healthcare Mater. 2012, 1, 117–127
Table 3. Parameters of the experiments included in the data meta-analysis.
Surface parameters Normalized biofi lm formation
Roughness ( R a , R z , their deviations) [ μ m] Formation and colonization of S. aureus at 1, 2, 3 days H
TiO 2 thickness [nm] Formation and colonization of S. epidermidis at 1, 2, 3 days H
Porosity Sum of all Staphylococci at all days ( = biofi lm formation
factor, BFF)
C
Maximal pore size [ μ m] v
Interconnective pore channel sizes [ μ m] A
Wetting angle, its deviation [deg.] C
S
not require hypotheses about normality of the distributions). [ 14 , 15 ]
The analysis has been performed in the following order: 1) surface parameters only, 2) surface parameters with BFF, 3) surface parameters, BFF and CyR altogether. This has given an opportunity to analyze and sepa-rate the effect of different factors and their cross-correlations. Data visualization, multi-variate analysis (self-organized maps) and neural network training was carried out with a reactive search algorithms using Grapheur software 1.0.293 (Reactive Search Ltd., Italy). Deeper data analysis and meta-modeling was made with modeFrontier 4.3.0 (ESTECO Ltd., Italy).
3. Results
3.1. Specimens Surface Characterization
Specimens’ surface and porosity parameters (Table 1 ) were analyzed on their possible cross-correlations before moving to the analysis of microbiological experiments. The surface parameters and the wetting-angle cross-correlations are shown in Figure 1 . As expected, roughness R a and R z are highly cor-related, independently on the surface type (coated, treated, or not), porosity, or porosity internal topology. This means it is not possible to vary these two roughness parameters independently from each other. Similar high correlation is obtained between the interconnective pore channel (IPC) mean size and max-imal pore size. Thus, the number of independent parameters for surface characterization of the specimens could be reduced to one roughness value (either R a or R z ), the total porosity, and either IPC mean size or maximal pore size. Other parameters of Table 1 are dependent on these or have practically no rel-evance within the range studied. The correlations in Figure 1 show that the wetting angle is affected by all major parame-ters. Figure 2 shows the dependence of the cosine of the wet-ting angle on porosity, roughness, and titania layer thickness. Increase of roughness and porosity leading to higher wetting angles (more hydrophobic surfaces) might be overruled by cre-ating a titania layer using any feasible method.
wileyonlinelibrary.com 121heim
Normalized cytological reactions
EC proliferation after 9 days
OC proliferation after 9 and 27 days
D31 expression after 3 days
Wf expression after 1 day
Ph expression after 1 day
ollagen-I expression after 1 and 9 days
um of all the above ( = cytoreactions sum, CyRsum)

www.MaterialsViews.com
12
FULL
PAPER
www.advhealthmat.de
Figure 3 . Example of relative (normalized to VPS Ti) formation and colo-nization of S. aureus and S. epidermidis (after the fi rst day each). The dashed line serves as a guide to the eye. Symbols refl ect average values for different specimen categories.
Figure 1 . Spearman’s correlation coeffi cients (color scale) between the surface parameters ( R a , R z , porosity, pore size and anatase thickness) and wetting angle.
Therefore, surface characterization factors such as R a versus R z , maximal pore size versus R z , or IPC mean size are strongly correlated, and some of them have to be excluded from the analysis. Titania layer thickness and total porosity, on the other hand, can be considered as independent variables.
3.2. Staphylococci Colonization and Biofi lm Formation
The data of the staphylococci biofi lm formation show a clear increasing dependence versus incubation time. There is also a nearly linear dependence between the S. aureus and S. epi-dermidis population for a respective incubation day ( Figure 3
wileyonlinelibrary.com2 © 2012 WILEY-VCH Verlag
Figure 2 . Wetting angle dependence on total porosity, roughness R a [ μ m] (as color) and TiO 2 layer thickness [nm] (as bubble size).
demonstrates example for day 1 (24 h of incubation) for all spec-imens; normalized to VPS titanium), which is invariant to the type of the specimen or its surface parameters. Besides, very clear correlation between different staphylococci incubation times ( Figure 4 ), higher roughness, IPC mean size, and porosity are all observed to affecting the proliferation positively. Since all studied bacteria do behave in a very similar way, a combined indicator - biofi lm formation factor (BFF) - was employed. BFF was calculated as the sum of all staphylococci for all days for every specimen, and this sum has been normalized to its value for VPS titanium coating. This is just a measure to reduce the number of output parameters and to combine the indi-rect infl uence of all incubation times and different stains. The example of the BFF value (relative to VPS Ti), changing as a function of wetting angle, porosity (as color), and roughness ( R a as bubble size), is shown in Figure 5 . Note that smoother, nonporous specimens have generally the lowest BFF, whereas for porous specimens the roughness effect might overrule wet-ting and porosity. If only results as Figure 5 would have been considered, one might conclude that wetting angles 30–90 ° are the best option for expecting the lowest BFF value. However, this holds only for nonporous specimens, which also have the lowest surface roughness, and thus being not suitable for ortho-pedic applications, where a porous surface layer is required to ensure bone in-growth.
The overall Student’s factor analysis shows that the total porosity contribution is most signifi cant for the fi rst day of incu-bation only, whereas roughness ( R a ) and IPC size are important for all incubation days. This might be explained by the larger surface-area fraction available for bacteria attachment at the beginning – after 24 h of colonization and biofi lm formation no more “fresh” porous surface area is available because the fi rst-coming bacteria have already occupied some pores. The
GmbH & Co. KGaA, Weinheim Adv. Healthcare Mater. 2012, 1, 117–127
www.MaterialsViews.com
FULL P
APER
www.advhealthmat.de
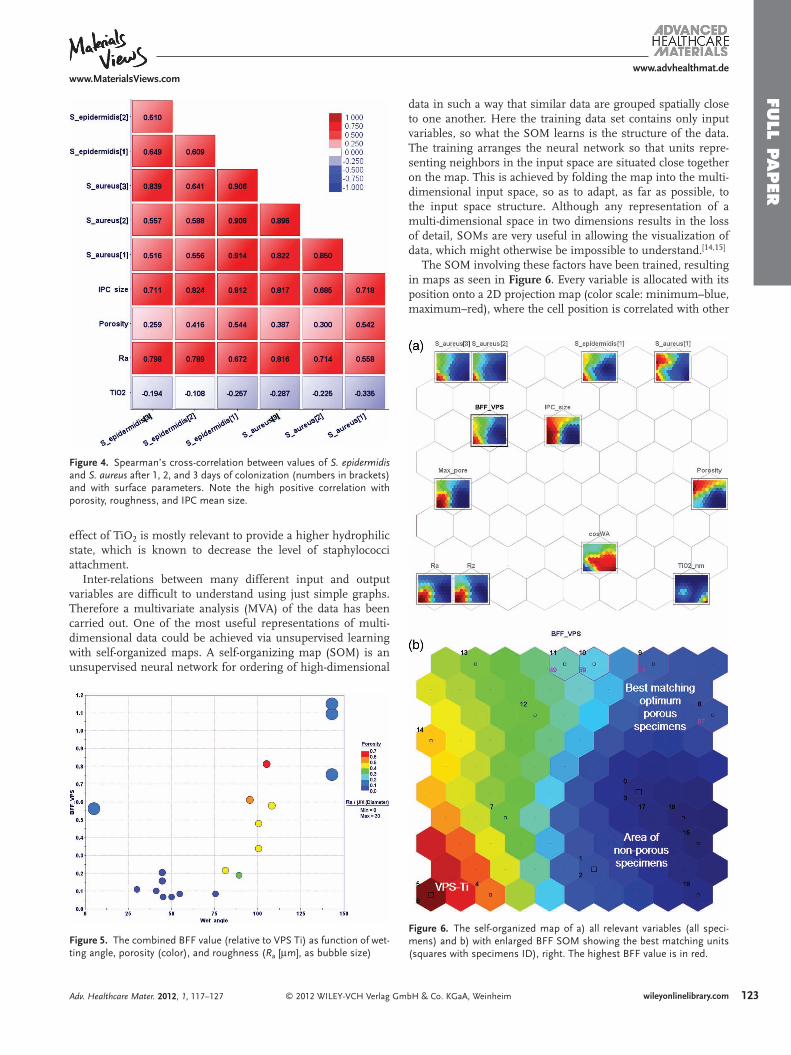
Figure 4 . Spearman’s cross-correlation between values of S. epidermidis and S. aureus after 1, 2, and 3 days of colonization (numbers in brackets) and with surface parameters. Note the high positive correlation with porosity, roughness, and IPC mean size.
effect of TiO 2 is mostly relevant to provide a higher hydrophilic state, which is known to decrease the level of staphylococci attachment.
Inter-relations between many different input and output variables are diffi cult to understand using just simple graphs. Therefore a multivariate analysis (MVA) of the data has been carried out. One of the most useful representations of multi-dimensional data could be achieved via unsupervised learning with self-organized maps. A self-organizing map (SOM) is an unsupervised neural network for ordering of high-dimensional
© 2012 WILEY-VCH Verlag GmAdv. Healthcare Mater. 2012, 1, 117–127
Figure 5 . The combined BFF value (relative to VPS Ti) as function of wet-ting angle, porosity (color), and roughness ( R a [ μ m], as bubble size)
data in such a way that similar data are grouped spatially close to one another. Here the training data set contains only input variables, so what the SOM learns is the structure of the data. The training arranges the neural network so that units repre-senting neighbors in the input space are situated close together on the map. This is achieved by folding the map into the multi-dimensional input space, so as to adapt, as far as possible, to the input space structure. Although any representation of a multi-dimensional space in two dimensions results in the loss of detail, SOMs are very useful in allowing the visualization of data, which might otherwise be impossible to understand. [ 14 , 15 ]
The SOM involving these factors have been trained, resulting in maps as seen in Figure 6 . Every variable is allocated with its position onto a 2D projection map (color scale: minimum–blue, maximum–red), where the cell position is correlated with other
wileyonlinelibrary.com 123bH & Co. KGaA, Weinheim
Figure 6 . The self-organized map of a) all relevant variables (all speci-mens) and b) with enlarged BFF SOM showing the best matching units (squares with specimens ID), right. The highest BFF value is in red.

www.MaterialsViews.com
124
FULL
PAPER
www.advhealthmat.de
variables position and color-map locations. Maps of variables located closest to one another and with a similar color scale (e.g., R a and R z at the bottom left) are highly correlated and thus depending on each other. Maps with opposite color allocations (e.g., cosine of the wetting angle has color distribution opposite to porosity) are negatively correlated.
For the biofi lm formation, the prediction of BFF values is of the highest interest. The enlarged SOM for BFF combines sim-ulated (SOM trained and predicted) results and real specimens, which experimental BFF data are projected on the same map as best matching units (BMU). The presence of BMU (squares) in any SOM cell shows that a realistic specimen has been matched calculated results with specifi c input parameters combinations.
For specimen optimization and BFF prediction one is tar-geting such surface combinations, which result in a low BFF but with biomechanically relevant porosity and roughness values at the same time. Figure 6 b clearly shows that non-optimized control VPS Ti has the highest BFF observed in the experiments (cells at the lower left of the map). The lowest BFF (region at lower right of the map Figure 6 b) is undoubt-edly associated with nonporous, smooth specimens. The best specimens that satisfy the objective (minimal BFF) and the constraint (the presence of at least 10–15% porosity) could be selected at the right top of the map (four marked hexagons with four specimens ID No. 8 to 11). These BMU match the speci-mens of EPD-processed titanium coatings using TiH 2 powder grades P, U, and VM, but not with the EPDTi specimens made of these mixtures of TiH 2 P + U + VM powders (Table 1 ). The calculated SOM values (ID No. 49, 59, 79 and 97) represent surface designs located on the Pareto frontier, [ 14 , 15 ] Figure 7 . This means it is not possible to change any more of the input
wileyonlinelibrary.com © 2012 WILEY-VCH Verlag G
Figure 7 . Real (experimental) and virtual (SOM-predicted) values of BFF (all staphylococci, all three days) normalized to VPS Ti as a function of total porosity, roughness [ μ m] (as bubble diameter) and wetting angle [deg.] (as color scale). Marked bubbles with numbers represent the best matching units (BMU) with real experiments (Figure 6 ). Dashed line rep-resents Pareto-dominated limits (BFF minimum), crossed dotted lines indicate biofi lm formation porosity onset ( ∼ 0.47), after which the BFF values are getting signifi cantly higher.
parameters (roughness, porosity, anatase layer, IPC mean size, etc.) without worsening the performance of the specimen (i.e., without increasing the BFF value) and without violation of the objectives and constrains set.
It is evident that for an average porosity level of 0.20–0.50 the lowest BFF would be achieved, with a wetting angle of the 75–100 ° and a roughness ( R a ) within the 0.5–5.0 μ m limits. Even lower BFF values are possible, but this would require less porosity, higher hydrophilicity, and less roughness. It is also interesting that for porous specimens the best apparent wetting angle would be close to amphoteric (90 ± 10 ° ), and in this case neither too hydrophilic nor too hydrophobic surfaces are desir-able, Figure 5 and Figure 7 . The onset threshold of porosity is about 0.47 for these experiments, which means lower porosity specimens are recommended to be more hydrophilic, whereas highly porous specimens should be more hydrophobic (but in all cases roughness parameter R a should be minimal). This might be adjusted by application of a titania nanolayer, e.g., by hydrothermal treatment.
To predict the variation of biofi lm formation beyond the experimental limits, metamodeling (response surface mod-eling, RSM) has been carried out for the whole data set. Figure 8 shows an example of RSM output for untreated speci-mens using a radial basis functions method. [ 14 , 15 ] One can see that the worst cases, where most of biofi lm is expected (“red area”), are specimens with a porosity level of 0.20–0.35 and a roughness R a > 20 μ m.
3.3. Cell Viability, Proliferation, and Differentiation
Although the biofi lm formation might be greatly reduced with the optimal surface topology as shown above, this alone does not yet lead to the “optimal” implant surface. The interaction of cells, i.a., osteogenic stem cells arising from human bone marrow (HOC) and human endothelial cells (HEC), with the
mbH & Co. KGaA, Weinheim Adv. Healthcare Mater. 2012, 1, 117–127
Figure 8 . Response surface model (RSM metamodel) for BFF vs. rough-ness ( R a [ μ m]) and porosity fraction, for IPC mean size = 8.8 μ m and without anatase. Dots represent both experimental and SOM (virtual data) values.

www.MaterialsViews.com
FULL P
APER
www.advhealthmat.de
Figure 9 . Example of a) HOC proliferation after 9 days of incubation (HOC9), b) alkaline phosphatase after the 1 st day (APh1) and c) collagen I expression after 1 st day (ColI_1) versus specimen porosity, IPC mean size [ μ m] (as color scale) and roughness (bubble size – R a [ μ m]). All data are normalized to VPS Ti.
surface of biomaterials, is of great relevance for osteointegration. It is not enough to have the lowest BFF only, the surface of the biomaterials also has to be tailored to enhance cell adhesion, growth, differentiation, and elaboration of a mineralized extra-cellular matrix (ECM). Adhesion of cells to the material plays a fundamental role in regulating ECM synthesis. The physico-chemical characteristics of a material surface regulate serum protein adsorption, and therefore cell adhesion.
As for bacterial attachment, HOC and HEC attachment and proliferation is a complex process. Figure 9 shows examples of normalized HOC proliferation (after 9 days), alkaline phos-phatase, and collagen I (1 day). The HOC proliferation data seems to favor low-porous, smooth specimens (although with a larger data scatter). However, as shown above, porosity or its topology do not act independently and there is a “hidden” contribution from other factors such as wetting. Similar pictures are observed for other incubation times. Alkaline phosphatase (Figure 9 b) and col-lagen I gene expression (Figure 9 c), after the fi rst day, show oppo-site trends in respect to porosity variations, although differences for alkaline phosphatase are not as high as observed for collagen I (the latter is similar to HOC proliferation, Figure 9 a).
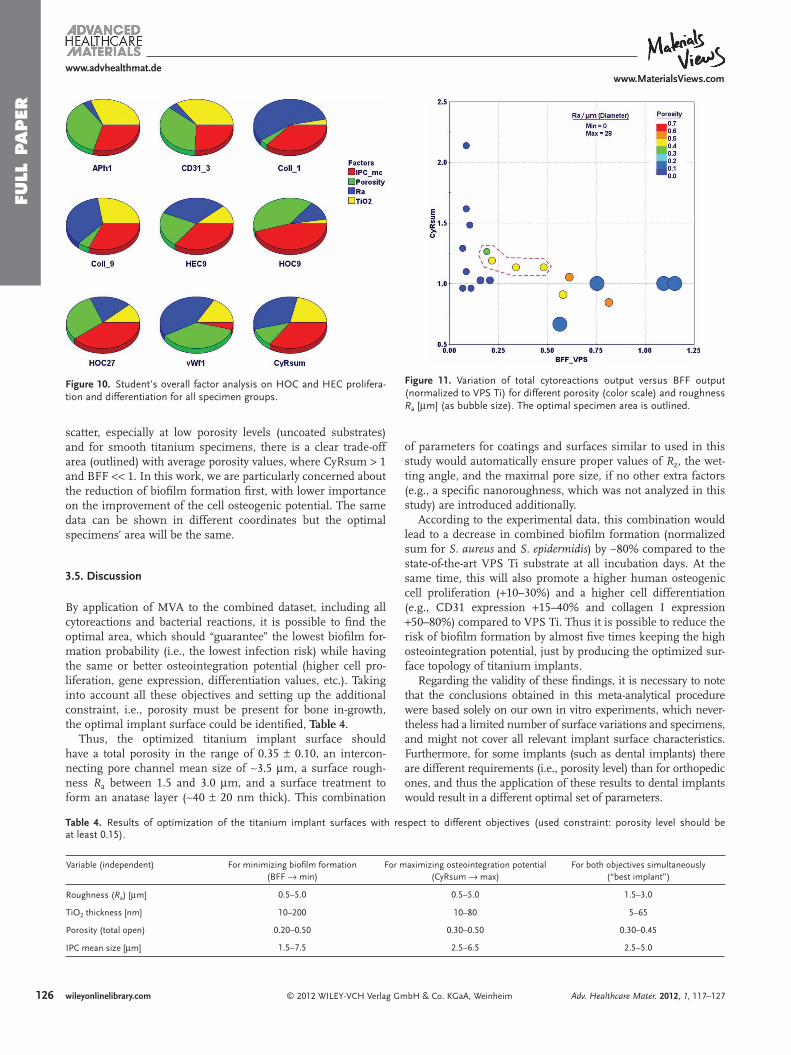
The overall Student’s factor analysis of analyzed cell prolif-eration and differentiation variables with surface parameters is shown in Figure 10 . There is an additional composite vari-able (CyRsum) – the sum of all cytoreactions data (normalized proliferation + normalized gene expression). The goal of this variable is to summarize all data for HOC and HEC incubation days to be maximized. This is expected to give a rough indi-cation of the best relative osteointegration ability versus con-trol VPS Ti specimens. Student’s analysis gives a hint towards higher importance of porosity for HOC proliferation, von Wil-lebrand factor, alkaline phosphatase, and CD31, Figure 10 . The IPC mean channel size, on its turn, seems to be the most important for HOC, HEC proliferation, and less for collagen I, which is dominated more by roughness values.
3.4. Combined Effect of all Factors
Cell proliferation and differentiation data were fi nally analyzed together with biofi lm formation data. This allows searching for the best optima related to the titanium implant surface para-meters. The target objectives set in this study are the minimi-zation of biofi lm formation (minimum BFF, implying least S. aureus and S. epidermidis formation at any and all incuba-tion days) and maximization of osteointegration potential (CyRsum). The latter variable may not be straightforward, and there might be several opinions of its proper meaning. As defi ned above, it was simply chosen to be the sum of all “posi-tive” results, i.e., higher HOC and HEC proliferation values in addition to a higher gene expression and differentiation. No specifi c weights were assigned to these separate input and output variables (Table 3 ), although this could be done if a rea-sonable justifi cation would be provided, e.g., whether higher alkaline phosphatase should be more important than collagen I expression. The sample plot of all these cytoreactions versus BFF with impacts of porosity and roughness is shown in Figure 11 . Here, one can see a slight trend of cytoreactions to proceed better when the BFF values are lower. Although there is some
wileyonlinelibrary.com 125© 2012 WILEY-VCH Verlag GmbH & Co. KGaA, WeinheimAdv. Healthcare Mater. 2012, 1, 117–127
www.MaterialsViews.com
12
FULL
PAPER
www.advhealthmat.de
Figure 10 . Student’s overall factor analysis on HOC and HEC prolifera-tion and differentiation for all specimen groups.
Figure 11 . Variation of total cytoreactions output versus BFF output (normalized to VPS Ti) for different porosity (color scale) and roughness R a [ μ m] (as bubble size). The optimal specimen area is outlined.
scatter, especially at low porosity levels (uncoated substrates) and for smooth titanium specimens, there is a clear trade-off area (outlined) with average porosity values, where CyRsum > 1 and BFF < < 1. In this work, we are particularly concerned about the reduction of biofi lm formation fi rst, with lower importance on the improvement of the cell osteogenic potential. The same data can be shown in different coordinates but the optimal specimens’ area will be the same.
3.5. Discussion
By application of MVA to the combined dataset, including all cytoreactions and bacterial reactions, it is possible to fi nd the optimal area, which should “guarantee” the lowest biofi lm for-mation probability (i.e., the lowest infection risk) while having the same or better osteointegration potential (higher cell pro-liferation, gene expression, differentiation values, etc.). Taking into account all these objectives and setting up the additional constraint, i.e., porosity must be present for bone in-growth, the optimal implant surface could be identifi ed, Table 4 .
Thus, the optimized titanium implant surface should have a total porosity in the range of 0.35 ± 0.10, an intercon-necting pore channel mean size of ∼ 3.5 μ m, a surface rough-ness R a between 1.5 and 3.0 μ m, and a surface treatment to form an anatase layer ( ∼ 40 ± 20 nm thick). This combination
wileyonlinelibrary.com6 © 2012 WILEY-VCH Verlag G
Table 4. Results of optimization of the titanium implant surfaces with reat least 0.15).
Variable (independent) For minimizing biofi lm formation (BFF → min)
For
Roughness ( R a ) [ μ m] 0.5–5.0
TiO 2 thickness [nm] 10–200
Porosity (total open) 0.20–0.50
IPC mean size [ μ m] 1.5–7.5
of para meters for coatings and surfaces similar to used in this study would automatically ensure proper values of R z , the wet-ting angle, and the maximal pore size, if no other extra factors (e.g., a specifi c nanoroughness, which was not analyzed in this study) are introduced additionally.
According to the experimental data, this combination would lead to a decrease in combined biofi lm formation (normalized sum for S. aureus and S. epidermidis ) by ∼ 80% compared to the state-of-the-art VPS Ti substrate at all incubation days. At the same time, this will also promote a higher human osteogenic cell proliferation ( + 10–30%) and a higher cell differentiation (e.g., CD31 expression + 15–40% and collagen I expression + 50–80%) compared to VPS Ti. Thus it is possible to reduce the risk of biofi lm formation by almost fi ve times keeping the high osteointegration potential, just by producing the optimized sur-face topology of titanium implants.
Regarding the validity of these fi ndings, it is necessary to note that the conclusions obtained in this meta-analytical procedure were based solely on our own in vitro experiments, which never-theless had a limited number of surface variations and specimens, and might not cover all relevant implant surface characteristics. Furthermore, for some implants (such as dental implants) there are different requirements (i.e., porosity level) than for orthopedic ones, and thus the application of these results to dental implants would result in a different optimal set of parameters.
mbH & Co. KGaA, Weinheim Adv. Healthcare Mater. 2012, 1, 117–127
spect to different objectives (used constraint: porosity level should be
maximizing osteointegration potential (CyRsum → max)
For both objectives simultaneously (“best implant”)
0.5–5.0 1.5–3.0
10–80 5–65
0.30–0.50 0.30–0.45
2.5–6.5 2.5–5.0

www.MaterialsViews.com
FULL P
APER
www.advhealthmat.de
The optimal topology of the coating for a good bone in-growth remains one of the most debated topic. Black [ 24 ] mentions soft tissues found in pore sizes as small as 1 μ m, whereas osteonal bone requires pore sizes of ∼ 250 μ m, and mineralized tissue occupies a porosity range between these extremes. However, in many previous publications a more detailed characterization of topology of the pores (such as IPC and connectivity) is missing. An additional combination of micromotion, shear stresses, microfl udics, etc., in vivo might signifi cantly affect the optimal parameters values (Table 4 ). Therefore the benefi ts of the method used could be better exploited if a larger dataset would be obtained, which also has to be complemented by in vivo experiments and longer clinical trials. The analysis has revealed some nonlinear dependence between surface parameters, bac-teria, and cell reactions, and it would be useful to expand such treatment to existing independent data, providing the specimen history and characteristics are documented. At the moment, similar algorithms are used mostly to biomechanical properties analysis, optimization and prediction, and genomics or pharma-cological data analysis, [ 25–27 ] but the potential of multi-objective optimization and data visualization application to biomaterials analysis, in particular involving bacterial and cell interactions, is very high and it provides an excellent opportunity to look at the experimental data from a new perspective.
4. Conclusions
Several porous and non-porous commercial titanium substrates have been studied from the point of view of a combined effect of variations in porosity, pore topology, roughness and hydro-phobicity on bacterial attachment and cell reactions (prolifera-tion and gene expression). Due to mutual correlations between the surface parameters, a meta-analysis of the data has been applied to assess the effect and contribution of these factors on biofi lm formation and cell reactions. In addition to expected dependencies, such as hydrophilic state and probability of bacterial attachment, complex links between these input vari-ables with output data have been elucidated and quantitatively evaluated.
The experimental in vitro data are clearly indicating the possibility of decreasing biofi lm formation by 80–90% for fl at substrates versus untreated and non-optimized plasma-sprayed porous titanium, but also by 65–95% for other porous titanium coatings. Moreover, these porous surfaces are shown to lead to a 10–50% enhanced cell proliferation and gene expression versus state-of-the-art vacuum plasma sprayed porous titanium coatings. This presents an opportunity to manufacture implant surfaces with intrinsic reduced infection risk without the additional use of antibacterial substances.
Supporting Information Supporting Information (including the experimental data matrix containing the measured parameters) are available from the Wiley Online Library or from the author.
© 2012 WILEY-VCH Verlag GAdv. Healthcare Mater. 2012, 1, 117–127
Acknowledgements Financial support of the European Commission under FP6 integrated project No. 026501-2 “MEDDELCOAT” is gratefully acknowledged. Disclosure: The authors confi rm that there are no known confl icts of interest associated with this publication and there has been no signifi cant fi nancial support for this work that could have infl uenced its outcome.
Received: October 11, 2011Published online: December 15, 2011
[ 1 ] S. D. Puckett , E. Taylor , T. Raimondo , T. J. Webster , Biomaterials 2010 , 31 , 706 .
[ 2 ] M. Waselau , Dissertation , University of Zurich, Switzerland 2002 . [ 3 ] Handbook of biomaterials evaluation: scientifi c, technical, and clin-
ical testing of implant materials , (Ed. A. F. von Recum ), Taylor and Francis , Philadelphia , PA, USA 1998 .
[ 4 ] Y. Wu , J. P. Zitelli , K. S. TenHuisen , X. Yu , M. R. Liberta , Biomaterials 2011 , 32 , 951 .
[ 5 ] S. M. Kurtz , E. Lau , J. Schmier , K. L. Ong , K. Zhao , J. Parvizi , J. Arthropl. 2008 , 23 , 984 .
[ 6 ] R. M. Donlan , Emerg. Infect. Dis. 2001 , 7 , 277 . [ 7 ] Å. Leonhardt , J. Olsson , G. Dahlén , J. Dent. Res. 1995 , 74 ,
1607 . [ 8 ] V. Fröjd , Dissertation , University of Mälmö, Sweden 2010 . [ 9 ] D. Campoccia , L. Montanaro , C. R. Arciola , Biomaterials 2006 , 27 ,
2331 . [ 10 ] G. Mendonça , D. B. S. Mendonça , F. J. L. Aragão , L. F. Cooper , Bio-
materials 2008 , 29 , 3822 . [ 11 ] G. Colon , B. C. Ward , T. J. Webster , J. Biomed. Mater. Res. A. 2006 ,
78 , 595 . [ 12 ] V. K. Truong , R. Lapovok , Y. S. Estrin , S. Rundell , J. Wang , C. Fluke ,
R. Crawford , E. Ivanova , Biomaterials 2010 , 31 , 3674 . [ 13 ] L. Orlandini , Articularis 2007 , 4 , 13 . [ 14 ] Multiobjective Optimization, Interactive and Evolutionary
Approaches (Eds: J. Branke , K. Deb , K. Miettinen , R. Słowinski ), Springer , Berlin, Germany 2008 .
[ 15 ] R. Battiti , M. Brunato , F. Mascia , Reactive Search and Intelligent Optimization , Springer , Berlin, Germany 2008 .
[ 16 ] M. Gasik , EnginSoft News 2010 , 3 , 23 . [ 17 ] N. Drnovšek , N. Daneu , A. Recnik , M. Mazaj , J. Kovac , S. Novak ,
Surf. and Coatings Techn. 2009 , 203 , 1462 . [ 18 ] A. Braem , T. Mattheys , B. Neirinck , J. Schrooten , O. van der Biest ,
J. Vleugels , UK Patent GB0915577.1, 2009 . [ 19 ] A. Braem , T. Mattheys , B. Neirinck , J. Schrooten , O. van der Biest ,
J. Vleugels , Adv. Eng. Mater. 2011 , 13 , 509 . [ 20 ] B. Neirinck , T. Mattheys , A. Braem , J. Fransaer , O. van der Biest ,
J. Vleugels , Adv. Eng. Mater. 2008 , 10 , 246 . [ 21 ] S. Nagahara , T. Matsuda , J. Biomed. Mater. Res. 1996 , 32 , 677 . [ 22 ] J. Vilamitjana-Amedee , R. Bareille , F. Rouais , A. I. Caplan ,
M.-F. Harmand , Cell Dev. Biol. Anim. 1993 , 29A , 699 . [ 23 ] E. A. Jaffe , R. L. Nachman , C. G. Becker , C. R. Minick , J. Clin. Invest.
1973 , 52 , 2745 . [ 24 ] J. Black , Biological performance of biomaterials: Fundamentals of Bio-
compatibility , Marcel Dekker , New York 1999 . [ 25 ] H. Celik , O. Gunduz , N. Ekren , Z. Ahmad , F. Oktar , J. Biomater.
Nanobiotechnol. 2011 , 2 , 98 . [ 26 ] M. Bischof , M. Kränzlin , H. Bucher , P. Sendi , Open Pharmacoecon.
and Health Econ. J. 2010 , 2 , 25 . [ 27 ] J. Quackenbush , Nat. Rev.: Genetics. 2001 , 2 , 419 .
wileyonlinelibrary.com 127mbH & Co. KGaA, Weinheim


