Embed Size (px)
Citation preview

CUSTOMER QUERY HANDLING IN SALES INTERACTIONS
WEB APPENDIX A
Original Dictionary Creation and Coding Process.
Step 1: We separated segments into two components: (a) an audio component, without video, for verbal cues (resolving and relating behavior) and (b) a visual component, without audio, for nonverbal cues (customer interest and salesperson emoting behavior).
Step 2: For verbal cues, we took the following steps:a. Use existing dictionaries (Harvard Enquirer, LIWC, RDAL) as starting point. b. Prune the list based on the words’ relevance in the study context. Assess inter-rater
reliability.c. Conduct an inductive refinement, using a test sample to update the list.d. Identify dimensions for each construct. Assess inter-rater reliability.e. Assess the intensity of each word through ratings on a 1-3 scale by 8-10 respondents. For
resolving we used 1=low intensity, 3=high intensity and for relating 1=unpleasant, 3= pleasant.
f. To operationalize resolving/relating, multiply the occurrence (frequency as 0/1) of each resolving/relating word by its intensity score (1-3) to obtain an overall sum of resolving/relating behavior displayed in any given segment.
g. Normalize the sum scores by dividing with time taken by the salesperson to communicate the sentence (use time stamps) to obtain a weighted resolving/relating measure for subsequent analysis (see Web Appendix, Tables B1.1 and B2 for excerpts from salesperson–customer interactions and keywords).
Step 3: For nonverbal cues, we took the following steps: a. Use the test sample to generate nonverbal cue list.b. Ask expert judges to: (i) identify the valence of the nonverbal cue (positive/
neutral/negative), and (ii) isolate the cue source: facial (smiling, raising eye brows, head shaking), bodily (distance and posture), or gestural (touching, tapping, and waving). Assess inter-rater reliability.
c. Train research assistants on the test sample cues. Assess inter-rater reliability. d. Research assistants independently code the nonverbal cues from the analysis sample for
both the salesperson and customer. Assess inter-rater reliability.
1

WEB APPENDIX BTable B1.1. Salesperson Resolving Behavior Coding
Interaction Segment{Interaction #_Segment #}[Start time – End Time]
Resolving Words (Int*) Resolving Behavior = ∑(Frequency*Intensity) of solving words/ (Time taken in sec.)
Evaluating Responding
{1A_2} Customer: [0:01 – 0: 05] We have heard bad things about term insurance. What do you reckon? Salesperson: [0:05 – 0: 26] It just depends. See it depends on how much it fits in your budget. If you say to me, that I have so many dollars, then I will work backwards and provide you a number which can tell you how much permanent you can buy with it and rest can go in term. Also, there is nothing wrong with the term. It’s just how long you need the insurance for is the question and what is your current age.
Tell (1.6)How (1.5)Have (1.5)Question (1.4)What (1.3)
Buy (2.7)Provide (2.6)Go (2.5)See (2.4)Depend (2.1)Need (2)There (1.4)
(31.7)/(21)
= 1.51
{1B_18}Customer: [0:01 – 0:06] Didn’t you say this term policy comes into effect if one of passes?Salesperson: [0:08 – 0:21] That’s so right. This is building no cash or loan. This is the minimum policy. What you could do is start what we call universal life policy that is so unlike the proverbial hot cakes because it combines this protection along with a permanent cash and loan building machine.
Start (2.5)Minimum (1.7)What (1.3)Because (1.3)
Do (2.2) Combine (2.2)Along (1.8)
(16.99)/(13)
= 1.31
{4B_24}Customer: [0:25 – 0:32] So, how much I would have to pay in taxes.Salesperson: [0:34 – 0:52] Oh, good question…… So, that is 20 years from now…. I would say that you would have to pay taxes on as you draw out the money out.
Question (1.4)
Pay (2.5)Say (2.2)Draw (1.8)Have (1.5)
(9.40)/(18)
= .52
{15A_45}Customer: [0:39 – 0:47] What if Frank broke his arm and not able to go to work. Would the insurance kick in? Salesperson: [0:48 – 1:08] Well first of all it takes a doctor’s statement attesting that because you broke your arm and it might result in complications and you won’t be able to do your job. Still it is general injury…Let me think.
Because (1.3)
Do (2.2)Think (1.7)Let (1.5)
(9.10)/(20)
= .45
*Int – Intensity of resolving dictionary words is based on ratings obtained from 219 Undergraduates. (1= low intensity, 3 = high intensity)
2
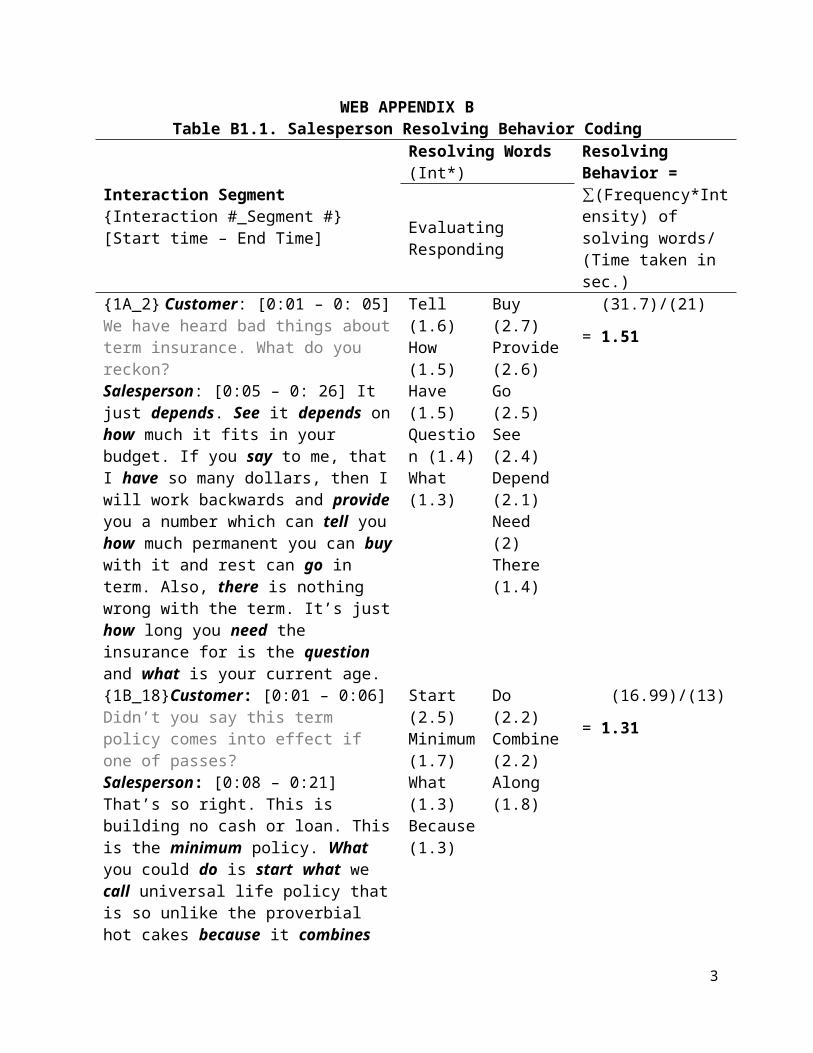
Table B1.2. Salesperson Relating Behavior Coding
Interaction _Segment{Interaction #_Segment #}[Start time – End Time]
Relating Words (Int*) (pleasant/unpleasant)*
Relating Behavior Score = ∑ (Frequency*Intensity) of relational words/ (Time taken in sec.)
Agreeable Empathy
{17B_13} Customer: [0:19 – 0:23] Is death the only way one benefits from a term insurance. Salesperson: [0:24 – 0:38] Yes Sir, but you shouldn’t look it that way. Your wife will get the money right away. For young couples just starting out who don’t have money, a universal life is an excellent plan to have.
Yes (2.9)Right (2.6)Just (2.1)Shouldn’t (1.1)Don’t (1.1)
Excellent (3)Sir (2.6)
(17.20)/(14)
= 1.23
{25A_14}Customer: [0:45 – 0:54] Does the whole life have certain part of the term insurance? Salesperson: [0:55 – 1:05] Definitely, it has. It would be great for you. It satisfies both your needs of saving and insurance and allows you to have a comfortable retirement.
Definitely (2.6)
Great (3)Satisfy (2.9)Comfortable (2.8)
(11.24)/(10)
= 1.24
{68B_21}Customer: [0:39 – 0:44] What would be the initial premium for the policy. Salesperson: [0:45– 0:53] So you are paying $589 now. Okay, we will have to see. I don’t know the rates right now. I would have to ask for a re-computation.
Right (2.6)Okay (2.2)So (2)Don’t (1.1)
(7.88)/(8)
= .98
{55B_21}Customer: [0:31 – 0:41] What if you switch from term to permanent and back again? Salesperson: [0:42 – 0:49] Well, you will always build equity in your permanent insurance. Same is not possible if you remain in the term life policy.
Well (1.9) (1.89)/(7)
= .27
* Relating dictionary word intensity refers to degree of pleasantness/unpleasantness (1= unpleasant, 3 = pleasant) and is based on ratings obtained from 219 Undergraduates.
3
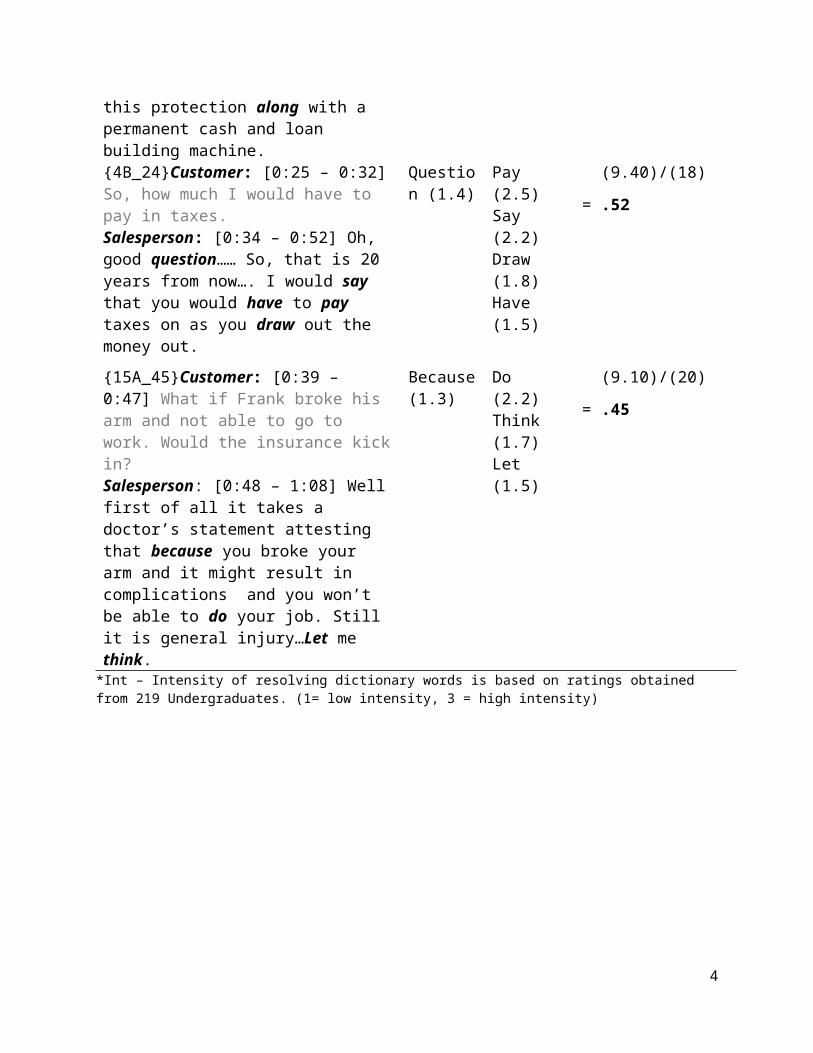
Table B1.3. Salesperson’s Emoting Behavior Coding
Nonverbal Cues Hand Gesture Body Face
Emoting Score = ∑ (Frequency*Intensity) of Nonverbal Cues / # of Nonverbal Cues
Negative emoting
Nonverbal Cue Shrugging Shoulders Lean Backwards Gaze (Avert)
Cue Intensity* 3 3 2 = (8)/3 = 2.67
Positive Emoting
Nonverbal Cue Touching Others Lean Forward Laugh
Cue Intensity* 7 5 6 = (18)/3 = 6.0*Nonverbal cue intensity is measured on a 7-point scale (1 = extremely negative, 4= neutral, 7 = extremely positive).
4
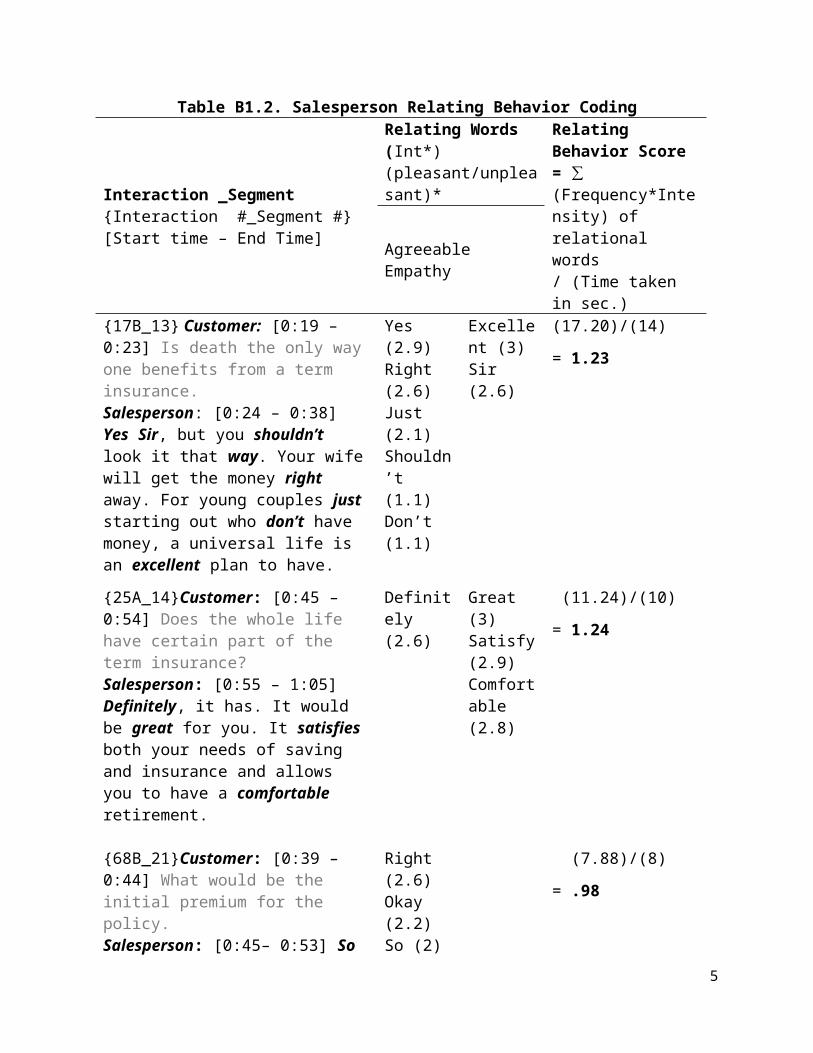
Table B2.Dictionary Words for Salesperson Resolving and Relating Behavior (Upper and Lower 30th Percentiles)
Resolving Behavior High Intensity* Low Intensity*
Evaluating GuaranteeEngageInvestigateCooperateEnvisionRewardComplete
ClaimOvercomeUtilizeAllowComplyAwareCorrect
Solution StandardLinkFeatureOverallOtherwiseAccountApparent
DifferDeclineSeemOversightDifferentInherent
Responding PursueExploreExecuteEducateEvaluateAdviseExamineOrder
DiscoverProvideDevelopRequestVerifyImplementChangeRefine
GaugeRetainElaborateAttendEnableRecord
UnawareGrappleFailBitDismissDiscourageUsualDefer
Therefore
Relating Behavior Pleasant ** Unpleasant**
Agreeable PersistenceFurtherCalmHelpRightLend
ApprovePoliteAgreeYesBelieve
ArgumentOnlyDidn’tArgueNoCan’t
Don’tErrorWon’t
Empathy PrayWooDearDesireWillingJokingSurpriseLove
SympathizeHurrayEnjoyDelightFunHappy
AgonizeOffendWhatsoeverQuarrelOverwhelming
*Intensity is measured on a 1-3 point scale. High Intensity refers to ratings of 2.4 - 3 (upper 30%-ile) and low intensity refers to ratings of 1 - 1.7 (lower 30%-ile).** Degree of agreeableness/empathy is measured on a 3-point scale, anchored by pleasant/unpleasant. Pleasant refers to ratings of 2.4 - 3 (upper 30%-ile) and unpleasant refers to ratings of 1 - 1.7 (lower 30%-ile).
5

Table B3. Prototypical Nonverbal Cues Used for Training Coders Salesperson Emoting
Prototypical Nonverbal Cues
Positive Face –Laugh, nodBody – lean forward, sitting straightHand gestures – Touching others, open palm, pointing towards self, thumbs up
Neutral Hand gestures - Writing on paper, using calculator, shuffling/gathering paper, pointing towards objects on table
Negative Face – Looking awayBody – Lean backwards, slouching Hand Gestures – Knocking the table, shrugging shoulders, crossing arms/folding arms, fidgeting with hands/cups
Customer interest Prototypical Nonverbal Cues Positive Face –Laugh, nod
Body – Lean forwardHand gestures – Touching others, open palm, pointing towards self, thumbs up
Neutral Hand gestures – Drinking/sipping water/coffee, pointing towards objects on table
Negative Face – Looking away, tilting head awayBody – Lean backwards, slouching Hand Gestures – Knocking the table, shrugging shoulders, crossing arms/folding arms, fidgeting with hands/cups
6

WEB APPENDIX C
Table C. Estimated Coefficients from Confirmatory Factor Analysis of Study Constructs
Loadinga t-value ReliabilitybAverage Variance
Extractedc
Maximum Variance Shared
(N = 178)Salesperson’s resolving behavior .81 .70 .56
Evaluating .75 10.20 Responding .86 11.78Salesperson’s relating behavior .79 .70 .56
Agreeable .86 11.33 Empathy .69 9.16
aThe estimates are standardized coefficients with corresponding t-values in the adjacent column.bEstimated composite reliability per Fornell and Larcker (1981). cEstimated variance extracted by the corresponding latent construct from its hypothesized indicators, per Fornell and Larcker (1981).Notes: The HTMT ratio for resolving and relating behaviors is .77, which is less than the benchmark of .85, suggesting discriminant validity (Voorhees et al. 2016).
7

WEB APPENDIX D
Table D. Endogeneity (Instrumental Variable Creation and Testing)
Steps Description Reference
1. Create instruments
To create valid instruments for temporally ordered and contemporaneous measures, we follow the guidance provided by prior research in marketing. Specifically, a lagged dependent variable accounts for state dependence. The current value of a contemporaneous variable is regressed on its past values, lagged one period, as well as on customer interest, lagged one period. The predicted scores then serve as instruments. These instrumental variables satisfy the exclusion criteria; they correlate with the current values of the predictor variables that they preceded but also are influenced by contemporaneous unobservables. - Example: RELATINGt = β0 + β1 RELATING(t-1) + β2 Customer
Interest(t-1) + εt
Fair (1970); Germann et al. (2015); Jacobson (1990); Liu and Yang (2009); Mizik and Jacobson (2008); Rossi (2014)
2. Establish instrument validity
Sargan test for over-identifying restrictions assess if the instruments created are uncorrelated with the residuals. - MF: N R2 = 7.38, 2
4df = 7.78 for p < .1.- MM: N R2 = 6.74, 2
4df = 7.78 for p < .1. Thus, for our instruments, we cannot reject the null prediction that the instruments and residuals are uncorrelated.
Sotgiu and Gielens (2015); Wooldridge (2010)
3. Assess strength of the instruments
In a two-step process, we (1) regress the endogenous variable on all exogenous variables, and (2) add instruments to step 1 to perform an incremental F-test and assess their incremental explanatory power. Incremental F statistics greater than 10 suggest the instruments are strong.- MF: Incremental F-statistics (df = 7, 10) = 60.47 (salesperson’s
resolving), 44.64 (salesperson’s relating), and 47.43 (salesperson’s emoting), all significant at p < .001.
- MM: Incremental F-statistics (df = 7, 10) = 59.62 (salesperson’s resolving), 43.71 (salesperson’s relating), and 42.08 (salesperson’s emoting), all significant at p < .001.
Sotgiu and Gielens (2015); Wooldridge (2010)
8

WEB APPENDIX E
Table E. Multi-collinearity (Sequential Residual Centering Approach)
Steps Description Reference
1. Create all interaction terms.
For a regression involving three way interaction term, create all two way interaction terms by multiplying the respective variables. For example, for a regression involving a three way interaction term such as Resolving Relating ST, also create all two way interaction terms such as Resolving Relating, Relating x ST, and Resolving x ST
Bottomley and Holden 2001; Hennig-Thurau et al. 2009; Knapp et al 2014; Lance 1988
2. Derive residuals for each interaction term to be used in main regression equation
For each interaction term, derive the residual to be used in the main equation. Specifically an OLS regression is run with each interaction term as the dependent variable and the respective variables as the independent variables. To account for bias in the lower ordered interaction term, include the higher order interaction term as independent variable as well. For example, - Relating x ST = β1 Relating + β2 ST + β3 Resolving x Relating x ST +
r[Relating x ST], where r[Relating x ST] is the residual. - Resolving x ST = α1 Resolving + α2 ST + α3 Resolving x Relating x ST
+ r[Resolving x ST], where r[Resolving x ST] is the residual.- Resolving x Relating x ST = γ1 Resolving + γ2 Relating + γ3 ST + γ4
Resolving x Relating + γ5 Relating x ST + γ6 Resolving x ST + r[Resolving x Relating x ST], where r[Resolving x Relating x ST] is the residual.
The residuals obtained from each OLS regression is used in place of the interaction terms in the main equation.
Francoeur 2013
9

REFERENCES (that appear in Web Appendix or in footnotes)
Bottomley, P. A., & Holden, S. J. S. (2001). Do we really know how consumers evaluate brand extensions? Empirical generalizations based on secondary analysis of eight studies. Journal of Marketing Research, 38(4), 494–500
Fair, R. C. (1970). The estimation of simultaneous equation models with lagged endogenous variables and first order serially correlated errors. Econometrica: 38(3), 507-516.
Fornell, C., & Larcker, D. F. (1981). Structural equation models with unobservable variables and measurement error: Algebra and statistics. Journal of Marketing Research, 382-388.
Germann, F., Ebbes, P., & Grewal, R. (2015). The chief marketing officer matters!. Journal of Marketing, 79(3), 1-22.
Hennig-Thurau, T., Houston, M. B., & Heitjans, T. (2009). Conceptualizing and measuring the monetary value of brand extensions: The case of motion pictures. Journal of Marketing, 73(6), 167–183.
Jacobson, R. (1990). Unobservable effects and business performance. Marketing Science, 9(1), 74-85.
Knapp, A. K., Thurau, T. H., & Mathys, J. (2014). The importance of reciprocal spillover effects for the valuation of bestseller brands: Introducing and testing a contingency model. Journal of Academy of Marketing Science, 42(2), 205-221.
Liu, Y., & Yang, R. (2009). Competing loyalty programs: Impact of market saturation, market share, and category expandability. Journal of Marketing, 73(1), 93-108.
Lance, C. E. (1988). Residual centering, exploratory and confirmatory moderator analysis, and decomposition of effects in path models containing interactions. Applied Psychological Measurement, 12, 163–175.
Mizik, N., & Jacobson, R. (2008). The financial value impact of perceptual brand attributes. Journal of Marketing Research, 45(1), 15-32.
Rossi, P. E. (2014). Invited paper—Even the rich can make themselves poor: A critical examination of IV methods in marketing applications. Marketing Science, 33(5), 655-672.
Sotgiu, F., & Gielens, K. (2015). Suppliers Caught in Supermarket Price Wars: Victims or Victors? Insights from a Dutch price war. Journal of Marketing Research, 52(6), 784-800.
Voorhees, C. M., Brady, M. K., Calantone, R., & Ramirez, E. (2016). Discriminant validity testing in marketing: an analysis, causes for concern, and proposed remedies. Journal of the Academy of Marketing Science, 44(1), 119-134.
Willett, R. P., & Pennington, A. L. (1966). Customer and salesman: The anatomy of choice and influence in a retail setting. Science Technology and Marketing, 598-616.
Wooldridge, J. M. (2010). Econometric analysis of cross section and panel data. Cambridge: MIT press.
10