Embed Size (px)
Citation preview
1132 IEEE/ACM TRANSACTIONS ON NETWORKING, VOL. 18, NO. 4, AUGUST 2010
Passive Diagnosis for Wireless Sensor NetworksYunhao Liu, Senior Member, IEEE, Kebin Liu, and Mo Li, Member, IEEE
Abstract—Network diagnosis, an essential research topic fortraditional networking systems, has not received much attentionfor wireless sensor networks (WSNs). Existing sensor debuggingtools like sympathy or EmStar rely heavily on an add-in protocolthat generates and reports a large amount of status informationfrom individual sensor nodes, introducing network overheadto the resource constrained and usually traffic-sensitive sensornetwork. We report our initial attempt at providing a lightweightnetwork diagnosis mechanism for sensor networks. We furtherpropose PAD, a probabilistic diagnosis approach for inferringthe root causes of abnormal phenomena. PAD employs a packetmarking scheme for efficiently constructing and dynamicallymaintaining the inference model. Our approach does not incuradditional traffic overhead for collecting desired information.Instead, we introduce a probabilistic inference model that encodesinternal dependencies among different network elements foronline diagnosis of an operational sensor network system. Sucha model is capable of additively reasoning root causes based onpassively observed symptoms. We implement the PAD prototypein our sea monitoring sensor network test-bed. We also examinethe efficiency and scalability of this design through extensivetrace-driven simulations.
Index Terms—Diagnosis, passive, sensor networks.
I. INTRODUCTION
W IRELESS SENSOR NETWORKs (WSNs) have beenwidely studied for enabling various applications such
as environment surveillance, scientific observation, traffic mon-itoring, etc. [14], [28]. A sensor network typically consists ofa large number of resource-limited sensor nodes working in aself-organizing and distributed manner. Having made increasingefforts [6], [7], [10]–[12], [16], [18]–[20], [27], [31] on the ro-bustness and reliability of WSNs under crucial and critical con-ditions, researchers, however, have done little work targetingthe in-situ network diagnosis for testing operational sensor net-works. It is of great importance to provide system developersuseful information on a system’s working status and guide fur-ther improvement to or maintenance on the sensor network.
Due to the ad hoc working style, once deployed, the innerstructures and interactions within a WSN are difficult to observefrom the outside. Existing works for diagnosing WSNs mainlyrely on proactive approaches, which implant debugging agents
Manuscript received October 12, 2008; revised June 22, 2009 and September17, 2009; approved by IEEE/ACM TRANSACTIONS ON NETWORKING Editor D.Agrawal. First published December 18, 2009; current version published Au-gust 18, 2010.This work was supported in part by NSFC/RGC Joint ResearchScheme N_HKUST602/08, National High Technology Research and Develop-ment Program of China (863 Program) under Grant 2007AA01Z180, NationalBasic Research Program of China (973 Program) under Grant 2006CB303000,and NSF China Key Project 60736016 and 60533110.
The authors are with the Department of Computer Science and Engineering,Hong Kong University of Science and Technology, Kowloon, Hong Kong(e-mail: [email protected]).
Color versions of one or more of the figures in this paper are available onlineat http://ieeexplore.ieee.org.
Digital Object Identifier 10.1109/TNET.2009.2037497
Fig. 1. OceanSense project.
into sensor nodes, periodically reporting the internal status in-formation of each node to the sink, such as component failures,link status, neighbor list, and the like. For example, Zhao et al.[33] propose to scan the residual energy and monitor param-eter aggregates including link loss rate and packet count. Suchinformation is collected locally at each node and transmittedback to the sink for analysis. Sympathy [23] actively collectsrun-time status from sensor nodes like routing table and flow in-formation and detects possible faults by analyzing node statustogether with observed network exceptions. The proactive infor-mation generation and retrieval exerts extra computational op-erations on sensors and imposes a large communication burdenon a WSN, which is usually fragile at high-traffic loads. Thoseapproaches work more like debugging or evaluation [26] toolsbefore the system is released for use outside laboratory settings.While such tools are effective for offline debugging when sensorbehavior and network scale can be strictly controlled, they maynot be suitable for in-situ network diagnosis of an operationalWSN since they continuously generate a large amount of trafficand aggressively consume computation, communication, andenergy resources. Also, integrating those complex debuggingagents with application programs at each sensor node introducesdifficulties for system development.
This work is motivated from our ongoing sea monitoringproject [4], [30]. As shown in Fig. 1, for this project, welaunched a working prototype WSN consisting of tens of nodesthat float on the sea surface and collect scientific data such assea depth, ambient illumination, pollution, and so on. Recently,in the field deployment tests, we often observed abnormal en-ergy depletion that never occurred in the controlled laboratoryexperiments. We suspect that such a phenomenon is due to theusage of the MultiHopRouter (integrated in SURGE) compo-nent that frequently switches the optimized routing tree of thenetwork owing to the highly instable environment of the sea.We also observed other problems on the sink side such as highdelay of data sampling and unbalanced packet loss. Fast andaccurate identification of the root causes is necessary beforetaking any further action such as issuing reboot messages tocertain nodes or physically examining the suspicious links.With current debugging tools, it is indeed difficult to integrate
1063-6692/$26.00 © 2009 IEEE

LIU et al.: PASSIVE DIAGNOSIS FOR WIRELESS SENSOR NETWORKS 1133
their agents with our application programs. It is even worse ifwe implant proactive information collectors in the network,which would inevitably speed up the depletion of energy andrapidly reduce the expected lifetime of the sensor network.
In this study, we propose an online diagnosis approachthat passively observes the network symptoms from the sink.Using probabilistic inference models, this approach effectivelydeduces the root causes of abnormal symptoms in the network.Compared to proactive debugging tools, the passive diagnosisapproach observes data from routine application packets forback-end analysis. It can also be maintained in a runningsystem at lightweight cost, thus it is expected to accommodatethe application system in a timely manner without degradingperformance.
Inference-based network diagnosis methods have beenwidely investigated and applied in enterprise networks [5].Various types of inference models, both deterministic andnondeterministic, have been proposed for inferring the rootcauses of service failures. Most models are built on expertknowledge or trained from historical data from the networks.The construction of such models can be very complicated, andonce constructed, the models are often viewed as remainingunchanged for a relatively long period [5], as enterprise net-works are usually stable with few dynamics in their structures.Compared to enterprise or static networks, however, sensornetworks have the following unique features: 1) sensor nodeshave extremely limited computational and energy resources;2) the network topology is highly dynamic due to the instableenvironment and acquiring prior knowledge of the network isdifficult; 3) the individual sensor nodes are error-prone. Suchconditions make existing active approaches for static networkdiagnosis infeasible. Thus, WSNs cannot easily adapt to suchslow start approaches as sensors are self-organized withoutany prior information on the dependencies among networkelements. The high dynamics of the WSN structure also leadsto the infeasibility of those inference models built from staticdata.
We address the above challenges as follows. First, we intro-duce a packet marking scheme, which marks the regular routinecommunicating packets to continuously reveal their communi-cation dependencies within the network. Using the output of thescheme, the sink constructs and dynamically maintains a prob-abilistic inference model. This scheme works in a lightweightmanner without any extra transmission in the network and canadapt to frequent network changes. Second, we employ a hierar-chical inference model that captures multilevel dependencies inthe network. The hierarchical model can be constructed basedon incomplete information, and it is able to efficiently handlethe network dynamics by updating only the changed parts. Thismodel takes both positive and negative symptoms as input andreports the inferred posterior probability of possible root causes.Third, we design an online inference engine capable of addi-tively reasoning the root causes such that it works even withincomplete or suspicious inputs in a nondeterministic manner.The major contributions of this study are as follows.
To the best of our knowledge, we are the first to investigate apassive method of diagnosing the wireless sensor networks.
1) According to the unique features of sensor networks, wedesign an efficient packet marking scheme that dynami-
cally reveals the inner dependencies of sensor networkswithout injecting extra transmissions.
2) We propose hierarchical inference models that capture themultilevel dependencies among the network elements andachieve high accuracy. We further introduce a fast infer-ence scheme that reduces the computational complexityand is thus scalable for online diagnosis in large-scaleWSNs.
3) We implement our diagnosis approach, PAD, and test itseffectiveness in our sea monitoring project with 24 sensors.The results of our field test show that PAD indeed helps inexploring the root causes of observed symptoms. Relyingon the output of PAD, we have successfully improved ourapplication programs.
4) We further analyze and evaluate the scalability and ef-fectiveness of PAD design through extensive simulationsunder varied conditions using the trace we collect from theprototype implementation.
The rest of this paper is organized as follows. Section II intro-duces related work. Section III describes the framework of oursystem. We introduce the packet marking scheme in Section IVand discuss the two inference models based on Belief Networkand Causality Diagram in Section V. In Section VI, we presentour implementation and simulation results. We conclude thiswork in Section VII.
II. RELATED WORK
Most existing approaches for sensor network diagnosis areproactive, in which each sensor employs a debugging agent tocollect its status information and reports to the sink by period-ically transmitting specific control messages. Some researcherspropose to monitor sensor networks by scanning the residualenergy [33] of each sensor and collecting the aggregates of pa-rameters of sensors where in-network processing is leveraged.By collecting such information, the sink is aware of the networkconditions. Some debugging systems [23], [29] aim to detectand debug software failures in sensor nodes. For example, Clair-voyant [29] focuses on debugging sensor nodes at source leveland enables developers to wirelessly connect to a remote sensorin the network and execute standard debugging commands onthat node including break, step, and the like. Sympathy [23] isan advanced debugging tool that detects and debugs the failuresin a sensor network. It actively collects in-network informationperiodically from each sensor node such as neighbor list, trafficflow, and the like and analyzes the network status at the sink. Bycarefully selecting an optimal set of information metrics, Sym-pathy aims at minimizing the diagnosis cost so as to be appli-cable to resource-limited sensor networks. It also applies an em-pirical decision tree to determine the most likely root causes foran observed exception.
Much effort has been expended on network diagnosis forenterprise networks. Commercial tools [1]–[3] independentlymonitor servers and routers with various control messages, andalerts are automatically generated from the implanted agentsin different network equipment. Those tools, being effectivefor diagnosing large-scale networks, are too complicated andenergy-consuming for resource-constrained sensor networks.There have been some passive diagnosis approaches proposedfor enterprise networks that collect a network’s operational

1134 IEEE/ACM TRANSACTIONS ON NETWORKING, VOL. 18, NO. 4, AUGUST 2010
Fig. 2. PAD system overview.
status from routine data packets so as to deduce the possibleroot causes of exceptions by an inference model. For example,Score [17] troubleshoots via shared risk modeling. It adopts asimplified two-level graph as the inference model and formu-lates the problem of locating fault roots as a minimal set coverproblem. Kandula et al. explore the bipartite graph inferencemodel and propose Shrink, introducing a probabilistic infer-ence scheme [15]. The bipartite graph model approximatesthe dependencies in enterprise networks and greatly simplifiesthe complexity of the inference process. Steinder and Sethi[24], [25] also assume a bipartite graph model and apply BeliefNetworks [21] with the bipartite graph to represent relationsamong links and end-to-end communications. Shi et al. [22]present a fault diagnosis approach for general static complexsystems based on Causality Diagram. The above schemes eitherrequire preknowledge of the network dependencies, which areobtained through Shared Risk Link Groups or SNMP in arelatively stable enterprise network, or adopt simplified modelsto approximate the network dependencies. A WSN, however,is featured by its hierarchical multilevel structures, which canhardly be approximated by the bipartite graph model. It is alsounpractical to maintain the network dependencies as stableinputs in highly dynamic and self-organized sensor networks.
The recently proposed Sherlock is the only work that adopts amultistate and multilevel inference graph for the network diag-nosis [5]. They use a scoring function to derive the best explana-tions (root causes) for observed service exceptions. In order toavoid NP-hard computation complexity, they assume that thereare at most a small constant number of failures in the enter-prise network. This assumption is not valid for the unreliableand lossy WSNs. Guo et al. [13] tackle the problem of detectingnodes with faulty readings.
III. SYSTEM FRAMEWORK
We view the sensor network as a method for data acquisi-tion in which source nodes periodically sample data and deliverthem back to the sink through multihop communication. We donot assume any specific routing strategy, that is, our approachdeals with networks of various communication topologies suchas spanning tree or directed acyclic graph (DAG).
We design a passive diagnosis approach, PAD, for such sensornetworks. PAD aims to help network managers explore the rootcauses of exceptions in a running sensor system. PAD implantsa tiny lightweight probe into each sensor node that sporadicallymarks routine application packets passing by so that the sink can
reassemble a big picture of the network conditions from thosesmall clues. Nevertheless, information from marking probes isquite limited and not sufficiently accurate. PAD employs a prob-abilistic model to infer the statuses of unobservable network el-ements and reveal the root faults in the network. PAD denotesthe observed abnormal situations as negative symptoms such asa long time delay of data arrival or frequent packet loss. It de-notes any successful packet reception as positive symptoms. Theinference model inputs both negative and positive symptoms toderive network statuses.
As illustrated in Fig. 2, PAD is mainly composed of fourcomponents: a packet marking module, a mark parsing module,a probabilistic inference model, and an inference engine. Thepacket marking module resides in each sensor node and sporad-ically marks routine application packets passing by. At the sinkside, the mark parsing module extracts and analyzes the markscarried by the received data packets. The network topology canthus be reconstructed and dynamically updated according to theanalysis results. The mark parsing module also generates pre-liminary diagnosis information such as packets loss on certainlinks, route dynamics, and so on. The inference model builds agraph of dependencies among network elements based on theoutputs from the parsing module. Using the inference modeland observed negative and positive symptoms as inputs, the in-ference engine is able to yield a fault report, which reveals theroot causes of exceptions by setting the posterior probabilitiesof each network component being problematic. The inferenceresults are also taken as feedback to help improve and updatethe inference model.
IV. PACKET MARKING
Since a sensor network has a self-organized time-varyingnetwork structure, unlike the case in an enterprise network, noprior knowledge can be obtained for constructing the inferencemodel. Also, as a WSN topology is highly dynamic, we needto acquire the network statuses continually to maintain thetopology in real time. To address the above requirements, wedesign a packet marking algorithm in PAD, which dynamicallycaptures the network topology and extracts the inner dependen-cies among network components. Before the analysis resultsare directed to the inference engine for further reasoning, wecan generate a preliminary diagnosis report on some basicnetwork exceptions.
The main operation of this marking algorithm is to let sensornodes stamp their IDs on passing data packets. Due to the size

LIU et al.: PASSIVE DIAGNOSIS FOR WIRELESS SENSOR NETWORKS 1135
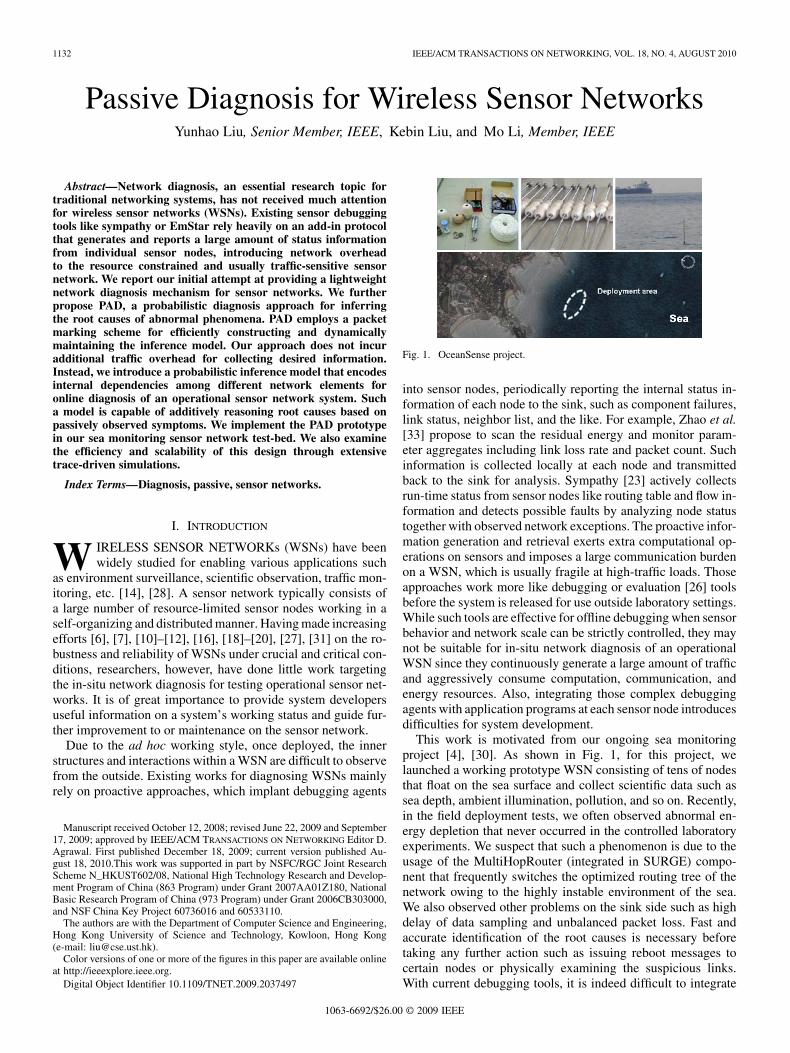
Fig. 3. The data structures for packet marking scheme. (a) A marked datapacket. (b) Cache in sensor node. (c) Path updating.
limitations of the data packets used in sensor networks, however,the marking scheme only adds 2 bytes to each data packet thatrecords one node ID. During the packet delivery, each packet ismarked by only one selected sensor node based on a set of rules.At the sink side, the mark parsing module traces back the pathsfrom each source node through analyzing sporadically markedpackets. Through assembling the paths from different sourcenodes, the network topology can be reconstructed along withthe regular data delivery of the system. If the network remainsstatic, the packet marking process automatically converges andstops after the entire network topology is constructed. When net-work conditions vary, such as when packet loss or route changesoccur, the packet marking process restarts somewhere close tothe exceptional event. A strength of this design is that it doesnot inject any extra message into the network and strictly limitsthe overhead of marks attached to each data packet.
A. Marking Scheme on Sensor Nodes
Fig. 3(a) depicts an example of marked data packet. We as-sume that each original data packet contains: 1) a source nodeID denoting the source node of this packet; and 2) a sequencenumber identifying the packet. If there is no such informationrecorded in the application, the marking scheme adds them tothe packets. The mark added to the original packet consists ofa pass node ID field that records the ID of a sensor that partici-pates in delivering this packet and a hop to source field recordingthe number of hops from the source node to the marking node.When the source node issues a new data packet, it leaves thepass node ID field empty and sets the hop to source field to 0.
Every intermediate node maintains a cache for its down-stream source nodes. As illustrated in Fig. 3(b), each cacheentry consists of a source node ID and the sequence numberof the recently received packet from the source. We call twosequence numbers of a source continuous if the first sequencenumber is larger than the latter one by 1.
As shown in Algorithm 1, upon receiving a packet, an inter-mediate node first checks whether the packet has been marked.If yes (the pass node ID is not empty), it forwards the packetwith no further operations. Otherwise, the node checks its owncache. If there is no entry for the source node ID of this packet,
it marks the packet by filling the pass node ID field with its ownID. It also creates a new entry for this source node in its cacheand records the sequence number for the packet. If there ex-ists an entry in the cache for the source node and the sequencenumber in the packet is continuous with the cache entry, the in-termediate node updates the cache entry with the new sequencenumber. To prevent duplicate marking, the intermediate nodedoes not fill the pass node ID field, instead it increments the hopto source field in the packet by 1 and forwards the packet. Ifthe sequence number of the packet is not continuous with thatrecorded in the cache entry, it might be due to the packet lossor routing dynamics. The intermediate node marks the packetby filling the packet pass node ID field with its own ID. Thenode then updates its cache entry with the new sequence numberof this packet and forwards it. The sink also participates in themarking process and creates a table recording source nodes andtheir packet sequence numbers. Using this marking scheme, thereceived packet in the sink records the ID of one intermediatenode in the routing path together with its hop distance to thesource node. We avoid duplicate marks of the same node on thesame path to save communication costs. We can further reducethe memory usage in each sensor node by organizing its cachetable into bloom filters. Each intermediate node inserts and ex-tracts the source node information on the bloom filter. The errorrate introduced by the bloom filter introduces negligible adverseimpact in the lossy by-nature sensor network.
Algorithm 1 Packet Marking (packet )
1: if has been marked2: return;3: else4: check cache;5: if no entry for source node of6: mark ;7: create entry with source node ID and sequence number
in ;8: else if entry exists and sequence numbers are continuous9: update entry with new sequence number;
10: increase hop to source in by 1;11: else if entry exists and sequence numbers are not
continuous12: mark ;13: update entry with new sequence number;14: end if15: end if16: return;
B. Parsing the Marks
At the sink, the mark parsing module extracts and parses themarks piggybacked from the received packets. For each sourcenode, we keep a data structure denoted as path to record nodeIDs along the path from the source node to the sink. As shown inFig. 3(c), a path contains an array of slots and each slot recordsa node ID along the routing path hop by hop. The path also hasa field that records the sequence number of the latest arrivedpacket from each source.
On receiving a new packet, the mark parsing module checksthe existence of a path structure associated with its source node.If there is no such path, it means it is the first time the sink
1136 IEEE/ACM TRANSACTIONS ON NETWORKING, VOL. 18, NO. 4, AUGUST 2010
has received packets from that source. The sink creates a newpath for the source node and records the source node ID at thefirst slot. The mark parsing module then examines whether thepacket has been marked (the pass node ID field has been filled).If it has been marked, the sink updates the associated slot in thepath to be the recorded node ID according to the hop to sourcefield in the packet.
For the packets from the recorded path, the parsing moduleoperates according to the recorded sequence number. We denote
as the difference between the sequence number of the receivedpacket and the sequence number recorded in the path. If the se-quence number of the new packet is equal to or less than thatrecorded in the path , it means that this is a duplicateor delayed packet. As information in the duplicate and delayedpackets is usually outdated and may lead to errors in the markparsing process, we ignore marks in such packets and do notupdate sequence number or other slots for the path. As a matterof fact, according to our deployment experiences in an opera-tional sensor network, with a relatively long sampling interval,this kind of situation is rare. If , the sequencenumber recorded in the path is updated by the newly receivedpacket, and then other slots of the path are accordingly updatedby parsing the mark as Algorithm 2. Normally, without packetloss, , and we directly add the marked node ID into thepath. Discontinuousness of the sequence numbers in-dicates that the packet loss occurs, which triggers a preliminarydiagnosis report on packet loss. Besides, the number of packetlosses is quantified as . A mismatch of the recorded passnode ID in the packet and the recorded node ID in correspondingslot in the path indicates a route alternation happening at the po-sition between the hop to source recorded in the packet and its
hops upward. If not so, the marking should have been takenearlier. The parsing algorithm then generates a preliminary re-port of a route switch. In such a case, the slots in recorded pathranging from hops before the hop to source position to thesink become inaccurate, so we clear all those slots.
Let us look at the example in Fig. 3(c), where a new markis received. The pass node ID is , four hops away from thesource. The mismatch between and current node in thesame position of this path indicates a route variation. Now, theissue is how to determine where the route variation occurs. Ifthere is no packet loss, it must be node that changes its routefrom to . In this case equals 2, indicating that one packethas just been lost. The situation can be more complicated in-deed. As illustrated in Fig. 3(c), the route variation can happenat ; for example, changes its parent node from to ,and then marks the consequent packet. The packet, however,gets lost on its way to the sink, so before the next packet markedby arrives, the sink cannot be aware of the route variation.Another possible case is that the route switch happens at , but
fails to send the consequent packet to , and then hasto mark the second packet. As the route variation happens, slotsranging from to sink are sus-picious. We update to and clear other slots, expecting fur-ther information. The reception of the packet without any markstriggers a preliminary report of a successful delivery. The markparsing function is presented in Algorithm 2.
The mark parsing module constructs and updates the networktopology with the recorded paths. Once a new packet is received,the path associated to its source node is updated. This indicates
that all links along the current path have just participated in thetransmission of a packet. For each link in the network topology,we keep a counter to count the number of transmissions expe-rienced by this link. Such information facilitates the construc-tion of the inference model as it tells the strength of the depen-dency between the parent and its successive nodes. Since linksin sensor networks are usually shared by multiple paths, we donot need to collect complete path information for all paths be-fore revealing the entire network topology. Indeed, this schemecaptures the network topology with a small number of packetreceptions, as demonstrated in our field experiment.
One potential issue is that when the sink fails to learn theinformation of some path segments and the network topologyis stable, few marks are received. As a result, it will take re-ally a long time for the sink to learn the missing path segments.Such a drawback, however, is alleviated due to the sharing fea-ture of network links, i.e., the missing links can be recoveredfrom other paths that share them. Such a feature definitely alle-viates, but does not completely avoid, this problem. To activelyeliminate such a problem, in our implementation we let the in-termediate nodes periodically clear their local caches. With thisoperation, new marks are inserted to packets, and the path in-formation at sink can be periodically refreshed even when thenetwork topology is static.
Algorithm 2 Mark Parsing(packet )
1: if p.sourceNodeID has no associated path2: create new path for p.sourceNodeID;3: end if4: ;5: if //duplicate packet6: return;7: else8: ;9: end if
10: if //no packet loss11: if //route
switch12: ;13: clear all slots in path after ;14: generates route switch report;15: end if16: else if //packet loss detected17: generate packet loss report;18: if //route
switch19: clear all slots in path after ;20: ;21: end if22: end if
Clearly, in this design we propose to mark simple messagesonly, but if we insert more marks into the data packets, we obtainricher information on the network statuses and make the diag-nosis process more straightforward. Nevertheless, in resource-constrained sensor networks, we have to minimize the commu-nication overhead introduced by our diagnosis model. There-fore, we choose to only use simplified marks to additively recon-

LIU et al.: PASSIVE DIAGNOSIS FOR WIRELESS SENSOR NETWORKS 1137
struct the network. We give details about this issue in later dis-cussions. Compared to existing approaches, our approach withquick reactivity and fast convergence is thus more suitable forhighly dynamic environments.
C. Preliminary Diagnosis Reports
Before the final diagnosis results are obtained from the infer-ence engine, some preliminary diagnosis reports can be yieldedfrom the mark parsing module, which help to analyze the net-work statuses. The preliminary diagnosis briefly infers the fol-lowing reports.
1) Success delivery report. When the sink receives a packetwithout any mark, it indicates a successful delivery along thecurrent path. This report tells us that the route from the sourcesensor node to the sink is still the same and all links along thispath have just conducted a successful transmission that confirmsthe active state of those links.
2) Packet loss report. As described above, if the differencebetween the sequence number recorded in the path and the se-quence number of the packet is more than one, it can be inferredthat the packet loss occurs. The number of packet loss is quan-tified as . In this case, according to our marking scheme,the packet must have been marked by some intermediate node.This report can further locate the packet loss location if there isno route switch accompanying the packet loss.
3) Route Switch Report. The mismatch of the pass node IDin the packet and the recorded ID in the corresponding slot inthe path indicates that the previous routing path has been altered.The position of the switch is between the hop to source recordedin the packet and its hop upward.
V. PROBABILISTIC INFERENCE
The packet mark parsing module provides a coarse abstrac-tion and incomplete report. At the sink, the successive proba-bilistic inference helps to reveal the inner dependencies amongdifferent network elements in the sensor network and expose thehidden root causes of the exterior symptoms. Network elementsare inner correlated, for example, the crash of an upstream nodecauses all its children to disconnect from the sink. In contrast,simultaneous congestion of multiple paths may indicate a highprobability of a malfunction at a common link. Based on suchobservations, we explore the dependencies among network el-ements (link status, sensing function, path status, etc.) on theconstructed communication topology and encode them with aprobabilistic model. Exterior symptoms like delay or loss of datasamples are considered as inputs. When specific symptoms areobserved by our inference algorithm, we can deduce the proba-bility of the failures of each network element and find the mostprobable root causes in real time.
Most existing inference schemes for static enterprise net-works use the simplified bipartite graph or tree-based inferencemodel. As the network topologies in sensor networks are highlydynamic and no prior knowledge can be acquired in advance,it is difficult to apply the models for static networks in sensornetworks. Instead, we apply a hierarchical inference model tocapture the inner dependencies in sensor networks. The hierar-chical model is good for encoding indirect dependencies withits hierarchical structure and can be constructed without com-plete information. Also, being assembled by many subparts, itcan easily handle the network dynamics efficiently by updating
the changed parts only. We first apply the Belief Network [21]as our inference model. Belief Network is a well-known prob-abilistic model that has been widely used in research domainslike artificial intelligence and system engineering. In BeliefNetwork, each possible root cause or symptom is representedby a variable. Each variable might have multiple values (e.g.,1 for a link in active state and 0 for in trouble). Causal rela-tionships between different variables are denoted as directionalarcs. Inferences can be conducted on this model to deduce theprobability of particular values to our interested variables oncethe values of some other variables have been observed (e.g.,symptoms like the high delay of data samplings). To furtherspeedup the process, we propose a simplified inference model,Causality Diagram. According to the characteristics of sensornetworks, we can design a simplified Causality Diagram thataccurately approximates the inference results and reduces theoverhead.
A. Belief Network
A Belief Network (or Bayesian Network) is a directed acyclicgraph (DAG) that represents a set of variables and their proba-bilistic relationships. Each vertex in the graph denotes a randomvariable. In the rest of this paper, we use “vertex” and “variable”interchangeably. A directional arc from vertex to indi-cates a causal relation between the two variables in which thevariable associated with the starting vertex acts as the causeand the variable of is the effect. The cause is called aparent of the outcome . The strength of the relation betweena parent and its child is defined by the conditional probabilities.We then formulate a Belief Network as a binary , where
is a DAG and specifies a conditionalprobability distribution (CPD) in . Here, repre-sents the set of vertices in , and denotes all arcs(or edges). specifies the conditional probability distributionof each variable given its parents. When the value domain ofvariable is discrete, the CPD can be represented as a conditionalprobability table (CPT).
Given certain evidence (values of some variables), the BeliefNetwork can answer three major types of queries [21]: 1) poste-rior probability assessment; 2) maximum posterior hypothesis;and 3) most probable explanation. The first type of query, whichestimates posterior probabilities of certain variables given someevidence variables, best fits our requirements in this work.
B. Inferring Through Belief Network
Our inference model automatically constructs and maintainsa Belief Network from the output of the mark parsing module.The inference engine accordingly infers from this model hiddenstatuses of the network. In our PAD approach, the Belief Net-work structure is assembled from the current network topologyobtained from the mark parsing module.
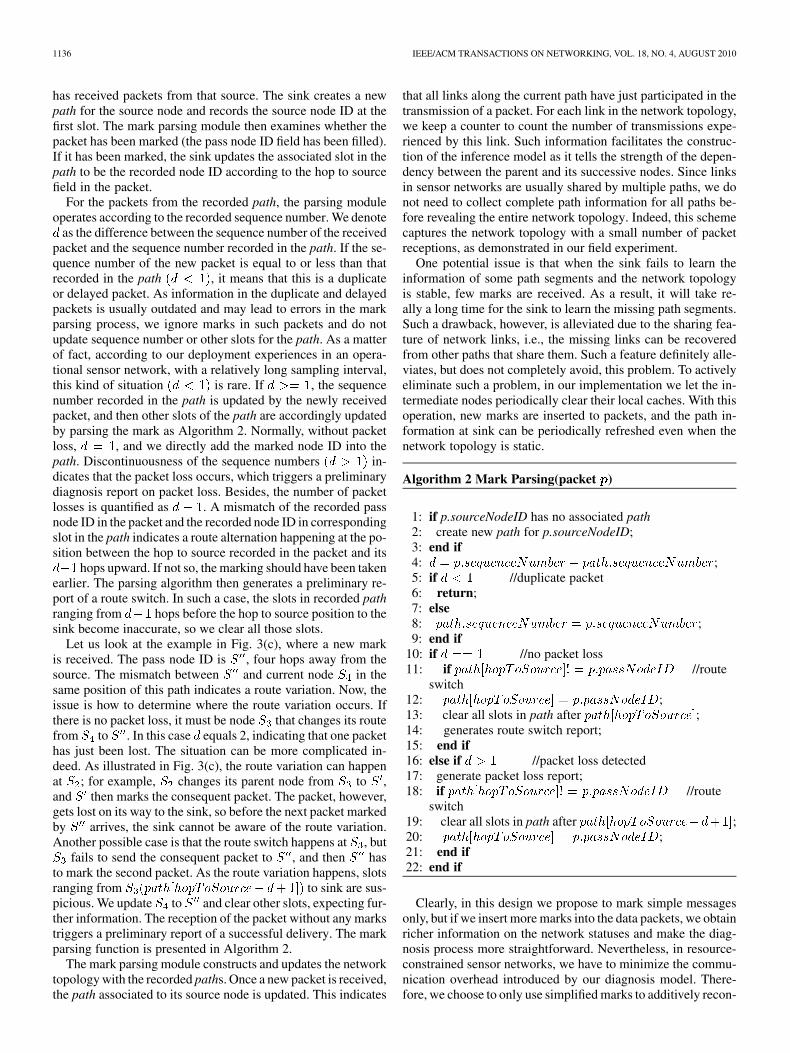
1) Constructing a Belief Network: Fig. 4(a) depicts a simpleexample topology composed of a sink and three sensor nodes.The directional edge between two nodes denotes a wireless linkand the direction of data transmitting along the link. There arefive types of variables in our Belief Network, each of whichhas the value domain of that denotes a normal orabnormal working status, respectively.
For each source node, we add a variable to the BeliefNetwork, which denotes the status of the data reception of the
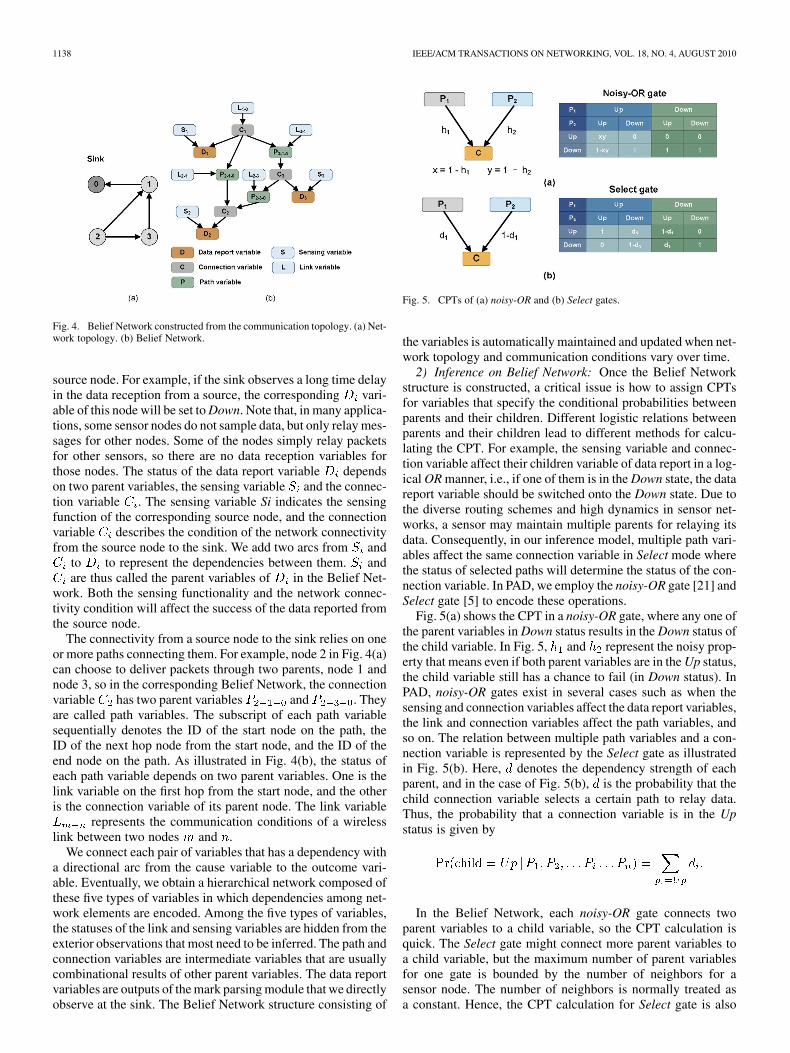
1138 IEEE/ACM TRANSACTIONS ON NETWORKING, VOL. 18, NO. 4, AUGUST 2010
Fig. 4. Belief Network constructed from the communication topology. (a) Net-work topology. (b) Belief Network.
source node. For example, if the sink observes a long time delayin the data reception from a source, the corresponding vari-able of this node will be set to Down. Note that, in many applica-tions, some sensor nodes do not sample data, but only relay mes-sages for other nodes. Some of the nodes simply relay packetsfor other sensors, so there are no data reception variables forthose nodes. The status of the data report variable dependson two parent variables, the sensing variable and the connec-tion variable . The sensing variable Si indicates the sensingfunction of the corresponding source node, and the connectionvariable describes the condition of the network connectivityfrom the source node to the sink. We add two arcs from and
to to represent the dependencies between them. andare thus called the parent variables of in the Belief Net-
work. Both the sensing functionality and the network connec-tivity condition will affect the success of the data reported fromthe source node.
The connectivity from a source node to the sink relies on oneor more paths connecting them. For example, node 2 in Fig. 4(a)can choose to deliver packets through two parents, node 1 andnode 3, so in the corresponding Belief Network, the connectionvariable has two parent variables and . Theyare called path variables. The subscript of each path variablesequentially denotes the ID of the start node on the path, theID of the next hop node from the start node, and the ID of theend node on the path. As illustrated in Fig. 4(b), the status ofeach path variable depends on two parent variables. One is thelink variable on the first hop from the start node, and the otheris the connection variable of its parent node. The link variable
represents the communication conditions of a wirelesslink between two nodes and .
We connect each pair of variables that has a dependency witha directional arc from the cause variable to the outcome vari-able. Eventually, we obtain a hierarchical network composed ofthese five types of variables in which dependencies among net-work elements are encoded. Among the five types of variables,the statuses of the link and sensing variables are hidden from theexterior observations that most need to be inferred. The path andconnection variables are intermediate variables that are usuallycombinational results of other parent variables. The data reportvariables are outputs of the mark parsing module that we directlyobserve at the sink. The Belief Network structure consisting of
Fig. 5. CPTs of (a) noisy-OR and (b) Select gates.
the variables is automatically maintained and updated when net-work topology and communication conditions vary over time.
2) Inference on Belief Network: Once the Belief Networkstructure is constructed, a critical issue is how to assign CPTsfor variables that specify the conditional probabilities betweenparents and their children. Different logistic relations betweenparents and their children lead to different methods for calcu-lating the CPT. For example, the sensing variable and connec-tion variable affect their children variable of data report in a log-ical OR manner, i.e., if one of them is in the Down state, the datareport variable should be switched onto the Down state. Due tothe diverse routing schemes and high dynamics in sensor net-works, a sensor may maintain multiple parents for relaying itsdata. Consequently, in our inference model, multiple path vari-ables affect the same connection variable in Select mode wherethe status of selected paths will determine the status of the con-nection variable. In PAD, we employ the noisy-OR gate [21] andSelect gate [5] to encode these operations.
Fig. 5(a) shows the CPT in a noisy-OR gate, where any one ofthe parent variables in Down status results in the Down status ofthe child variable. In Fig. 5, and represent the noisy prop-erty that means even if both parent variables are in the Up status,the child variable still has a chance to fail (in Down status). InPAD, noisy-OR gates exist in several cases such as when thesensing and connection variables affect the data report variables,the link and connection variables affect the path variables, andso on. The relation between multiple path variables and a con-nection variable is represented by the Select gate as illustratedin Fig. 5(b). Here, denotes the dependency strength of eachparent, and in the case of Fig. 5(b), is the probability that thechild connection variable selects a certain path to relay data.Thus, the probability that a connection variable is in the Upstatus is given by
In the Belief Network, each noisy-OR gate connects twoparent variables to a child variable, so the CPT calculation isquick. The Select gate might connect more parent variables toa child variable, but the maximum number of parent variablesfor one gate is bounded by the number of neighbors for asensor node. The number of neighbors is normally treated asa constant. Hence, the CPT calculation for Select gate is also

LIU et al.: PASSIVE DIAGNOSIS FOR WIRELESS SENSOR NETWORKS 1139
Fig. 6. The Causality Diagram.
efficient. In the initial stages, the prior fault probability distribu-tion of the link and sensing variables are assigned according toexperience data. The value of each is assigned by estimatingthe percentage of transmissions delivered through each path ina connection. Such information is input from the mark parsingmodule.
The outputs of the inference process are the status estimationsabout the link and sensing variables. Such estimations revealdeeper understanding of the network operation. For example, asingle link failure might be caused by environmental interfer-ence to the wireless communications, and multiple weak linksrelating to one sensor node might indicate a faulty node. Wehave more discussions in Section VI on how we detect the net-work faults from the output of our inference process.
C. Fast Inference Scheme
The Belief Network model is a widely used tool in dealingwith inference tasks that achieve high performance even withincomplete or suspicious inputs. The inference process in a gen-eral Belief Network, however, is NP-Hard [8], and even someapproximate approaches have been proven to be NP-hard [9].While previous studies in comparatively stable enterprise net-works are able to simplify [24], [25] the Belief Network intobipartite graphs or polytrees, the hierarchical multilevel charac-teristic of sensor networks makes it impractical. To speed up theinference for large-scale sensor networks, we further propose anew inference model based on the Causality Diagram [32].
Similar to Belief Network, Causality Diagram is a graphic in-ference model. Instead of conditional probability, Causality Di-agram uses dependency strength to represent the relationshipsbetween vertices and exploit logistic computation in the proba-bilistic inference process.
As shown in Fig. 6, a Causality Diagram is a directed graphconsisting of four types of elements including basic events, in-termediate events, arc events, and logic gates. Each vertex or arcin a Causality Diagram denotes an event. Rectangles like de-note the basic events that are independent causes of other events.Circular vertices like represent intermediate events that canbe outcomes or causes of other events. An arc connecting twovertices is called an arc event that specifies a causal relation be-tween the two events. The associated strength on an arc denotesthe probability that the parent event affects its child event. Notethat if there is no additional parameter on an arc, it means that
Fig. 7. The Causality Diagram constructed from the communication graph.(a) Network topology. (b) Causality Diagram.
the parent event has an impact on the child event at a probabilityof 1. The logic gates like specify how multiple parent eventsjointly influence one child event.
Taking the same example network topology in Fig. 4, Fig. 7shows how to construct a Causality Diagram for our inferenceengine. Different from that in Belief Network, each vertex in aCausality Diagram denotes a fault event. Those vertices withoutparents (rectangular in shape) are basic events that are inde-pendent root causes. Other circular vertices denote intermediateevents.
The traditional inference algorithm is NP-hard [32] on gen-eral Causality Diagrams and is thus infeasible for our approach.Nevertheless, in this design, due to the characteristics of WSNs,we are able to use the specifically defined OR and Select gates tomodel the dependency relationships between node behaviors. Inour model, the OR gate represents the causal relationship wherethe occurrence of any of the parent events will cause the childevent. Select gate describes the relationship that the child eventis affected by one of its parent event according to a certain prob-ability distribution. This enables us to apply a fast inferencescheme, leveraging the particular structure of our model. Ourscheme contains four stages:
1) We represent each intermediate event by its first-order cutset expression.
2) We adopt an early disjointing mechanism. Before gener-ating the final cut sets expressions, we directly disjointthe expressions. Based on the definition of the Select gate,the cut sets in a expression of the connection failure eventsare already exclusive.
3) We calculate final disjoint cut sets expressionsby iteratively replacing intermediate events in each expression.Since all negative events generated from step 2 are basic events,we avoid the complex NOT operations and the replacementprocess can be operated efficiently.
4) We estimate the posterior probabilities of user specifiedevents. Given observed events (evidences), we can calculate
1140 IEEE/ACM TRANSACTIONS ON NETWORKING, VOL. 18, NO. 4, AUGUST 2010
the posterior probability of interested events (root causes).. According to the Bayesian formula
Both and have been expressed as , and the re-sult of operating logic AND on two expressions is stilla expression. Hence, expressions on numerator and de-nominator are both , and the posterior probability ofcan be calculated algebraically.
D. Characterizing the Faults
After the inference process, both the packet mark parsingmodule and the inference engine output the fault reports aboutthe sensor network statuses. In this section, we discuss how PADfurther characterizes the faults in the network through analysisof the fault reports. In PAD, we trace the fault reasons by char-acterizing their fault patterns as follows.
1) Physical damage. In many field applications, physicaldamage might occur and destroy a portion of or the entirehardware of sensor nodes.
2) Software crashes. Software crashes include local problemson the sensor node such as a send queue overflow or busy CPUin those nodes that are physically intact. PAD detects the sensornodes in a software crash by both the diagnosis informationfrom the mark parsing module and the posterior probability es-timations from the inference engine.
3) Network congestion. Network congestion relates to agroup of sensors or traffic flows. The occurrence of networkcongestion usually leads to a high packet loss rate within theinfluenced region. Due to such a feature of this type of faults,the observed symptoms are usually temporal and distributedacross a large time and space span.
4) Environmental interferences. Environmental interferencecan significantly degrade the performance of WSNs evenwithout any internal problems within the WSN itself. Theenvironment interference usually has high spatial correlation.
5) Application flaws. As the application programs might con-tain flawed components, the network might suffer from someinefficiency that does not lead to system crashes but consumescomputational or communicational resources.
VI. EVALUATION
We conduct comprehensive simulations and implement fieldexperiments to evaluate the performance of PAD. For the imple-mentation, we used the BNJ implementation of the Belief Net-work inference as part of our inference engine. We implementedthe packet marking scheme for TelosB motes on the TinyOSplatform with nesC language. We implemented the mark parsingmodule on the java based back end.
A. Simulations
We first examine the effectiveness and efficiency of PADthrough simulations. We simulate a sensor network in whichsensor nodes are deployed on a two-dimensional space, withthe sink located at the center. Sensors periodically generate
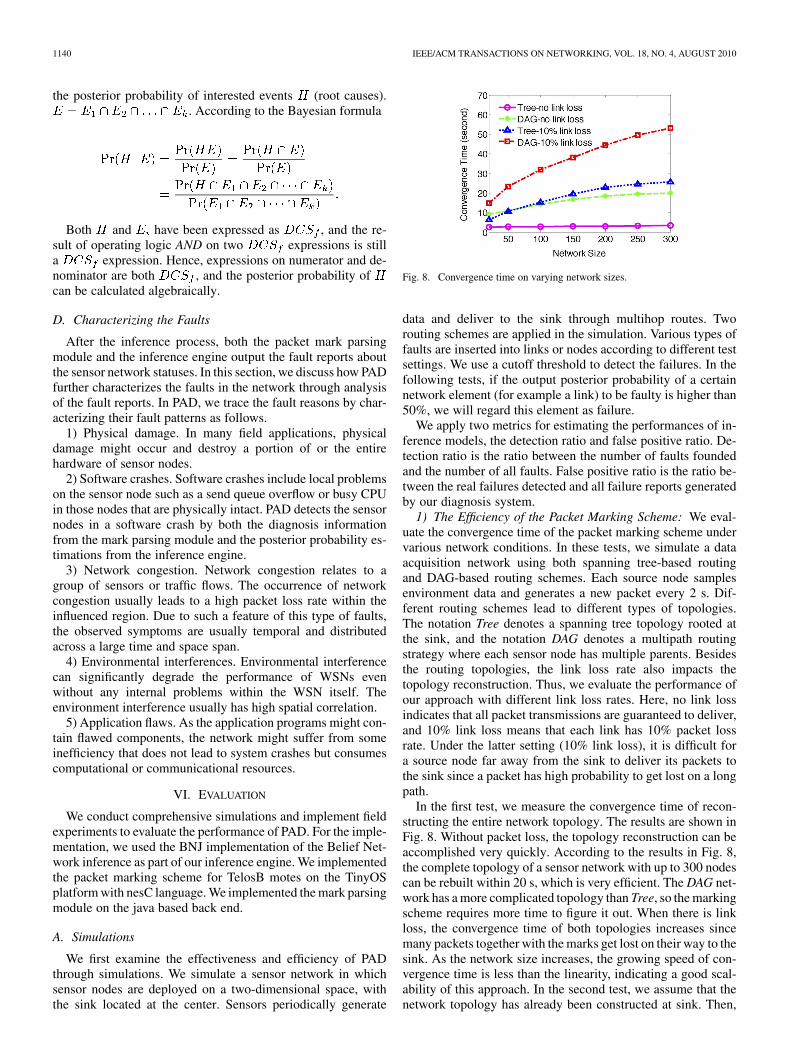
Fig. 8. Convergence time on varying network sizes.
data and deliver to the sink through multihop routes. Tworouting schemes are applied in the simulation. Various types offaults are inserted into links or nodes according to different testsettings. We use a cutoff threshold to detect the failures. In thefollowing tests, if the output posterior probability of a certainnetwork element (for example a link) to be faulty is higher than50%, we will regard this element as failure.
We apply two metrics for estimating the performances of in-ference models, the detection ratio and false positive ratio. De-tection ratio is the ratio between the number of faults foundedand the number of all faults. False positive ratio is the ratio be-tween the real failures detected and all failure reports generatedby our diagnosis system.
1) The Efficiency of the Packet Marking Scheme: We eval-uate the convergence time of the packet marking scheme undervarious network conditions. In these tests, we simulate a dataacquisition network using both spanning tree-based routingand DAG-based routing schemes. Each source node samplesenvironment data and generates a new packet every 2 s. Dif-ferent routing schemes lead to different types of topologies.The notation Tree denotes a spanning tree topology rooted atthe sink, and the notation DAG denotes a multipath routingstrategy where each sensor node has multiple parents. Besidesthe routing topologies, the link loss rate also impacts thetopology reconstruction. Thus, we evaluate the performance ofour approach with different link loss rates. Here, no link lossindicates that all packet transmissions are guaranteed to deliver,and 10% link loss means that each link has 10% packet lossrate. Under the latter setting (10% link loss), it is difficult fora source node far away from the sink to deliver its packets tothe sink since a packet has high probability to get lost on a longpath.
In the first test, we measure the convergence time of recon-structing the entire network topology. The results are shown inFig. 8. Without packet loss, the topology reconstruction can beaccomplished very quickly. According to the results in Fig. 8,the complete topology of a sensor network with up to 300 nodescan be rebuilt within 20 s, which is very efficient. The DAG net-work has a more complicated topology than Tree, so the markingscheme requires more time to figure it out. When there is linkloss, the convergence time of both topologies increases sincemany packets together with the marks get lost on their way to thesink. As the network size increases, the growing speed of con-vergence time is less than the linearity, indicating a good scal-ability of this approach. In the second test, we assume that thenetwork topology has already been constructed at sink. Then,

LIU et al.: PASSIVE DIAGNOSIS FOR WIRELESS SENSOR NETWORKS 1141
Fig. 9. Recovering time on varying network sizes.
we manually inject route dynamics into the network and mea-sure the average time needed for capturing these alternations.From the results shown in Fig. 9, we find similar trends as thatin Fig. 8. The recovering time increases when there is packetloss. Besides, packet loss can occur and lead to a mark at somehop before the route alternation, which delays the operationfor recording the route alternation. Relatively more time is re-quired for detecting topology alternations on the more compli-cated DAG network than the Tree network. The growing speedsof all curves are less than linearity, and our scheme captures thedynamics in a large network with up to 300 nodes in around15 s. According to the above results, our approach has a fastconvergence speed and is able to capture the network dynamicsquickly. Our method is also shown to be scalable with variednetwork size.
2) The Performance of Inference Models: We then evaluatethe performance of the two inference models with four differentgroups of tests. We inject artificially created errors into the net-work and let both inference models generate fault reports ac-cording to the posterior probability estimations.
We first inject sensing failures into sensor nodes and com-pare the detection ratio and false positive ratio of both models.We randomly invalidate the sensing capabilities of 10% of thenodes. BN-Tree and BN-DAG denote inference results of theBelief Network model on the spanning tree topology and DAGtopology. CD-Tree and CD-DAG represent the inference resultsof Causality Diagram model. We vary the network size from20 to 70 nodes. Fig. 10(a) plots the detection ratios, where wecan see both models achieve detection ratios higher than 85% inmost situations. Belief Network model has a slightly higher de-tection ratio than Causality Diagram model as it adopts exactlyaccurate inference. Fig. 10(b) shows the false positive ratio ofthe two models. We see that for both models, the false positiveratio decreases as the network size increases. By analyzing thefalse reports, we find that most false positive reports relate tothe leaf nodes. As those nodes lie on the boundary of the net-work field and do not relay data for others, if they do not re-port data to sink, there are few clues as to whether it is due to asensing failure or a communication failure. As the network sizeincreases, the percentage of boundary nodes decreases, so thefalse positive ratio becomes lower.
We then inject node failure of both sensing and communi-cation errors into sensor nodes; see Fig. 11 for the results. Asthe network size increases, the detection ratio decreases and thefalse positive ratio increases at the beginning (when the number
(a)
(b)
Fig. 10. (a) Sensing failure detection ratio. (b) Sensing failure false positiveratio.
(a)
(b)
Fig. 11. (a) Node failure detection ratio. (b) Node failure false positive ratio.
of nodes is around 50). Then, after the network size grows be-yond 50, the detection ratio and false positive ratio become rel-atively stable with the network size. The performance degrada-tion at the beginning part of the test is mainly because the systemperformance of extremely small networks is much better thanthat of general settings. For example, when the network con-tains only several nodes, the detection ratio can be as high asmore than 90% and false positive ratio can be very low. Such

1142 IEEE/ACM TRANSACTIONS ON NETWORKING, VOL. 18, NO. 4, AUGUST 2010
(a)
(b)
Fig. 12. (a) Detection ratio for multiple faults. (b) False positive ratio for mul-tiple faults.
a result is due to the extremely simple structure, which is easyto perform our inference. When the network is relatively large,the performance of our system degrades but still maintains atthe high end (with more than 75% detection ratio and around30% false positive). The system performance remains stable asthe network size further increases. According to the results, oursystem maintains a high performance with increased networksize.
In previous tests, the number of faults in the network is fixedto a constant percentage. In this test, we vary the number offaulty nodes to study the effect of simultaneous faults on theinference performances. In this test, we simulate a network with25 sensor nodes. The number of simultaneous faults varies from1 to 5. The experiment is conducted with the spanning tree-based routing scheme. The results are shown in Fig. 12. We findthat when more faults simultaneously occur, the detection ratiodecreases and the false positive ratio increases. This is becausethe existence of multiple errors introduces mutual interferencein the inference model and degrades the performance. As Fig. 12shows, a single error is easy to detect, and five simultaneouserrors lead to worse results.
The last group of simulations compares the computationalefficiency of the two inference models. As shown in Fig. 13,the computation overhead of Belief Network is much largerthan Causality Diagram, and their difference increases quicklyas the network size increases. Although as previous simulationshows, Causality Diagram model provides approximated infer-ence with less accuracy than the Belief Network model, and itlargely reduces the computational overhead and is thus more vi-able for practical usage.
Fig. 13. Computation time of two inference models.
(a)
(b)
Fig. 14. (a) Topology variation statistics over time. (b) Packets reception sta-tistics over time.
B. Implementations and Field Experiments
We implement and test the effectiveness of the PAD approachthrough a field study in our sea monitoring sensor networksystem [30]. The experiment is conducted over a long periodof more than three months, and in this section, we fetch andanalyze a five-day data trace that consists of a segment of22 416 received packets as well as the marks in them.
1) Observations in the Field Study: The analysis resultsfrom PAD confirm our concern about the energy efficiency ofthe system. We indeed observe extraordinarily high frequencyof topology variations in the sensor network. Fig. 14 comparesthe topology variations with the packet receptions during thesea monitoring system operation. In order to measure the speedof network topology changes, we count the number of topologyvariations in every 10-minute interval. In our test, the topologyvariations include situations where new links are added tothe network or existing links are invalidated. From results inFig. 14(a), we find that every 10 min there are topology varia-tions of 10 to more than 40 times that in the network. As shownin Fig. 14(b), however, there is no apparent correspondence be-tween the topology variations and the packet receptions. Thus,most of the topology variations occur but do not significantly

LIU et al.: PASSIVE DIAGNOSIS FOR WIRELESS SENSOR NETWORKS 1143
Fig. 15. Topology evolutions over time in field study.
improve the network communication quality. Fig. 15 exhibits agroup of topology snapshots of a certain region in the network.The interval between each pair of consecutive subfigures is2 min. According to the algorithm used in the MultiHopRoutercomponent, the topology variations indeed always incur largetraffic overhead in the network.
This observation confirms our concern that the networkquickly depletes the node energy due to the frequent routeswitches, while most of them occur because of the instabilityof link quality between the floating sensor nodes. Clearly, fre-quent route switches may lead to high energy cost that largelyconstrains the lifetime of our monitoring system. We improveour application program by setting adequate redundancy inmeasuring the link quality and switching the routes. Currently,our system has been operating neatly with much fewer unnec-essary routing dynamics.
2) Traffic Overhead: Through analyzing the receivedpackets, we compare the extra overhead introduced by PAD andSympathy. Sympathy aims to collect all necessary diagnosisinformation and determine the root causes with a role-basedmethod. If all information can be sufficiently obtained intime, it achieves exact accuracy. On the other hand, frequentinformation collection leads to tremendous traffic burden onoperational networks. We use empirical cumulative distributionfunctions (ECDFs) to quantify the overhead. In Fig. 16, the
-axis denotes the ratio of the diagnosis overhead to the totalnetwork traffic, and the -axis denotes the ECDF. For example,a point with value (0.3, 0.8) on - and -axes respectively indi-cates the fact that 80% of the time, the diagnosing transmissiondominates less than 30% of the total network traffic. A curveto the left represents a small cumulative overhead. Differentcurves for the Sympathy approach denote the cases of differentreport intervals in sending the diagnosis metrics. As Fig. 16shows, PAD significantly outperforms Sympathy in terms ofthe traffic overhead. Due to the vast traffic overhead, Sympathyis more suitable for lab experiment-based debugging but not
Fig. 16. System overhead (PAD versus Sympathy).
Fig. 17. Diagnosis results for detecting the manually injected faults in our fieldstudy.
feasible for diagnosing an instant working system. If we usea long sample interval for collecting diagnosis information,Sympathy will have smaller overhead but definitely miss muchnetwork status information and cannot output instant diagnosisresults. Instead, our passive diagnosis approach does not relyon the active information collection and can work even withincomplete information.
3) Diagnosis for the Problematic Network: In this experi-ment, we artificially inject sensing and communication faultsinto two sensor nodes respectively and mix them into the net-work. We let the two nodes interchangeably work under normaland exceptional statuses. We turn off the wireless radio of onesensor node (NodeA) every 5 min and invalidate the sensingmodule of the other node (NodeB) every 5 min. Each fault re-mains for 5 min. As shown in Fig. 17, the dash-dotted curvewith square plots represents the inferred posterior fault proba-bility of the sensing functionality in NodeB. The inference resultaccurately captures the periodical faults of the sensing modulein NodeB. The three other curves denote the inferred fault prob-abilities of three links associated with NodeA, which indicatethe faults in those links. We can see that PAD correctly capturesthe periodical communication failures of NodeA. According toSympathy performance report, Sympathy is able to detect anyfailure injected into the network if the system parameters areproperly set. By comparing the outputs of our online diagnosistool and the log information from deployed sensors, we find thatPAD achieves more than a 90% detection ratio and around 80%accuracy, but with significantly reduced overhead.
VII. CONCLUSION AND FUTURE WORK
Although there have been many approaches proposed for de-bugging the operation of sensor network systems in a controlled

1144 IEEE/ACM TRANSACTIONS ON NETWORKING, VOL. 18, NO. 4, AUGUST 2010
laboratory, few works have been done toward an in-situ diag-nosis tool for monitoring the statuses of operational systems inthe field. In this paper, we propose PAD, a passive diagnosis ap-proach that can be efficiently implemented and applied to a nor-mally working sensor network system providing in-situ networkdiagnosis. The proposed lightweight packet marking schemecollects necessary hints without injecting extra traffic overheadto the original system. The probabilistic inference model re-siding at the sink captures the unique features of the sensor net-works and yields accurate results. The inference engine workswell even with incomplete or suspicious inputs in a nondeter-ministic manner. We implement our diagnosis approach and val-idate its effectiveness in a field test in our sea monitoring project.The sea monitoring project is an ongoing project. We are cur-rently utilizing PAD as an important diagnosis tool to detect pos-sible faulty components in the system and guarantee its correctoperations. On the other hand, we are relying on such a platformto further test the effectiveness and efficiency of PAD and hopeto improve it according to our future observations.
REFERENCES
[1] HP Openview, [Online]. Available: http://www.openview.hp.com[2] IBM Tivoli, [Online]. Available: http://www.ibm.com/software/tivoli[3] Microsoft Operations Manager, [Online]. Available: http://www.mi-
crosoft.com/mom[4] OceanSense: Sensor Network for Sea Monitoring, [Online]. Available:
http://www.cse.ust.hk/~liu/Ocean/index.html[5] P. Bahl, R. Chandra, A. Greenberg, S. Kandula, D. A. Maltz, and M.
Zhang, “Towards highly reliable enterprise network services via infer-ence of multi-level dependencies,” in Proc. ACM SIGCOMM, 2007,pp. 13–24.
[6] X. Bai, D. Xuan, Z. Yun, T. H. Lai, and W. Jia, “Complete optimaldeployment patterns for full-coverage and k-connectivity �� �� ��wireless sensor networks,” in Proc. ACM MobiHoc, 2008, pp. 401–410.
[7] J. Cao, L. Zhang, J. Yang, and S. K. Das, “A reliable mobile agentcommunication protocol,” in Proc. IEEE ICDCS, 2004, pp. 468–475.
[8] G. F. Cooper, “Probabilistic inference using belief networks isNP-hard,” Stanford Knowledge Systems Laboratory, Tech. Rep.,1987.
[9] P. Dagum and M. Luby, “Approximately probabilistic reasoning inBayesian belief networks is NP-hard,” Artif. Intell., pp. 141–153, 1993.
[10] Q. Fang, J. Gao, and L. J. Guibas, “Locating and bypassing routingholes in sensor networks,” in Proc. IEEE INFOCOM, 2004, vol. 4, pp.2458–2468.
[11] R. K. Ganti, P. Jayachandran, H. Luo, and T. F. Abdelzaher, “Datalinkstreaming in wireless sensor networks,” in Proc. ACM SenSys, 2006,pp. 209–222.
[12] B. Gedik, L. Liu, and P. Yu, “ASAP: An adaptive sampling approachto data collection in sensor networks,” IEEE Trans. Parallel Distrib.Syst., vol. 18, no. 12, pp. 1766–1783, Dec. 2007.
[13] S. Guo, Z. Zhong, and T. He, “FIND: Faulty node detection for wirelesssensor networks,” in Proc. ACM SenSys, 2009, pp. 253–266.
[14] T. He, S. Krishnamurthy, J. A. Stankovic, T. Abdelzaher, L. Luo, R.Stoleru, T. Yan, L. Gu, J. Hui, and B. Krogh, “Energy-efficient surveil-lance system using wireless sensor networks,” in Proc. ACM MobiSys,2004, pp. 270–283.
[15] S. Kandula, D. Katabi, and J.-P. Vasseur, “Shrink: A tool for failurediagnosis in IP networks,” in Proc. MineNet, 2005, pp. 173–178.
[16] K. Klues, G. Hackmann, O. Chipara, and C. Lu, “A component-basedarchitecture for power-efficient media access control in wireless sensornetworks,” in Proc. ACM SenSys, 2007, pp. 59–72.
[17] R. R. Kompella, J. Yates, A. Greenberg, and A. C. Snoeren, “IP fault lo-calization via risk modeling,” in Proc. USENIX NSDI, 2005, pp. 57–70.
[18] S. Lim, C. Yu, and C. R. Das, “Rcast: A randomized communicationscheme for improving energy efficiency in MANETs,” in Proc. IEEEICDCS, 2005, pp. 123–132.
[19] H. Liu, P. Wan, C.-W. Yi, X. Jia, S. A. M. Makki, and N. Pissinou,“Maximal lifetime scheduling in sensor surveillance networks,” inProc. IEEE INFOCOM, 2005, vol. 4, pp. 2482–2491.
[20] Y. Liu, Q. Zhang, and L. Ni, “Opportunity-based topology control inwireless sensor networks,” in Proc. IEEE ICDCS, 2008, pp. 421–428.
[21] J. Pearl, Probabilistic Reasoning in Intelligent Systems: Networks ofPlausible Inference. San Mateo, CA: Morgan Kaufmann, 1988.
[22] S. Qingxi, W. Hongchun, and Z. Qin, “Intelligent fault diagnosis tech-nique based on causality diagram,” in Proc. WCICA, 2004, vol. 2, pp.1751–1755.
[23] N. Ramanathan, K. Chang, L. Girod, R. Kapur, E. Kohler, and D.Estrin, “Sympathy for the sensor network debugger,” in Proc. ACMSenSys, 2005, pp. 255–267.
[24] M. Steinder and A. S. Sethi, “Increasing robustness of fault localizationthrough analysis of lost, spurious, and positive symptoms,” in Proc.IEEE INFOCOM, 2002, vol. 1, pp. 322–331.
[25] M. Steinder and A. S. Sethi, “Probabilistic fault localization in com-munication systems using belief networks,” IEEE/ACM Trans. Netw.,vol. 12, no. 5, pp. 809–822, Oct. 2004.
[26] M. Varshney, D. Xu, M. Srivastava, and R. Bagrodia, “SenQ: A scalablesimulation and emulation environment for sensor networks,” in Proc.IEEE/ACM IPSN, 2007, pp. 196–205.
[27] J. Wu and S. Yang, “SMART: A scan-based movement-assisted sensordeployment method in wireless sensor networks,” in Proc. IEEE IN-FOCOM, 2005, vol. 4, pp. 2313–1324.
[28] N. Xu, S. Rangwala, K. K. Chintalapudi, D. Ganesan, A. Broad, R.Govindan, and D. Estrin, “A wireless sensor network for structuralmonitoring,” in Proc. ACM SenSys, 2004, pp. 13–24.
[29] J. Yang, M. L. Soffa, L. Selavo, and K. Whitehouse, “Clairvoyant: Acomprehensive source-level debugger for wireless sensor networks,” inProc. ACM SenSys, 2007, pp. 189–203.
[30] Z. Yang, M. Li, and Y. Liu, “Sea depth measurement with restrictedfloating sensors,” in Proc. IEEE RTSS, 2007, pp. 469–478.
[31] H. Zhai and Y. Fang, “Impact of routing metrics on path capacity inmulti-rate and multi-hop wireless ad hoc networks,” in Proc. IEEEICNP, 2006, pp. 86–95.
[32] Q. Zhang, “Probabilistic reasoning based on dynamic causality trees/diagrams,” Rel. Eng. Syst. Safety, vol. 46, pp. 202–220, 1994.
[33] J. Zhao, R. Govindan, and D. Estrin, “Residual energy scan formonitoring sensor networks,” in Proc. IEEE WCNC, 2002, vol. 1, pp.356–362.
Yunhao Liu (SM’06) received the B.S. degree in au-tomation from Tsinghua University, Beijing, China,in 1995, and the M.S. and Ph.D. degrees in computerscience and engineering from Michigan State Univer-sity, East Lansing, in 2003 and 2004, respectively.
He is now an Associate Professor and Post-Grad-uate Director with the Department of Computer Sci-ence and Engineering, Hong Kong University of Sci-ence and Technology, Kowloon, Hong Kong. His re-search interests include sensor network, P2P and In-ternet computing, and pervasive computing.
Dr. Liu has been a Member of the Association for Computing Machinery(ACM) since 2006.
Kebin Liu received the B.S. degree from the De-partment of Computer Science, Tongji University,Shanghai, China, and the M.S. degree in com-puter science from Shanghai Jiaotong University,Shanghai, China.
He is a joint Ph.D. student with the Department ofComputer Science and Engineering, Shanghai Jiao-tong University, and the Department of ComputerScience and Engineering, Hong Kong Universityof Science and Technology, Kowloon, Hong Kong,under the supervision of Dr. Yunhao Liu. His
research interests include sensor networks and distributed systems.
Mo Li (M’06) received the B.S. degree from the De-partment of Computer Science and Technology, Ts-inghua University, Beijing, China, in 2004.
He is currently working toward the Ph.D. degreewith the Department of Computer Science and Engi-neering, Hong Kong University of Science and Tech-nology, Kowloon, Hong Kong. His research interestsinclude sensor networking and pervasive computing.