Embed Size (px)
Citation preview
5
ee
11111'25 11111 'A
MICROCOPY RESOLUTION TEST CHARTNA now' HUM A
ED 169 097
1I-UTHORTITLE'
INSTITUTION
.PONS AGENCY.
REPORT, NO,,'PUB DATECONTRACTNOTE
EDRS PRICEDESCRIPTORS
DO&UMENT RESUMEa.
TM 008 493
Steinheiser, Frederick H., Jr.; And OthersCriterion-Referenced Testing: A Critical AnalySls ofSelected Models. Technical Paper 306. Final ReportArmy' Research Inst. for the Behavioral and SocialSciences, Alexandria, Va.
dOffice of the Deputy Chief of Staff for Personnelt(Army), Washington, D.C.ARI-TP-306Aug- 78DAHC-19-75-M-000367p.
MF01/PC03 Plus Postage.Comparative Statistics; *Criterion Referenced Tests;*Cutting Scores; Decision Making; *Mastery Tests;A*Mahematical Models; minimdm Competency Testing;*Predictive Measurement; *Statistical Analysis; TestInterpretation; Validity
. Test LengthDENTIFIERS
ABSTRACT'Alternative mathematical models for scoring and
decssion makirg with criterion referenced tests are described,.eSPecialllr as they concern appropriate test length and methods-establishirig:Statistically valid cutting scores. Several of ,theseapproaches are reviewed and compar4d on formal-analytic and empiricalgrounds: 41) 'block's -approach to setting mastery standards, involvingstudent perfot;tance and academic requirements; (2) Crehan'sclassification', Ipparing scores of students who have and who havenot completed training; (3) the probabilistic models of Macready,Dayton, and Emrick, which assume an equal proportion of masters andnonmasters; (4) the binomial distribution model, which allows forpartial acquisition of proficiency; (5) the Bayesian model, whichconsiders Tirior experience; (6) Rasch's one-parameter logistic modal,which yields person-free test calibrations and item-free personmeasurements; and (7) the ,regression approach of classical testtheory, which enables t estimation of true scores to be' made. fromobserved scores. Examples o heseoapproaches are given, as well astheir advsantago, disadvantages, and ambiguities. (GDC)
**********************************************t************************* Reproductions supplied by EDRS are the best that can be made
from the original document.4************************1********************************************
Technical Paper 306 IAD
U.S. DEPARTMENT OF HEALTH,EDUCATION & WELFARENATIONAL INSTITUTE OF
EDUCATION,
THIS DOCUMENT HAS BEEN 'REPRO-DUCED EXACTLY AS RECEIVED FROMTHTENPERSONINTSOR
VIEWORGANIZATION
OPINIONSPOINTSSTATED 00 NOT NECESSARILY REPRE-SENT OFFICIAL NATIONAL INSTITUTE OFEDUCATION POSITION OR POLICY -
CRITERION-REFERENCED TESTING:
A CRITICAL ANALYSIS OF SELECTED MODELS
Frederick H:Steinheiser, Jr., Kenneth I. Epstein, and Angelo Mirabella
aid
George B. Macready, University ofMaryland
UNIT TRAINING AND EVALUATION SYSTEMSTECHNICALAREA
U. S. Army
Research Institute for the BeVvioral and Social SCiences
Augus-t 1978
Approved for public release; distribution unlimited.
,s
rl
o
U. S. ARMY RESEARCH- ,INSTITUTEA
FOR THE BEHAVIORAL- -AND SOCIAL SCIENC
A Field Operating Agency under the Jurisdiction of, theDeputy Chief of Staff for Personnel
tt fJOSEPH ZEIDNERCTechnical Director (Designate
WILLIAM L. HAUSERColonel, US ArmyCommander
Research accomplishedunder contract to the .Department of the Army
University of. Maryland
O
NOTICES
0
DISTRIBUTION: Primary distribution of this report has been made by ARI.flease addre.ss'correspondenceconcerning distributiolrt of reports to: U. S. Army Research Institute for the Behaviorarand Social Sciences,ATTN. PE RI-P, 5001 Eisenhower Avenue, Alexandria, Virginia 22333,4
EINAL_DISPOSITION: This repcirt may be destroyed when it is no longer needed. Please do not return it tothe U. S. Army Research Institute for-the Behavioral and Social Sciences.
,NOTE: The findings in this report ere Net to be construnless so d4nated by other authorized crocuments.
as an Official Departm. t of the Army Position,
,7
°la
UnclassifiedSECURITY CLASSIFICATION OF THIS PAGE (When Data Entered)
REPORT DOCUMENTATION PAGE READ INSTRUCTIONSBEFORE COMPLETING FORM
1. REPORT NUMBER
Technical Paper 306
2. GOVT ACCESSION NO. 3. RECIPIENT'S CATALOG NUMBER
4. TITLE (and Subtitle)
CRITERNFREFERENCED TESTING: A CRITICAL ANALYSISOF SELECTED MODELS
- \..t.
5. TYPE OF REPORT 6 PERIOD COVERED
A4 Final Report6. PERFORMING ORG. REPORT NUMBER--
7. AUTHOR(4) ,- . ,.
NFrederick H. Steinheier Jr., Kenneth I. Epstein,and Angelo Mirabella (Pap; George. B. Macready(University of Maryland) 's
8. CONTRACT OR GRANT NUMBER(s)
DAHC19-75-M-0003,9. PERFORMING ORGANIZATION NAME4AND ADDRESS
University of Maryland, College Park, MarylanARI,'500[
(
Eisettpower Ave., Alex., VA.,
10. PROGRAM ELEMENT. PROJECT, TASKAREA 81 WORK UNIT NUMBERS
2062722A764
II. CONTROLLING OFFICE NAME AND ADDRESS ,
Deputy Chief of Staff for PersonnelWashington, D.C. 20310
12. REPORT DATE
August 197813. NUMBER OF PAGES
5614. MONITORING AGENCY. NAME & ADDRESS(1/ different from Controlling Office)
--
,-,..
15. SECURITY CLASS. (of thi report)
UnclassifiedI5n. DECLASSIFICATION/DOWNGRADING
SCHEDULE --' 16. DISTRIBUTION STATEMENT (of this Report)
Approved for public release; distribution unlimited ,
o
..
I17. DISTRIBUTION STATEMENT (of the abstract entered In Block 20. if different from Report)
1 . I
.
.A
'41,8. SUPPLEMENTARY NOTES 40
,
.
'-
...-
14.- KEY WOR (Continue on rev a ids if necessary end identify by block number)
Criteri -refer d bestingDecisionmak.Bayesian statistics -
Rasch mOdel'Classifiation.error
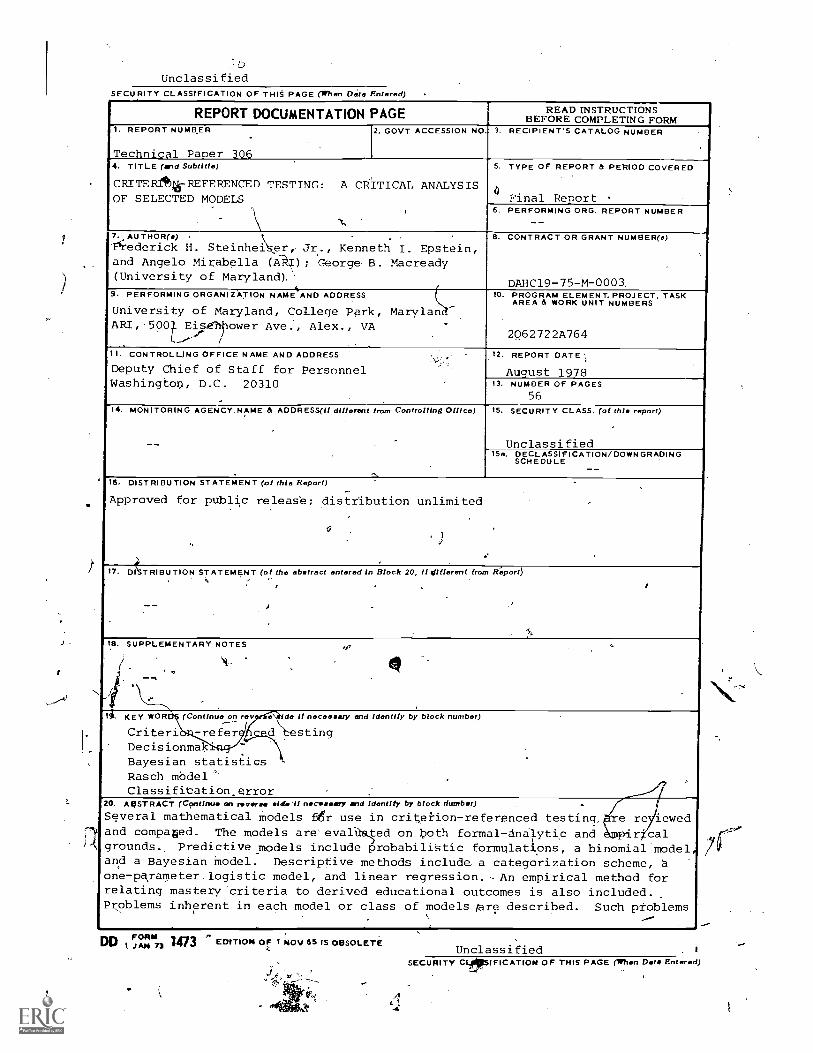
20. ABSTRACT (Cantinua on revers. aid. If necessary and identify by block dumber)
Several mathematical models Ber use in criterion- referenced testing, e re iewedand compaed. The models are evanaed on both formal analytic and pir calgrounds.. Predictive models include probabilistic formulations, a binomial'model, ,
and a Bayesian model. Descriptive methods include a categorization scheme, aone-parameter logistic model, and linear regression.-An empirical method forrelating mastery criteria to derived educational outcomes is also included.Problems inherent in each model or class of models pre described. Such problems
.......
DDI, JAN n EDITION OF I NOV 65 IS OBSOLETE
sl
Unclassified I
SECURITY CLIISIFICATION OF THIS PAGE (When Data Entered)
UnclaSsifiedSECURITY CLASSIFICATION OF THIS PAGE(Whw Data Entered)
20.
include tenability of assumptions, ease of,application, assessment ofitem characteristics, and assessment of the model's fit to data. Eachmethod/model appears to be appropriate for spe,ific types of testingsituations, although further development' will epend upon computer simu-lation and empirical research;
s..
UnlassifiedSECURITY CLASSIFICATION OF THIS P A4(When Data Entered) 1
5
Technical Paper 306
J
-#
CRITERION-REFERENCED TESTING:
A CRITICAL ANALYSIS OF SELECTED MODELS
Frederick H. Steinhe ser, Jr., Kenneth I. Epstein and Angelo Mirabtla
and
George B. Macfeady, University of. Maryland
UNIT TRAINING AND EVALUATION SYSTEMS TECHNICAL AREAL
t)4Submitted as complet6 andtechnically accurate, by:
nk J. HarrisTEW riical Area Chief
ire
Approved By:
BI baum, acting Director .ORGA IZATIONS AND Y TEMSRE)EA CH LABORAT Y
Joseph ZeidnerTECHNICAL DIRECTOR (DESIGNATE)
U.S. ARMY'RESEARCH INSTITUTE FOR 'THE BEHAVIORAL ANO SOCIAL SCIENCESC5001 Eisenhower Avenue, Alexaniiria, Virginia 22333
Office, Deputy Chief of Staff for PersonnelDepartment of the Army
August 1978ea.
Army Project Numbe2Q62722A7,69 4
"arAiiproveif for put release; distribution unlimited.
Unit Training Standardsand EvaluationA
ARI Researchi.. Reports and Technical Papers are intended for sponsors ofR&D tasks and Other research and military agencies. Any findings ready forimplementation at the time of publication are presented in the latter part ofthe Brief. Upon completion of a major phase of the task, formal recommen-dations for official action normally are conveyed to appropriate militaryagencies by briefing or Disposition Form.
14.
-6W..;:,' 4... .:0,
rTh) it .'!..A
x-,
.tr.;,.1, ; -- - , , ,..
, T. ,-174k-, - -- :,... .,0.
.
FOREWORD
The research presented in this report was conducted under ProjectMETTEST (Methodological Issues in Criterion7Referenced Testing), in theUnit Training and Evaluation Systems (UTES) Technical Area of API underArmy RDTE Project 2Q62722A764. The goal of Project METTEST is to pro-vide quanti ive methods for evaluating unit proficiency. The meansfor achievi this goal include basic research in test construction
.
methodolo measurement and scaling models, and decisionmaking imoli-,,,c4tions of test score interpretation.
Related, ongoing prograMs within the UTES Technical Area includeevaluation of small combat units under simulated battlefield conditions(REALTRAIN, ARTEP), qualification of tank crews and platoon gunnery(IDOL), and improvement of the reliability of ARTEP evaluation.
Anticipated future research under Project METTEST includes the de-velopment of a computer model for pe?formance evaluation, and deyelop-ment of measurement, scaling, scoring, decisionmaking, and qualitycontrol models for use in performance evaluations when criterion-referenced testing procedures are employed.
API research in this area is conducted -as an in-house research ef-fort augmented by contracts with organizations selected as having uniquecapabilities and facilities for research in a specific area. The pres-ent study was conducted in collaboration with personnel of the ,Univer-sity of Maryland under Contract No. DAHC19-75-M-0003.
ultt4e,
ERrector (Designate)
J
CRITERION-REFERENCED TESTING: A CRITICAL ANALYSIS OF SELECTED' MODELS
BRIEF
Requirement:
To develop a theoretical base for research and eventual applicationof methods for assigning pass-fail scores in personnel and'Unit evalua-tion using the criterion-referenced testing approach.
Procedure:
Relevant literature for each of five approaches to criterion-referenced testing was reviewed. The approaches were compared on thebasis of the following: assumptions and rationale, the interactive ef-fects,of test length and passing criteria on classification accuracy,and areas of applidtbility. A computational example was prepared foreach model, and strengths and weaknesses were also evaluated.
Findings:
.Four of the five models were able to specify an "optimal" testlength and cutoff score, although they differed as to:the requiredparameter estimates from "the test developer. For example, expert"prior" information can be used to reduce test length, Each of themodels also provides an estimate for misclassifications, or Type I andType II errors. The models are neither redundant nor interchangeable.No "best" method was identified. Rather, the selec'tion of a model de-pendg upon.the particular measurement requirements and constraints asidentified by the test developer.
UtilizatiOn of findings:
This research provides-qualitative and quantitative guidelines fordevelopers of criterion-referenced tests. The models have been appliedto analyze data from the handgun qualification course at-the U.S. ArmyMilitary Police School. Application of the models has also been ad-dressed to revision of Table VIII tank gunnery.
CRITERION-REFERENCED TESTING: A CRITICAL ANALYSIS OF SELECTED MODELS
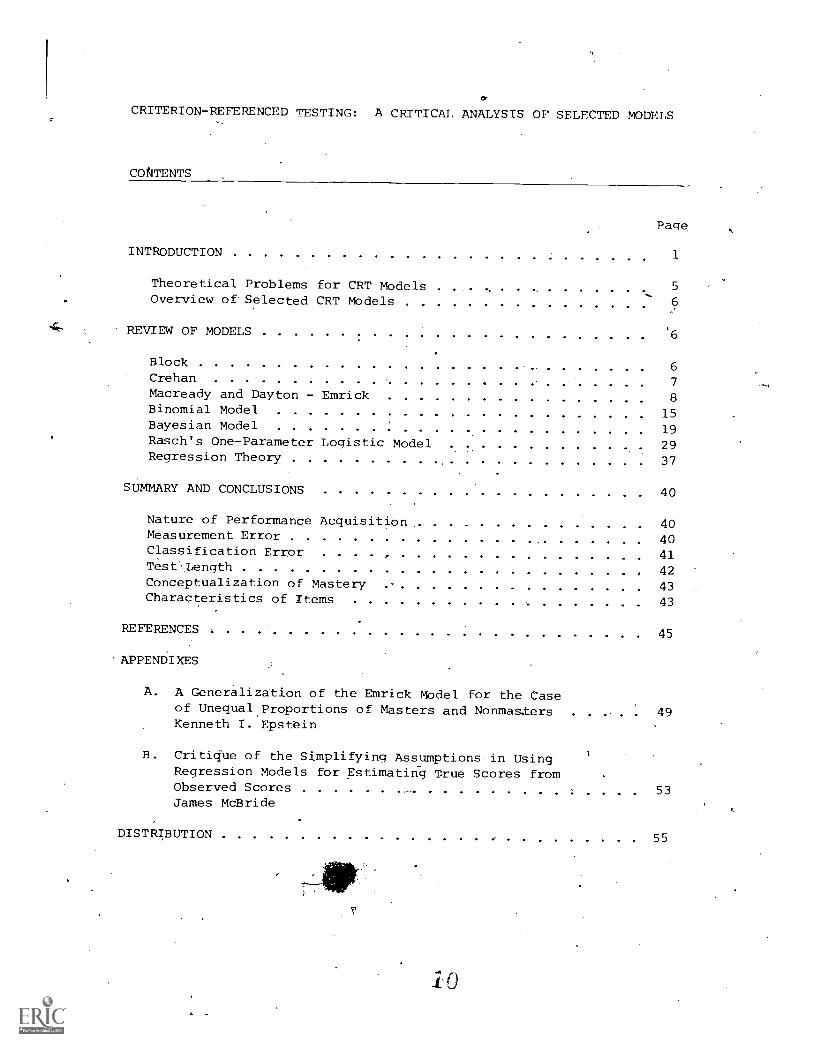
COtITENTS
INTRODUCTION
Page
1
Theoretical Problems for CRT Models 5
Overview of Selected CRT Models 6
REVIEW OF MODELS '6
Block 6Crehan 7Macready and Dayton Emrick 8Binomial Model 15Bayesian Model 19Rasch's One-Parameter Logistic Model 29Regression Theory 37
SUMMARY AND CONCLUSIONS 40
Nature of Performance Acquisition 40Measurement Error 40Classification Error 41Test ,Length 42Conceptualization of Mastery 43Characteristics of Items 43
REFERENCES 45
'APPENDIXES
A. A Generalization of the Emrick Model for the Caseof Unequal Proportions of Masters and NonmastersKenneth I. Epstein
B. Critique of the Simplifying Assumptions in UsingRegression Models for Estimating True Scores fromObserved ScoresJames McBride
49
53
DISTRIBUTION 55
10
JO'
Page
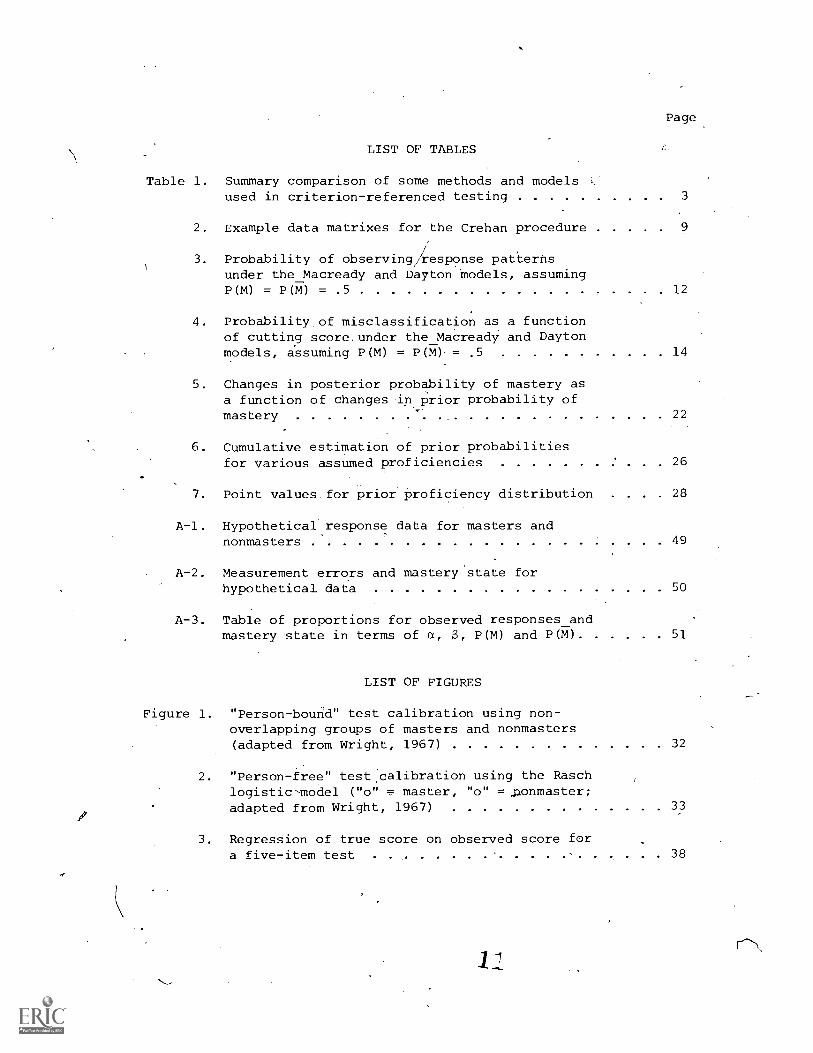
LIST OF TABLES
Table 1. Summary comparison of some methods and modelsused in criterion-referenced testing 3
2. Example data matrixes for the Crehan procedure
3. Probability of observing response patternsunder the Macready and Dayton models, assumingP(M) = P(M) = .5
4. Probability of misclassification as a functionof cutting score. under the_Macready and Daytonmodels, assuming P(M) = P(M) = .5
5. Changes in posterior probability of mastery asa function of changes in prior probability ofmastery
12
14
22
6. Cumulative estimation of prior probabilitiesfor various assumed proficiencies 26
7. Point values for prior proficiency distribution . . 28
A-1. Hypothetical response data for masters andnonmasters 49
A-2. Measurement errors and mastery state forhypothetical data 50
A-3. Table of proportions for observed responses_andmastery state in terms of a, S, P(M) and P(M) 51
LIST OF FIGURES
Figure 1. "Person-bound" test calibration using non-overlapping groups of masters and nonmasters(adapted from Wright, 1967) 32
2. "Person-free" test calibration using the Raschlogistic model ("o" master, "o" =jaonmaster;adapted from Wright, 1967)
3. Regression of true score on observed score fora five-item test
33
38
CRITERION -I FERENCED TESTING: A CRITICALANALYSIS OF SELECTtD MODELS
INTRODUCTION
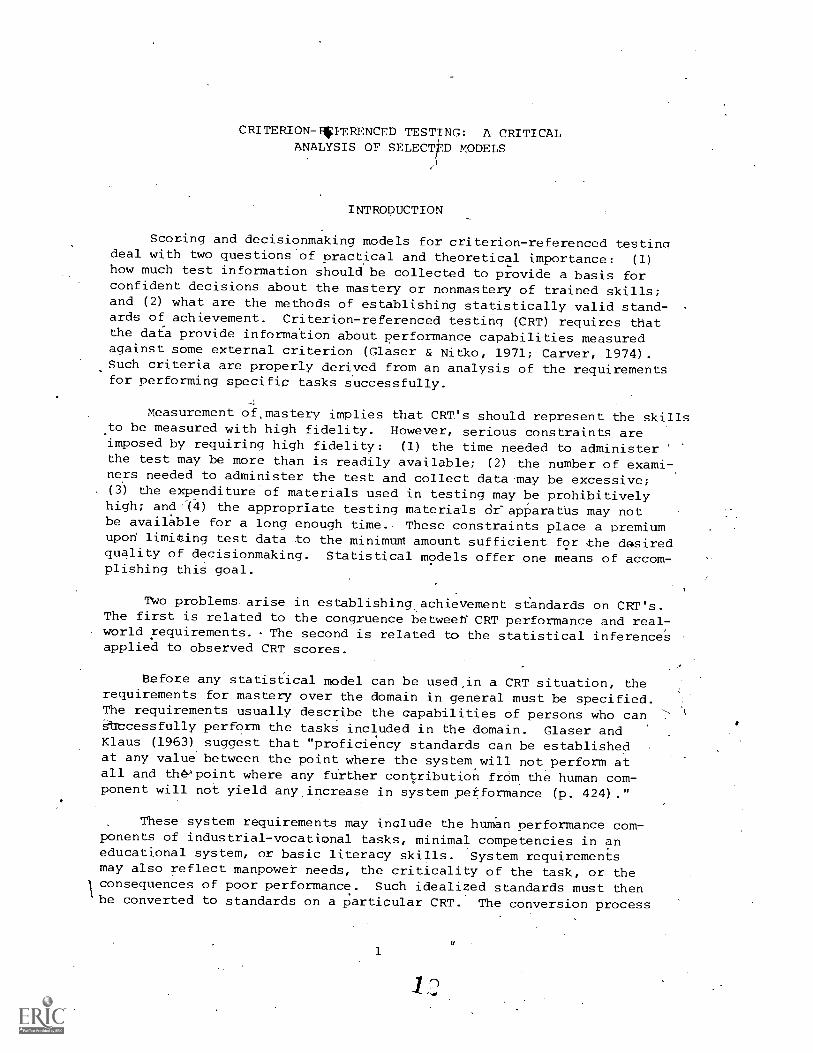
Scoring and decisionmaking models for criterion-referenced testingdeal with two questions of practical and theoretical importance: (1)how much test information should be collected to provide a basis forconfident decisions about the mastery or nonmastery of trained skills;and (2) what are the methods of establishing statistically valid stand-ards of achievement. Criterion-referenced testing (CRT) requires thatthe data provide information about performance capabilities measuredagainst some external criterion (Glaser & Nitko, 1971; Carver, 1974).Such criteria are properly derived from an analysis of the requirementsfor performing specific tasks successfully.
Measurement of.mastery implies that CRT's should represent the skillsto be measured with high fidelity. However, serious constraints areimposed by requiring high fidelity: (1) the time needed to administer 'the test may be more than is readily available; (2) the number of exami-ners needed to administer the test and collect data may be excessive;(3) the expenditure of materials used in testing may be prohibitivelyhigh; and (4) the appropriate testing materials deapparatus may notbe available for a long enough time. These constraints place a premiumupon limiting test data to the minimum amount sufficient for the d&siredquality of decisionmaking. Statistical models offer one means of accom-plishing this goal.
Two problems arise in establishing achievement standards on CRT's.The first is related to the congruence betweeK CRT performance and real-
. world requirements. - The second is related to the statistical inferencesapplied to observed CRT scores.
Before any statistical model can be used.in a CRT situation, therequirements for mastery over the domain in general must be specified.The requirements usually describe the capabilities of persons who canStrocessfully perform the tasks included in the domain. Glaser andKlaus (1963) suggest that "proficiency standards can be establishedat any value between the point where the system will not perform atall and the point where any further contribution from the human com-ponent will not yield any increase in system performance (p. 424)."
These system requirements may include the human performance com-ponents of industrial-vocational tasks, minimal competencies in aneducational system, or basic literacy skills. System requirementsmay also reflect manpower needs, the criticality of the task, or the
1consequences of poor performance. Such idealized standards must thenbe converted to standards on a particular CRT. The conversion process
1

_
. 114
11111'25 11111 'A 111[1.6
MICROCOPY RESOLU URN TEST CHART
nonorim HUN ;,11 (4 .;1,1,, if, ; A
ED 169 097
PTUTHORTITLE'
INSTITUTION
.PONS AGENCY.
REPORT, NO,:PUB DATECONTRACTNOTE
EDRS PRICEDESCRIPTORS
A
'IDENTIFIERS
ABSTRACe
deksion makiv with criterion referenced tests are described,.eePeeialllr as they concern appropriate test length and methods-of-establishihgStatistically valid cutting scores. Several of ,theseapproaches are reviewed and compar4d on formal-analytic and empiricalgrounds: .(,1) -Blockls.approach to setting mastery standards, involvingstudent perfot4ance and academic requirements; (2) Crehan'sclassification', .cIpparing scores of students who have and who Owenot comipleted training; (3) the probabilistic models of Macready,Dayton, and' Emrick, which assume an equal proportion of masters andnonmasters; (4) the binomial distribution model, which allows forpartial acquisition of proficiency; (5) the Bayesian model, Naienconsiders prior experience; (6) Rasch's one-parameter logistic model,which yields person-free test calibrations and item-free personmeasurements; and (7) the regression approach of classical testtheory, which enables t estimation of true scores to be' made' fromobserved scores. Examples o heseoapproaches are given, as well astheir advantago, disadvantages, and ambiguities. (GDC)
DOiiIMENT RESUMEer.
TM 008 493
Steinheiser, Frederick H., Jr.; And Others '4*
Criterion- Referenced Testing: A Critical AnalySis ofSelected Models. Technical Paper 306. Final ReportArmy'Research Inst. for the Behavioral and SocialSciences, Alexandria, Va.Office of the Deputy Chief of Staff for Personnel(Ar.my), Washington, D.C.Ara-TP-306Aug- 78 \
DAHC-19-75-M-000367p.
MF01/PC03 Plus Postage.Comparative Statistics; *Criterion Referenced Tests;*Cutting Scores; Decision Making; *Mastery Tests;*Mat"hematical Models; MinimUm Competency Testing;*Predictive Measurement; *Statistical Analysis; TestInterpretation; Validity
. Test Length
Alternative mathematical models for scoring and
****!P*****************************************t************************* Reproductions supplied by EDRS are the best that can be made ** from the original document. *
).1
Technical Paper 306
I
I AD
U.S. DEPARTMENT OF HEALTH,EDUCATION & WELFARENATIONAL INSTITUTE OF
EDUCATION
Ti-115 DOCUMENT HAS BEEN 'REPRO.DUCED EXACTLY AS RECEIVED FROMTHE PERSON OR ORGANIZATION ORIGIN.ATING IT POINTS OF VIEW OR OPINIONSSTATED 00 NOT NECESSARILY REPRE.SENT OFFICIAL NATIONAL INSTITUTE OFEDUCATION POSITION OR POLICY
6RITERION-REFERENCED TESTING:
A CRITICAL ANALYSIS OF SELECTED MODELS
Frederick H:Steinheiser, Jr., Kenneth I. Epstein, and Angelo Mirabella
aid
George B. Macready, University of/Maryland
(
UNIT TRAINING AND EVALUATION SYSTEMSTECHNICALAREA
U. S. Army
Research Institute for the Behavioral and Social SCiences
Augusi 1978
Approved for public release; distribution unlimited.
rl
111
U. S. ARMY RESEARCH- INSTITUTE
FOR THE BEHAVIORAL -AND SOCIAL SCIENC
A Field Operating Agency under the Jurisdiction of, theDeputy Chief of Staff for Personnel
It
JOSEPH ZEIDNER(Technical Director (Designate
WILLIAM L. HAUSERColonel, US ArmyCommander
Research accomplishedunder contract to theDepartment of the Army
University of. Maryland
NOTICES
0
DISTRIBUTION: Primary distribution of this report has been made by ARI.flease address'correspondenceconcerning distributick of reports to: U. S. Army Research Institute for the Behaviorarand Social Sciences,ATTN. PE RI-P, 5001 Eisenhower Avenue, Alexandria, Virginia 22333,4
FINAL DISPOSITION: Thii repprt may be destroyed when it is no longer needed. Please do not return it tothe U. S. Army Research Institute forthe Behavioral and Social Sciences.
,NOTE; The findings in this report are to to be constr as an Official Dapartm t of ttie Army position,unless so cliSiinated by other authorized crocuments.
.t)
A. 3
,7
UnclassifiedSECURITY CLASSIFICATION OF THIS PAGE (When Dide Entered)
REPORT DOCUMENTATION PAGE READ INSTRUCTIONSBEFORE COMPLETING FORM
I. REPORT NUMBER
Technical Paper 306
2. GOVT ACCESSION NO. 3. RECIPIENT'S CATALOG NUMBER
4. TITLE (and Subtitle)
CRITERNFREFERENCED TESTING: A CRITICAL ANALYSISOF SELECTED MODELS
-,
\i
5. TYPE OF REPORT 6 PERIOD COVERED
4 Final Report6. PERFORMING ORG. REPORT NUMBER
7 AUTHOR(a) ,
N- ,
Frederick H. Steinheier Jr., Kenneth I. Epstein,and Angelo Mirabella (Pap; George. B. Macready(University of Maryland) \
8. CONTRACT OR GRANT NUMBER(s)
DAHC19-75-M-0003,9. PERFORMING ORGANIZATION NAME4AND ADDRESS
University of Maryland, College Park, MarylanARI,'5001_
l
Eiseftpower Ave., Alex., VA.o."
10. PROGRAM ELEMENT. PROJECT, TASKAREA a WORK UNIT NUMBERS
2062722A764
11 CONTROLLING OFFICE NAME AND ADDRESS .
Deputy Chief of Staff for PersonnelWashington, D.C. 20310
12. REPORT DATE
August 197813. NUMBER OF PAGES
5614. MONITORING AGENCY. NAME et ADDRESS(// different from Controlling Office)
--
. .,...
15. SECURITY CLASS. (of this report)
Unclassified15a. DECLASSIFICATION/DOWNGRADING
SCHEDULE
' 16. DISTRIBUTION STATEMENT (of this Report) .
Approved for public release; distribution unlimited
o
..
; .-
17. DUST RI BUTION STATEMENT (of the ethernet entered in Block 20, if different from Report)0 ., ,-
I . I
/J
- .
15'
18. SUPPLEMENTARY NOTES40
'.
--a',:-
14. KEY WOR (Continue on rev e ids if necessary end identify by block number)
Criteri -refer d besting..-Decisionmak
Bayesian statisticsRasch made]. .
Classifiation.error20. ABSTRACT (Continue arl reverse aide If necessary and identify by block dumber)
Several mathematical models fier use in criterion- referenced testing, e re iewedand compaed. The models are evanaed on both formal analytic and pir calgrounds.. Predictive models include probabilistic formulations, a binomial'model,and a Bayesian model. Descriptive methods include a categorization scheme, aone-parameter logistic model, and linear regression.-An empirical method forrelating mastery criteria to derived educational outcomes is also included.Problems inherent in each model or class of models pre described. Such problems
.......
DO OR1
F 61 U73, JAM n I EDITION OF t NOY 65 IS OBSOLETEUnclassified 1
SECURITY CLIESIFICATION OF THIS PAGE (When D.t I Entered)
UnclaSsifiedSECURITY CLASSIFICATION OF THIS PAGE(Whw Data Entered)
20.
include tenability of assumptions, ease of,application, assessment ofitem characteristics, and assessment of the model's fit to data. Eachmethod/model appears to be appropriate for spe,ific types of testingsituations, although further development' will epend upon computer simu-lation and empirical research;
s..
UnlassifiedSECURITY CLASSIFICATION OF THIS P A4(When Data Entered) ,1
5
Technical Paper 306
CRITERION-REFERENCED TESTING:
A CRITICAL ANALYSIS OF SELECTED MODELS
Frederick H. Steinhe ser, Jr., Kenneth I. Epstein and Angelo MirablaC
and
George B. Macfeady, University of.Maryland
UNIT TRAINING AND EVALUATION SYSTEMS TECHNICAL AREA
Submitted as completil andtechnically accurate, by:
nk J. HarrisTEW riical Area Chief
Approved By:
1.H. Bi baum, acting Director .ORGA IZATIONS AND TEMSREyEA CH LABORAT Y
Joseph ZeidnerTECHNICAL DIRECTOR (DESIGNATE)
U.S. ARMY'RESEARCH INSTITUTE FOR.THE BEHAVIORAL AND SOCIAL SCIENCES5001 Eisenhower Avenue, Alexandria, Virginia 22333
Office, Deputy Chief of Staff for PersonnelDepartment of the Army
August 1978
Army Project Numbe2Q62722A7.69
7' -orApproved for u release; distribution unlimited.
6
Unit Training Standardsand EvaluationA
ARI Researchi,( Reports and Technical Papers are intended for sponsors ofR&D tasks and Other research and military agencies. Any findings ready forimplementation at the time of publication are presented in the latter part ofthe Brief. Upon completion of a major phase of the task, formal recommen-dations for official action normally are conveyed to appropriate militaryagencies by briefing or- Disposition Form.
es '
1;
..;:t 4.. ;0,
.4',
-
.%
FOREWORD
The research presented in this report was conducted' under ProjectMETTEST (Methodological Issues in Criterion- Referenced Testing), in theUnit Training and Evaluation Systems (UTES) Technical Area of ARI underArmy RDTE Project 2Q62722A764. The goal of Project METTEST is to pro-vide quanti ive methods for evaluating unit proficiency. The meansfor achievi this goal include basic research in test construction
.
methodolo measurement and scaling models, and decisionmaking impli-ations of test score interpretation.
Related, ongoing prograMs within the UTES Technical Area includeevaluation of small combat units under simulated battlefield conditions(REALTRAIN, ARTEP), qualification of tank crews and platoon gunnery(IDOC), and improvement of the reliability of ARTEP evaluation.
Anticipated future research under Project METTEST includes the de-velopment of a computer model for pe ?formance evaluation, and deyelop-ment of measurement, scaling, scoring, decisionmaking, and qualitycontrol models for use in performance evaluations when criterion-referenced testing procedures are employed.
ARI research in this area is conducted -as an in-house research ef-fort augmented by contracts with organizations selected as having uniquecapabilities and facilities for research in a specific area. The pres-ent study was conducted in collaboration with personnel of the ,Univer-sity of Maryland under Contract No. DAHC19-75-M-0003.
ultt4eL,
ERrector (Designate)
CRITERION-REFERENCED TESTING: A CRITICAL ANALYSIS OF SELECTED' MODELS
BRIEF
Requirement:
To develop a theoretical base for research and eventual applicationof methods for assigning pass-fail scores in personnel and'Unit evalua-tion using the criterion-referenced testing approach.
Procedure:
Relevant literature for each of five approaches to criterion-referenced testing was reviewed. The approaches were compared on thebasis of the following: assumptions and rationale, the interactive ef-fects,of test length and passing criteria on classification accuracy,and areas of applidtbility. A computational example was prepared foreach model, and strengths and weaknesses were also evaluated.
Findings:
.Four of the five models were able to specify an "optimal" testlength and cutoff score, although they differed as to:the requiredparameter estimates from "the test developer. For example, expert"prior" information can be used to reduce test length, Each of themodels also provides an estimate for misclassifications, or Type I andType II errors. The models are neither redundant nor interchangeable.No "best" method was identified. Rather, the selection of a model de-pendg upon.the particular measurement requirements and constraints asidentified by the test developer.
UtilizatiOn of findings:
This research provides-qualitative and quantitative guidelines fordevelopers of Criterion- referenced tests. The models have been appliedto anallYze data from the handgun qualification course at-the U.S. ArmyMilitary Police School. Application of the models has also been ad-dressed to revision of Table VIII tank gunnery.
CRITERION-REFERENCED TESTING: A CRITICAL ANALYSIS OF SELECTED MODELS
COtITENTS
INTRODUCTION
Page
1
Theoretical Problems for CRT Models 5
Overview of Selected CRT Models 6
REVIEW OF MODELS '6
Block 6Crehan 7Macready and Dayton Emrick 8Binomial Model 15Bayesian Model 19Rasch's One-Parameter Logistic Model 29Regression Theory 37
SUMMARY AND CONCLUSIONS 40
Nature of Performance Acquisition 40Measurement Error 40Classification Error 41Test ,Length 42Conceptualization of Mastery 43Characteristics of Items 43
REFERENCES 45
'APPENDIXES
A. A Genera'lization of the Emrick Model for the Caseof Unequal Proportions of Masters and NonmastersKenneth I. Epstein
B. Critique of the Simplifying Assumptions in UsingRegression Models for Estimating True Scores fromObserved ScoresJames McBride
49
53
DISTRIBUTION 55
10
JO'
Page
LIST OF TABLES
Table 1. Summary comparison of some methods and modelsused in criterion-referenced testing 3
2. Example data matrixes for the Crehan procedure
3. Probability of observing response patternsunder the Macready and Dayton models, assumingP(M) = P(M) = .5 12
4. Probability of misclassification as a functionof cutting score. under the_Macready and Daytonmodels, assuming P(M) = P(M), = .5
5. Changes in posterior probability of mastery asa function of changes in prior probability ofmastery
14
22
6. Cumulative estimation of prior probabilitiesfor various assumed proficiencies 26
7. Point values for prior proficiency distribution . . 28
A-1. Hypothetical response data for masters andnonmasters 49
A-2. Measurement errors and mastery state forhypothetical data 50
A-3. Table of proportions for observed responses_andmastery state in terms of a, S, P(M) and P(M) 51
LIST OF FIGURES
Figure 1. "Person-bound" test calibration using non-overlapping groups of masters and nonmasters(adapted from Wright, 1967) 32
2. "Person-free" test calibration using the Raschlogistic model ("o" = master, "o" =jaonmaster;adapted from Wright, 1967)
3. Regression of true score on observed score fora five-item test
33
38
CRITERION-NFERENCED TESTING: A CRITICALANALYSIS OF SELECTtD MODELS
INTRODUCTION
Scoring and decisionmaking models for criterion-referenced testingdeal with two questions of practical and theoretical importance: (1)how much test information should be collected to provide a basis forconfident decisions about the mastery or nonmastery of trained skills;and (2) what are the methods of establishing statistically valid stand-ards of achievement. Criterion-referenced testing (CRT) requires thatthe data provide information about performance capabilities measuredagainst some external criterion (Glaser & Nitko, 1971; Carver, 1974).Such criteria are properly derived from an analysis of the requirementsfor performing specific tasks successfully.
Measurement of.mastery implies that CRT's should represent the skillsto be measured with high fidelity. However, serious constraints areimposed by requiring high fidelity: (1) the time needed to administer 'the test may be more than is readily available; (2) the number of exami-ners needed to administer the test and collect data may be excessive;(3) the expenditure of materials used in testing may be prohibitivelyhigh; and (4) the appropriate testing materials deapparatus may notbe available for a long enough time. These constraints place a premiumupon limiting test data to the minimum amount sufficient for the d&siredquality of decisionmaking. Statistical models offer one means of accom-plishing this goal.
Two problems arise in establishing achievement standards on CRT's.The first is related to the congruence betweeK CRT performance and real-
. world requirements. - The second is related to the statistical inferencesapplied to observed CRT scores.
Before any statistical model can be used.in a CRT situation, therequirements for mastery over the domain in general must be specified.The requirements usually describe the capabilities of persons who canStrocessfully perform the tasks included in the domain. Glaser andKlaus (1963) suggest that "proficiency standards can be establishedat any value between the point where the system will not perform atall and the-'point where any further contribution from the human com-ponent will not yield any increase in system performance (p. 424)."
These system requirements may include the human performance com-ponents of industrial-vocational tasks, minimal competencies in aneducational system, or basic literacy skills. System requirementsmay also reflect manpower needs, the criticality of the task, or theconsequences of poor performance. Such idealized standards must thenbe converted to standards on a particular CRT. The conversion process
1

aInvolves issues oftest'VaJidity whiCh are'beyond the scope. of this'paper. Meskauskas (1976) discus:tes several methods that have been-usedtb bridge the gap tetween operationai4-tests and real-world requirements.
/,
If the.L.CRT inclUdes they entire fidelity task-, such as disas-,
seMbling,
and .cleAninola parricblar piece of machinery, then settingMastery standards is .relatively 9.1ear'and-unambiguous However, if theCRT includes only a sample of;:sthe full fidelity task, -or if fidelity isdecreOed for practical purpoSed, thelpinasery standards for the CRTare n8tef.e'arctit. Heretofore, the use of arbitralricutoff scores haskept...thisproblem'at a manageable level. Fpr example, objectiV&s-aftecnncliidea statement of standards requiring a certain minimum percentcorrect fdi attainment of matery status. Two criticisms can be di-rected t'this concept of mastery.
First, any percentage correct is a relative standard. The defini-'tion of mastery has been shown (Millman, 1912; Novick & Lewis, 1974;Epstein & Steinheiser, 1975) to be a function both of the percentagecorrect and of., the number of trials or items that comprise the test.
-A more comprehengive definition could be based either upon (1) an ideal-ization,4such as the proportion of correct answers of all possible testitems, or (2) the position on an underlying continuum of ability hypoth-esized, to score 49:-examinee on a given test. By stating standards in-terms of such an idealization or ability continuum, it is possible toexpli tly define masitery cutoff scores forwany test length.
second criticism refers to the level of ability required formastery. For example, why should one standard (such as 80% correct)be set rather than another (such as '70% or 90%)? Perhaps this questioncould be answered by empirical studies showing the relationship betweenCRT scores and the transfer or retention of training. The requiredlevel of mastery could also be determined by system requirements, criti-cality, and similar factors.
Each of the models discussed in this paper, with the exception of0 Block's (1972) approach to setting standards empirically, assumes that
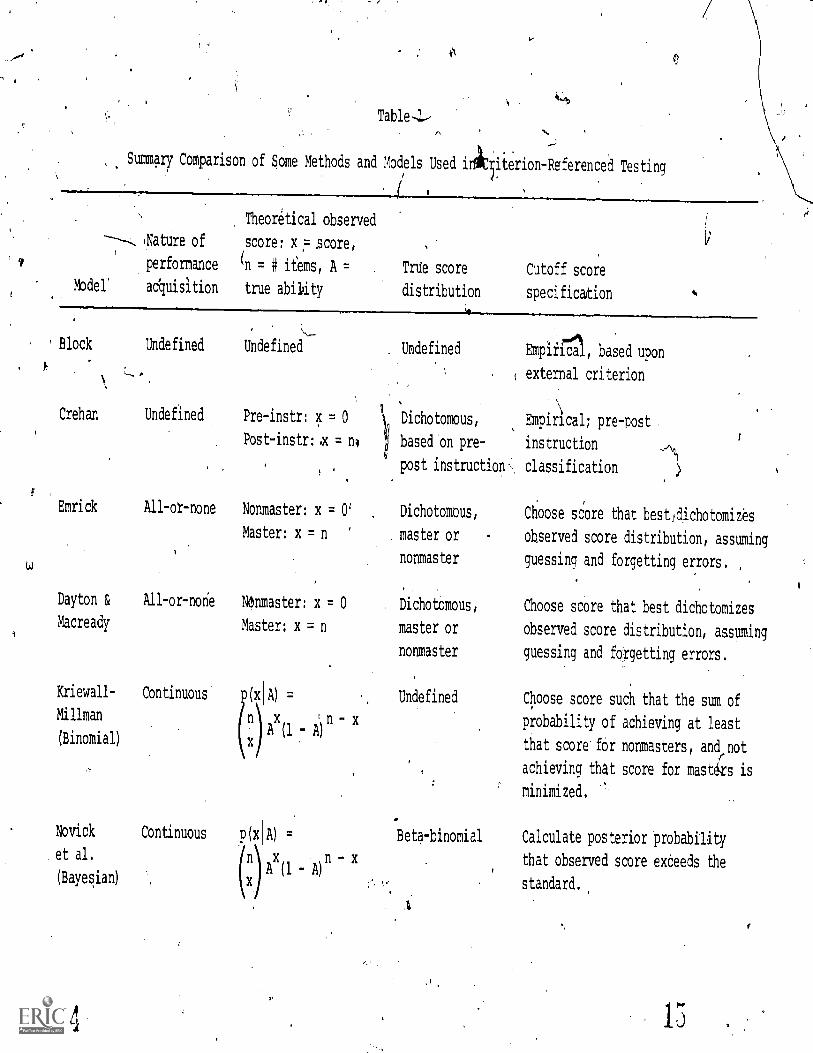
a well-defined universe of items exists or can be generated. The authorsalso assume that the role of the statistical model is to describe accu-rately an examinee with respect to that universe. The validity of thegeneralization from the universe of items to the real world 'is not in-vestigated. The models further assume that a mastery' standard relativeto the entire universe can be established. Given. these assumptions,the prqblem is how to interpret the observatiOns. The following sectiondiscusses theoretical issues whic'h may produce possible solutions. Table1 then introduces and summarizes the specific models.
The problem of setting standards arises because it is often imprac-tical to insist upon complete mastery of a task, or even to require avery high percentage of correct answers to the items comprising a CRT.Furthermore, it is often impossible to listall of the potential items
a2
LA;
Table,l,
Summary Comparison of Some Methods and Models Used idit5iterion-Referenced Testing
Theoretical observed
iNature of score: x = ,score,
performance tn = # items, A
Model' acquisition true abiDity.
True score
distribution
Cutoff score
specification
t'Y
.
Block Undefined Undefined
k
Crehan Undefined Pre-instr: x = 0
Post-instr:.x = n4
Emrick All-or-none
Dayton & All-or-none
Macready
Kriewall- Continuous
Millman
(Binomial)
Novick
et al.
(Bayesian)
lj
. Undefined Empiiit)., based upon
external criterion
Dichotomous, Empirical; pre-post
based on pre- instruction
post instruction,, classification
Nonmaster: x = 0'
Master: x = n
Dichotomous,
. master or
nonmaster
NOnmaster: x = 0 Dichotomous,
Master: x = n master or
nonmaster
A) = Undefined
n) Ax n x
Continuous p(x A) .
- x
Beta-binomial
-
Choose score that best dichotomizes
observed score distribution, assuming
guessing and forgetting errors.,
Choose score that best dichotomizes
observed score distribution, assuming
guessing and forgetting errors.
Choose score such that the sum of
probability of achieving at least
that score for nonmasters, andrnot
achieving that score for masters is
minimized.
Calculate posterior probability
that observed score exceeds the
standard.
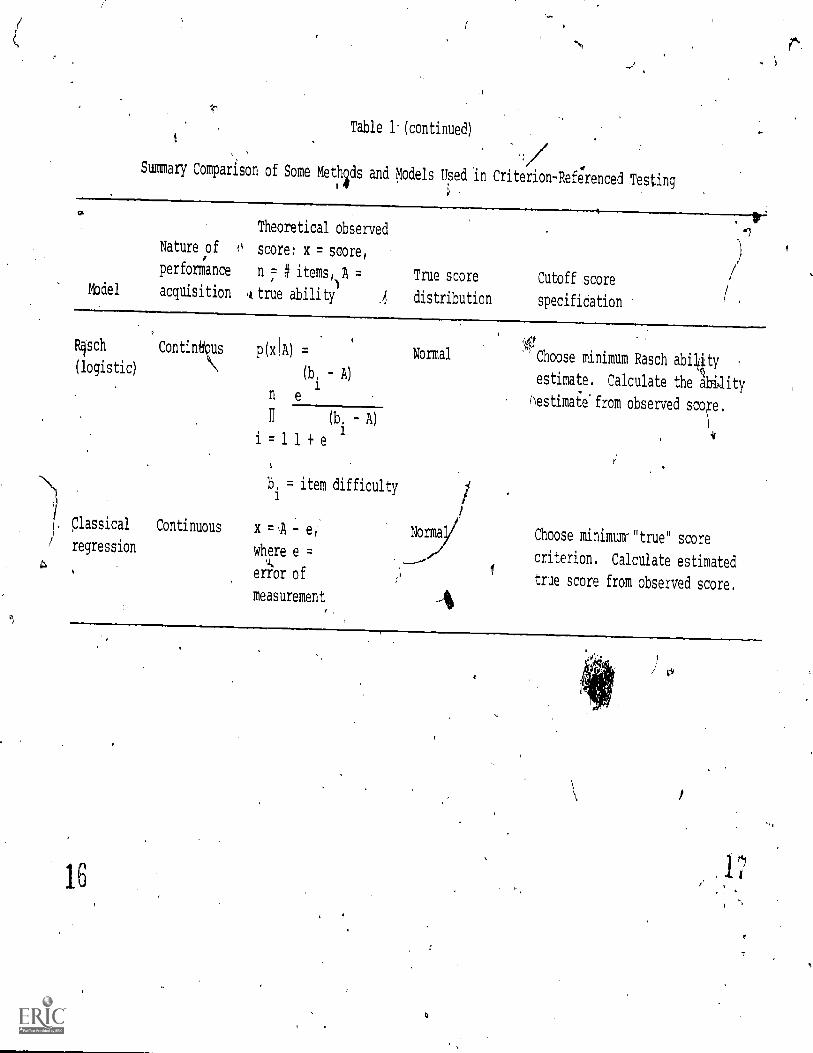
Table 1 (continued)t
Summary Comparison of Some Metho4 ds and Models Used in Criterion-Referenced Testing1
Theoretical observed
Nature of 0 score: x = score,
performance n = # items A = True score Cutoff scoreI)
Model acquisition .ktrue ability distribution specifidation
R4sch Continuous p(0) =
(logistic)OD. A)
n e
(bi - A)
i =11+ e
b. =, item difficulty
Classical Continuous x = A - ei
where e =
error of
measurement
1 regression
Normal Choose minimum Rasch abi4ty
estimate. Calculate the ability
oestimaie'from observed scofe.
Choose minimum'utrue" score
criterion. Calculate estimated
true score from observed score. ,
16
of a given task domain. For example, an indefinitely,large number ofmultiplication items could comprise an item universe from'which a sam-ple of items are selected. An arbitrary standard would determine.thatthe examinee'ansiwering,a specified number (or percentage) of the sam=ple correctly will be . clasSified as a "master" of multiplication. Themain purpose of the present paper is to evaluate several mathematicalmodels. that claim to. reduce the arbitrariness in setting criteria formastery on tests representing a sample of the test-item universe. Themotivation for deyeloping models by which criteria for mastery, can bederived formally arises from the gOtil of trying eb-minimize'misclassifications (i.e., designating a "true master" As a "nonmaster". or viceversa). The more complex the skills assessed by the CRT, the smallerthe sample of items, and the more varied the type of perfprtance in-cluded in the universe, the greater the danger of misclassification.
Theoretical Problems for CRT Models
Nature of Performance Acquisition. Is the attainment of masteryan "all-or-hone"occurrence, or is there a continu m of. varying degreesof skill acquisition? The widely accepted dicho my of master vs.nonmaster may be °wetly simplistic. The altern tive is a continuum ofvarying degrees of mastery. Both dichotomous,and colktinuous -CRT modelsare available in the literature.
M surement Error. One type of error, similar to the classicalpsychcetric notion of measurement error, refers to random inappropriaterespones due to temporary environmental distractions, lucky guesses,lapses in attention, etc. The magnitude of,such error can be estimatedand included in the estimation of actual ability and in the determina-tion of test standards and lengths.
A second type, klassification" error, refers to the (usually)dichoto us classification of an examinee as a master or nonmaster.Its magn tude and direction are primarily a function of how a cutoffscore is chosen. Classification error will tend to increase as the
.accuracy in estimating actual ability decreases, but a mathematically,defined relationship between measurement error and classification error,*has'not been derived (Guilford, 1956, pp. 380-384).
Test Length to Distinguish Masters from Nonmasters. One techniqueto improve ability estimation and reduce the chanc6 fof misclassifica-tion to increase the number of test items. In some situations thismay bepossib,le simply by repeating items until the desired level ofpfecision is attained. However, in most cases, ,test length cannot beindetinitely increased. Therefore, a statistical model that providesincreased informati per item is highly desirable. Generally, a CRTModel should provide sufficient information to decisionmakers so thatthey will know the risks of committing false positive and false nega-tive errors before the test is conducted.
Overview of Selected CRT Models
The CRT Models diScussed in this paper were c4osen to try to illus-trate--the diversity-in approaches to the problems outlined in the pre-ceding section. Methods developed by Ctehan (1974) and Block (1972)are' asically empirical in that Cutoff scores are baSed *on empiricallyderived requiregents.' Models derived by k (l971,f and by ,Macready and!Dayton (1976) assume.a dichotomdus definition. f mastery and analytEcallydescAbe procedures for establishing cutoff score Ktiewall (1969) and,,,
-Millman (1972,_1974) assume, that responses to test items and examineeability can be described by the family, of binomial distributions. Theirbasic models can be extended by,applying the theory of binomial errormovie's (Dord&.No'yick, 1968)0 Novick and Lewis (1974) discuss the ap-plication of a Bayesian approach to CRT isues. A one7parameter logis-tic model (Basch, 1960;. Wright, 1967) provides a practical example of
''"Lhow latent trait theorymav,be applied to CRT data analysisoi. Finally,an'approach for CRT.'data anaysis derived from'classical regressiontheory, is dispassoecti Each model is examined, in terms of rationale and-assumetions,-empirical support and applications', illuStrative examplesofthe type of input required and output provided, and criticalValuation.
REVIEW OF MODELS
Block
. Block's (1412) reseA h provides an experimental approach to set-ting mastery standards. He studied the relationship between the levelof, perfokmance required on each unit of a three-unit instructional se-quence and five cognitive and affective outcome variables. The ration-ale for this study was the intuitive notion that maximum performance onan external measure of achievement would be observed in students havingthe most stringent passing requirements in the instruction. .A secondquestion concerned the relationship between scores on an affectivemeasure of interest and atkitude'and passing requirements i instruction.
Block's experiment included four treatment groups that differedfrom one instructional unit to the next with respect to the standardrequired for advancement. If the strident did not meet the standard.(65%, 75%, 85%, or 95% of the items correct on a 20-item test), reme-di'al instruction was provided. Students in a control group proceededom one unit to the next with' no remediation,,tegardless of their test
core. Five outcome variables were-defined: achievement, learning rate,ransfer, interest, and attitude.
I
Transfer was measured by a 10-item test which required the use ofthe learned skills to solve a novel set of problems; It Was given bothas a pretest and after instruction. Interest and attitude were measuredusing a 24-item questionnaire.
6
./
Most of the resats suppOrteci,the intuitive hypothesis. The'eon'trod group did consistent y worse on a hl ement, tr i-klemd reten-tion, than any of the exile imental-qr_upse a d the rung curves sug-gested that high standards early' in an ins r ctiomal sequence-may Produceincreased efficiency later in the sequence. owever,. several interestingexceptions to the intuitive expectations sugges that 44pher standards
.are. not always better standards. For exampleethe 85% and 95% groupsdid not differ from one another on retention oe achievement measures,7,although they both differed from the'cOntiO1 group. Only, the :15% grohpproduced sustained high,levels 'of inteiest and attitude. J
44'"4,
Bl'ock's research suggests that a unitary definition of an "optimum"CRTCuttiw score may bequestionable. If uniformly,high achievementVand transfer are required at the possible expenSe of,positive interestand attitude, it may be that thehighest,pastety standard should be used.Howeiier, if some "mix" 4"cognitive andaffective outcomes is desired,
Pkhen a lower standard s6ems appropriate.
ySimilar studies could be conducted on a wide range of instructiephal
,.
programs for a wide variety,of outcomes., The results could lead to:usable and meaningful-guidelines for setting cutting cores to optimizea number of instructional outcomeb: Because the results may not be gen- '',
I e ,t-era li zable ',,ac ro s s content areas and instructional programs, such an op-
i.timization strategy would'require coatly,and extensiveresearch. Thisempitical verification of a decisiontaking strategy for finding optimalMixes of cogniti'Vend affective- Outcomes does not. mathematically model'any of the problefils'outlined in the preVioUs section of this paper.. Atrul complete scoring and decisionmaking,CRT model would. take'Into ac-coun both tithe, psychological variables that characterize,optimum learn-,t
,/` - .nd the constraints imposed by test length, cutting scores, andmisclassifiCation rates.
1.
u.
Crehan
ee
A method used;by,Crehan (1974) also.relies,heavily on a trainingcontextfor'its interpretatio . The method's rationale for specifyingcu't'ting scores is based upon he compariSon of the test gcores of stu,-.dents who have completed tral-ing with the, test scores of'thoseWhOhavenot ,yet received training. This method provides a means of assesting
1the proportion of misclassified"students'within each group when vavOus.
'cutting Scores are used.
Correct classification occurs when' posttraining students pass thetest and:Students with no training fail the test. Us.013 a 2'x 2 310triXof pass-fail and training=no training for-each cutting score, the.,;,pro-'portion of correct-classifications P can'be obtained as follows:
c
= [number who had training and passed +"number who had no train-ing and failed] ÷, sum ofall four entries in the matrix,
7
A cutting score is found by choosing the score that maximizes the ro-Portion of correctclatifications; v.
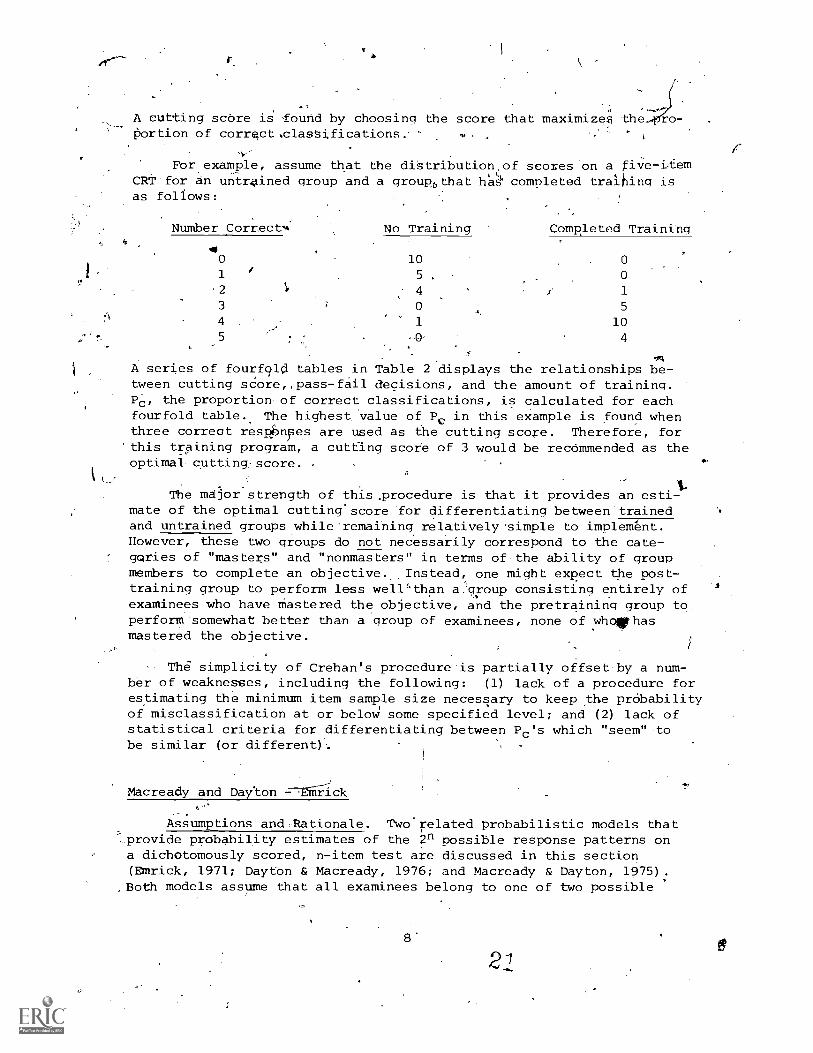
For example, assume that the diStribution,of scores on aCRT for an untrained group and a group5that ha'Sk completed traias follows:
Number Corrects
ive-Lfeminq is
No Training Completed Training
0
1
'2
3
4
5
1
10
5 ,
4
0
1
-0,
0
0
1
5
10
4
A series of fourfold tables in Table 2 displays the relationships be-tween cutting sCore,,pass-fail decisions, and the amount of training.PC, the proportion of correct classifications, is calculated for eachfourfold table. The highest, 'value of Pc in this example is found whenthree correct resp:bnfes are used as the cutting score. Therefore, forthis training program, a cutting score of 3 would be recommended as theoptimal cutting: score. .
The major strength of this.procedure is that it provides an esti-mate of the optimal cutting'score for differentiating between trainedand untrained groups while-remaining relatively 'simple to implement.However, these two groups do not necessarily correspond to the cate-gories of "masters" and "nonmasters" in terms of the ability of groupmembers to complete an objective. Instead, one might expect the post7training group to perform less well4than a.'group consisting entirely ofexaminees who have mastered the objective, and the pretraininq group toperform somewhat better than a group of examinees, none of whpethasmastered the objective.
The simplicity of Crehan's procedureis partially offset by a num-ber of weaknesses, including the following: (1) lack of a procedure forestimating the minimum item sample size necessary to keep the probabilityof misclassification at or below some specified level; and (2) lack ofstatistical criteria for differentiating between Pc's which "seem" tobe similar (or different).
Macready and Dayton
Assumptions and-Rationale. Two related probabilistic models thatprovide probability estimates of the 2n possible response patterns ona dichotomously scored, n-item test are discussed in this section(Einrick, 1971; Dayton & Macready, 1976; and Macready & Dayton, 1975):
,Both models assume that all examinees belong to one of two possible
8
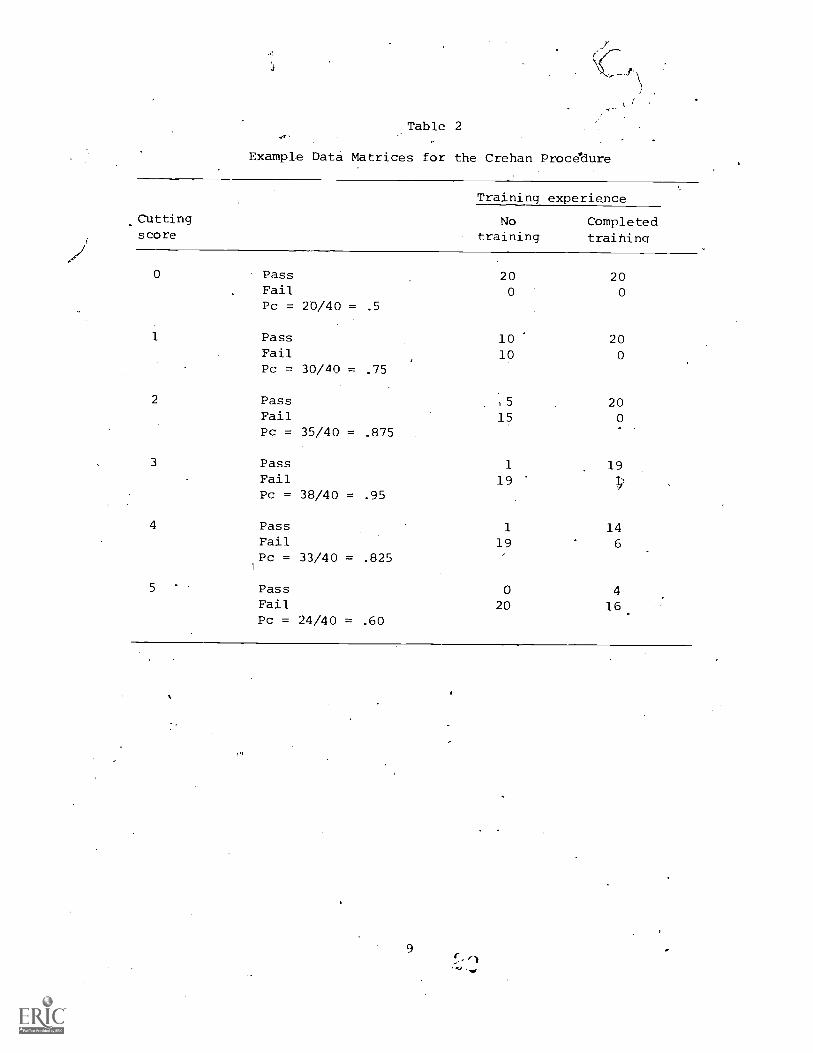
Table 2
Example Data Matrices for the Crehan Procedure
Training experience
Cutting No Completedscore training traihing
0
1
2
3
4
5
PassFailPc = 20/40 = .5
PassFail
Pc = 30/40 = .75
200
10
10
20
0
20
0
Pass 15 20Fail 15 0Pc = 35/40 = .875
Pass 1
Fail 19Pc = 38/40 = .95
19
Pass 1 14Fail 19 6
Pc = 33/40 = .825
Pass 0 4
Fail 20 16Pc = 24/40 = .60
9
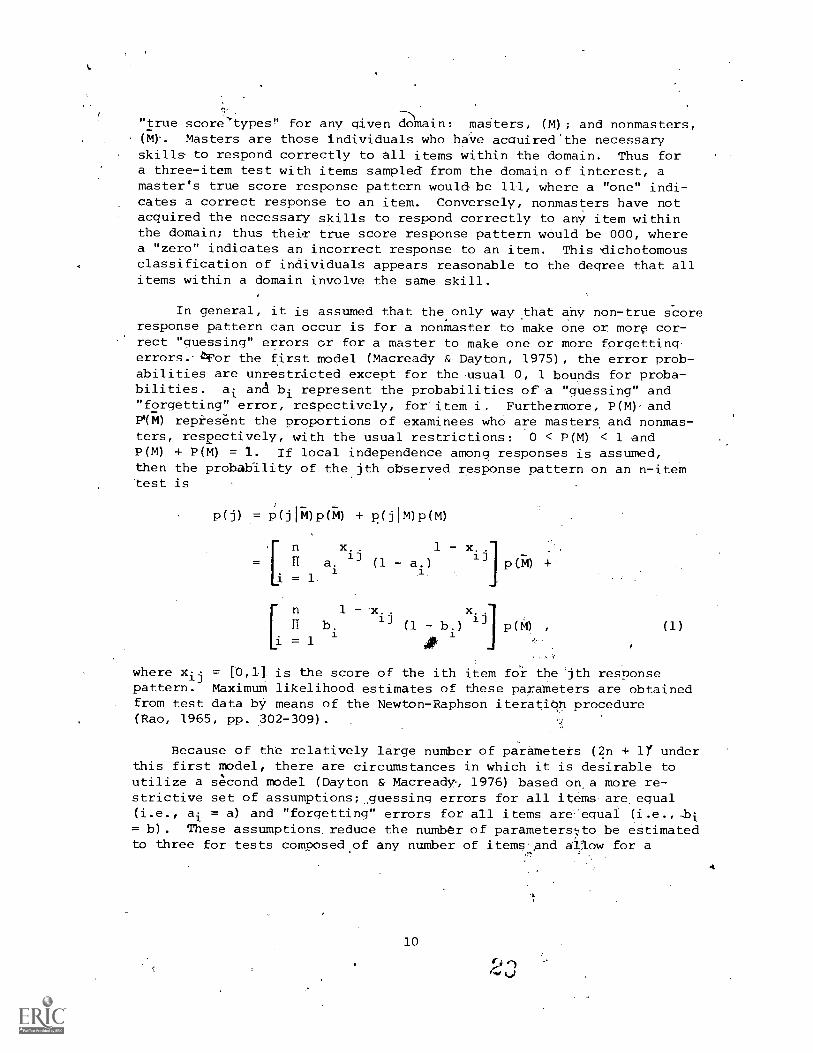
-1"true score'types" for any given domain: masters, (M); and nonmasters,(m)-. Masters are those individuals who have acauired'the necessaryskills to respond correctly to all items within the domain. Thus fora three-item test with items sampled from the domain of interest, amaster's true score response pattern would be 111, where a "one" indi-cates a correct response to an item. Conversely, nonmasters have notacquired the necessary skills to respond correctly to any item withinthe domain; thus their true score response pattern would be 000, wherea "zero" indicates an incorrect response to an item. This 'dichotomousclassification of individuals appears reasonable to the degree that allitems within a domain involve the same skill.
In general, it is assumed that the only way that any non-true scoreresponse pattern can occur is for a nonmaster to make one or more cor-rect "guessing" errors or for a master to make one or more forgettingerrors.-teor the first model (Macready & Dayton, 1975), the error prob-abilities are unrestricted except for the usual 0, 1 bounds for proba-bilities. ai an bi represent the probabilities of "guessing" and"forgetting" error, respectively, for'item i. Furthermore, P(M). andpqm) represent the proportions of examinees who are masters and nonmas-ters, respectively, with the usual restrictions: 0 < P(M) < 1 andP(M) + P(M) = 1. If local independence among responses is assumed,then the probability of the jth observed response pattern on an n-itemtest is
P(j) = p(i 111)P(71) + P(JIM)P(M)
n x, 1 x.
1] 13a. (1 a.) p(M)
[i =
1 - -x.. x..
IIij
b. (1ij
b.) P(M) (1)
where x..ij = 10,11: is the score of the ith item fol. the jth responsepattern. Maximum likelihood estimates of these parameters are obtainedfrom test data by means of the Newton-Raphson iteration procedure(Rao, 1965, pp. 302-309).
Because of the relatively large number of parameters (2n + 1)' underthis first model, there are circumstances in which it is desirable toutilize a second model (Dayton & Macready, 1976) based on a more re-strictive set of assumptions; guessing errors for all items are equal(i.e., ai = a) and "forgetting" errors for all items areYequal (i.e.,..bi= b). These assumptions. reduce the number of parametersvto be estimatedto three for tests composed of any number of items and allow for a
10
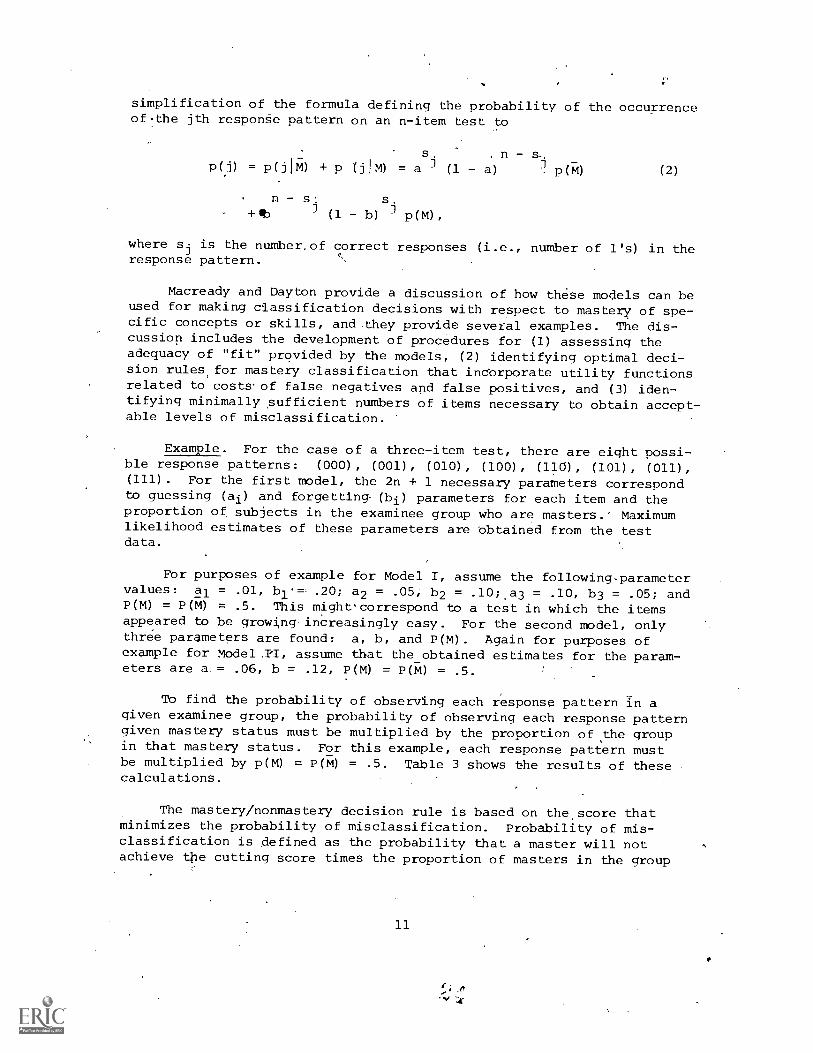
simplification of the formula defining the probability of the occurrenceofthe jth responSe pattern on an n-item test to
s , . np()) = p(jIM) + p 01M) = a 3 (1 a) p(M)
n - s4
+ lb (1 - b) p(M),
(2)
where sj is the number,of correct responses (i.e., number of l's) in theresponse pattern.
Macready and Dayton provide a discussion of how these models can beused for making classification decisions with respect to mastery of spe-cific concepts or skills, and .they provide several examples. The dis-cussion includes the development of procedures for (1) assessing theadequacy of "fit" provided by the models, (2) identifying optimal deci-sion rules for mastery classification that incorporate utility functionsrelated to costs' of false negatives and false positives, and (3) iden-tifying minimally sufficient numbers of items necessary to obtain accept-able levels of misclassification.
Example. For the case of a three-item test, there are eight possi-ble response patterns: (000), (001), (010), (100), (110), (101), (011),(111). For the first model, the 2n + 1 necessary parameters correspondto guessing (ai) and forgetting. (bi) parameters for each item and theproportion of subjects in the examinee group who are masters.- Maximumlikelihood estimates of these parameters are 'obtained from the testdata.
For purposes of example for Model I, assume the following parametervalues: al = .01, bl'=- .20; a2 = .05; b2 = .10;,a3 = .10, b3 = .05; andP(M) = P(M) = .5. This might correspond to a test in which the itemsappeared to be growing,increasingly easy. For the second model, onlythree parameters are found: a, b, and P(M). Again for purposes ofexample for Model .II, assume that the_obtained estimates for the param-eters are a = .06, b = .12, P(M) = P(M) = .5.
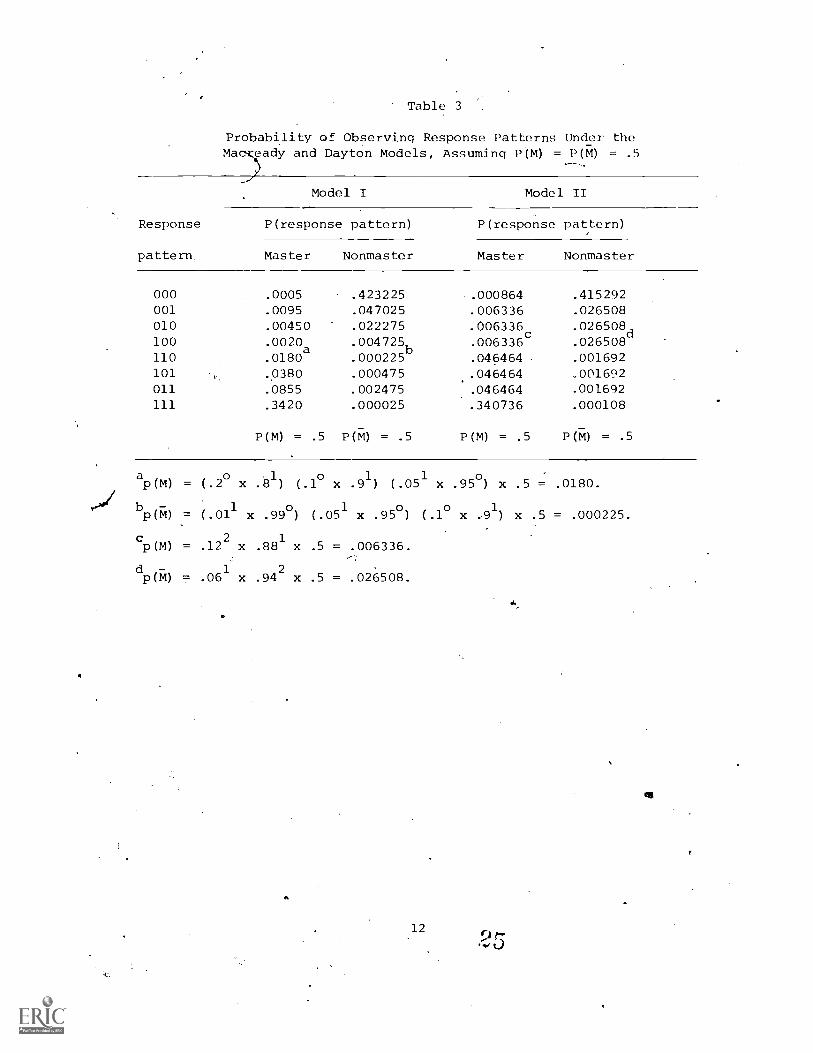
To find the probability of observing each response pattern in agiven examinee group, the probability of observing each response patterngiven mastery status must be multiplied by the proportion of the groupin that mastery status. For this example, each response pattern mustbe multiplied by p(M) = P(M) = .5. Table 3 shows the results of thesecalculations.
The mastery/nonmastery decision rule is based on the score thatminimizes the probability of misclassification. Probability of mis-classification is defined as the probability that a master will notachieve the cutting score times the proportion of masters in the group
11
red
Table 3
Probability of Observing Response Patterns Under theMac-Keady and Dayton Models, Assuming P(M) = P(M) = .5
Model I Model II
Response
pattern
P(response pattern) P(response pattern)
Master Nonmaster Master Nonmaster
000 .0005 .423225 .000864 .415292001 .0095 .047025 .006336 .026508010 .00450 .022275 .006336c .026508d100 .0020a .004725 .006336 .026508110 .0180 .000225
b.04 pil 64 .001692
101 .0380 .000475 .046464 .001692011 .0855 .002475 .046464 .001692
111 .3420 .000025 .340736 .000108
P(M) = .5 P(M) = .5 P(M) = .5 P(M) = .5
ap (M) =
bP(M) =
cp(M)=
dp(M) =
(.2o x
( .011
.122 x
.061 x
1.81) (.1
0x .91) (.05
x .99o) (.051 x .95°) (
.881 x .5 = .006336.
.942 x .5 = .026508.
x
.10
.95°) x
x .91)
.5
x
=
.5
.0180.
= .000225.
12
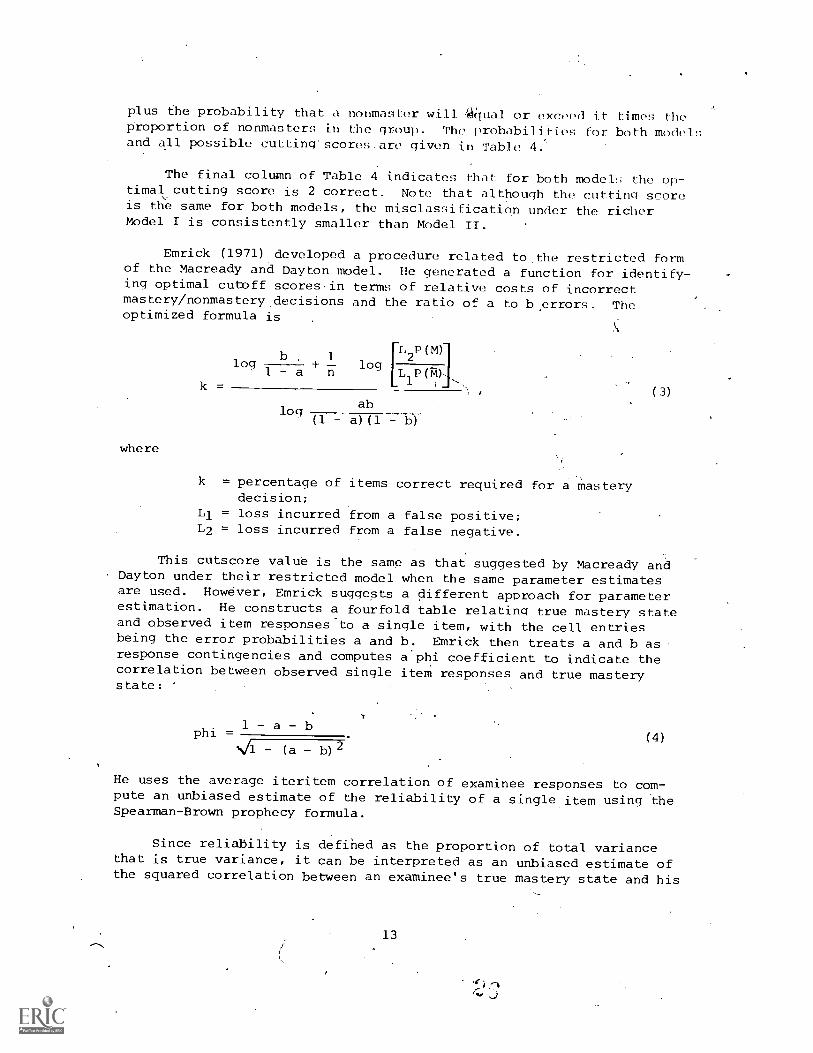
plus the probability that a nonmaster will *ual or exceed it times theproportion of nonmasters in the group. The probabil i ties for both modelsand all possible cutting'scores.are given in Table 4:.
The final column of Table 4 indicates that for both model the op-timal cutting score is 2 correct. Note that although the cutting scoreis the same for both models, the misclassification under the richerModel I is consistently smaller than Model II.
Emrick (1971) developed a procedure related to ,the restricted formof the Macready and Dayton model. He generated a function for identify-ing optimal cutoff scoresin terms of relative costs of incorrectmastery/nonmastery decisions and the ratio of a to b,errors. Theoptimized formula is
where
k
b 1log
1 - a+
n
(M)
Llog
174)]1P(
,
log(1 a) (1 b)
ab
k = percentage of items correct required for a masterydecision;
L1 = loss incurred from a false positive;L2 = loss incurred from a false negative.
(3)
This cutscore value is the same as that suggested by Macready andDayton under their restricted model when the same parameter estimatesare used. However, Emrick suggests a different approach for parameterestimation. He constructs a fourfold table relating true mastery stateand observed item responses to a single item, with the cell entriesbeing the error probabilities a and b. Emrick then treats a and b asresponse contingencies and computes a phi coefficient to indicate thecorrelation between observed single item responses and true masterystate:
1 a - bphi =
(a b) 2
(4)
He uses the average iteritem correlation of examinee responses to com-pute an unbiased estimate of the reliability of a single item using theSpearman-Brown prophecy formula.
Since reliability is defined as the proportion of total variancethat is true variance, it can be interpreted as an unbiased estimate ofthe squared correlation between an examinee's true mastery state and his
13

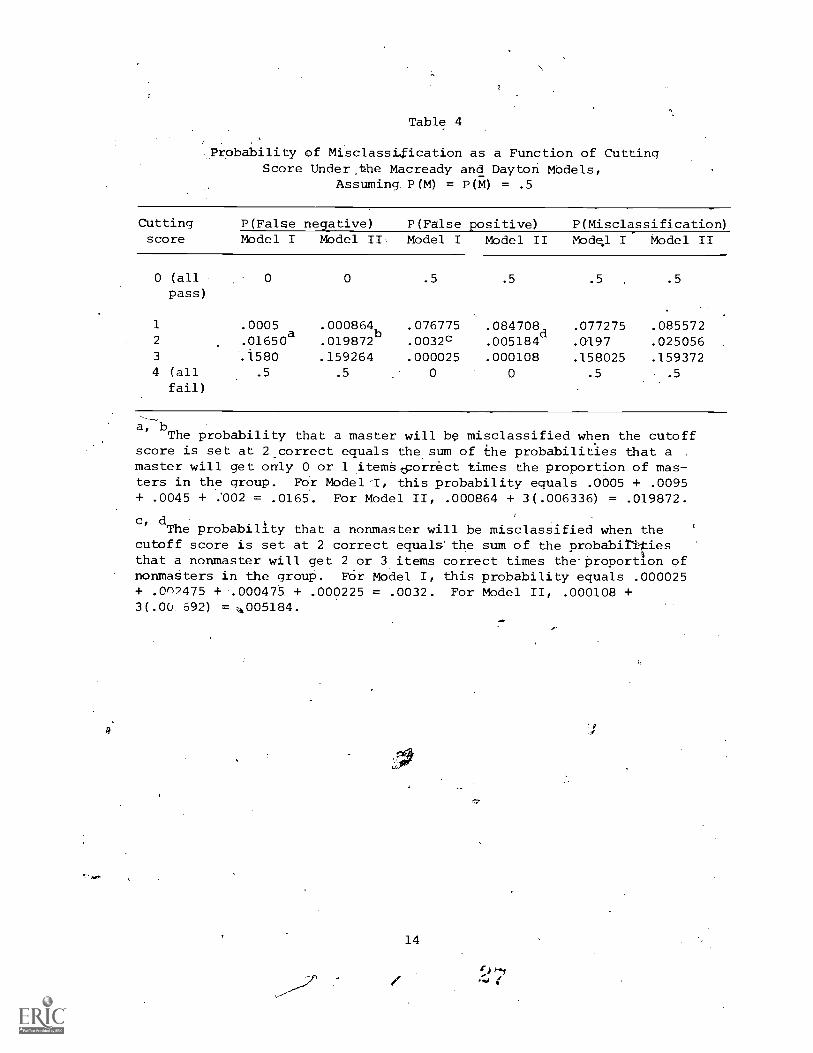
Table 4
Probability of Misclassi,fication as a Function of CuttingScore Under the Macready and Dayton MOdels,
Assuming. P(M) = P(M) = .5
Cutting P(False negative) P(False positive) P(Misclassification)score Model I Model II Model I Model II Mode). I Model II
0 (all 0 0 .5 .5 .5 .5
pass)
1 .0005 .000864 .076775 .084708d
.077275 .0855722 .01650
a.019872
b.0032c .005184 .4197 .025056
3 .1580 .159264 .000025 .000108 .158025 .1593724 (all .5 .5 0 0 .5 .5
fail)
a, bThe probability that a master will 139 misclassified when the cutoff
score is set at 2 correct equals the sum of the probabilities that a .
master will get only 0 or 1 itemporrect times the proportion of mas-ters in the group. Fbr Model this probability equals .0005 + .0095+ .0045 + :002 = .0165. For Model II, .000864 + 3(.006336) = .019872.
c, dThe probability that a nonmaster will be misclasSified when the
cutoff score is set at 2 correct equals' the sum of the probabilitiesthat a nonmaster will get 2 or 3 items correct times the-proportion ofnonmasters in the group. For Model I, this probability equals .000025+ .0n2475 + .000475 + .000225 = .0032. For Model II, .000108 +3(.0o 092) = ,,005184.
14
4
or her item response. Hence, item responses, true mastery state, anderror probabilities can be directly related through the test reliabil-ity. If the ratio of a to b is known (or if it can be estimated),values for a and b can be directly calculated.
For the Macready-Dayton model example values (a = .06, b = .12),the value of phi is .821. Squaring thi)value and applying the Spearman-Brown prophecy formula for a three-item'test indicates that the test re-liability for this example would be .86. Assuming a loss ratio of 1 andequal proportions of masters and nonmasters, the value for k in Emrick'soptimization formula 'is .4339. This implies a cutting score of 1.3ona three-item test, or rounding up to the next higher integer, 2. Thus,the final result is the same as the result obtained with Macready andDayton.
Evaluation. An important constraint of this approach is that theproportion of masters and nonmasters must be equal. (The computationsfor the preceding example and a more general forth of the Emrick modelare presented in Appendix A.)
Other possible weaknesses in Emrick's approach to parameter esti-mation are the subjec'ivity required and the somewhat overly restric-tive assumptions necessary to implement his approach. In addition, thecomplexity of both conceptualizing and quantifying L1 and L2 may greatlycomplicate "tlite derivation of cutoff scores under these models.'
If the assumptions are met, an optimal differentiation betweenmasters and nonmasters will result. Furthermore, a means is providedto determine how many items are needed to keep the probability of mis-classification at or below some specified critical level. The relation-ships among test items may also be explored. A major potential weaknessconcerns the assumption that learning occurs in an "all-or-none" manner,with no partial learning or overlearning. Failure to satisfy this as-sumption could produce a poor fit of data to the model, which will inturn,produce a far less than optimal cutting score.
Binomial Model
Assumptions and Rationale. In contrast to t1}e all-or-none learn-ing assumption of the Emrick and Macready models is the assumption that11earning is a continuous process. -A binomial distribution model, firstsuggested and derived by Kriewall (1969) and subsequently developed by-Millman (1972),' defines proficiency as, the probability that a personwill correctly respond to any test item randomly chosen from a speci-fied domain of items. Proficieppy may also be defined as the propor-tion of items that would be correct if all items in the domain couldbe adMinistered. Since the proficiency value can take on values fromzero to one, the model allows for partial acquisition.
15
The following assumptions are pertinent: (1) dichotomously scorableitems, (2) local independence of items, (3) no systematic learnAg orforgetting during test taking, and (4) items equally difficult for anygiven examinee. The percentage of items answered correctly is taken asa point estimate of the examinee's true proficiency. For ,a'siven,pro-ficiency, the probability oP observing any score may be determined. Thehypothesis to be tested in this model involves the likelihood of,,a speci-fic score, if indeed the examinee had the given level of`proficiency.
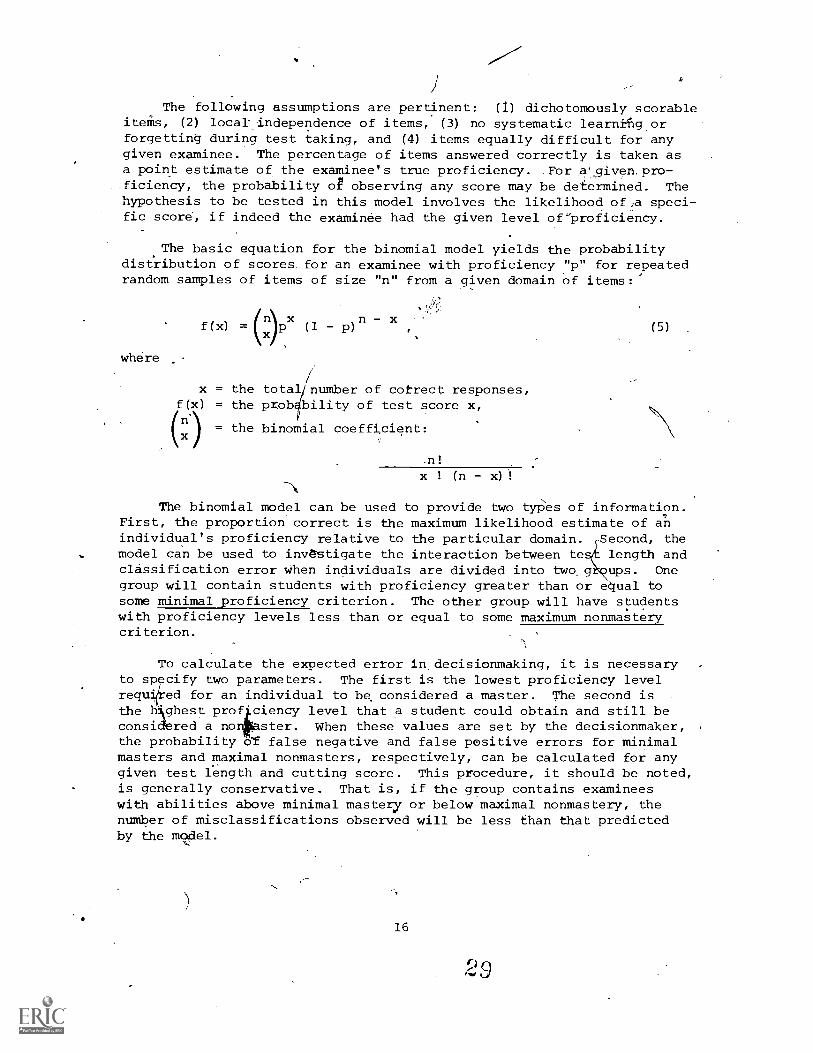
The basic equation for the binomial model yields the probabilitydistribution of scores. for an examinee with proficiency "p" for repeatedrandom samples of items of size "n" from a given domain of items:
where
f(x)(nyx n xx
x = the total /number of cotrect responses,f(x) = the probability of test score x,(n)
= the binomial coefficient:
.n !
(5)
The binomial model can be used to provide two types of information.First, the proportion correct is the maximum likelihood estimate of anindividual's proficiency relative to the particular domain. Second, themodel can be used to invtstigate the interaction between to length andclassification error when individuals are divided into two. g ups. Onegroup will contain students with proficiency greater than or e ual tosome minimal proficiency criterion. The other group will have studentswith proficiency levels less than or equal to some maximum nonmasterycriterion.
To calculate the expected error in decisionmaking, it is necessaryto specify two parameters. The first is the lowest proficiency levelrequired for an individual to be considered a master. The second is
4the highest proficiency level that a student could obtain and still beconsidered a no16 ster. When these values are set by the decisionmaker,the probability b'f false negative and false positive errors for minimalmasters and maximal nonmasters, respectively, can be calculated for anygiven test length and cutting score. This procedure, it should be noted,is generally conservative. That is, if the group contains examineeswith abilities above minimal mastery or below maximal nonmastery, thenumber of misclassifications observed will be less than that predictedby the model.
16
ft/ 9
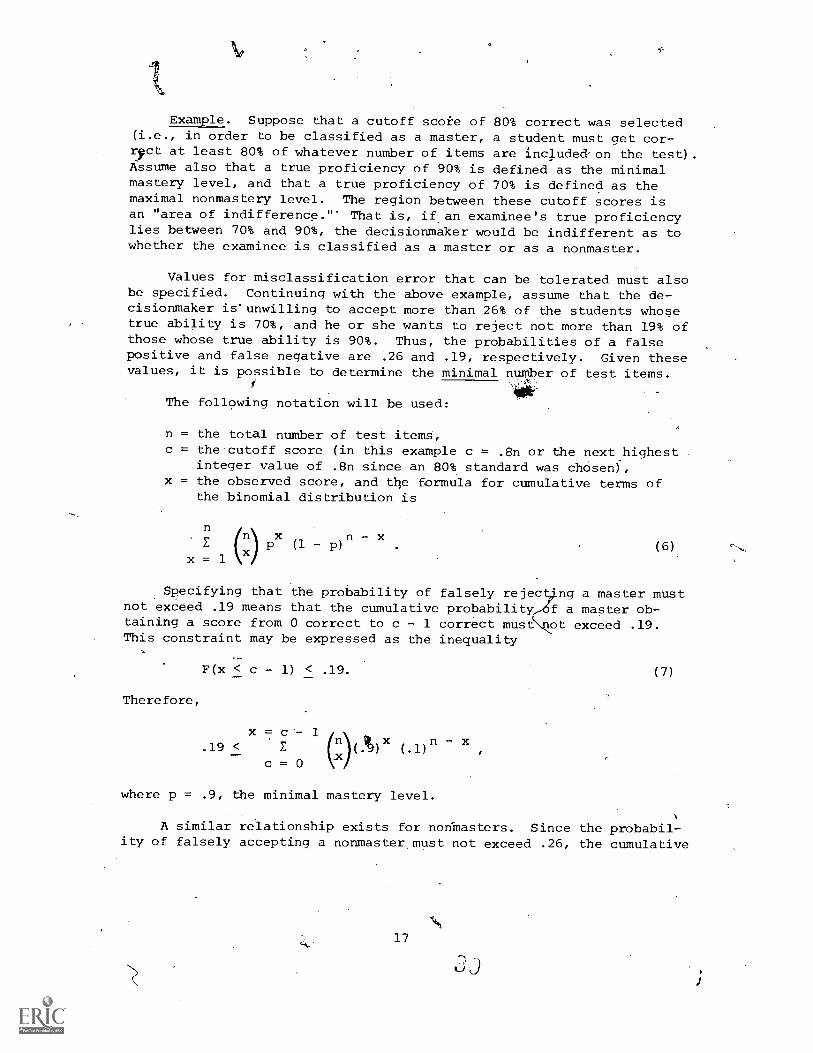
Example. Suppose that a cutoff score of 80% correct was selected(i.e., in order to be classified as a master, a student must get cor-ryct at least 80% of whatever number of items are included-on the test).Assume also that a true proficiency of 90% is defined as the minimalmastery level, and that a true proficiency of 70% is defined as themaximal nonmastery level. The region between these cutoff scores isan "area of indifference."' That is, if an examinee's true proficiencylies between 70% and 90%, the decisionmaker would be indifferent as towhether the examinee is classified as a master or as a nonmaster.
Values for misclassification error that can be tolerated must alsobe specified. Continuing with the above example, assume that the de-cisionmaker is'unwilling to accept more than 26% of the students whosetrue ability is 70%, and he or she wants to reject not more than 19% ofthose whose true ability is 90%. Thus, the probabilities of a falsepositive and false negative are .26 and .19, respectively. Given thesevalues, it is possible to determine the minimal number of test items.
The following notation will be used:
n = the total number of test items,c = the cutoff score (in this example c = .8n or the next highest
integer value of .8n since an 80% standard was chosen),x = the observed score, and the formula for cumulative terms of
the binomial distribution is
nn px n - x
x = 1(6)
Specifying that the probability of falsely rejec ng a master mustnot exceed .19 means that the cumulative probability f a master ob-taining a score from 0 correct to c - 1 correct must ot exceed .19.This constraint may be expressed as the inequality
Therefore,
F(x < c - 1) < .19. (7)
x = c 1
.19<(n
(.1)n - x
c = 0
where p = .9, the minimal mastery level.
A similar relationship exists for nonmastery. Since the probabil-ity of falsely accepting a nonmaster must not exceed .26, the cumulative
17
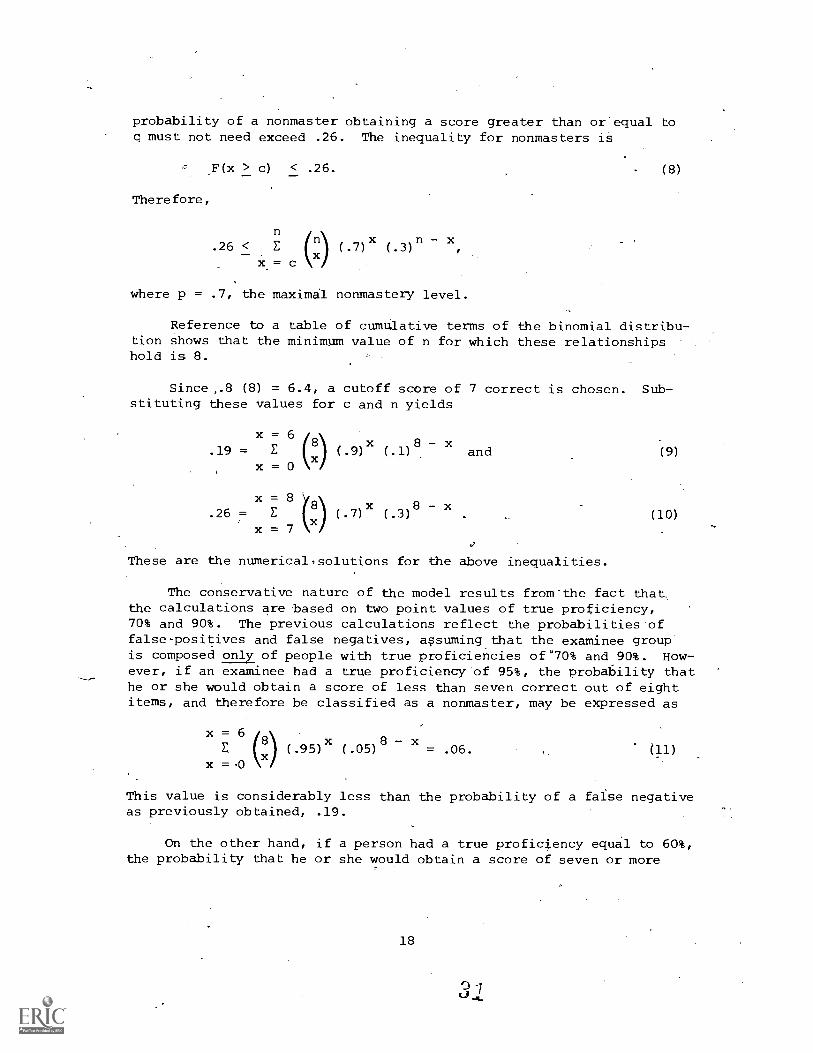
probability of a nonmaster obtaining a score greater than or equal toq must not need exceed .26. The inequality for nonmasters is
F(x > c) < .26.
Therefore,
.26 <(.7)x (.3)n - x
x = c
where p = .7, the maximal nonmastery level.
-(8)
Reference to a table of cumulative terms of the binomial distribu-tion shows that the minimum value of n for which these relationshipshold is 8.
Since,.8 (8) = 6.4, a cutoff score of 7 correct is chosen. Sub-stituting these values for c and n yields
x = 68 8 - x
.19 = E (.9)x (.1) and (9)
x = 0
x = 88
.26 = E (.7)x (.3)8 - x
(10)
x = 7
These are the numerical,solutions for the above inequalities.
The conservative nature of the model results from-the fact that,the calculations are based on two point values of true proficiency,70% and 90%. The previous calculations reflect the probabilities offalse-positives and false negatives, assuming that the examinee groupis composed only of people with true proficiencies of°70% and 90%. How-ever, if an examinee had a true proficiency of 95%, the probability thathe or she would obtain a score of less than seven correct out of eightitems, and therefore be classified as a nonmaster, may be expressed as
x = 6E (.95)x (.05)
8 - x= .06.
x =0
This value is considerably less than the probability of a false negativeas previously obtained, .19.
On the other hand, if a person had a true proficiency equal to 60%,the probability that he or she would obtain a score of seven or more
18
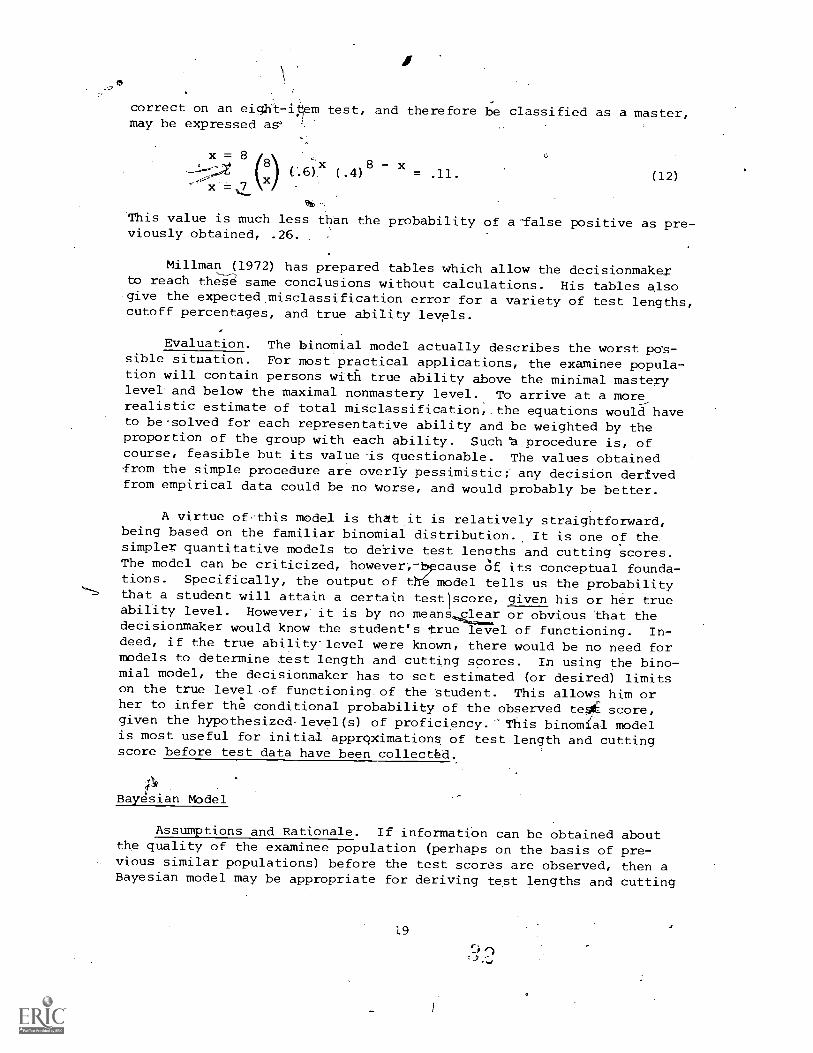
correct on an eight-i*m test, and therefore be classified as a master,may be expressed as-
x = 8-2---;; (8) (".6)X (.4)8 x = . 11.
x (12)
This value is much less than the probability of a-false positive as pre-viously obtained, .26.
Millman (1972) has prepared tables which allow the decisionmakexto reach these same conclusions without calculations. His tables alsogive the expected misclassification error for a variety of test lengths,cutoff percentages, and true ability lev,els.
Evaluation. The binomial model actually describes the worst pos-sible situation. For most practical applications, the examinee popula-tion will contain persons with true ability above the minimal masterylevel and below the maximal nonmastery level. To arrive at a morerealistic estimate of total misclassification, the equations would haveto be solved for each representative ability and be weighted by theproportion of the group with each ability. Such 'a procedure is, ofcourse, feasible but its value is questionable. The values obtainedfrom the simple procedure are overly pessimistic; any decision derivedfrom empirical data could be no worse, and would probably be better.
A virtue of, this model is that it is relatively straightforward,being based on the familiar binomial distribution. It is one of thesimpler quantitative models to deXive test lengths and cutting scores.The model can be criticized, however-i--bpcause of its conceptual founda-tions. Specifically, the output of the model tells us the probabilitythat a student will attain a certain test score, given his or her trueability level. However, it is by no means,clear or obvious that thedecisionmaker would know the student's true level of functioning. In-deed, if the true ability-level were known, there would be no need formodels to determine test length and cutting scores. In using the bino-mial model, the decisionmaker has to set estimated (or desired) limitson the true level of functioning of the student. This allows him orher to infer the conditional probability of the observed tee score,given the hypothesizedlevel(s) of proficiency. This binomial modelis most useful for initial apprqximations of test length and cuttingscore before test data have been collectbd.,
1-* .
Bayesian Model
Assumptions and Rationale. If information can be obtained aboutthe quality of the examinee population (perhaps on the basis of pre-vious similar populations) before the test scores are observed, then aBayesian model may be appropriate for deriving test lengths and cutting
19
--
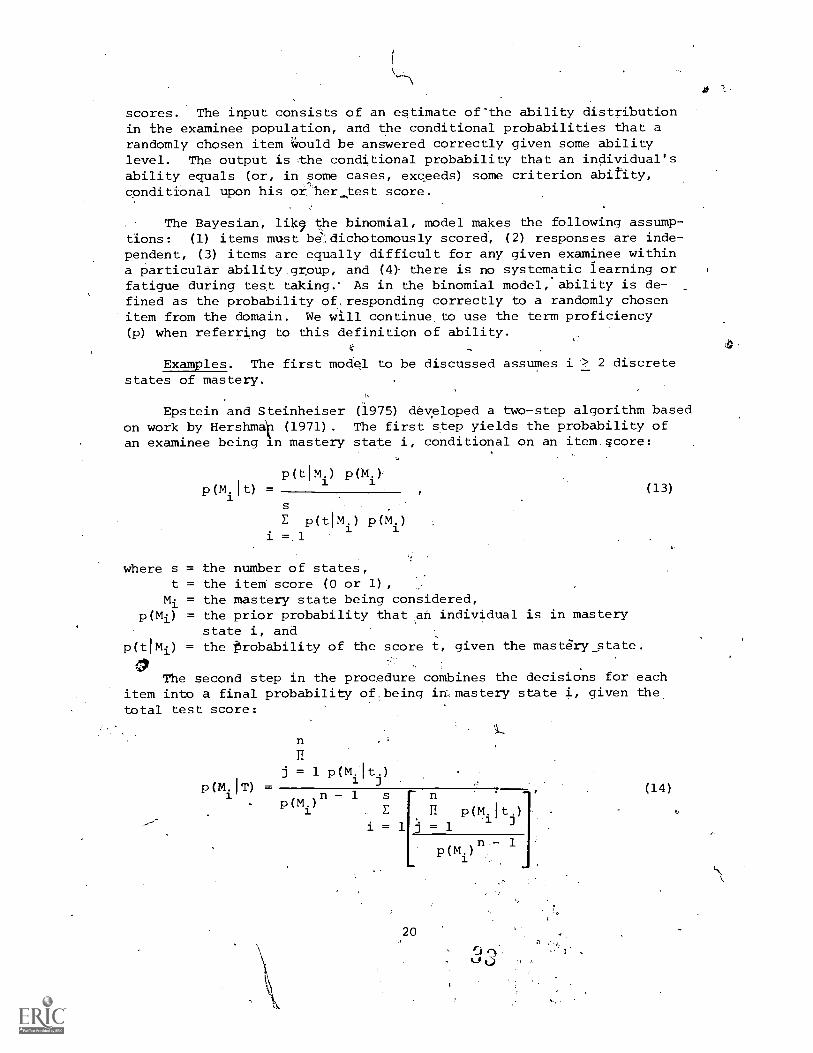
scores. The input consists of an estimate of-the ability distributionin the examinee population, and the conditional probabilities that arandomly chosen item ;could be answered correctly given some abilitylevel. The output is the conditional probability that an individual'sability equals (or, in some cases, exceeds) some criterion ability,conditiOnal upon his or-her_test score.
The Bayesian, like the binomial, model makes the following assump-tions: (1) items must bedichotomously scored, (2) responses are inde-pendent, (3) items are equally difficult for any given examinee withina particular ability.group, and (4) there is no systematic learning orfatigue during test taking.' As in the binomial model, ability is de-fined as the probability of,Tesponding correctly to a randomly chosenitem from the domain. We will continue, to use the term proficiency(p) when referring to this definition of ability.
Examples. The first model to be discussed assumes i > 2 discretestates of mastery.
Epstein and Steinheiser (1975) developed a two-step algorithm basedon work by Hershma1 (1971). The first step yields the probability ofan examinee being in mastery state i, conditional on an item.score:
p(th,C) p(Mi)-
P(Milt) =
E P(tImi) P(Mi)i =,1
where s = the number of states,t = the item score (0 or 1),
Mi = the mastery state being considered,p(Mi) = the prior probability that an individual is in mastery
state i, andp(tIMi) = the probability of the score t, given the mastery state.
(13)
The second step in the procedure combines the decisions for eachitem into a final probability of,being in: mastery state i, given the,total test score:
n
j = 1 p(M.It.)p(MilT)
n - 1p(M.)
i=lj= 1P(M. I t.)
s n
3
20
- 1P(M.)
n
i
0IL)
(14)
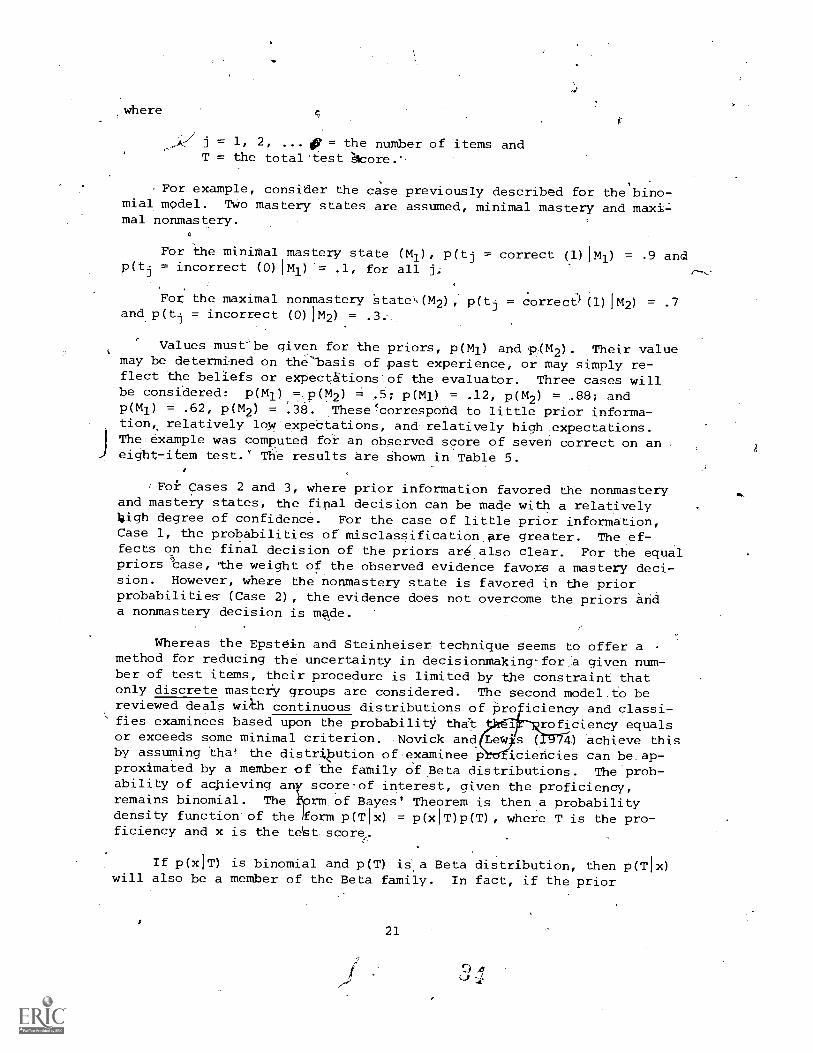
where
j = 1, 2, ... 9 = the number of items andT = the total 'test 4core.',
For example, consider the case previously described for the bino-mial model. Two mastery states are assumed, minimal mastery and maxi=mal nonmastery.
a
For the minimal mastery state (141), p(tj = correct (1)1141) = .9 andp(tj = incorrect (0)1141) = .1, for all j;
,
. ,
For the maximal nonmastery State'(M2), p(tj = correct(1)1M2) = .7and p(tj = incorrect (0) 1M2) = .3...
iValues must-be given for the priors, p(M1) and p(M.2). Their value
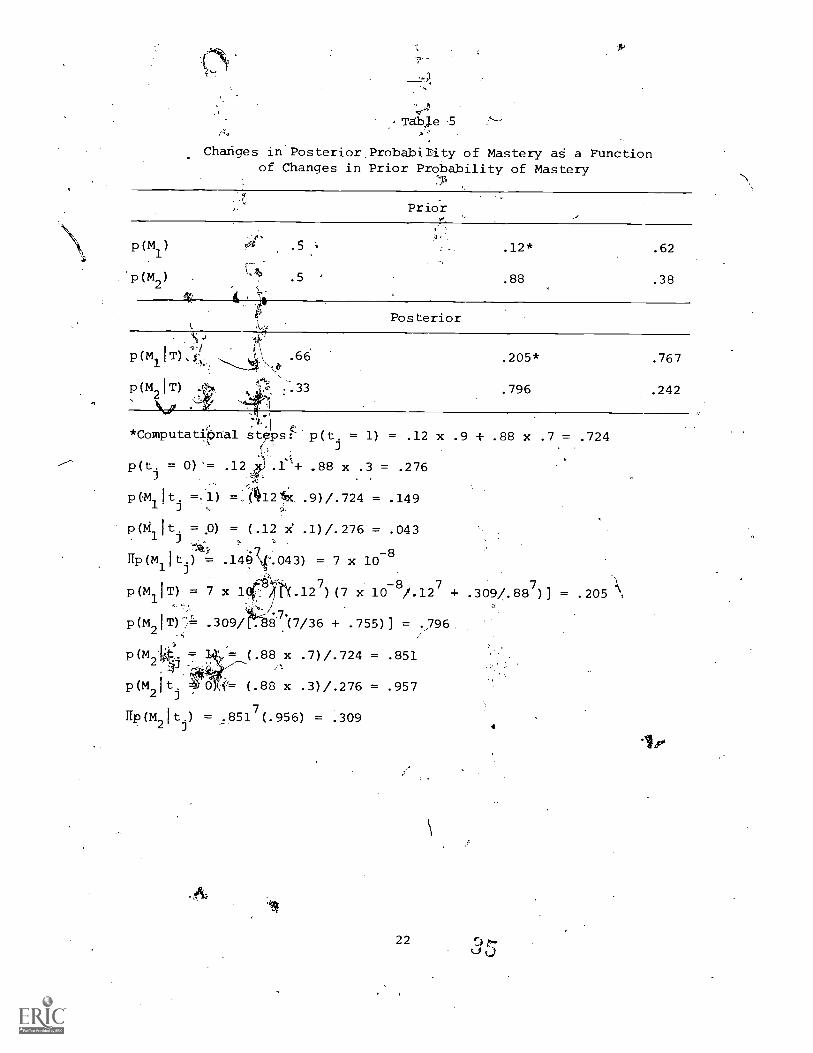
may be determined on the"basis of past experience, or may simply re-flect the beliefs or expectations'of the evaluator. Three cases willbe considered: p(M1) ---P(M2) = .5; p(Ml) = .12, p(M2) = ,88; andp(M1) = .62, p(M2) = .38. These`oorrespond to little prior informa-tion,, relatively low'expectations, and relatively high .expectations.
JThe example was computed for an observed score of seven correct on an .eight-item. test.' The results are shown in Table 5.
IFof Cases 2 and 3, where prior information favored the nonmasteryand mastery states, the final decision can be made with a relativelyhigh degree of confidence. For the case of little prior information,Case 1, the probabilities of misclassification.are greater. Theef-fects on the final decision of the priors aralso clear. For the equalpriors case,-the weight of the observed evidence favors a mastery deci-sion. However, where the nonmastery state is favored in the priorprobabilities (Case 2), the evidence does not overcome the priors anda nonmastery decision is made.
Whereas the Epstein and Steinheiser technique seems to offer amethod for reducing the uncertainty in decisionmakingfor,a given num-ber of test items, their procedure is limited by the constraint thatonly discrete mastery groups are considered. The second model.to bereviewed deals with continuous distributions of proficiency and classi-fies examinees based upon the probability that Air proficiency equalsor exceeds some minimal criterion. Novick and s ( 4) achieve thisby assuming tha.' the distribution of examinee PlOiriciencies can be.ap-proximated by a member of the family of Beta distributions. The'prob-ability of achieving an score-of interest, given the proficiency,remains binomial. The rm. of Bayes' Theorem is then a probabilitydensity function' of the orm p(Tlx) = p(x1T)p(T), where T is the pro-ficiency and x is the test. score.
If p(xIT) is binomial and p(T) is a Beta distribution, then p(Tlx)will also be a member of the Beta family. In fact, if the prior
21
\\\
Table -5
Chaliges in Posterior Probabinty of Mastery as a Functionof Changes in Prior Probability of Mastery
Prior
p(M1)
p(M2)
Af. .5
.5
.12*
.88
.62
.38
.k..' Posterior. kt-,
p(MIIT), ,,,,,,i,
P(M2IT) .07
.66
.--.33
.205*
.796
.767
.242.
*Computatihnal p = 1) = .12 x .9 + .88 x .7 = .724
p(t. = 0) .12 .1-'+ .88 x .3 = .276
13(14 It. =.1) =.(V121rx..9)/.724 = .1491 3 ,P(M1
It =.0) = (.12 x .1)/.276 = .0433
Ilp(M1
It.) -= .140\f.043) = 7 x 10⁻⁸
p(milT) = 7 x 1(0 141(.127) (7 x 10⁸/.127 + .309/.887)] = .205 k,
.7.P(1.421T)71= .309/ 8 (7/36 + .755)] = .296
p(M23...13
p (M2
I t
111?(M2Itj)
= (.88 x .7)/.724 = .851
f= (.88 x .3)/.276 = .957
= .8517(.956) = .309
22
,
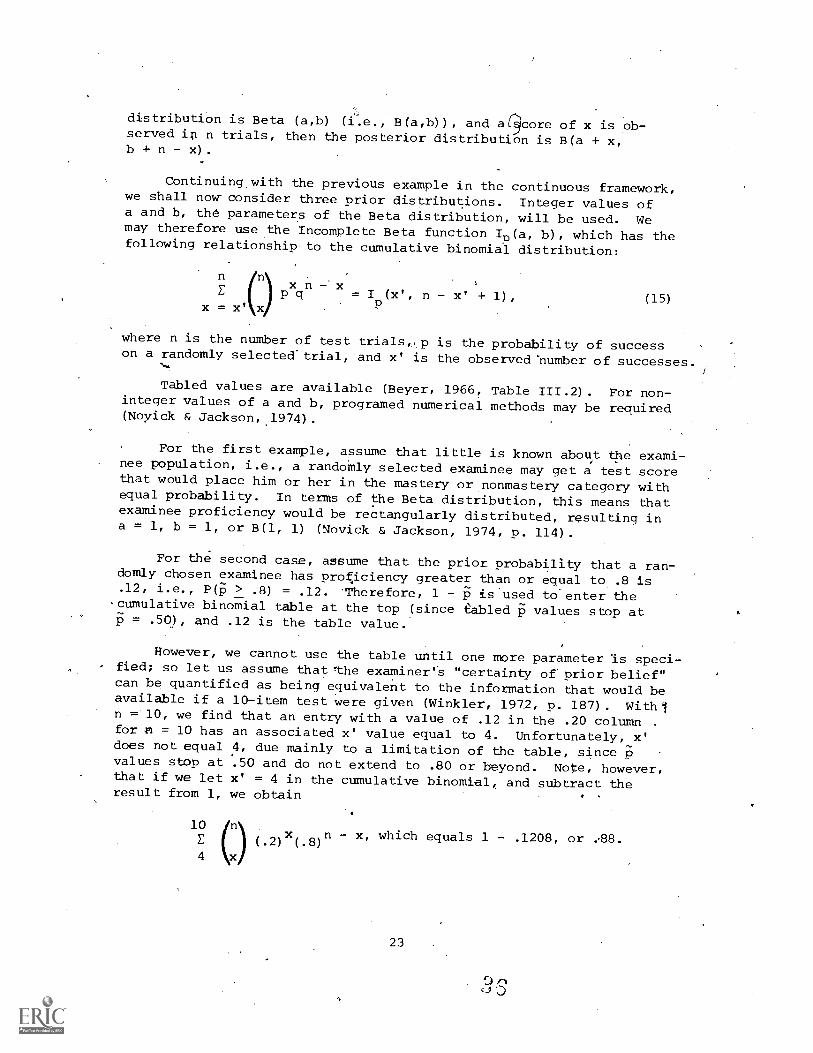
distribution is Beta (a,b) (i.e., B(a,b)), and a core of x is ob-served ii n trials, then the posterior distribution is B(a + x,b + n - x).
Continuing with the previous example in the continuous framework,we shall now consider three prior distributions. Integer values ofa and b, the parameters of the Beta distribution, will be used. Wemay therefore use the Incomplete Beta function 1p(a, b), which has thefollowing relationship to the cumulative binomial distribution:
n
P qx = x' x
(15)
where n is the number of test trials,. p is the probability of successon a randomly selected trial, and x' is the observed' number of successes.
Tabled values are available (Beyer, 1966, Table 111.2). For non-integer values of a and b, programed numerical methods may be required(Noyick &_Jackson,,1974).
For the first example, assume that little is known about the exami-nee population, i.e., a randoMly selected examinee may get a test scorethat would place him or her in the mastery or nonmastery category withequal probability. In terms of the Beta distribution, this means thatexaminee proficiency would be rectangularly distributed, resulting ina = 1, b = 1, or 13(1, 1) (Novick & Jackson, 1974, p. 114).
For the second case, assume that the prior, probability that a ran-domly chosen examinee has proficiency greater than or equal to .8 is.12, i.e., P(P > .8) = .12. 'Therefore, 1 p is.used to. enter the
'cumulative binomial table at the top (since tabled P values stop at-p = .50), and .12 is the table value.
However, we cannot use the table until one more parameter Is speci-- fied; so let us assume that 'the examiner's "certainty of prior belief"
can be quantified as being equivalent to the information that would beavailable if a 10-item test were given (Winkler, 1972, p. 187). Withln ='10, we find that an entry with a value of .12 in the .20 columnfor n = 10 has an associated x' value equal to 4. Unfortunately, x'does not equal 4, due mainly to a limitation of the table, since pvalues stop at .50 and do not extend to .80 or beyond. Note, however,that if we let x' = 4 in the cumulative binomial, and subtract theresult from 1, we obtain
10E ) (.2)
x(.8)
n - x, which equals - .1208, or :88.
4 x
23
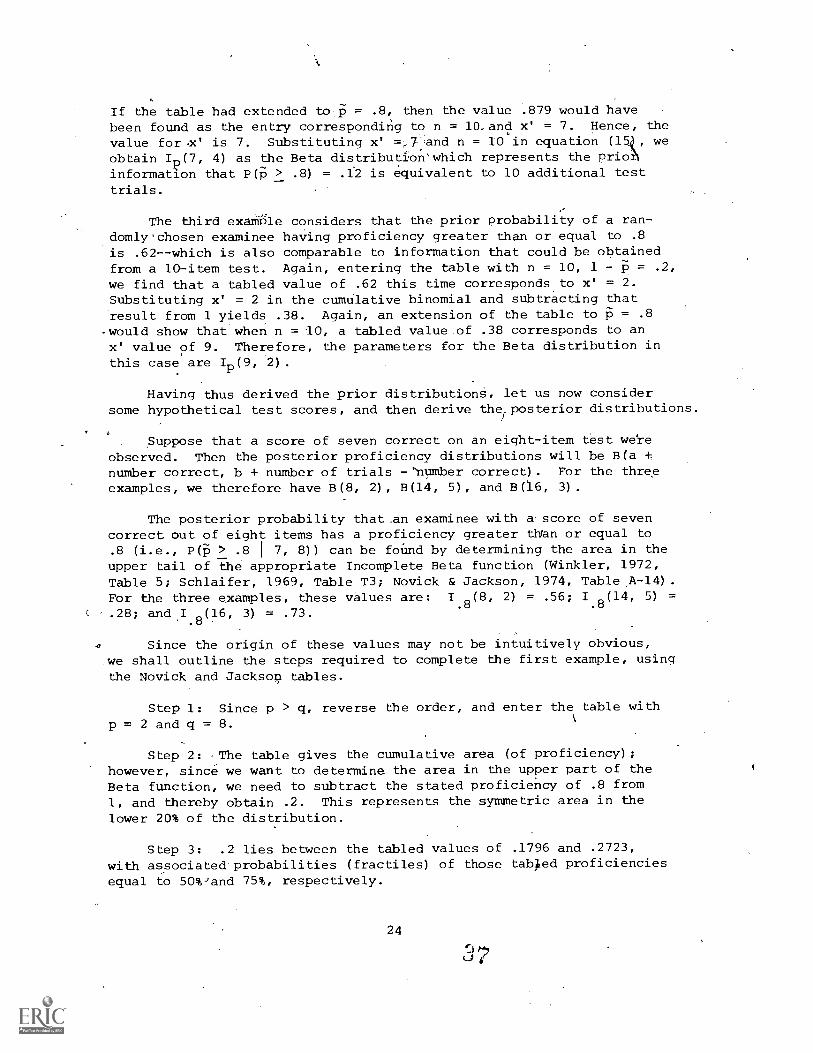
If the table had extended to -P = .8, then the value .879 would havebeen found as the entry correspondirig to n = 10.and x' = 7. Hence, the
value for .x' is 7. Substituting x' =,end n = 10 in equation (154, weobtain I (7, 4) as the Beta distribution which represents the prio?information that P(; > .8) = .12 is equivalent to 10 additional testtrials.
The third example considers that the prior probability of a ran-domly'chosen examinee having proficiency greater than or equal to .8is .62--which is also comparable to information that could be obtainedfrom a 10-item test. Again, entering the table with n = 10, 1 - p = .2,we find that a tabled value of .62 this time corresponds to x' = 2.Substituting x' = 2 in the cumulative binomial and subtracting thatresult from 1 yields .38. Again, an extension of the table to P = .8
-would show that when n = 10, a tabled value of .38 corresponds to anx' value of 9. Therefore, the parameters for the Beta distribution inthis case are I (9, 2).
Having thus derived the prior distributionS, let us now considersome hypothetical test scores, and then derive therposterior distributions.
Suppose that a score of seven correct on an eight-item test wereobserved. Then the posterior proficiency distributions will be B(a +number correct, b + number of trials - "number correct). For the threeexamples, we therefore have B(8, 2), B(14, 5), and B(I6, 3) .
The posterior probability that .an examinee with a score of sevencorrect out of eight items has a proficiency greater than or equal to.8 (i.e., P(17) > .8 1 7, 8)) can be folind by determining the area in theupper tail of the appropriate Incomplete Beta function (Winkler, 1972,Table 5; Schlaifer, 1969, Table T3; Novick & Jackson, 1974, Table A-14).For the three examples, these values are: 1.8(8, 2) = .56; 1.8(14, 5) =.28; and I
.8(16, 3) = .73.
Since the origin of these values may not be intuitively obvious,we shall outline the steps required to complete the first example, usingthe Novick and Jacksol? tables.
Step 1: Since p > q, reverse the order, and enter the table withp = 2 and q = 8.
Step 2: -The table gives the cumulative area (of proficiency);however, since we want to determine the area in the upper part of theBeta function, we need to subtract the stated proficiency of .8 from1, and thereby obtain .2. This represents the symmetric area in the
lower 20% of the distribution.
Step 3: .2 lies between the tabled values of .1796 and .2723,with associated probabilities (fractiles) of those tabled proficienciesequal to 50%Jand 75%, respectively.
24
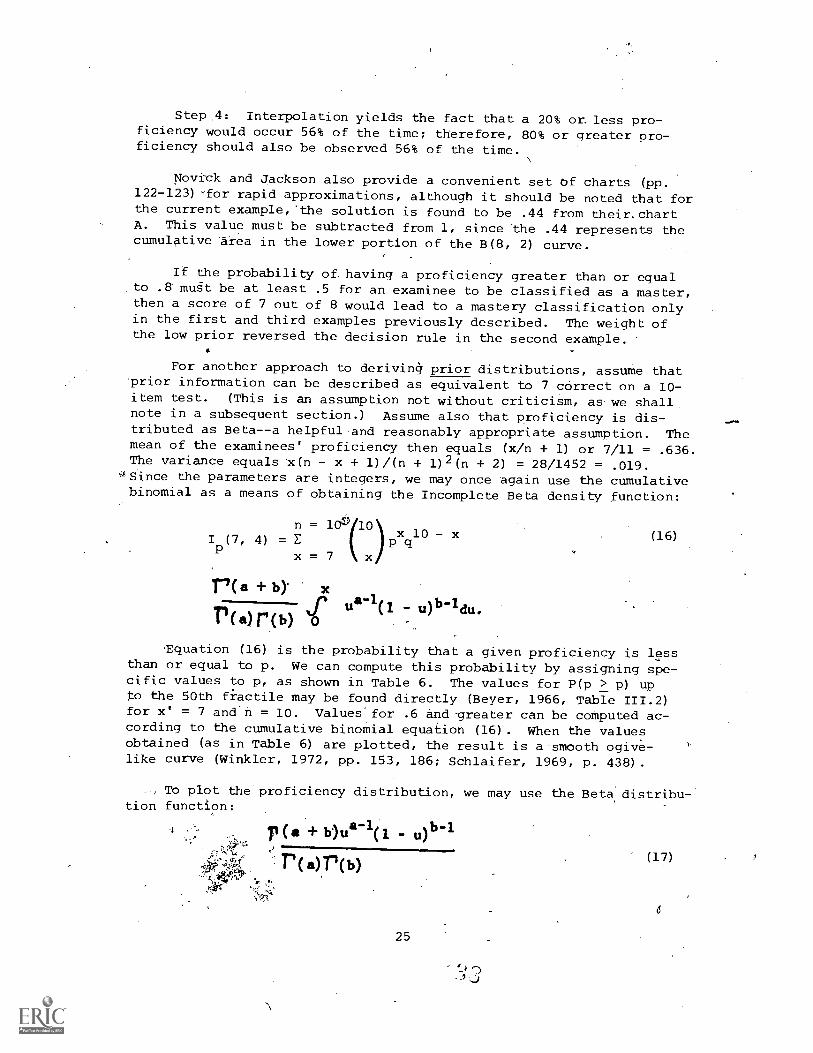
Step 4: Interpolation yields the fact that a 20% or. less pro-ficiency would occur 56% of the time; therefore, 80% or greater pro-ficiency should also be observed 56% of the time.
Novkck and Jackson also provide a convenient set of charts (pp.122-123) 'for rapid approximations, although it should be noted that forthe current example,'the solution is found to be .44 from their. chartA. This value must be subtracted from 1, since the .44 represents thecumulative area in the lower portion of the B(8, 2) curve.
If the probability of having a proficiency greater than or equalto .8 must be at least .5 for an examinee to be classified as a master,then a score of 7 out of 8 would lead to a mastery classification onlyin the first and third examples previously described. The weight ofthe low prior reversed the decision rule in the second example.
For another approach to deriving prior distributions, assume thatprior information can be described as equivalent to 7 correct on a 10-item test. (This is an assumption not without criticism, as we shallnote in a subsequent section.) Assume also that proficiency is dis-tributed as Beta--a helpful and reasonably appropriate assumption. Themean of the examinees' proficiency then equals (x/n + 1) or 7/11 = .636.The variance equals 'x (n - x + 1) /(n + 1)2(n + 2) = 28/1452 = .019.
'4Since the parameters are integers, we may once again use the cumulativebinomial as a means of obtaining the Incomplete Beta density function:
I (7, 4) == 10
Pxq10 - x (16)E
x = 7 x
Ina 4- b)4.6 ua-1(1 - u)b-Idu.r(a)r(b)
'Equation (16) is the probability that a given proficiency is lessthan or equal to p. We can compute this probability by assigning spe-cific values to p, as shown in Table 6. The values for P(p > p) upto the 50th fiactile may be found directly (Beyer, 1966, Table 111.2)for x' = 7 and n = 10.' Values for .6 and-greater can be computed ac-cording to the cumulative binomial equation (16). When the valuesobtained (as in Table 6) are plotted, the result is a-smooth ogive-like curve (Winkler, 1972, pp. 153, 186; Schleifer, 1969, p. 438).
To plot the proficiency distribution, we may use the Beta' distribu-tion function:
25
(17)
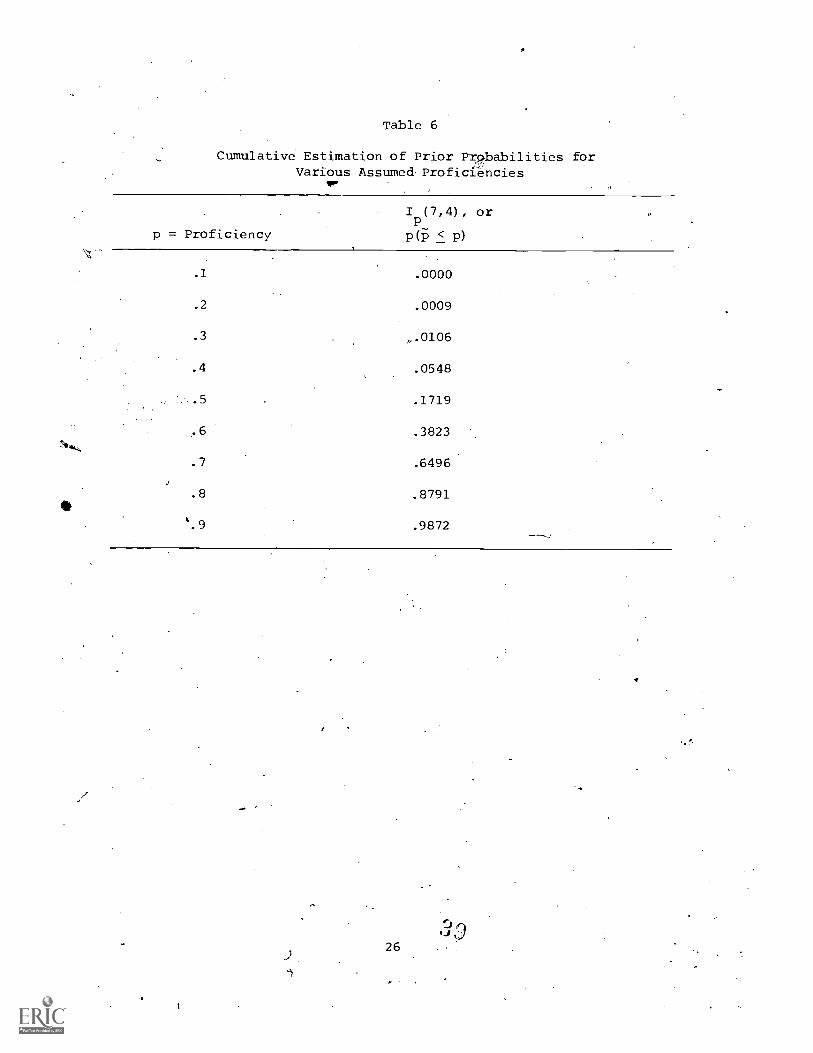
Table 6
Cumulative Estimation of Prior Pr9babilities forVarious Assumed. Proficiencies
p = Proficiency
I (7,4), or
P(P- < p)
.1 .0000
.2 .0009
.3 ,.0106
.4 .0548
.1719
.6 .3823
.7 .6496
.8 .8791
4.9 .9872
26
Values of the proficiency (p) may be chosen, but a = x' = 7, andb = n - x' + 1 = 4. Since (n + 1) = n! for integers, we can easilysolve equation (16) r(a + b) = r(1d) = 10! = 3.6288 x 10⁶; r(a) =P(7) = 6! = 7.2 x 10²; r(b) = F(4) = 3! = 6. Therefore, r(a + b)/r(a) r(b) = 3.6288 x 10⁶/(720)(6) = 840. Table 7-shows how values off(p) may be obtained.
A plot of the tabled values for p onthd abscissa and f(p) on theordinate could then be made. Such plots may also be found in Winkler(1972, sec. 4.3 and 4.4), Schlaifer (1969, sec. 11.1.2) and Novick andJackson (1974, p. 112). Note that this is a prior distribution ofhypothesized proficiencies in which we assumed at the outset that theinformation could be characterized as comparable to the informationthat would be obtained from observing a score of seven correct on a ten-item test.
Evaluation. Bayesian models offer the possibility of enhancingthe assessment of examinee proficiency by using prior information, e.g.,knowledge that content experts or examiners have about preVious similarexaminee populations. As the validity and accuracy of this prior in-,.
formation increases, fewer test items will be needed to achieve a givenlevel of classification accuracy in comparison to the binomial modeland in comparison to the Bayesian case of equal priors. As more isknown about the examinee population (i.e., the more that prior inforMa-tion departs from a B(1, 1) distribution), the more the variability inthe posterior distribution is reduced, and the more the number of itemsto attAin a desired level of accuracy is reduced.,
In comparing the binomial and Bayesian models, note that the formerproduced as output the probability of observing a specific score condi-tional upon some hypothesized true,ability level. In the spirit ofclassical hypothesis testing, one need not know anything about an exami-nee's proficiency, except that he or she is more or less likely to comefrom the mastery side of the cutoff score. Since some true level offunctioning must be hypothesized, it is possible to determine the prob-abilities of falsely passing a nonmaster and falsely failing a masterif the test score suggests a true proficiency level either above orbelow the hypothesized true level of functioning.
In contrast, the Bayesian model provides as output the probabilitythat a specific examinee has a true ability equal to or greater than thecriterion (minimal) ability, conditional upon the observed test score.But since no true ability was hypothesized, false positive and falsenegative error rates cannot be specified as was possible with the bino-mial model. While both models give the probability that an examinee isa member of some ability level group, the binomial estimate refers tothe probability of a score occurring conditional upon the-assumed trueproficiency; whereas the Bayesian estimate refers to the probability ofa'specific examinee being at Or beyond some proficiency level conditionalupon his or her observed test score.
27

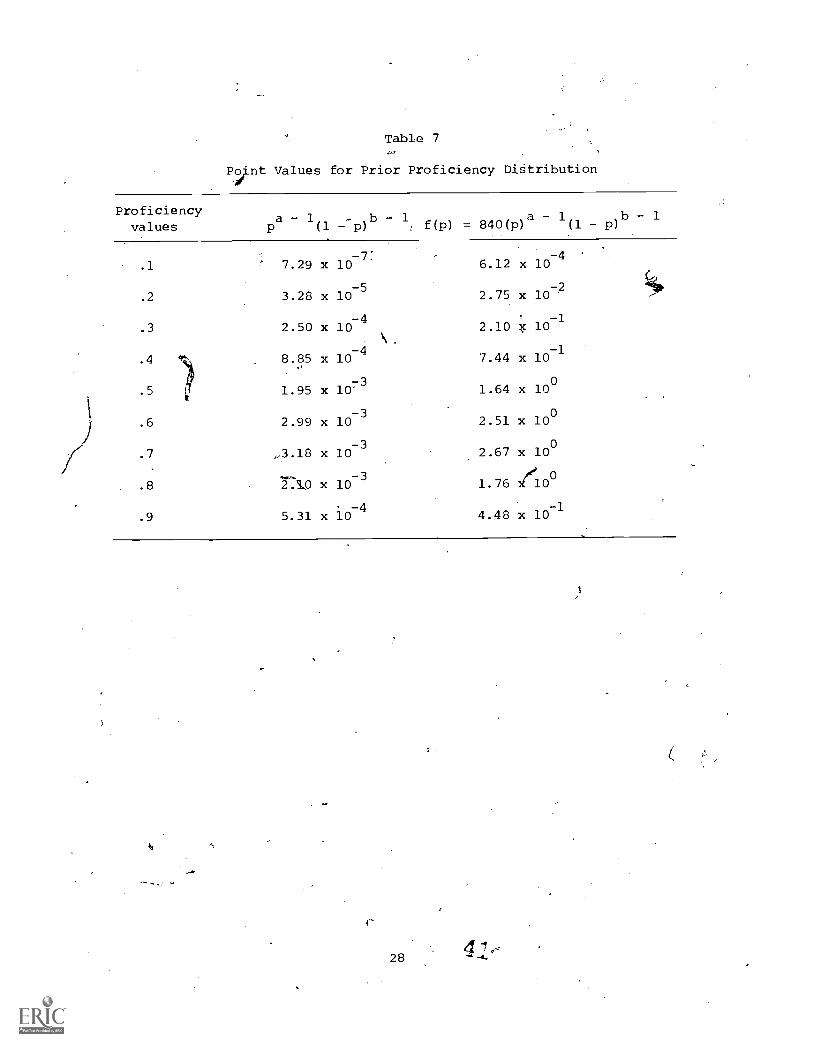
Table 7
Pooiint Values for Prior Proficiency Distribution
Proficiencyvalues
a - 1(1 p)
b - 1f(p) =
-7:.1 7.29 x 10
.2 3.28 x 10⁻⁵
.3 2.50 x 10⁻⁴
.
.4 8.85 x 10⁻⁴
_3.5 1.95 x 10*
.6 2.99 x 10⁻³
.7 ,3.18 x 10-3
.8 r1.0 x 10-3
.9 5.31 x 10⁻⁴
840(p)a - 1
(1 p)b - 1
-46.12 x 10
2.75 x 10
2.10 x 10⁻¹
7.44 x 10⁻¹
1.64 x 100
2.51 x 100
2.67 x 10o
1.76 110° 0
4.48 x 10⁻¹
C'
284!
There are several difficulties confronting the potentialuser of aBayeOian model for CRT purposes. First, the mathematics can becomerather cumbersome, since the Beta distribution must be used when abilityis assumed to be'distributed continuously., Second, a methodologicaldifficulty arises in the determination of prior probabilities (Winkler,1972, sec. 4.8): It is methodologically unsound to merely ask the-exam-iner orexpert to , "state his priors," since simple human' judgment of,prObabilities is'Oftendnreliable, inconsistent, and distorted (Kaplan& Schwartz, 1975): A method used in the present paper--equating priorinformatibn to comparable test length and score information--may besuitable for_puipOses of illustration, but it may be difficult to im-plement in applied settings.
There is at present a dearth of .research about howprior probabili-ties can actually be obtained from experts. Perhaps a pir comparisonor forced-choice procedure could be used in which various combinationsof proficiency (or expected scores) and associated probabilities arepresented to the expert (Steinheiser, 1976). Thus, th. judge's priordistribution would be directly obtained, and the bef:.t fitting Beta'distribution used to provide the necessary parameter dues.
Rasch's One-Parameter Logistic Model
Assumptions and Rationale. The latent trait model developed byRasch (1960, 1961, 1966) is claimed to yield person-free test calibra-tions and item-free person measurements (Wright & Panchapakesan, 1969).The model attempts to reproddce an item 1y score group matrix in whichn items are ordered by their difficulties,,and n -'1 score grOups areordered by the raw scores. Cell entries represent th".robability thatitem i will be passed by a person in score group j (Whitely & Dawis,1974).
There are two parameters in the model. The first is person abilityA; the second is item difficulty D. The odds (0) Of a person correctlyanswering an item are equal to the product of the person's ability timesthe item's difficulty: 0 = A x D. If'we express the odds as a prob-,ability, we find that the probability P of a person with ability A suc-ceeding on an item with difficulty D can be expressed as A x D
P =1 + A'x D
Replacing A and.D with their logarithms, log A = a and log D = d, wemay finally express P as a logistic function (Wright, 1967) :
P -1
1 + e(-a - (18)
This"model assumes that (1) all items measure the same unidimen-sional trait; (2) all items have equal discriminating power and vary
29
only in difficulty (the restrictionresults in a set of nonintersectingdiffer only by a translation alongand items are locally independent;and (5) there is no time constraint
of a common discrimination index
item characteris.tiewhich
the ability scale); (3,1 subjects
(4) guessing effects arenegligible,
on answering items (I: 1966).
Tests comprised of items all of which fit the plodel. the fol,
lowing properties (Wright & Panchapakesan, 1969; Whitely Dawis,
(1) estimates of item difficulty parameters will)nct dif fer signs f1-
1-974)
cantly forrany sample of examinees; (2) estimates of Petson abilitywill not differ significantly for any sample of calibrated
items; (3)
individual ability estimates can be measured on at least interval,
and perhaps a ratio scale (Wright, 1967); (4) the scale ofanrabilities
is defined regardless of the characteristics of the subjec't popule1-on
who take the test; and (5) a unique standard error of measurement is
associated with each ability level.
The significance of the Rasch logistic model may be appreciated
by comparing it to "classical" models of test develoPment:
A psychological test having these general characteristicswould become directly an alogous to a yardstick that measures
the length of objects. That is, the intervals on the yard
stick are ect2, theindependent of the length of the objlength of individual objects is interpretable wltholat
spect to whiC h partictlar yardstick is used. In contrast/
tests del'ieloped according to the classical model have neither
characteristic. The score obtained by a person 12 inter
pretable without referring to both some norm groupand the
particular test form used. . . No longer would ecilaivalent
forms need to be carefully developed, since measurerrient i5instrument independent and any two subsets of the
Qalibrated
item pool could be used as alternative instruments. gimi-
- larly, independence of measurement from a Particular popula-tion distribution implies that tests can be used for personsdissimilar from the standardization population without thenecessity of collecting new norms (Whitely 6 Dawl. 1974'163-164).
Examples. Calibrating a test using the Rasch model results in a
logarithmic ability estimate being assigned to everY possibleraw score
This estimate indicates the amount of ability required to achieve thatraw score. A comparison of the ability estimates assigile,4
given
the degree to
distriblatl'onsindicate
raw score by two samples with different ability 2
which Rasch model calibrates a test independently of
the ability level of the calibration sample.
Wright (1967) studied the responses of 976 beginning lavistudents
to 48 reading comprehension items on the L.S.A.T. To obtain samples
with different ability distributions, he selected tWO contrasting
30
groups from his total sample. The lower group included the 325 studentswho did poorest on the test, with a top score of 23. The higher groupincluded the 303 students with the highest scores, with a bottom scoreof 33. Wright compared the similarity between the two sets of Raschability estimates and the two sets of percentile ranks. Figure 1 showsthe results, in terms of "person-bound test calibration," where a plotof raw score against percentile rank clearly shows two different abilitygroups. If a person is said to be in the nth percentile,'reference mustbe made to which group that person belongs.
After subjecting these same data to the Rasch logistic analysis,the test scores are transformed into ability measurements along theordinate. Figure 2 shows that the curves for the best and worst exami-nees almost completely overlap.
The difficulty estimates based upon these dichotomous examineegroups are statistically equivalent. Therefore, these estimates areindependent of the ability of the examinees in the calibration sample,and maybe used over the entire range of ability. Comparing the call-
ibration curves of these figures shows the contrast between (1) calibra-'tion based upon the ability distribution of a standardizing sample, and(2) calibration that is free from the effects of the ability distribu-tion of the examinees used for the calibration.
Can ability be measured in a fashion that frees it from dependenceon the use of a fixed set of items? If a pool of test items has beencalibrated on a commohscale, can any set of items be selected from thatpool to make statistically equivalent ability measurements?
Wright (1967) tested these hytmtheSes by making it as difficult aspossible for person measurement to be item free. He divided the origi-nal test items into two non-overlapping subtests, tile easiest itemscomprising 'one subtest and the hardest items. comprising the other sub-test. The model predicts that ability estimates based upon the easysubtest should be statistically equivalent to those estimates basedupon the hard subtest.
The solution required converting the scores to log abilities, .andthen standardizing the differences in ability estimates. First, foreach score, the corresponding log ability on the calibration curves wasobtained (see Figure 2). For each pair of scores (from the easy andhard subtests), a pair of estimated log abilities was obtained. Then,a standardized difference was found by dividing the difference betweenthe easy and hard subtest ability estimates by the measurement errorof the differences. If the ability estimates are statistically equiva-lent, then the distribution of standardized differences should have amean equal to zero and a standard deviation equal to one. The obtainedvalues were .003 and 1.014, respectively.
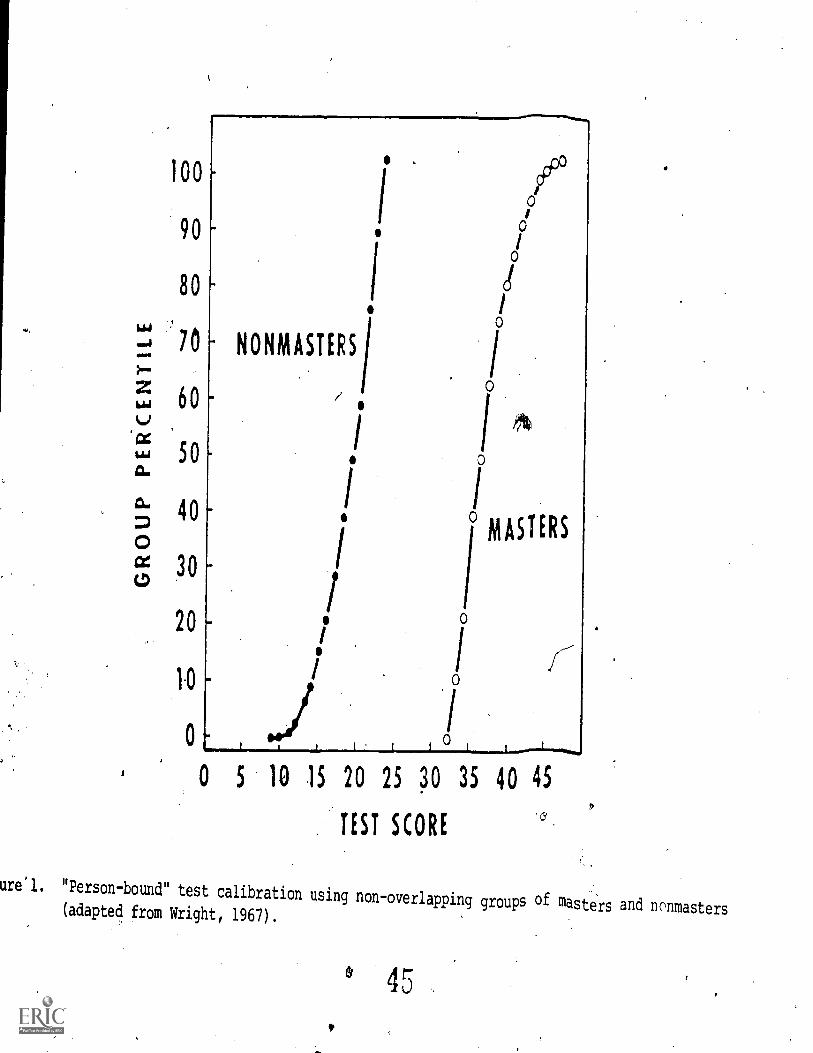
100
90
80
70
60
500.
40
04:4 30
20
0
NONMASTERS
imAsiERs
0
j).
10 IS 20 25 30 35 40 45
TEST SCORE6
ure'l. "Person-hound" test calibration using non-overlapping groups of masters and nenmasters(adapted from Wright, 1967).
45
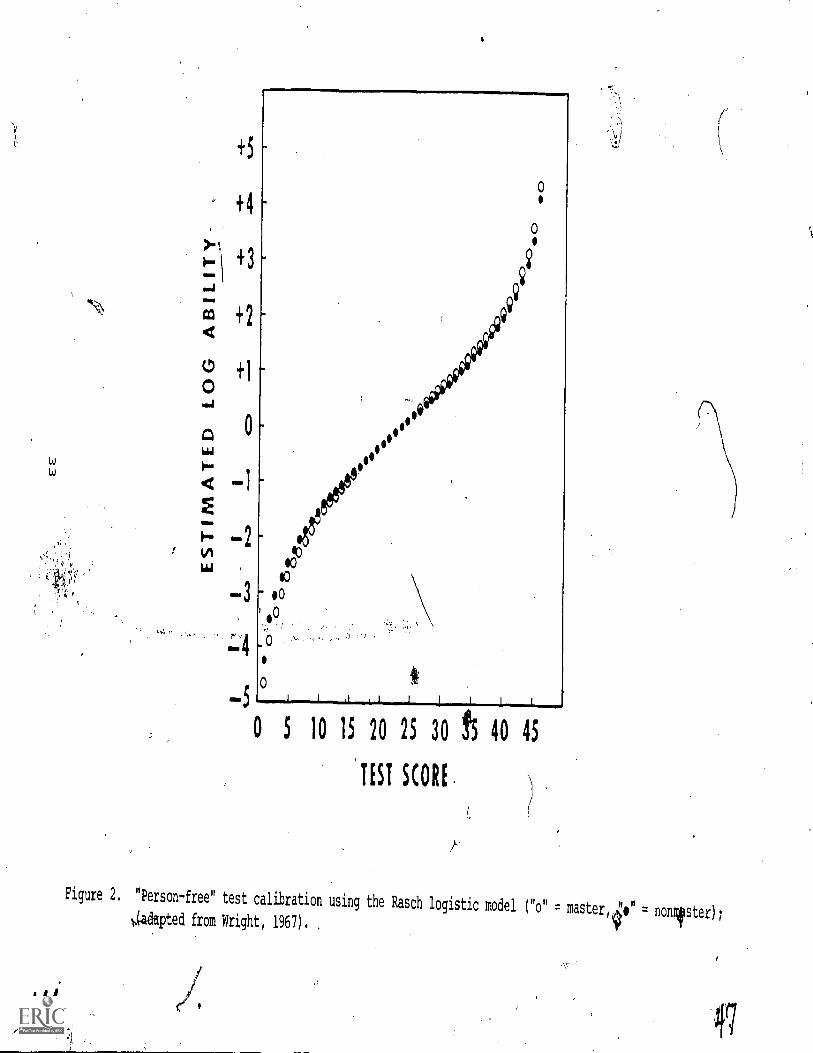
W
0 5 10 15 20 25 30 f5 40 45
TEST SCORE
t-
Figure 2. "Person-free" test calibration using the Rasch logistic model ("o" = master,." = nonister);4,..(.adapted from Wright, 1967). ,
Applications. A more detailed example will show how the Raschmodel was used to analyze the results of a criterion-referenced test(Kifer & Bramble, 1974). The data, were obtained from 201 college stu-'
denf taking an 84-item multiple choice examination in introductory,edu--tional psychology.' After discarding items that did not fit the
el, the final test contained 68 items.
Comparison of the Rasch-derived ability estimates to a criterionscore can .proceed in two ways.
The first is analogous to determining the probability of committinga Type I error in classical hypothesis testing. That is, if the cri-terion ability corresponds to the null hypothesis, we must determine theprobability that an obtained ability could have arisen from random sam-pling from a distribution with a mean equal to the criterion ability anda standard deviation equal to the error associated with the criterion
ability.
The second is analogous to determining the probability of commit-ting a Type II error in classical hypothesis testing. That is, given
an obtained ability estimate and associated error, (standard deviation),
we seek the probability thatthe criterion ability could have been ob-
served from random sampling from the distribution corresponding to theobtained ability estimate.
Kifer and Bramble chose to define their criterion score as 80% ofthe items correct or 54.4 items correct. Their cutoff score was there-
fore 55. A raw score of 55 yields an ability estaate of 1.69, with astandard error of .33. Suppose a raw score of 60 were obtained. What
is the probability that this score exceeds the criterion score of 55?
t
The solution requires that we find the probability that this scoreis part of the criterion distribution, with mean equal to 1.69 and stan-
0 .......224111g equal to .33. (1) Kifer and Bramble's parameter estimatesshow that an observed score of tO has ,an ability value equal to 2.32.(2)' 2.32 - 1.69 = .63 units of difference between the observed and cri- 1
terion abilities. (3) .63/.33 = 1.91 standard deviations of difference
between the ability values. (4) A table of the normal distribution
shows that 1 - F(1.91) F .03. Therefore, the ability value of 2.32has a probability = 603 of coming from a normal distribution with^amean = 1.69 and standard deviation = .33.
Page 34, pare 6, line 3 -- (Bp) "deviation" -- not'devision"There is a second method by which ability estimates may be com-
pared to mastery standards. This method requires the probabilit that
the criterion ability is part of the distribution which has a venvi(observed) ability as its mean 'and the given ability standard error
as its standard deviation. We now need to find the, probability thatthe true ability corresponding to a score of 60-does not exceed the
criterion ability. (1) Kifer and Bramble's parameter estimates showthat an observed score of 60 has an ability value equal to 2.32 and a
34
43
standatd.error eqUal to .39. (2) 2.32 - 1.69 = .63 units of difference'between the observed and criterion abilities. (3) .63/.39 = 1.62 stan-dard deviaitons of difference between the abiliti9s, (4) A table of thenormal distribution shows that 1 - F(1.62) = .05. Therefore, the abil-
I$ity value of 1.69 has a probability of .05 of coming from a normal dis-'tribution with mean = 2.32 and standard deviation = .39. Therefore,the probability that an examinee with a score of-60 has a true ability
. below the criterion value = .05, which is the.Type II error analog thatthe criterion score would not be obtained by chance given the obtainedability:
Anderson et al.- (1968) investigated the hypothesis that Rasch itemeasiness estimates are independent of the ability of the calibratingsample, and that the item easiness estimates p.re more stable when onlyitems that fit the model are)considered. They lised the 45-item spiralomnibus intelligence test for screening appligaits to the AustralianArmy or Royal Australian Navy. Samples of 601. 4ecruit applicants tothe Citizen Military Force (CMF) and 874 recruit, applicants to the RoyalAustralian Navy were studied. Twelve items we're deleted for zero orfor 100% correct responses.
For the CMF sample, 30 items (91%) fit the model at the .01 confi-dence level, and 25 items (76%) fit the model at the more stringent .05level of confidence. (The level of confidence represents the probabilityof obtaining the observed pattern of responses, assuming that the modelis adequate to explain performance on the item.) For the Navy sample,the corresponding findings were 22 items (67 %) and 16 items (48%).
The correlation between the item easineSs' estimates from both sam-ples was .958 (based upon 33 items). When:the items that failed to fitthe model at the .05 level were deleted, the correlation increased to.990. It therefore appears that the item 4asiness ratios were indepen-dent of the ability of the samples from which they were computed: Itshould be critically noted that an intelligence test was used, and thatthe two subject populationsdprObably did nOt differ significantly.
In a more recent study, Tinsley and Dawis:(1975) gave four typesof tests (verbal, numerical, picture, and item-symbol analogies) to fourgroups of subjects: college students, high, school students, civil ser-vice clerks, and clients of the state Division.of VocationalRehabilita-tion (DVR) . If Wright's (1,567) findings pouldbe replicated, then theability. estimates of,.one group should correlate highly with the abilityestimates of another group for the same test. Of the 10 correlationsthat were computed (e.g.,-college students and high school students forthe picture test, high school students and. DVR clients.on verbal analo-gies), all reached +.999. The invariant relationship between the abilityestimates calculated for a 25-item verbal analogies test for 630 collegestudents and 90 DVR clients replicated the relationship reported byWright (1967) and shown in Figure 2. Tinsley and Dawis conclude that
35
. . . Rasch ability estimates are invariant with respect to the abilityof the calibrating sample." (p. 337)
Tinsley and Dawis also investigated the degree to which the itemparameters (item difficulty estimates and z-item difficulty ratios) wereinvariant when the analyses were performed on all items of the test.The correlation of item difficulty estimates for a given test from twoexaminee groups tended to be rather large (+.90). Interestingly, cor-relations close to zeroArere obtained from the DVR group with both highschool and college students. This unexpected finding may be attributedto the small (n = 89) sample of DVR subjects. Generally, the item easi-ness ratios were invariant with respect to the ability of the calibrat-ing sample of examinees, even though several of the comparisons usedsamples of questionable size.
Evaluation. The studies cited have demonstrated that if the assump-tions are met, or even reasonably approximated, then person-free testcalibration and item-free person measurement can be achieved by usingthis one-parameter logistic model. Although Hambleton and Traub (1973)report that a logistic model, with an item discrimination index as'asecond parameter provides a better fit to their data, the inclusion ofthis second parameter violates\true "objectivity in measurement" (Wright,1967) :
Several potential shortcomings may pose some difficulty in success-fully implementing the model: (1) a pool of items must be developedthat conforms to this item-analysis model, and the items must be cali-brated (perhaps 20% of the items will have to be either discarded orrevised); (2) the item calibration and standardization procedures re-quire dozens of items and hundreds of subjects; (3) the* model does notmake direct predictions about optimal test lengths or cutting scores asdo the models of Macready and Novick and Lewis; and (4) the mathematicsof the model can become quite complex, posing problems for actually im-plementing the model and for interpretation of output. However, recentpublications and the availability.of computer Programs (Wright & Mead,1975, -1976) alleviate this difficulty.
The major virtues Of the Rasch mologel can be summarized as follows:(1) Once a test has been standardized on any group of subjects, it canbe given again to a different group, without the need to create parallelforms. For example, a test which had been developed by giving it to"masters" could later be given to "nonmasters." (2) All abilities willbe on the, same scale, regardless of the subset of items from which theseabilities were estimated. Thus, person A can be measured on a hard test,and person B on an easy test.
36
Regression Theory
Assumptions ipd Rationale. The criterion-referenced testing litera-ture has tended tWemphasize the supposed dichotomy between classicaltest theo d the emerging CRT theory. The following discussion ofregression as a mean for assessing mastery is intended to point outthe similarities between several CRT strategiet and classical theory.Specifically, both the Bayesian and logistic models produce estimateddistributions of ability, as does classical regression. A cutoff scoremust still be set at some point on the ability (score) distributions,regardless of what model is used to derive the distributions. This sec-tion simply portrays classical regression theory in terms of CRT theory.
The regression-theoretic approach of the "classical testing model"(Lord & Novick, 1968) describes the reason for lack of perfect mastery-nonmastery observed scores in terms of specified or estimated errors ofmeasurement. The observed score is considered to be an unbiased esti-mate of an examinee's true score. It is then possible to derive aregression function that could be used to estimate true scores fromobserved scores. The equation for the regression function is
R(TIX) = rxx'
X + (1 - rxx'
)mx
, (19)
where R(TIX) = the true score T given the observed score X, rxx, = thereliability of the test, and mx = the mean of the observed scores.
The magnitude of several types of error may also be determined.The error of measurement is the error involved when, for a randomlyselected examinee, we take the observed score as an estimate of thetrue score. This can be expressed as E = X - T, and the random variableE, taking on values of e, is called the error of measurement. Thestandard deyiation of this error of measurement, calleorthe standarderror of measurement, can be expressed in terms of the standard devia-tion of observed scores and the reliability of the test:
SE
= Sx rxx') (20)
The different between the linear regression estimate and the truescore itself is cal d the error of estimation, and is expressed sym-bolically as e = r
xx(x m) (T m ). (21)
The standard deviation of these errors, called the standard errorof estimation, is expressed as s
e= s
x./r
xx.(1 rxx ). (22)
Example. A graphic representation of the regression technique fora five-item test is shown in Figure 3. For each observed score, an esti-mated true score is obtained from R(TIX), and the standard error ofestimation se is calculated. 'A cutoff score based upon true scores may
_51,-
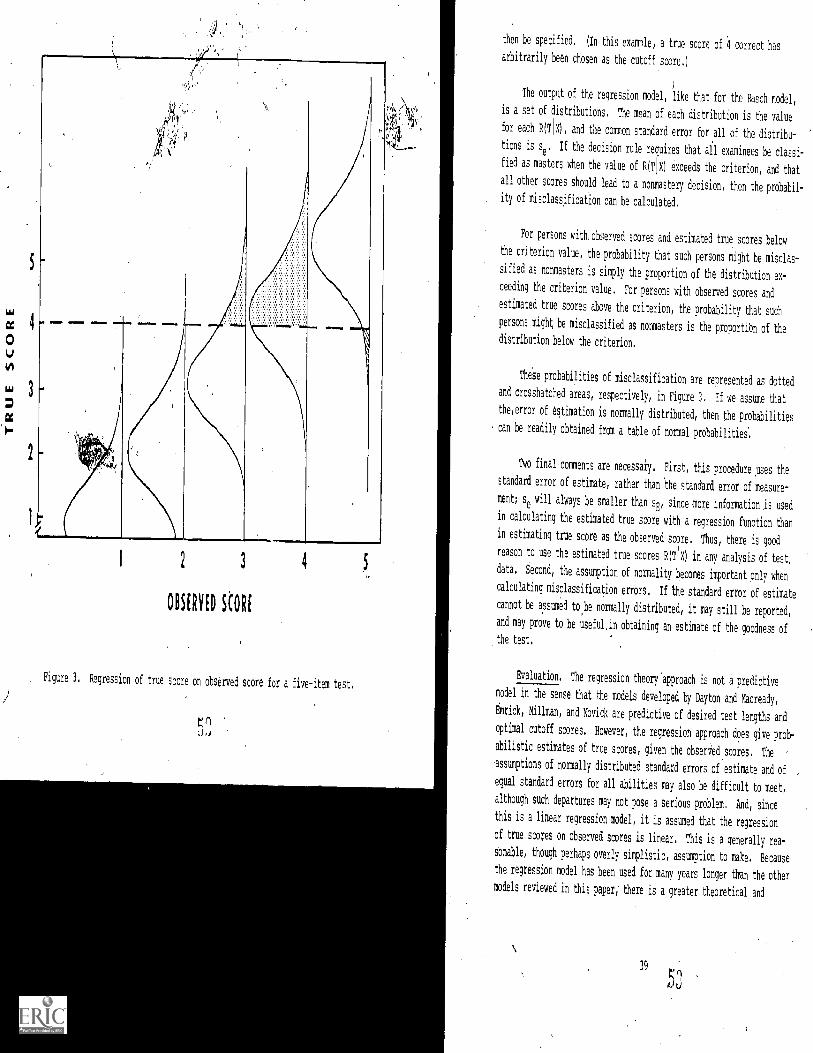
OBSERVED SCORE
Figure 3. Regression of true score on observed score for a five-item test.
rt)J.d
then be specified. (In this example, a true score of 4 correct has
arbitrarily been chosen as the cutoff score.)
The output of the regression model, likethat for the Rasch model,
is a set of distributions.The mean of each distribution is the value
for each R(TIX), and thecommon standard error for all of the distribu-
tions is se. If the decision rule requires that all examinees be classi-
fied as masters when the value of HIT X1 exceeds the criterion, and that
all other scores should lead toa nonmastery decision, then the probabil-
ity of misclassification can be calculated.
For persons with, observedscores and estimated true scores below
the criterion value, the probabilitythat such persons might be misclas-
sified as nonmasters is simply the proportion of the distribution ex-
ceeding the criterion value.For persons with observed scores and
estimated true scores above the criterion,the probability that such
persons might be misclassified as nonmasters is the proportibn of the
distribution below the criterion.
TheSe probabilities of misclassification are represented as dotted
and crosshatched areas, respectively, in Figure 3. If we assume that
the,error of estimation is normallydistributed, then the probabilities
can be readily obtained from a table of normal probabilities.
Two final'comments are necessary. First, this procedure uses the
standard error of estimate, rather than the standard error of measure-
ment; se will always be smaller thansE, since more information is used
in calculating the estimated true score with a regression function than
in estimating true score as the observed score. Thus, there is good
reason to use the estimated true scores R(TX) in any analysis of test,
data. Second, the assumption of normality becomes important only when
calculating misclassification errors. If the standard error of estimate
cannot be assumed to,be normally distributed,it may still be reported,
and may prove to be useful, in obtainingan estimate of the goodness of
the test.
Evaluation. The regression theory approach is not a predictive
model in the sense that the models developedby Dayton and Macready,
Emrick, Millman, and Novickare predictive of desired test lengths and
optimal cutoff scores.However, the regressiou approach does give prob-
abilistic estimates of true scores, given the observedscores. The
assumptions of normally distributedstandard errors of estimate and of
,
equal standard errors for all abilities may also be difficult to meet,
although such departures may not pose a serious problem. And, since
this is a linear regression model, itis assumed that the regression
of true scores on observed scores is linear. This is a generally rea-
sonable, though perhaps overly simplistic, assumption to make. Because
the regression model has been used for many years longer than the other
models reviewed in this paper, there is a greater theoretical and
39
5'
9
empirical literature to back it up than there is for the newer, lessestablished models. For a more technical critique of the use of re-gression models for estimating true scores from observed scores, seeAppendix B.
SUMMARY AND CONCLUSIONS
Nature of Performance Acquisition
Performance acquisition is assumed to be an all-or-none phenomenon,according to the models developed by Emriek and by Dayton and Macready.(see Table 1). Hence, these models assume that error-free test per-formance is also dichotomous. But the binomial, Bayesian, logistic,and classical regression models assume that performance acquisition iscontinuous. Performance on dichotomously scored test items must there-fore be mapped onto an equivalent position on the uhderlying abilitycontinuum (Roudabush, 1974). It is not"possible to decide unequivo-'cally that one assumption is more correct than the other, since thenaturelof,performance acquisition most likely interacts with the par-ticular type of task. Some tasks tend to elicit unitary, highly prac-ticed, sequential behaviors,, and would seem to be performed in an all-or-none fashion. Tasks which require multiskilled performances wouldmore closely approximate the assumptions of the continuous skillacquisition models.
Measurement Error
Measurement error, is defihed as the difference between observedtest score and true (unobservable) score that would be obtained if mea-surement were perfect. It is most important when one tries to infer atrue "error-free" score from observed data. The Block and Crehan methodsdo not estimate a true score( nor do they deal directly with measurementerror. Rather, they relate observed scores- directly to an external cri-terion. Hence, any systematic error will not be a problem. But randomerrors which affect the consistency of observed scores will disturb themeasurement process for individual cases. Fortuitously, such errorswill tend to average out across groups of examinees, allowing generali-nzations to.be made which should IN\ valid in the "long run."
-The a12-or-none models deal with measurement error by stipulatingvalues for the probability of masters committing errors and for nonmas-ters guessing correctly. These values are obtained by fitting the all-or-none models to observed data. Responses from both mastery and non-mastery groups can be described by binomial distributions.
The "continuous" models of Novick, Rasch, and regression theorydeal with measurement error by reporting a standard error for each true
40

score estimate.. In particular, the Yt.asch model provides a check on howrirwell the model's output approximates the observe score matrix '(Wright)and Mead, 1975, 1976). "Best fit" techniques a required for theBayesian and regression models. The binomial models do not rely direct-ly on observed data, and hence, do not deal directly with measurementerror. Instead, for any hypothesiZed level of mastery, the models pre-dict the observed score distribution. Adequacy of the models' predic-tions can be evaluated by_fitting data to the hypothesized distributions.A more. complete comparison of how these models are affected by measure-ment error must await either Monte Carlo simulation studies or consider-able efforts of empirical research.
Classification Error
Unlike measurement error, classification error refers to assigningindividuals to inappropriate mastery level groups--masters....to the non-mastery group, and nonmasters to the mastery level group. Such errorscould occur even with error-free measurement. However, measurementerror interacts with classification error, further complicating thedecisionmaking process of assigning examinees to mastery level groups.Suppose that, because of measurement error, all estimates of true scoretended to be inflated. For a given decision rule, this would tend todecrease false negatives and increase false positives. Unfortunately,constant measurement error is the exception rather than the rule, makingit virtually impossible to correct for it, and therefore separate itfrom classification error.
The Block and Crehan models deal with classification error empiri-cally by comparing the decisions based on a test score with an externalcriterion. Hence,..the classification error can be determined simply bycounting the number of observed misclassifications. If examinee groupsremain similar over time, these models probably provide useful and stableestimates of misclassification error.
Because none of the other models incorporates an external criterion,a diredt measure of classification error is not possible. Instead, themodels rely on the distributional information obtained for the estimatedtrue scores. With this information, it is possible to predict the prob-
, .ability of misclassification, given-various cutoff scores. Further em-piric?' work which incorporates an external criterion is needed to
4 verify the accuracy of such predictions.
An essential ingredient of decisionmaking on the basis of CRTscores is the concept of cost--both to the examinee and to the systemwhich he or she is being prepared tojoin. Consider the case of profes-sional licensing, such as for new medical doctors: with an extremelystricyriterion, many would fail, morale would be low, and the system(society) would be deprived of much-needed medical service. However,with a very lax criterion, more examinees would pass who may not
41
(unfortunately) be qualified, and society would thus suffer the conse-quences of having "nonmasters" in practice. A similar case could bemade for automobile mechanics, military medics, television repairmen,etc. Emrick's model is the only one that directly incorporates monetarycosts of incorrect classifications into its procedures. However, anobjective cost factor could also be incorporated into the other modelsquite readily. But none of the models, as developed, deals with morecomplex kinds of cost, such as morale, costs to society (which may haveto bemeasured in terms of utility, not dollars), or even the cost oftesting as opposed to not testing (Nader, 1976).
a.
Test Length
For performance-oriented testing, where each item may require con-siderable time and expense, it is essential to be able to approxi tethe minimum number of items needed for good decisionmaking.
Neither the Block nor the Crehan methods explicitly deals withtest length. These models were designed to show what happens whenexisting test results are compared to an external criterion. However,since the data are available, it would be possible to reevaluate theresults, assuming that only some of the test items were used. Theregression approach allows for shorter tests, but does not providefor extrapolation to longer tests.
Since the binomial model does not rely or. observed data, .-7esultsfor tests of any length can be predicted. This asp,ct of _Ae,nodel isparticularly attractive, since a first apprc:dr, tion to test Tergth canbe easily tried out.
The all-or-none models use observed data to heir- genc,rate t7-_e neces-sary parameters. Once the values are available, it is possible 7_o pre-dict the results for tests of any .length. As the Bayesiansuch predictions will be valid only if the exami-lee groups' rema'm rela-tively stable.,
The Bayesian models can also be used as a predictbr for test re-sults of any test length. However, estimates of the values of severalprior probabilities must be specified. In order for the-predictedresults-to be applicable to real data, the estimated prior probabili-ties must be close approximations to the priors as determined post hoc,after data have been collected. The main feature of this model--toreduce test length,as a function of increasing prior informationwillbe minimized to the extent that the prior information departs from cor-rectly characterizing the population's proficiency underinvestigation.
The logistic model Of Pasch can only be used to predict the resultson a test that includes items that have already been calibrated. How-ever, the logistic nature of the model makes it extremely powerful in
%
42
this respect. Since the item difficulty values calculated as part ofthe procedure are invariant across examinee groups 0f differingany subset of items can be used with any group of egaMilles. Further;
more, the errors associated with each calibrated item avaiwhich can lead to precise predictions of classificatiori rror f°1- testsmade up of a subset of the original item pool.
Conceptualization of Mastery
Y models that explicitly define mastery are all_orThe onlymodels. Deviations from perfection or total lack ofobility .are
°f the0' the
specified definition of mastery.
defineclas measurement error. Mastery is not explicitlyother models. other perform`
or an estimated true score on aPerformance is related to sole
testcontinuunl
isa
Either testance (Block and crehan)provided. The models can then be used to evaluate result 0r1 ellY
These (continuous) models require that the tester be extremely sen-sitive to system requirements. If mastery is defined ill terms Ofvery
high performance, then very few examinees are likelY to be classifiedof demandingas masters; however, .if mastery is defined in terms
standards, the tester (and the system) runs the risk of having a mas-tery group that is less than adequate. Thus, the velidit'l f the defi,
-----T\D Y_4-c ° crlICi.nition of mastery in terms of the system requiremen-- eomes a alissue. Empirical studies are needed in specific content t(, deter
areanmine "how much ability" a master should have.
Characteristics of Items
Only the Rasch in thislogiAtc model, of all the models di- ousneaeli paper, is designed for item analysis. Other models relegate,
assumptions or as definitions, such matters as how itemeare
a;-1_te e .
item difficulty, item homogeneity, and item independence, Certainly it
an item set can be shown to violate these assumptions or definitions,the application of such a model would be questionable. T
cal or empirical work has been done to demonstrate the robustnessIoftheoreti...
these models to violations of the assumptions.
43
REFERENCES
Andersen, J., Kearney, G. E., & Everett, AStructural Model for Test Items. Thecal and Statistical Psychology, 1968,
. V. An Evaluation of Rasch'sBritish Journal of Mathemati-21, 231-238.
Beyer, W. H. (Ed.) Handbook of Tables forCleveland: Chemical Rubber Co., 1966.
Probability and Statistics.
Block, J. H. Student Learning and the Setting of Performance Standards.Educational Horizons, 1972, 183-191.
Carver, R. P. Two Dimensions of Tests: Psychometric and Edumetric.American Psychologist, 1974, 29, 512-518. k-
Crehan; K.D. Item Analysis for Teacher-Made Mastery Tests. Journalof Educational Measurement, 1974, 4, 255-262.
Dayton, C. M., & Macready, G. B. A Probabilistic Model for Validationof Behavioral Hierarchies. Psychometrika, 1976, 41, 189-204.
Emrick, J. A. An Evaluation Model for Mastery Learning. Journal ofEducational Measurement, 1971, 8, 321-326.
Epstein, K. I., & Steinheiser, F. H. A Bayesian Method for EvaluatingTrainee Proficiency. Orlando, Fla.: Proceedings of the 8th NavalTraining Ecelpment Center/Industry Conference, November 1975.
Glaser, R., & Klaus, D. J. Proficiency Measurement: Assessing HumanPerformance. In R. M. Gagne (Ed.), Psychological Principles inSystem Development. New York: Holt, Rinehart, and Winston, 1963.
Glaser, R., & Nitko, A. J, Measurement in Learning and Instruction.In R. L. Thorndike (Ed.), Educational Measurement (2nd ed.).Washington, D.C.: American Council on Education, 1971.
Guilford, J. P. Fundamental Statistics in Psychology and Education.New York: McGraw-Hill, 1956.
Hambleton, R. K., & Traub, R. E Analysis of Empirical Data Using TwoLogistic Latent Trait Models. British Journal of Mathematicaland Statistical Psychology, 1973, 26, 295-311.
Hershman, H. L. A Rule for the Integration of Bayesian',Opinions.Human Factors, 1971, 13, 255-2591,
. .
Kaplan, M. F., & Schwartz, S. Human JUdgment and Decision Processes.New York: Academic Press, 1976.
45
Kifer, E., & Bramble, W. The Calibration of a Criterion-ReferencedTest. Paper presented at the annual meeting of tl?e AmericanEducational Research Association, Chicago, April 1974.
Kriewall, T. E. Applications of Information Theory and Acceptance Sam-pling Principles ,t0 the Management of Mathematics Instruction.University of Wisconsin Research and Development Center for Cog-nitive Learning: Technidal Report 103, 1969.
Lord, F., & Novick, M. Statistical Theories of Mental Test Scores.Reading, Mass.: Addison-Wesley, 1968.
Macready, G. B., & Dayton, C. M. The Use of a Probabilistic Model inthe Assessment of Mastery. Unpublished manuscript, College ofEducation, University, of Maryland, 1975.
ItMeskauskas, J. A. Evaluation Models for Criterion-Referenced Testing:
Views Regarding Mastery and Standard Setting. Review of Educa-tional Research, 1976, 46, 133-158.
Millman, J. Determining Test Length: Passing Scores and Test Lengthsfor Objectives-Based Tests. Los Angeles: Instructional ObjectivesExchangec 1972.
Millman, J. Criterion-Referenced Measurement. In W. J. Popham (Ed),Evaluation in Education: 'Current Applications. Berkeley, Caaf.:McCutchon Publishing Co., 1974.
Nader, R. Presentation at the 84th Annual Convention of the AmericanPsychological Association, Washington, .D.C., 1976; and reportedin APA Monitor, July 1976.
Novick, M. R., & Jackson, P. H. Statistical Methods for Educational andPsychological Research.. New York: McGraw -Hill, 1974.
Novick, M., & Lewis, C. 'Prescribing Test Length for Criterion-Refer6ndedMeasurement.- In C. W. Harris, M. C. Alkin, & W. J. Popham (Eds.),
'
Problems in Criterion-Referenced Measurement. UCLA: Center forthe Study of Evaluation; Monograph Series in Evaluation, 1974.
Rao, C. R. Linear Statistical Inference and Its Applications. New York:
Wiley, 1965.
Rasch, G. Probabilistic Models for Some Intelligence and AttainmentTests. Copenhagen: NielseU& Lydiche, 1960 (English translation).
Rasch, G. On General Laws and the Aaning of Measurement in Psychology.In Proceedings of the Fourth Berkeley Symposium on MathematicalStatistics. Berkeley: University of California Press, 1961.
46 53
Rasch, G. An Item Analysis Which Takes Individual Differences intoAccount. -British Journal of Mathematical and Statistical Psy-chology, 1966, 19, 49-57.
Roudabush, G. E. Models for a Beginrning Theory of Criterion-Referenced. Tests,; Paper presented at the annual meeting of the National'Coun-
, cil on Measurement in Education, Chicago, 1974.
Schleifer, R. Analysis of Decisions Under Uncertainty. New York:'McGraw-Hill, 1969.
Steinheiser, F. H. Methods for Estimating Prior Probabilities. Unpub-lished manuscript, Army Research Institute, Alexandria, Virginia.1976.
Tinsley, H. E., & Dawis, R. V. An Inve tigation of the Rasch SimpleLogistic Model: Sample Free Item an Test Calibration. Educationaland Psychological Measurement, 1975, 5, 325-340.-r-
Whitely, S. E., & Dawis, R. V. The Nature of Objectivity with'the Rasch.Model. Journal of Educational Measurement, 197411, 163-178.
L. An Introduction to B4yesian Inference and'Decision. New.Holt, Rinehart, and WinStonv 1972. A
Winkler, R.York:
Wright,In
4:°B. D. Sample -Free. Test Cali raticn and,. F;e2ssori. Measurement.
- I
Invitational Conference on y tins ProbleMs:.-Trincetonew'Jersey: EdUcationtestinglervice, 854101).
Wright, B.'D.,Analysis.23-48.
Panchapakesap, `N A, .Pro4idure for
Educational and Ji=ityChologicd1 .Measur-Wright, B. D., & Mead, R. J. CALFIT: Sample-Free Iterli
a Rasch Measurement Model,: Research Memorandum Na;
Sample -Free Itemement,,I9t4; 29,
libratIon with18, March° 1975.
Statistical Laboratory', Department of Education, UniVersityof-,Chicago.
-x fl
A ,Wright, B. D., & Mead, R. Ji liasc14 Model, Analysis wi.h the BI
Computer Program A Interim Feport4- September1,19 6; to theResearch Institute.
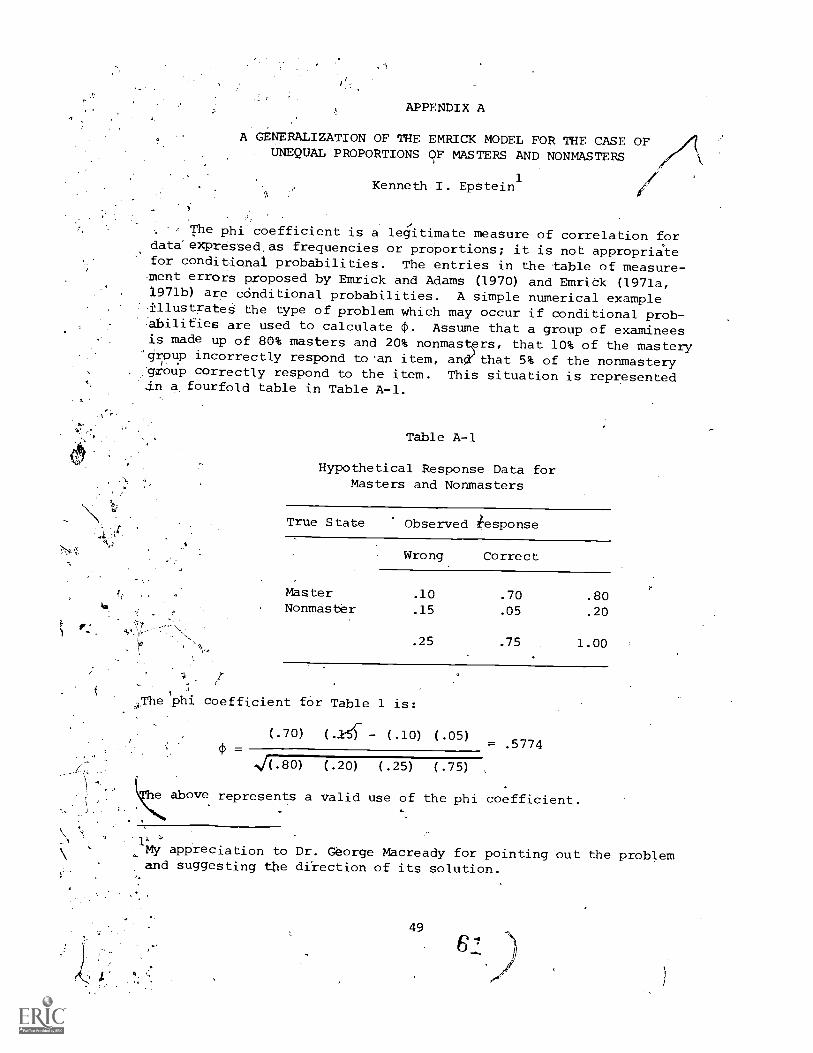
APPENDIX A
A GENERALIZATION OF THE EMRICK MODEL FOR THE CASE OFUNEQUAL PROPORTIONS OF MASTERS AND NONMASTERS
Kenneth I. Epstein1
The phi coefficient is a legitimate measure of correlation fordata'expressed,as frequencies or proportions; it is not appropriatefor conditional probabilities. The entries in the table of measure-ment errors proposed by Emrick and Adams (1970) and Emrick (1971a,1971b) are conditional probabilities. A simple numerical exampleillustrates the type of problem which may occur if conditional prob-abilities are used to calculate ci5. Assume that a group of examineesis made up of 80% masters and 20% nonmastprs, that 10% of the mastery
'group incorrectly respond to 'an item, an that 5% of the nonmasterygroup correctly respond to the item. This situation is representedn a fourfold table in Table A-1.
Table A-1
Hypothetical Response Data forMasters and Nonmasters
True State Observed lesponse
Wrong Correct
Master .10 .70 .80Nonmaster .15 .05 .20
.25 .75 1.00
,7
0'0The phi coefficient for Table 1 is:
. .
(.70) - (.10) (.05)= .5774
V'(.80) (.20) (.25) (.75)
above represents a valid use of the phi coefficient.
0.1My appreciation to Dr. George Macready for pointing out the problemand suggesting the direction of its solution.
a.
49
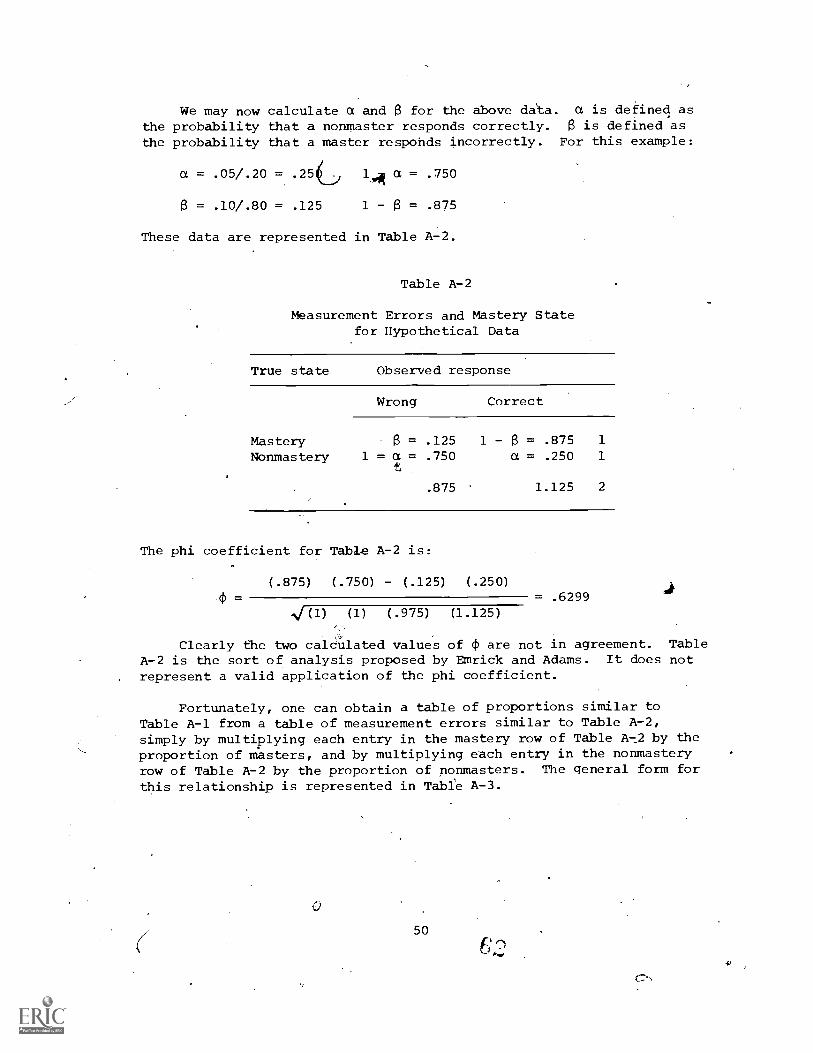
We may now calculate a and 13 for the above da2ta. a is defined asthe probability that a nonmaster responds correctly. (3 is defined as
the probability that a master responds incorrectly. For this example:
a = .05/.20 = .25G liA a = .750
= .10/.80 = .125 1 - S = .875
These data are represented in Table A-2.
Table A-2
Measurement Errors and Mastery Statefor Hypothetical Data
True state Observed response
MasteryNonmastery
Wrong Correct
13 =
1 = a =A
.125
.750
.875
1 - S = .875a = .250
1.125
1
1
2
The phi coefficient for Table A-2 is:
(.875) (.750) - (.125) (.250)(I) = = .6299
V(1) (1) (.975) (1.125)
J
Clearly the two calculated values of (I) are not in agreement. TableA-2 is the sort of analysis proposed by Emrick and Adams. It does notrepresent a valid application of the phi coefficient.
Fortunately, one can obtain a table of proportions similar totable A-1 from a table of measurement errors similar to Table A-2,simply by multiplying each entry in the mastery row of Table A -2 by theproportion of masters, and by multiplying each entry in the nonmasteryrow of Table A-2 by the proportion of nonmasters. The general form forthis relationship is represented in Table A-3.
50
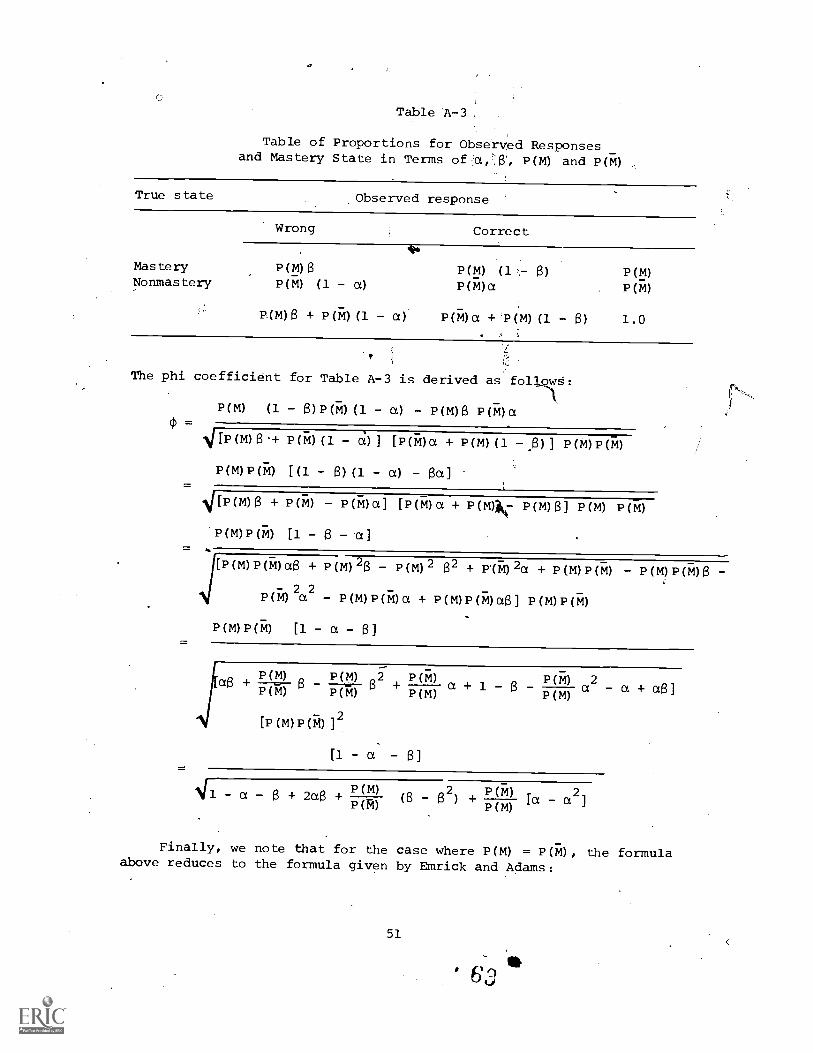
0
Table A-3
Table of Proportions for Observed Responsesand Mastery State in Terms of a,' P(M) and P(M)
True state Observed response
MasteryNonmastery
Wrong Correct
'C
P(M)TP(M) (1 a)
P(m) (3 + P (M) (1 - a)
p(m) (1- 13)P(M) a
P(M)a + P (M) (1 a)
P (M)
P(M)
1 . 0
The phi coefficient for Table A-3 is derived as follpw:
P(M) (1 - 13)P(M) (1 - a) - P (M) (3 P (F1) a
litip(m).4- F(17) (1 a)] [P(M)a + P(M) (1 -.13)] P(M)P(M)
P(M)P(M) [ (1 13) (1 a) (1)
V[P(m)13 + P(M) P(M)a] [P(M)a + P(M)- P(m)3) P(M) P(M)
P (M)P (M) [1 - 13 -
+ P (M) 2(3 - P(M)2 132 + Nib 2a + P(M)P(M)
P(M) 2a2 - P(M)P(M)a + P(M)P(M)a(3] P(m)P(F1)
P(M)P(M) [1 a 13]
P (m) P 6;10
+P(M) P(M) ai P(M)
"3 1- P (A) 13 P(M) lj P(M)
[F (M) F (T) )2
[1 - a -13l
a + 1 - (3P(M) a2P(M)
241 - a - + 2a13 + P(m) (3 132) + P(M) [a aP (n) P(M)
+ as]
Finally, we note that for the case where P(M) = P(M), the formulaabove reduces to the formula given by Emrick and Adams:
51
63
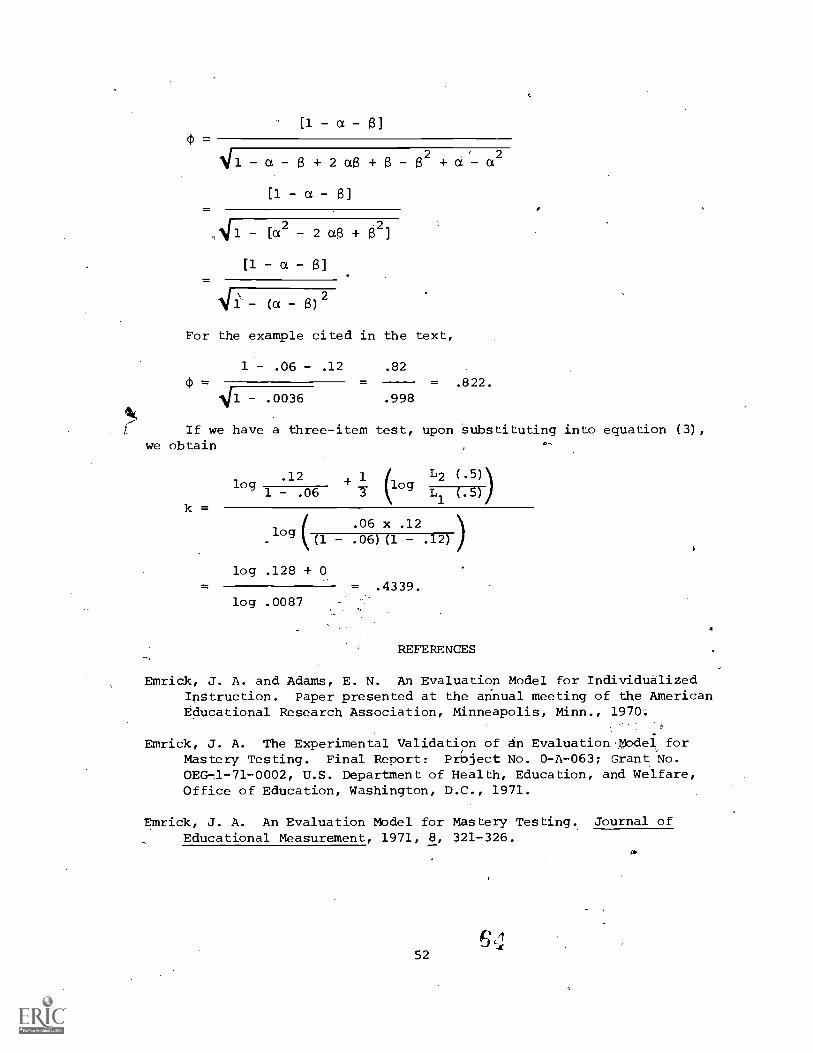
11/1 - a - 13 + 2 as + 13 -a 2 + a - a2
[1 - a a]
41- [a 2- 2 a6 + 132]
[1 - a - S]
For the example cited in the text,
.06 - .12 .82
- .0036 .998.822.
If we have a three-item test, upon substituting into equation (3),we obtain
k -
.12 1 L2log (log
1 - .06 L1 (.5)
log ((1 - .06) (1 - .12) )
.06 x .12
log .128 + 0- .4339.
log .0087
REFERENCES
Emrick, J. A. and Adams, E. N. An Evaluation Model for IndividualizedInstruction. Paper presented at the annual meeting of the AmericanEducational Research Association, Minneapolis, Minn., 1970.
Emrick, J. A. The Experimental Validation of an Evaluation Model forMastery Testing. Final Report: Pr6ject No. 0 -A-063; Grant No.OEG71-71-0002, U.S. Department of Health, Education, and Welfare,Office of Education, Washington, D.C., 1971.
Emrick, J. A. An Evaluation Model for Mastery Testing. Journal ofEducational Measurement, 1971, 8, 321-326.
52
APPENDIX B
CRITIQUE OF THE SIMPLIFYING ASSUMPTIONS IN USINGREGRESSION MODELS FOR ESTIMATING TRUE SCORES
FROM OBSERVED SCORES
James McBrideArmy Research Institute
Since R(Tlx) is not an unbiased estimator of T, the standard devia-tion of the error of estimate e is not the same as the conditionalstandard deviation of the true score for a given observed score. Thatis, if e is an error of estimate (T - T), then C2(Elx) = c2(Tlx) + bias2.Here, C2(Tlx) is the conditional variance of the true scores for givenobserved scores, which is the dist ibution portrayed in Figure 3 and usedfor inference to the misclassifica ion probabilities.
However, a2(clx) (or equivalen ly, q.2(E)) is then not the appro-priate variance unless there is no bias; that is, unless E(TIT) = T.And this latter relationship is generally not the case. Estimation ofclassification error probabilities using C2(E) as the conditional vari-ance would therefore be inappropriate.
Linear regression of T on x is a convenient simplifying assumption;but in actuality, the regression may often be nonlinear. Also, thedistribution of errors may seldom be normal--or even symmetrical; thesame holds true for the conditional distribution of T. In sum, theestimation of error probabilities from simplified linear regressionmodels may be considerably distorted due to the above complicatingfactors.
53
DISTRIBUTION
4 OASD (M&RA)2 HQDA (DAMICSZ)1 HQDA (DAPE-PBR1 HQDA (DAMA-AR)1 HQDA (DAPE-HRE-PO)1 HQDA (SGRD10)1 HQDA (DAMI-DOT-C)1 HQDA (DAPC-PMZ-A)1 HQDA (DACH-PPZ-A)1 HQDA (DAPE-HRE)1 HQDA (DAPE-MPO-C)1 HQDA (DAPE-DW)1- HQDA (DAPE-HRL)1 HQDA (DAPE-CPS)1 HQDA (DAFD-MFA)1 HQDA (DARD-ARS-P)1 HQDA (DAPC- PAS.A)1 HQDA (DUSA-OR)1 HQDA (DAMO-RQR)1 HQDA (DASG)1 HQDA (DA10-PI)1 Chief, Consult 'Div (DAOTSG), Adelphi, MD1 Mil Ant. Hum Res, ODDR&E, OAD (E&LS)1 HO USARAL, APO Seattle, ATTN: A RAGP-R1 HO First Army, ATTN: AFKA-01-112 HQ Fifth Army, Ft Sam Houston1 Dir, Army Stf Studies Ofc, ATTN: OAVCSA (DSP)1 Ofc Chief of Stf, Studies Ofc
DCSPER, ATTN: CPS/OCP1 The Army Lib, Pentagon, ATTN: RSB Chief1 The Army Lib, Pentagon, ATTN: ANRAL1 Ofc, Asst Sect of the Army (R &D)1 Teds Support Ofc, OJCS1 USASA, Arlington, ATTN: IARD-T1 USA Durham, ATTN: Life Sciences Dir2 *USARIEMatick, ATTN: SGRD-UE-CA1 USATTC, Ft Clayton, ATTN: STETC-MOA1 USAIMA, Ft Bragg, ATTN: ATSU-CTD-OM1 USAI MA, Ft Bragg, ATTN: Marquat Lib1 US WAC Ctr & Sch. Ft McClellan, ATTN: Lib1 US WAC Ctr & Sch, Ft McClellan, ATTN: Tng Dir1 USA Quartermaster Sch, Ft Lee, ATTN: ATSMTE
1 Intelligence Material Dev Ofc, EWL, Ft Holabird1 USA SE Signal Sch, Ft Gordon, ATTN: ATSO-EA1 .USA Chaplain Ctr & Sch, Ft Hamiltbn, ATTN: ATSC-TE-RD1 USATSCH, Ft Eustis, ATTN: Educ Advisor1 USA War College, Carlisle Barracks, ATTN: Lib2 WRAI R, Neuropsychiatry Div1 DLI, SDA, Monterey1 USA Concept Anal Agcy, Bethesda, ATTN: MOCA-WGC1 USA Concept Anal Agcy. Bethesda, ATTN: MOCA-MR1 USA Concept Anal Agcy, Bethesda, ATTN: MOCA-JF1 USA Artic Test Ctr, APO Seattle, ATTN: STEAC-MO-ASL1 USA Artic Test Ctr, APO Seattle, ATTN: AMSTE-PL-TS1 USA Armament Cmd, Redstone Arsenal, ATTN: ATSK-TEM1 USA Armament Cmd, Rock Island, ATTN: AMSAR-TDC1 FAAAFEC, Atlantic City. ATTN: Library1 FAA-NAFEC, Atlantic City. ATTN: Hum Engr Br1 FAA Aeronautical Ctr, Oklahoma City, ATTN: AAC-44D2 USA FId Arty Sch, Ft Sill, ATTN: Library1 USA Armor Sch, Ft Knox, ATTN? Library1 USA Armor Sch, Ft Knox, ATTN: ATSB01-E1 USA Armor Sch, Ft Knox, ATTN: ATSBDT-TP1 USA Armor Sch, Ft Knox. ATTN: ATSBCD-AD
ARI Distribution List
55
2 HQUSACDEC, Ft Ord, ATTN: Library1 HQUSACDEC, Ft Ord, ATTN: ATECEXEHum Factors2 USAEEC, Ft Benjamin Harrison, ATTN: Library1 USAPACDC, Ft Benjamin Harrison, ATTN: ATCPHR1 USA CommElect Sch, Ft Monmciuth, ATTN: ATSNEA1 USAEC, Ft Monmouth, ATTN: AMSELCTHDP1 USAEC, Ft Monmouth, ATTN: AMSELPAP1 USAEC, Ft Monmouth, ATTN: AMSELSICB1 USAEC, Ft Monmouth, ATTN: C, Fad Dev Br1 USA Materials Sys Arial Agcy, Aberdeen, ATTN: AMXSYP1 Edgbwood Arsenal, Aberdeen, ATTN: SAREABLH1 USA Ord Ctr & Sch, Aberdeen, ATTN: ATSLTEMC2 USA Hum Engr Lab, Aberdeen, ATTN: Library/Dir1 USA Combat Arms Tng Bd, Ft Benning, ATTN: Ad Supervisor1 USA Infantry Hum Rsch Unit, Ft Benning, ATTN: Chief1 USA Infantry Rd, Ft Benning, ATTN: STEBCTET1 USASMA, Ft Bliss, ATTN: ATSSLRC1 USA Air Def Sch, Ft Bliss, ATTN: ATSACTDME1 USA Air Def Sch, Ft Bliss, ATTN3Tech Lib1 USA Air Def Bd, Ft Bliss, ATTN: FILES
USA Air Def Bd, Ft Bliss, ATTN: STEBDPO1 USA Cmd & General Stf College, Ft Leavenworth, ATTN: Lib1 USA Cmd & General Stf College, Ft Leavenworth, ATTN: ATSWSEL1 USA Cmd & General Stf College, Ft Leavenworth, ATTN: Ed Advisor1 USA Combined Arms Cmbt Dev Act, Ft Leavenworth, ATTN: DepCdr1 USA Combined Arms Cmbt Dev Act, Ft4Leavenworth, ATTN: CCS1 USA Combined Arms Cmbt bey Act, Ft Leavenworth, ATTN: ATCASA1 USA Combined Arms Cmbt Dev Act, Ft Leavenworth, ATTN: ATCACOE1 USA Combined Arms Cmbt Dev Act, Ft Leavenworth, ATTN: ATCACCC11 USAECOM, Night Vision Lab, Ft Belvoir, ATTN: AMSELNVSD3 USA-Computer Sys Cmd, Ft Belvoir, ATTN: Tech Library1 USAMERDC, Ft Belvoir, ATTN: STSFBDQ1 USA Eng Sch, Ft Belvoir, ATTN: Library1 USA Topographic Lab, Ft Belvoir, ATTN: ETLTDS1 USA Topographic Lab, Ft Belvoir, ATTN: STINFO Center
j 1 USA Topographic Lab, Ft Belvoir, ATTN: ETLGSL1 ,USA Intelligence Ctr & Sch, Ft Huachuca, ATTN: CTDMS1 USA Intelligence Ctr & Sch, Ft Huachuca, ATTN: ATSCTDMS1 USA Intelligence Ctr & Sch, Ft Huachuca, ATTN: ATSITE1 USA Intelligence Ctr & Sch, Ft Huachuca, ATTN: ATSITEXGS1 USA Intelligence Ctr & Sch, Ft Huachuca, ATTN: ATSICTSOR1 USA Intelligence Ctr & Sch, Ft Huachuca, ATTN: ATSICTDDT1 USA Intelligence Ctr & Sch, Ft Huachuca, ATTN: ATSICTDCS1 USA Intelligence Ctr & Sch, Ft Huachuca, ATTN: DAS/SRO1 USA Intelligence Ctr & Sch, Ft Huachuca, ATTN: ATSITEM1 USA Intelligence Ctr & Sch, Ft Huachuca, ATTN: Library1 CDR, HQ Ft Huachuca, ATTN: Tech Ref Div2 CDR, USA Electronic Prvg Grd, ATTN: STEEPMTS1 CDR, Project MASSTER, ATTN: Tech Info Center1 Hq MASSTER, USATRADOC, LNO1 Research Institute, HQ MASSTER, Ft Hood1 USA Recruiting Cmd, Ft Sherdian, ATTN: USARCPM P
1 Senior Army Adv., USAFAGOD/TAC, Elgin AF Aux Fld No. 91 HQ USARPAC, DCSPER, AFO SF 96558, ATTN: GPPESE1 Stimson Lib, Academy of Health Sciences, Ft Sam Houston1 Marine Corps Inst., ATTN: DeanMCI1 HQUSMC, Commandant, ATTN: Code MTMT 511 HQUSMC, Commandant, AT, N: Code MPI -202 USCG Academy, New London, ATTN: Admission2 USCG Academy, New London, ATTN: Library1 USCG Training Ctr, NY, ATTN: CO1 USCG Traiting Ctr, NY, ATTN: Educ Svc Ofc1 USCG, Psychol Res Br, DC, ATTN: GP 1/621 HQ MidRange Br, MC Det, Quantico, ATTN: P&S Div
1 U$ Marine Corps Liaision Ofc, AMC, Alexandria, ATTN: AMCGSF1 USATRADOC, Ft Monroe, ATTN: ATROED6 USATRADOC, Ft Monroe, ATTN: ATPRAD1 USATRADOC, Ft Monroe, ATTN: ATTSEA1 USA Forces Cmd, Ft McPherson, ATTN: Library2 USA Aviation Test Bd, Ft Rucker, ATTN: STEBGPO1 USA Agcy for Aviation Safety, Ft Rucker, ATTN: Library1 USA Agcy for Aviation Safety, Ft Rucker, ATTN: Educ Advisor1 USA Aviation Sch, Ft Rucker, ATTN: PO Drawer 01 HOUSA Aviation Sys Cmd, St Louis, ATTN: AMSAVZDR
2 USA AvlitIon Sys Test Act., Edwards AFB, ATTN: SAVTET1 USA Air Def Sch, Ft Bliss, ATTN: ATSA TEM1 USA Air Mobility Rsch & Dev Lab, Moffett Fld, ATTN: SAVDLAS1 USA Aviation Sch, Res Tng Mgt, Ft Rucker, ATTN: ATSTTRTM1 USA Aviation Sch, CO, Ft Rucker, ATTN: ATSTDA1 HO, DARCOM, Alexandria, ANN: AMXCDTL1 HO, DARCOM, Alexandria, ATTN: CDR1 US Military Academy, West Point, ATTN: Serials Unit1 US Military Academy, West Point, ATTN: Ofc of Milt Ldrshp1 US Military Academy, West Point, ATTN: MAOR1 USA Standardization Gp, UK, FPO NY, ATTN: MASEGC1 Ofc of Naval Rsch, Arlington, ATTN: Code 4523 Ofc of Naval Rsch, Arlington, ATTN: Code 4581 Ofc,of Naval Rsch, Arlington, ATTN: Code 4501 Ofc of Naval Rsch, Arlington, ATTN: Code 4411 Naval Aerospc Med Res Lab, Pensacola, ATTN: Acous Sch Div1 Naval Aerospc Med Res Lab, Pensacola, ATTN: Code L511 Naval Aerospc Med Res Lab, Pensacola, ATTN: Code L51 Chief of NavPers, ATTN: PersOFI1 NAVAIRSTA, Norfolk, ATTN: Safety Ctr1 Nay Oceanographic, DC, ATTN: Code 6251, Charts & Tech1 Center of Naval Anal, ATTN: Doc Ctr1 NavAirSysCom, ATTNt AIR-5313C1 Nay BuMed, ATTN: 7131 NavHelicopterSubSqua 2, FPO SF 966011 AFHRL (FT) William AFB1 AFHRL (TT) Lowry AFB1 AFHRL (AS) WPAFB, OH2 AFHRL (DOJZ) Brooks AFB1 AF.HRL (DOJN) Lackland AFB1 HOUSAF (INYSD)1 HOUSAF (DPXXA)1 AFVTG (RD) Randolph AFB3 AMR L (HE)'WPAFB, 01-I2 AF Inst of Tech, WPAFB, OH, ATTN: ENE/SL1 ATC (XPTD) Randolph AFB1 USAF AeroMed Lib, Brooks AFB (SUL-4), ATTN: DOC SEC1 AFOSR (NL), Arlington1 AF Log Cmd, McClellan AFB, ATTN: ALC/DPCRB1 Air Force Academy, CO, ATTN: Dept of Bel Scn5 NavPers & Dev Ctr, San Diego2 Navy Med Neuropsychiatric Rsch Unit, San Diego1 Nay Electronic Lab, San Diego, ATTN: Res Lab1 Nay TrngCen, San Diego, ATTN: Code 9000Lib
1 NavPostGraSch, Monterey, ATTN: Code 55Aa1 NavPostGraSch, Monterey, ATTN: Code 21241 NavTrngEquipCtr, Orlanio, ATTN: Tech Lib
..-- 1 US Dept of Labor, DC, ATTN: Manpower Admin1 US Dept of Justice, DC, ATTN: Drug Enforce Admin1 Nat Bur of Standards, DC, ATTN: Computer Info Section1 Nat Clearing House for MHInfo, Rockville1 Denver Federal Ctr, Lakewood, ATTN: BLM
12 Defense Documentation Center4 Dir Psych, Army Hq, Russell Ofcs, Canberra1 Scientific Advsr, Mil Bd, Army 1-lq, Russell Ofcs,.Canberra
1 Mil and Air Attache, Austrian Embassy1 Centre de Recherche bes Facteurs, Humaine de la Defense
Nationale, Brussels2 Canadian Joint Staff Washington1 C/Air Staff, Royal Canadian AF, ATTN: Pers Std Anal Br3 Chief, Canadian Def Rsch Staff, ATTN: C/CRDS(W)4 British Def Staff, British Embassy, Washington
56
1 Def & Civil Inst of Enviro Medicine, Canada1 AIR CRESS, Kensington, ATTN: Info Sys Br1 Militaerpsykologisk Tjeneste, Copehagen1 Military Attache, French Embassy, ATTN: Doc Sec1 Medecin Chef, C.E.R.P.A.Arsenal, Toulon/Naval France1 Prin Scientific Off, Appl Hum Engr Rsch Div, Ministry .
of Defense, New Delhi1 Pers Rsch Ofc Library, AKA, Israel Defense Forces1 Ministeris van Defensie, DOOP/KL Afd Sociaal
Psychologise/se Zaken, The Hague, Netherlands

,