Embed Size (px)
Citation preview
User Manual
ch
1.ADMINISTRATION
1.1 User Management...............2
1.2 Project Management.............10
1.3 My Profile........................................................................................................................................16
1.4 Currency Settings............................................................................................................................24
1.5 Access Management........................................................................................................................28
2.COST ANALYSIS
2.1 Import..............................................................................................................................................30
2.2 Cost Estimate...................................................................................................................................38
2.3 Uncertainty Register........................................................................................................................48
2.4 Risk Register(Risks)........................................................................................................................53
2.5 Risk Register(Mappings).................................................................................................................59
[email protected]: 1-877-4PM-RISK (1-877-576-7475)http://www.prcsoftware.com
PRC COST SIMULATOR
2.6 Advanced (Custom Field)...............................................................................................................63
2.7 Advanced (Correlation)...................................................................................................................66
2.8 Reports.............................................................................................................................................76
2.9 Dashboard........................................................................................................................................93
1
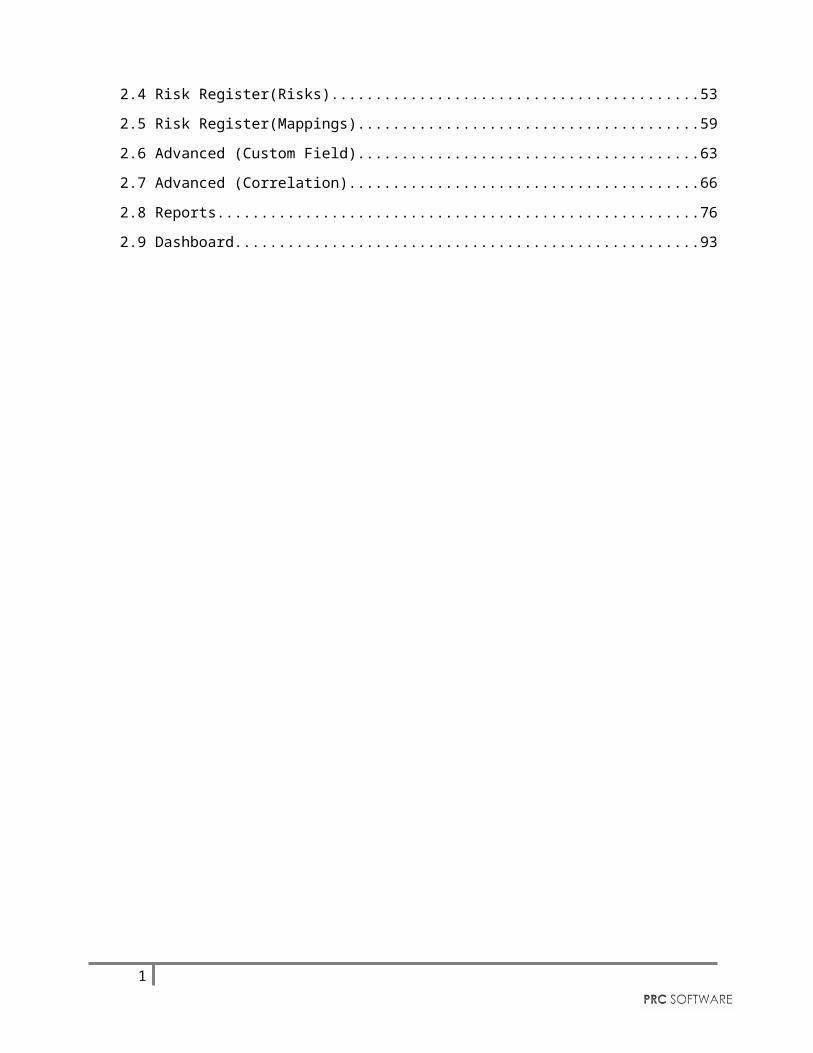
1. ADMINISTRATION
1.1 User Management
User Management section in the PRC Simulator can be viewed only by those users who have either Read/Write or View Only Access. Users with only Read/Write access can create a new user, edit users, add a project for a selected user, delete a user, un-assign a project to a user, and change the access privileges of users.
Users designated with View Only Access may view specific pages, select a user, view user details and view projects assigned. Access to editing functions is not available to these users.
Figure 1.1
1.1.1 Creating a New User:
Creating a new user in the PRC Simulator is quick and easy. Enter as much information as possible about the user, when a new user is created. The Landing Page sets the first page the user sees upon login.
2
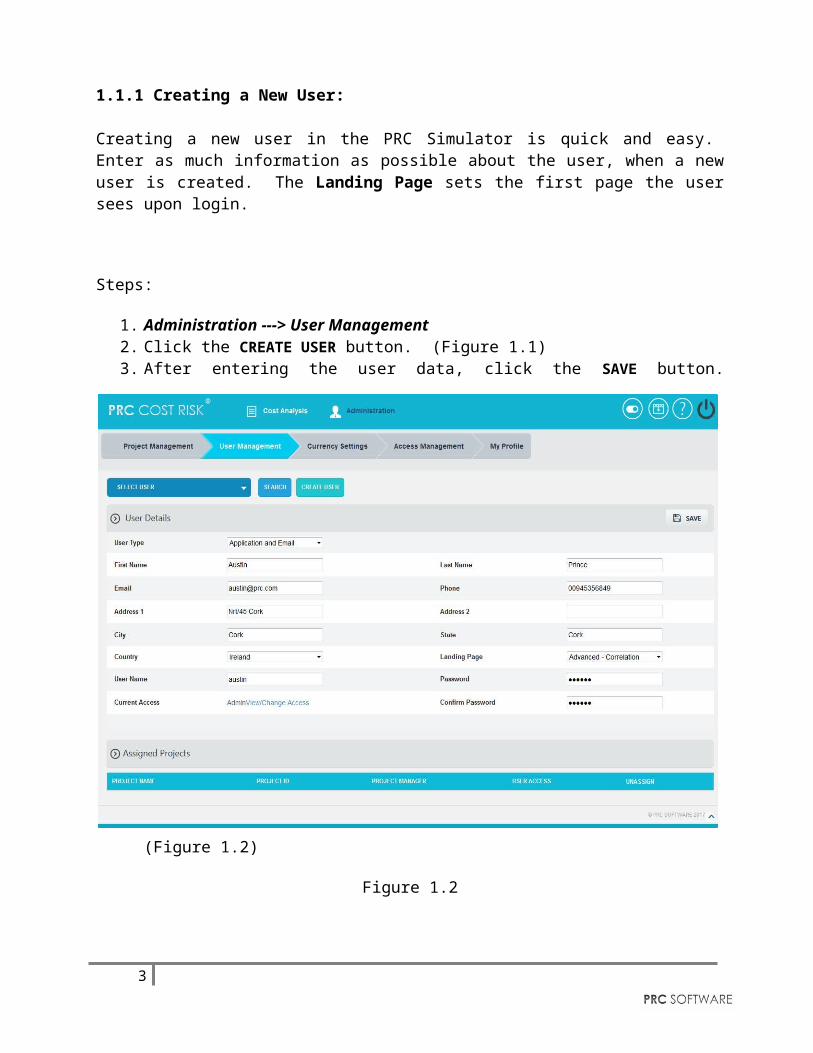
Steps:
1. Administration ---> User Management2. Click the CREATE USER button. (Figure 1.1)3. After entering the user data, click the SAVE button. (Figure 1.2)
Figure 1.2
1.1.2 Editing user information:
When editing user details in the PRC Simulator, all the fields are unlocked and user can modify all user details as needed.
Steps:
1. Administration ---> User Management2. Select the required user from SELECT USER dropdown whose details has to be modified.
(Figure 1.2)3. Click the EDIT button. (Figure 1.1)4. After the data is modified, click the SAVE button. (Figure 1.2)
3
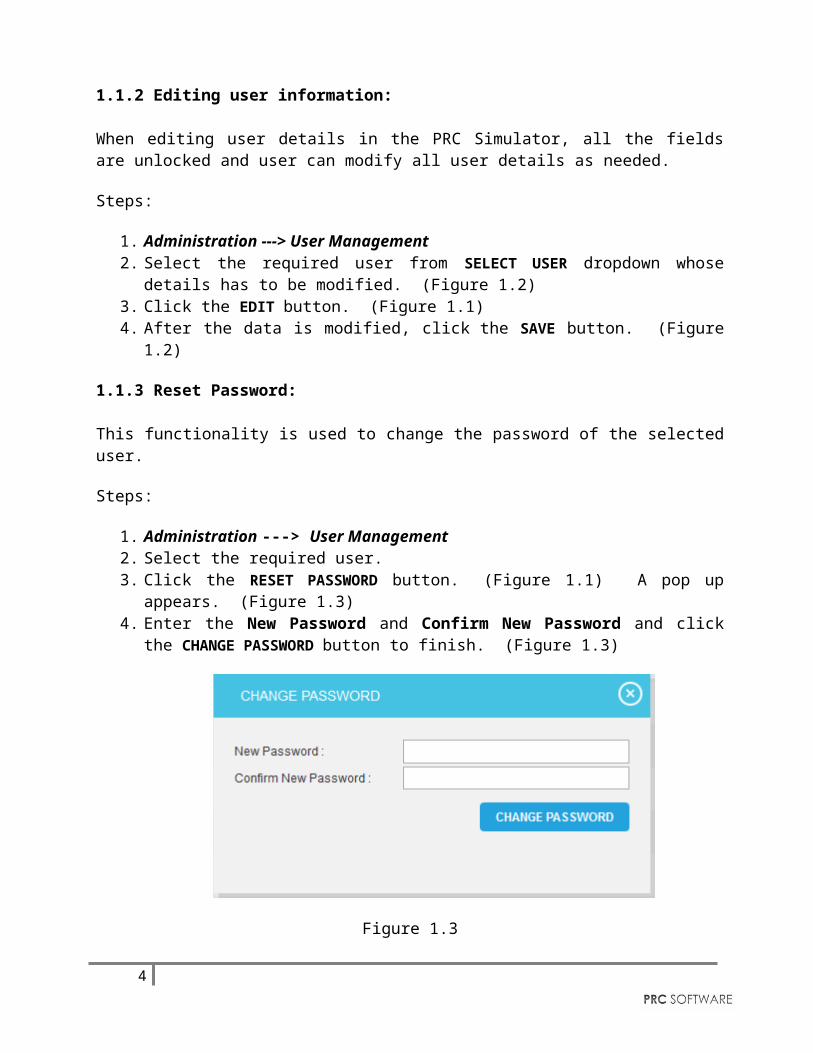
1.1.3 Reset Password:
This functionality is used to change the password of the selected user.
Steps:
1. Administration ---> User Management2. Select the required user.3. Click the RESET PASSWORD button. (Figure 1.1) A pop up appears. (Figure 1.3) 4. Enter the New Password and Confirm New Password and click the CHANGE
PASSWORD button to finish. (Figure 1.3)
Figure 1.3
1.1.4 Assign New Project to User:
This functionality helps to assign projects to a selected user. The Project is selected directly and assigned to the user.
Steps:
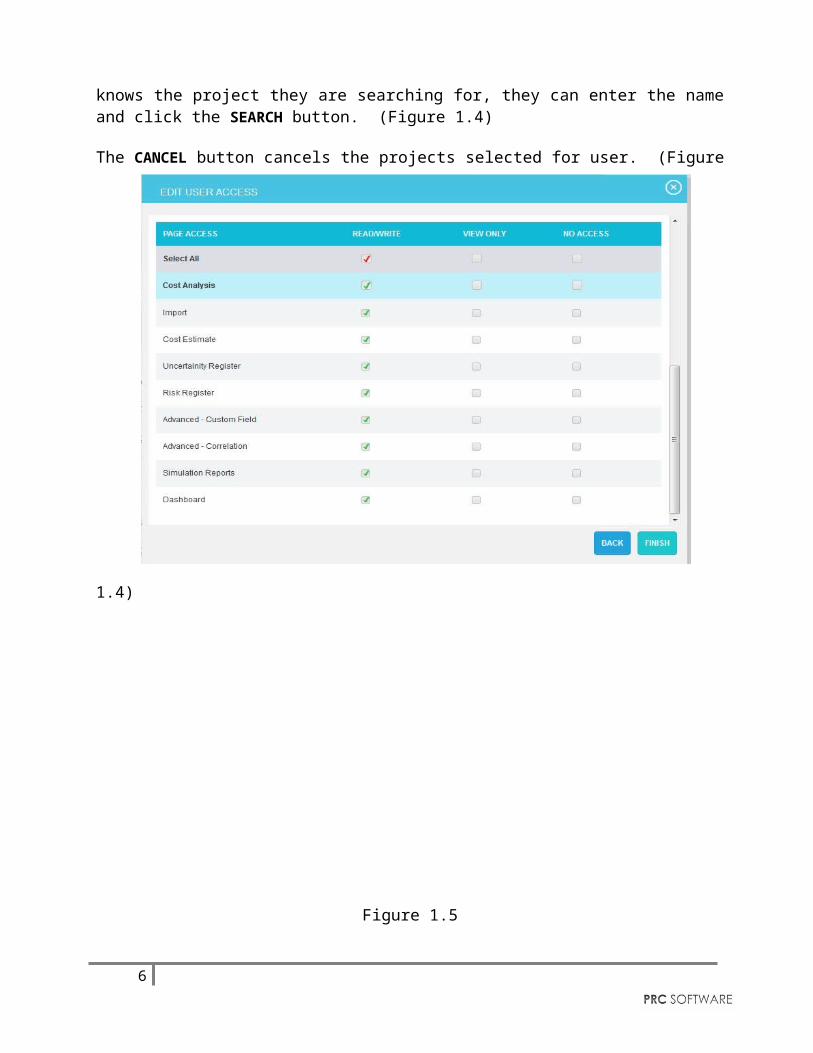
1. Administration ---> User Management2. Select the required user from SELECT USER dropdown. (Figure 1.2)3. Click the ASSIGN PROJECT TO USERS button. (Figure 1.1)4. Search for project and Select. (Figure 1.4)5. To continue, click the NEXT STEP button. (Figure 1.4) A pop up (Figure 1.5) from which
user access can be set.6. After modifying access, click the FINISH button (Figure 1.5) to save changes
4
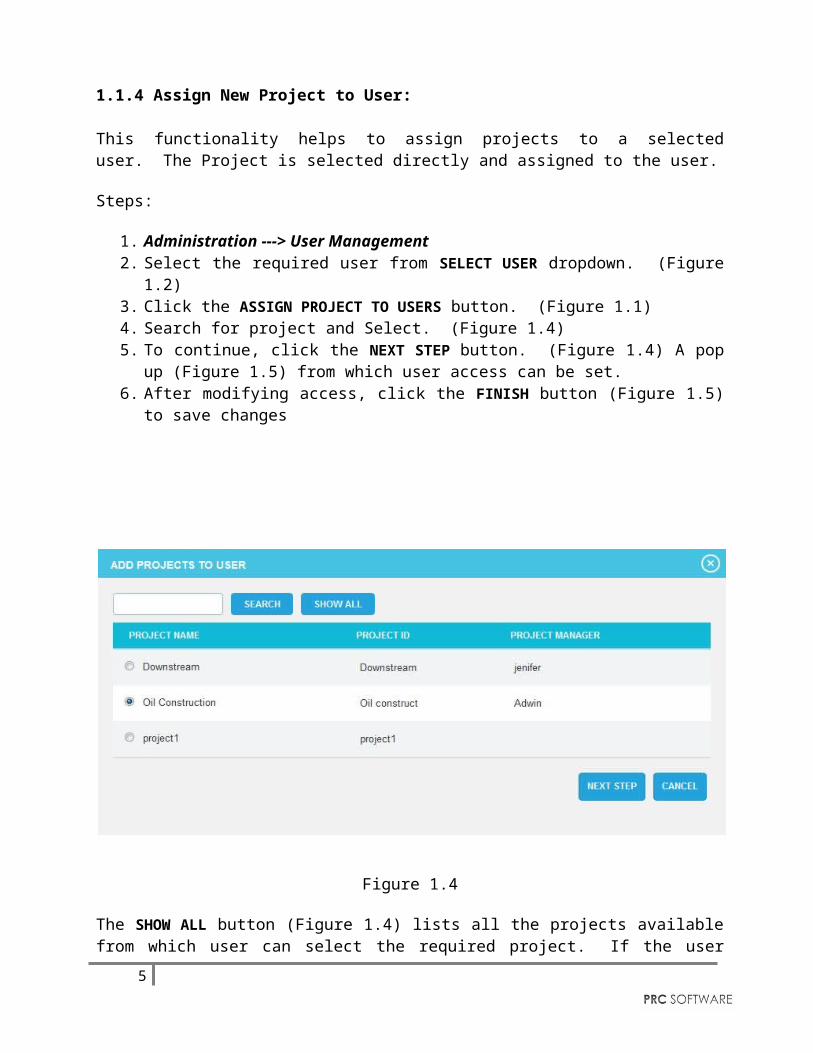
Figure 1.4
The SHOW ALL button (Figure 1.4) lists all the projects available from which user can select the required project. If the user knows the project they are searching for, they can enter the name and click the SEARCH button. (Figure 1.4)
The CANCEL button cancels the projects selected for user. (Figure 1.4)
Figure 1.5
5
1.1.5 View / Edit Access:
In order to view or edit individual project’s user access, click VIEW/EDIT icon (Figure 1.1) under the Assigned Project section.Steps:
1. Administration ---> User Management2. Select the required user from SELECT USER dropdown. (Figure 1.2)3. Click the VIEW/EDIT icon to view or edit individual project’s user access.4. After modifying access in the pop up appears, click the FINISH button to save changes.
(Figure 1.5)
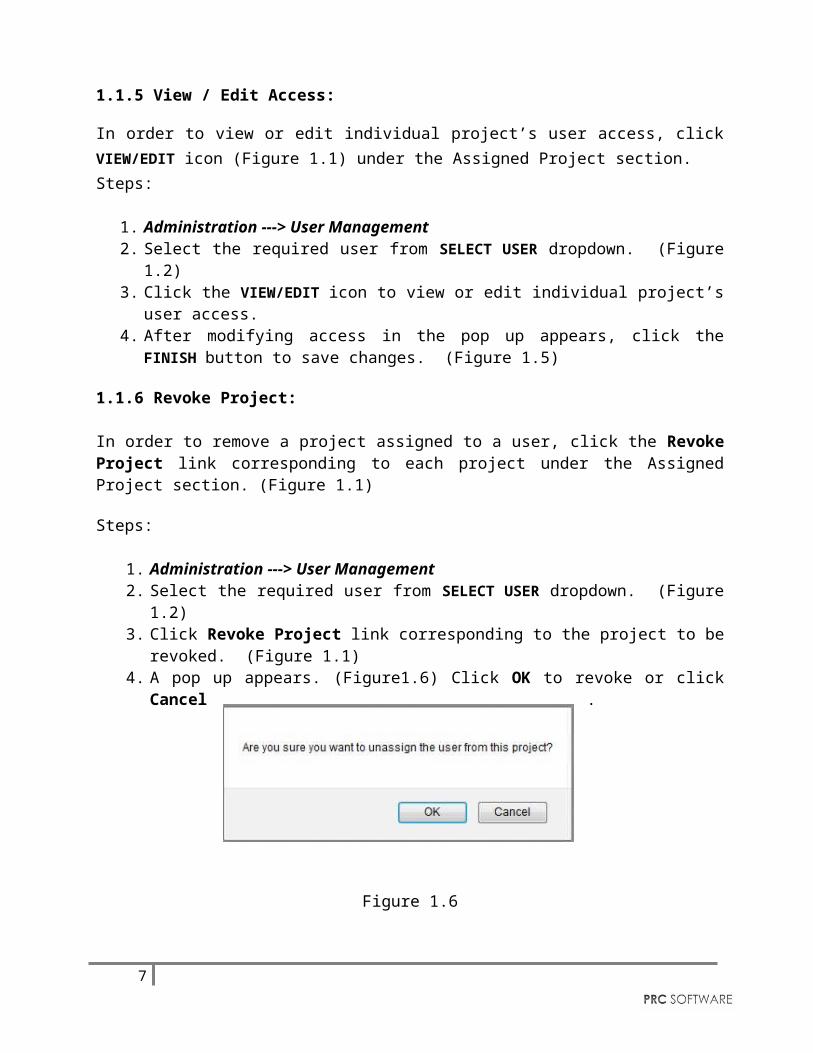
1.1.6 Revoke Project:
In order to remove a project assigned to a user, click the Revoke Project link corresponding to each project under the Assigned Project section. (Figure 1.1)
Steps:
1. Administration ---> User Management2. Select the required user from SELECT USER dropdown. (Figure 1.2)3. Click Revoke Project link corresponding to the project to be revoked. (Figure 1.1) 4. A pop up appears. (Figure1.6) Click OK to revoke or click Cancel.
Figure 1.6
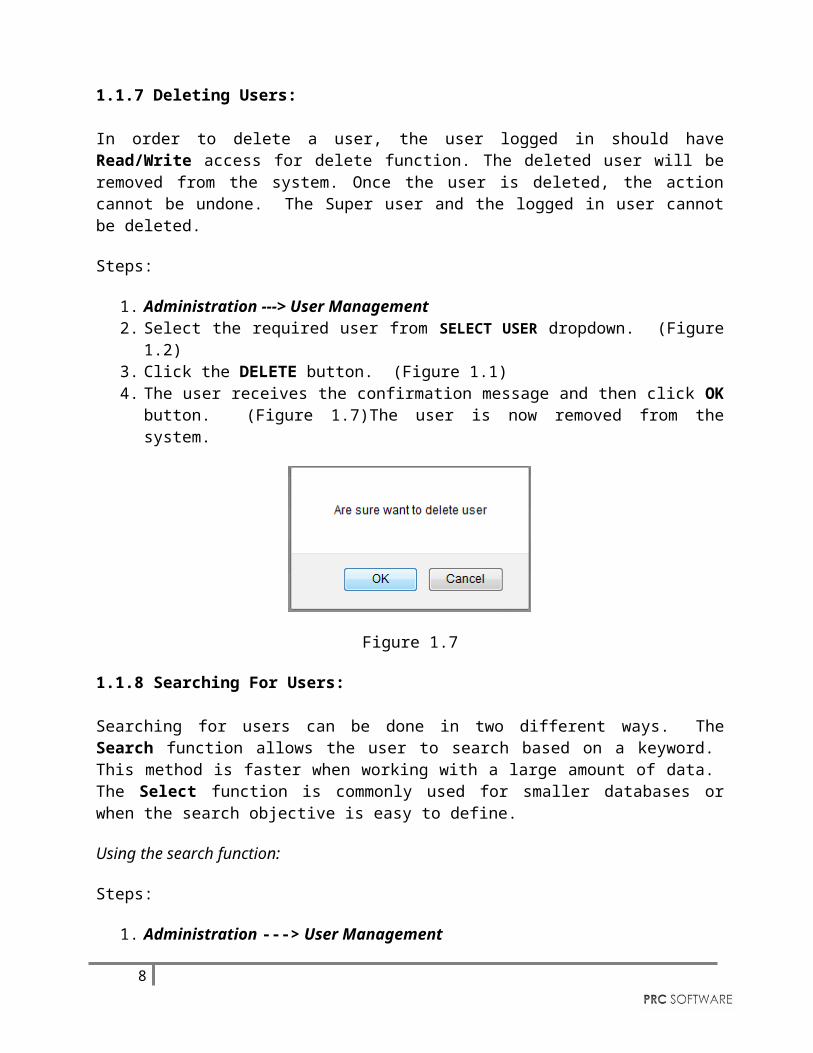
1.1.7 Deleting Users:
In order to delete a user, the user logged in should have Read/Write access for delete function. The deleted user will be removed from the system. Once the user is deleted, the action cannot be undone. The Super user and the logged in user cannot be deleted.
Steps:
1. Administration ---> User Management2. Select the required user from SELECT USER dropdown. (Figure 1.2)3. Click the DELETE button. (Figure 1.1)
6
4. The user receives the confirmation message and then click OK button. (Figure 1.7)The user is now removed from the system.
Figure 1.7
1.1.8 Searching For Users:
Searching for users can be done in two different ways. The Search function allows the user to search based on a keyword. This method is faster when working with a large amount of data. The Select function is commonly used for smaller databases or when the search objective is easy to define.
Using the search function:
Steps:
1. Administration ---> User Management2. Click the SEARCH button. (Figure 1.2)3. Enter the name (which can be either first name or last name or both) or user name. Click
the SEARCH button and select the required user. (Figure 1.8)4. The SHOW ALL button in the search area lists all users available. (Figure 1.8)
Figure 1.8
7
Using the select function (dropdown list):
Steps:
1. Administration ---> User Management2. Click the SELECT USER dropdown. (Figure 1.2)3. Select the required user from the list shown.
1.1.9 Current Access:
This functionality helps to view/change the user access to all the pages by assigning a particular role to the user.
Steps:
1. Administration ---> User Management2. Select the required user from SELECT USER dropdown. (Figure 1.2)3. Click the EDIT button. (Figure 1.1)4. Click View/Change Access link. (Figure 1.2) A pop up appears. (Figure 1.9)5. Select a role from the Select Role dropdown and click ASSIGN ROLE button. (Figure 1.9)
8
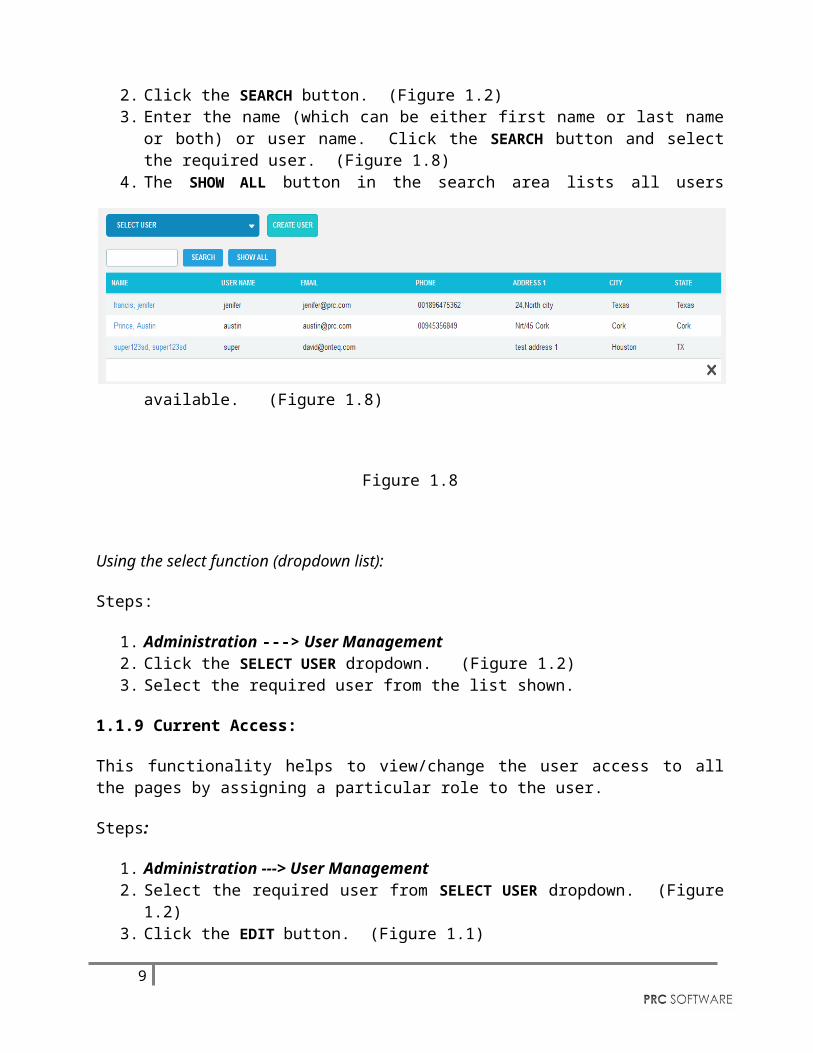
Figure 1.9
1.1.10 User Type:
This functionality is used to create user based on the user types such as, Application and Email, Application only and Email only.
Application and Email: Allows the user to access the application and also allows sending and receiving emails.
Application only: Allows the user to access only the application.
Email only: Allows the user to receive only email to access the application data.
Steps:
1. Administration ---> User Management2. Select the user & click Edit Button. (Figure 1.1)3. Click the User Type dropdown and select type. (Figure 1.10)4. Click the SAVE button. (Figure 1.10)
9
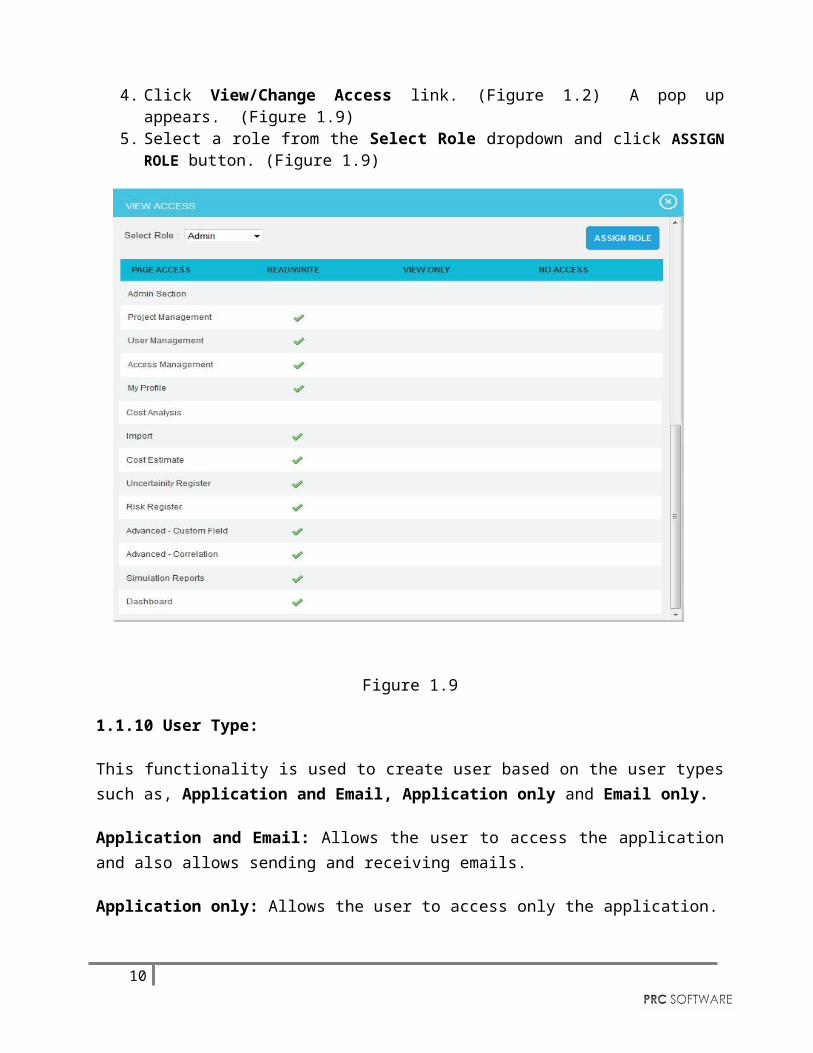
Figure 1.10
1.2 Project ManagementThe Project Management section can be viewed only by those users who have either Read/Write or View Only Access. Users with Read/Write access can create new projects, edit projects, add users to a selected project, delete a project, remove a user, and change the access
10
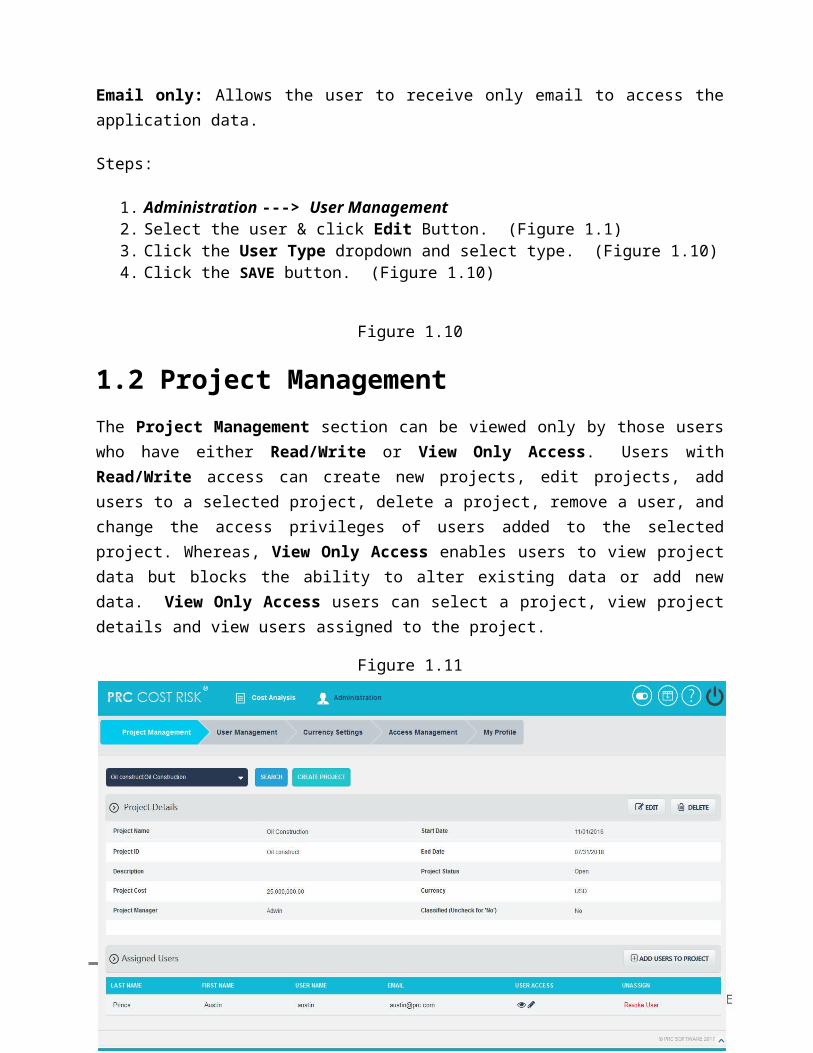
privileges of users added to the selected project. Whereas, View Only Access enables users to view project data but blocks the ability to alter existing data or add new data. View Only Access users can select a project, view project details and view users assigned to the project.
Figure 1.11
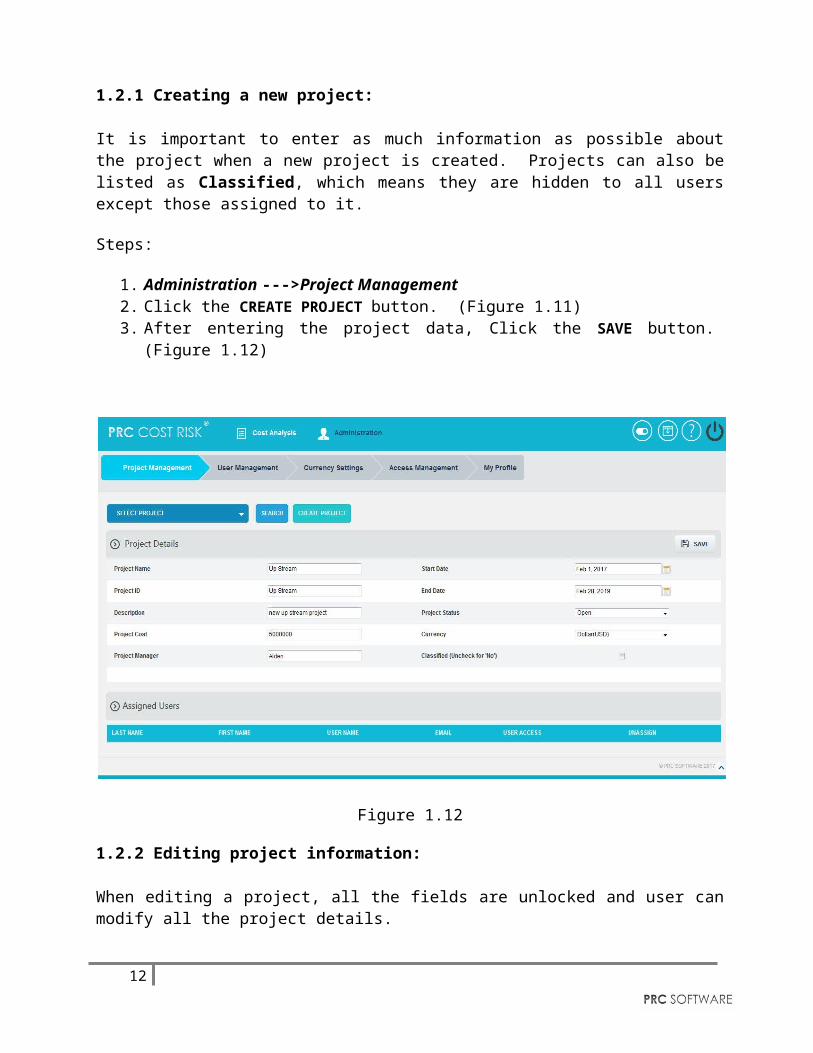
1.2.1 Creating a new project:
It is important to enter as much information as possible about the project when a new project is created. Projects can also be listed as Classified, which means they are hidden to all users except those assigned to it.
Steps:
1. Administration --->Project Management2. Click the CREATE PROJECT button. (Figure 1.11)3. After entering the project data, Click the SAVE button. (Figure 1.12)
Figure 1.12
1.2.2 Editing project information:
When editing a project, all the fields are unlocked and user can modify all the project details.
11
Steps:
1. Administration --->Project Management2. Click the EDIT button. (Figure 1.11)3. After the data is modified, Click the SAVE button. (Figure 1.12)
1.2.3 Add users to Project:
This functionality helps to assign a user to the selected project.
Steps:
1. Administration ---> Project Management2. Select the required project from SELECT PROJECT dropdown. (Figure 1.11)3. Click the ADD USERS TO PROJECT button. (Figure 1.11)4. A pop up appears from which the user can be searched and selected. (Figure 1.13)5. To continue, click the NEXT STEP button. (Figure 1.13) A pop up (Figure 1.14) appears
from which user access can be set.6. After modifying access, click the FINISH button to save changes or click BACK button
to go back. (Figure 1.14)
Figure 1.13
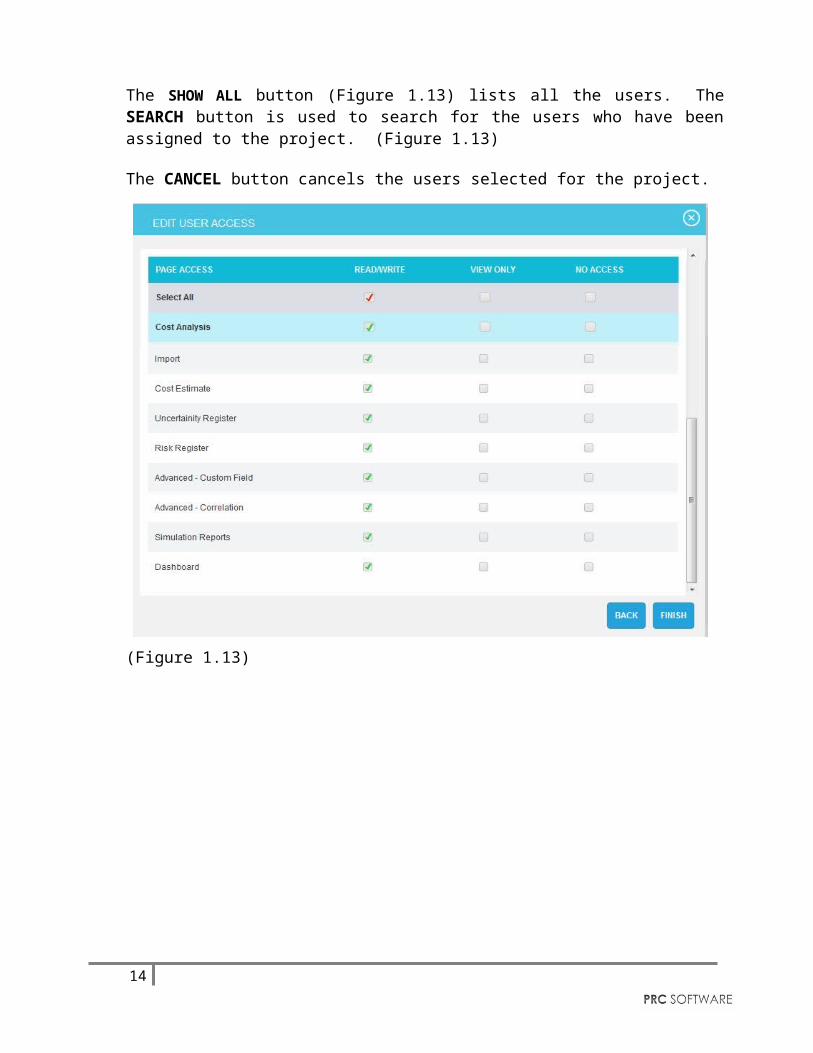
The SHOW ALL button (Figure 1.13) lists all the users. The SEARCH button is used to search for the users who have been assigned to the project. (Figure 1.13)
12
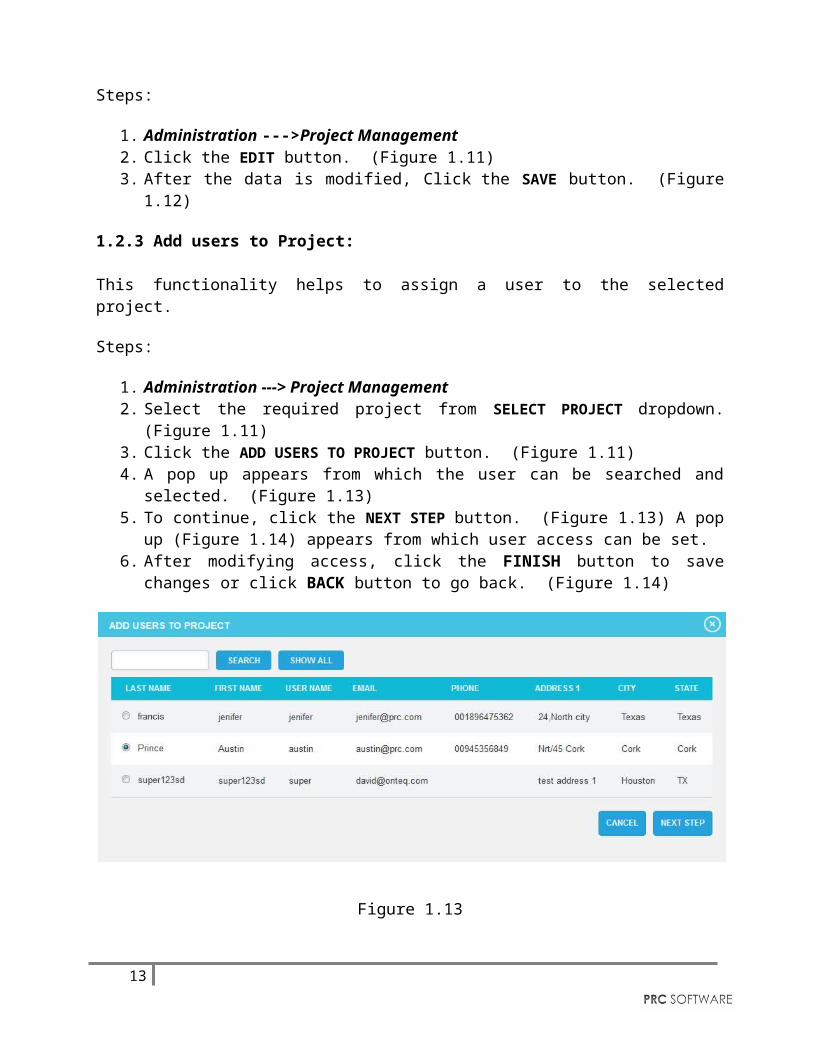
The CANCEL button cancels the users selected for the project. (Figure 1.13)
Figure 1.14
1.2.4 View / Edit Access:
In order to view or modify the accesses of a user assigned to project, click VIEW/EDIT icon (Figure 1.11) under the Assigned Users section.
Steps:
1. Administration ---> Project Management2. Select the required project from SELECT PROJECT dropdown. (Figure 1.12)3. Click the VIEW/EDIT icon corresponding to a user to view or edit the accesses to the
selected project. (Figure 1.11)4. After modifying access in the pop up appears, click the FINISH button (Figure 1.14) to
save changes.
13
1.2.5 Revoke User:
In order to remove a user assigned to a project, click the Revoke User link corresponding to each user under the Assigned User section. (Figure 1.10)
Steps:
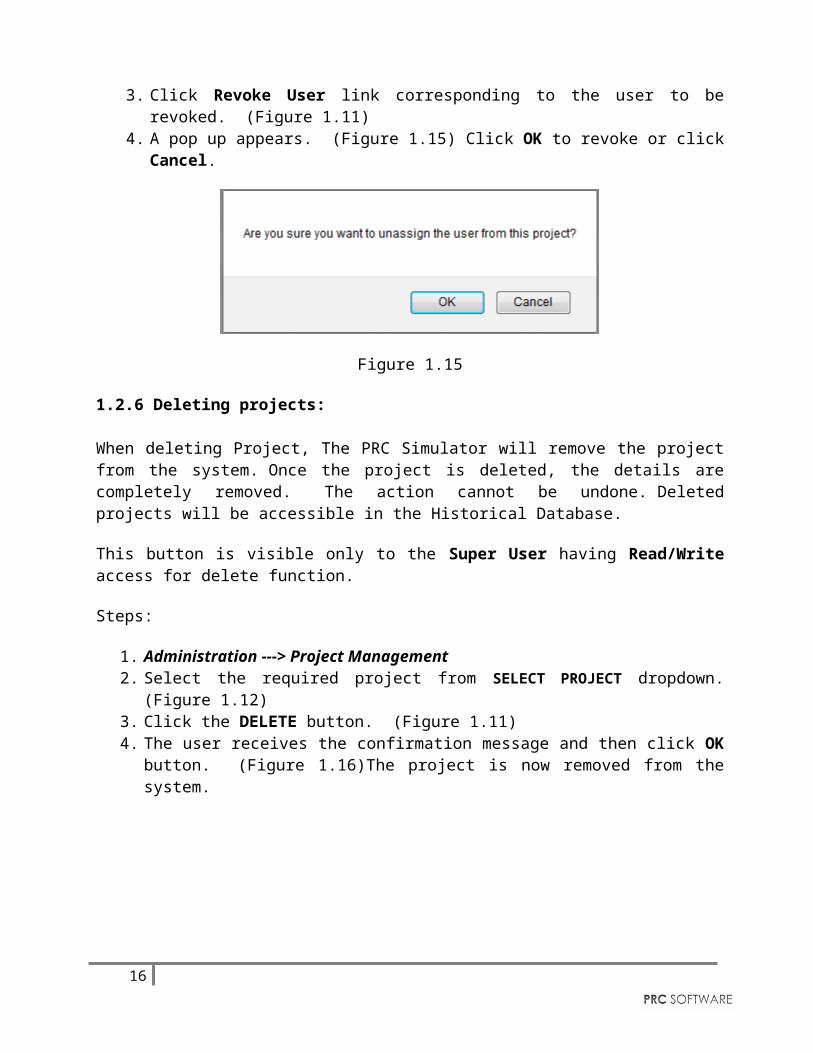
1. Administration --->Project Management2. Select the required project from SELECT PROJECT dropdown. (Figure 1.12)3. Click Revoke User link corresponding to the user to be revoked. (Figure 1.11) 4. A pop up appears. (Figure 1.15) Click OK to revoke or click Cancel.
Figure 1.15
1.2.6 Deleting projects:
When deleting Project, The PRC Simulator will remove the project from the system. Once the project is deleted, the details are completely removed. The action cannot be undone. Deleted projects will be accessible in the Historical Database.
This button is visible only to the Super User having Read/Write access for delete function.
Steps:
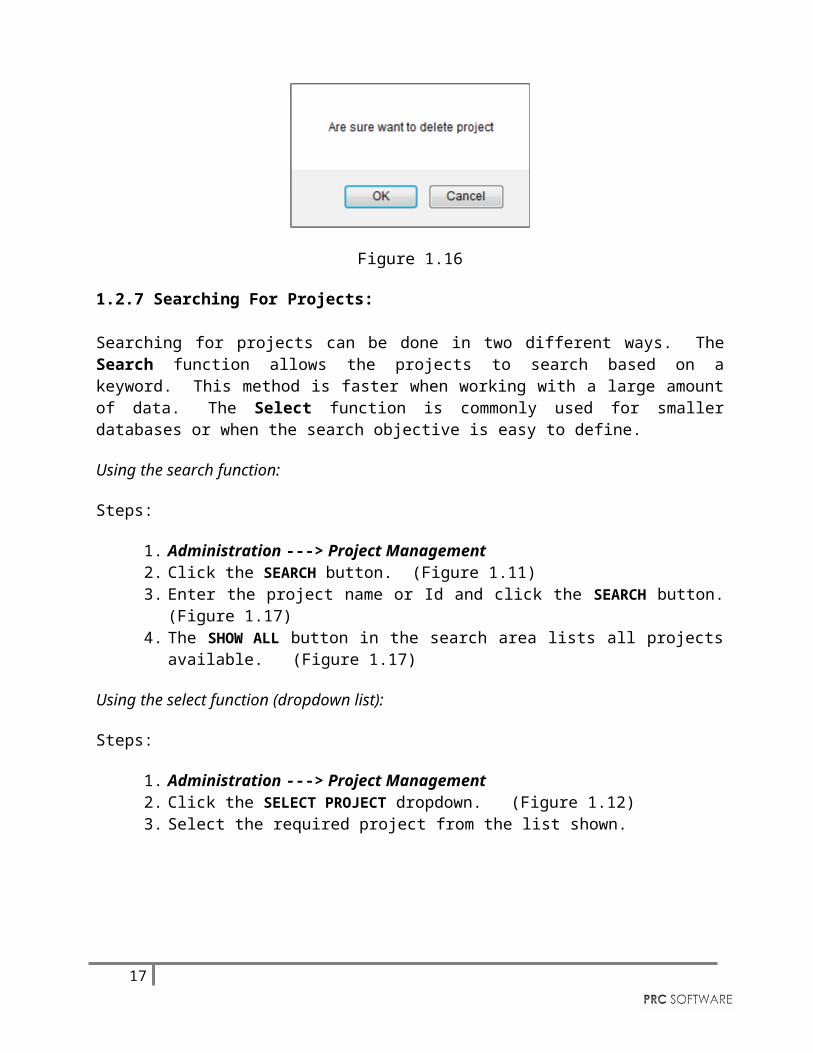
1. Administration ---> Project Management2. Select the required project from SELECT PROJECT dropdown. (Figure 1.12)3. Click the DELETE button. (Figure 1.11) 4. The user receives the confirmation message and then click OK button. (Figure 1.16)The
project is now removed from the system.
14
Figure 1.16
1.2.7 Searching For Projects:
Searching for projects can be done in two different ways. The Search function allows the projects to search based on a keyword. This method is faster when working with a large amount of data. The Select function is commonly used for smaller databases or when the search objective is easy to define.
Using the search function:
Steps:
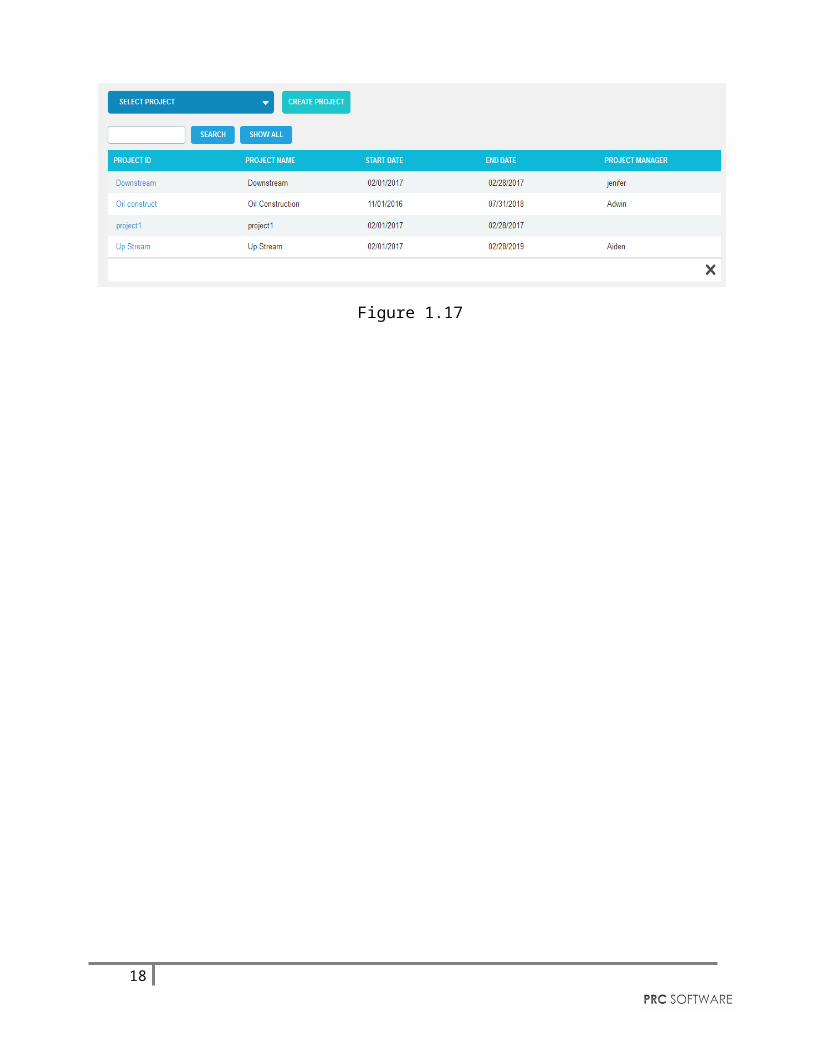
1. Administration ---> Project Management 2. Click the SEARCH button. (Figure 1.11)3. Enter the project name or Id and click the SEARCH button. (Figure 1.17)4. The SHOW ALL button in the search area lists all projects available. (Figure 1.17)
Using the select function (dropdown list):
Steps:
1. Administration ---> Project Management2. Click the SELECT PROJECT dropdown. (Figure 1.12)3. Select the required project from the list shown.
Figure 1.17
15
16
1.3 My Profile
The My Profile page allows the users to manage their own user account. Not all fields can be edited in this page due to security reasons.
Figure 1.18
1.3.1 Edit User Account:
This functionality is used to edit the user details. Only the fields Email, Default Project, Default Scenario, Date Format, Default Currency, Application Timeout, URL for Mail and Landing Page are unlocked.
17
Default Project: The user can set the default project. This is the default project which will appear when the Cost Analysis menu is selected.
Default Scenario: The user can set the default scenario for the project. This displays all the scenarios which created for the project.
Date Format: The logged-in user can change the Date format for the application.
Default Currency: The user can set the Default Currency for the application.
Application Timeout: The user can set the Default time-out or session log-out time of the application.
URL for Mail: The user can set the application URL which will be enclosed in the email.
Landing Page: The user can set the default page shown when logging in.
Steps:
1. Administration --->My Profile2. Click the EDIT button. (Figure 1.18)3. Modify the necessary fields, and click the SAVE button to finish. (Figure 1.19)
18

Figure1.19
1.3.2 View Access:
This functionality is used to view the accesses assigned to the user. To view the access, click View Access. (Figure 1.18) A pop up appears which shows the accesses for each page. (Figure 1.20)
19
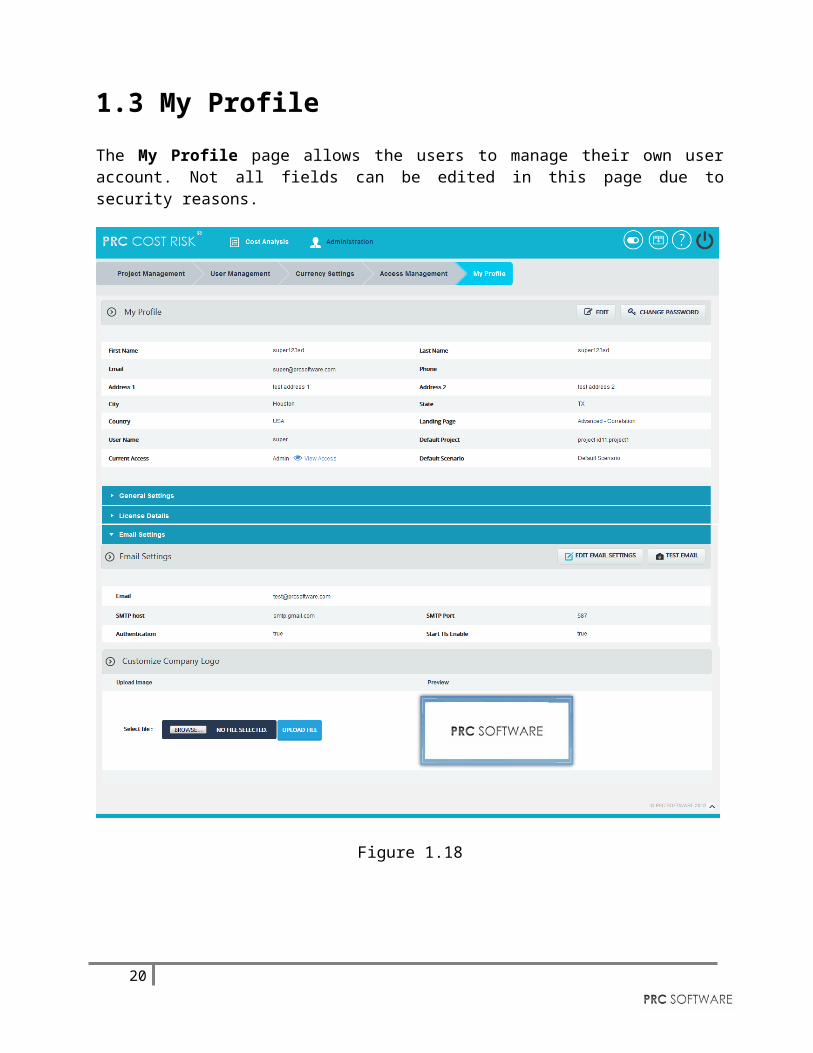
Figure 1.20
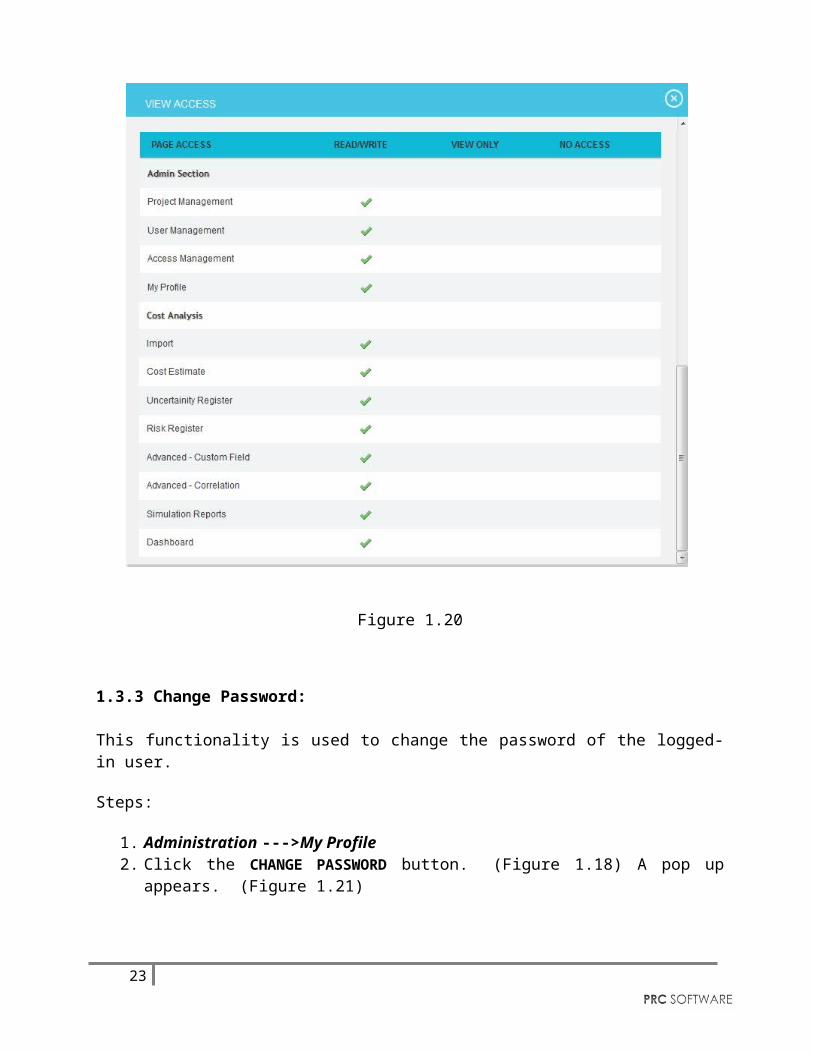
1.3.3 Change Password:
This functionality is used to change the password of the logged-in user.
Steps:
1. Administration --->My Profile2. Click the CHANGE PASSWORD button. (Figure 1.18) A pop up appears. (Figure 1.21)3. Enter the New Password and Confirm New Password and click the CHANGE
PASSWORD button in the pop up to finish. (Figure 1.21)
20
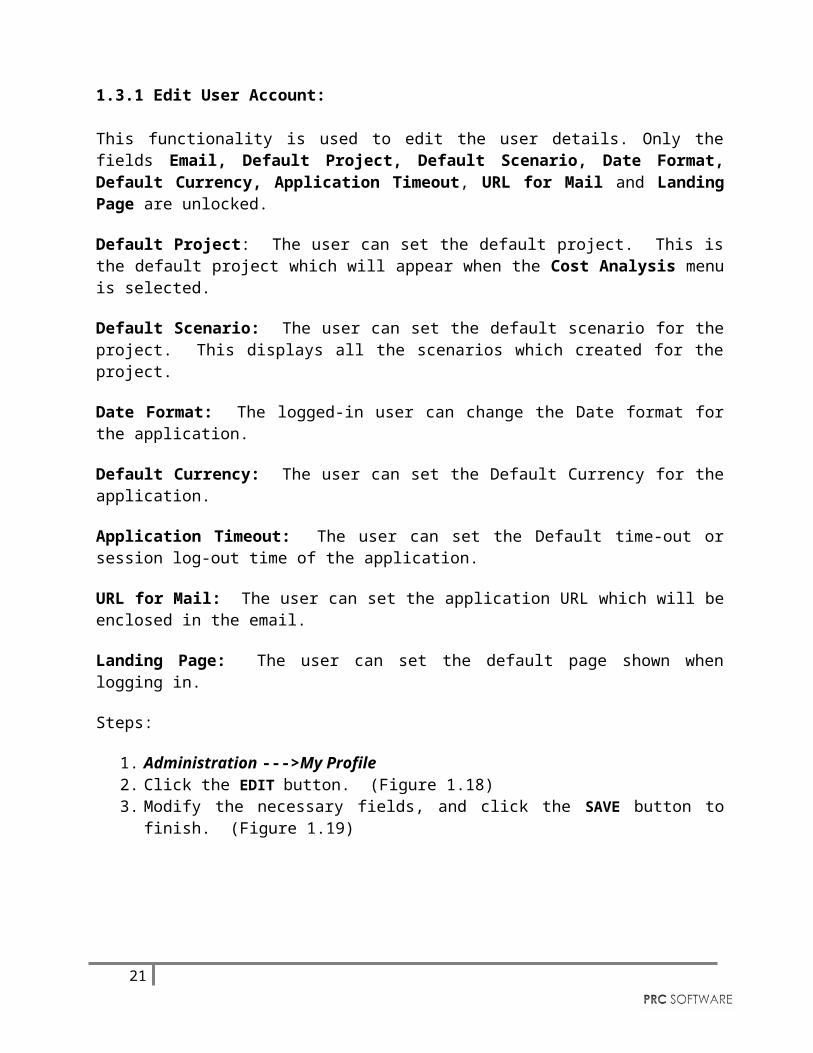
Figure 1.21
1.3.4 General Settings:
This functionality is used to set the default parameters for application. With the exception of the date format, all other settings will only be visible to the Super User. (Figure 1.22)
Figure 1.22
Date Format:
The logged-in user can change the Date format for the application.
Default Currency:
The Super User can set the Default Currency for the application.
Application Timeout:
The Super User can set the Default time-out of the application.
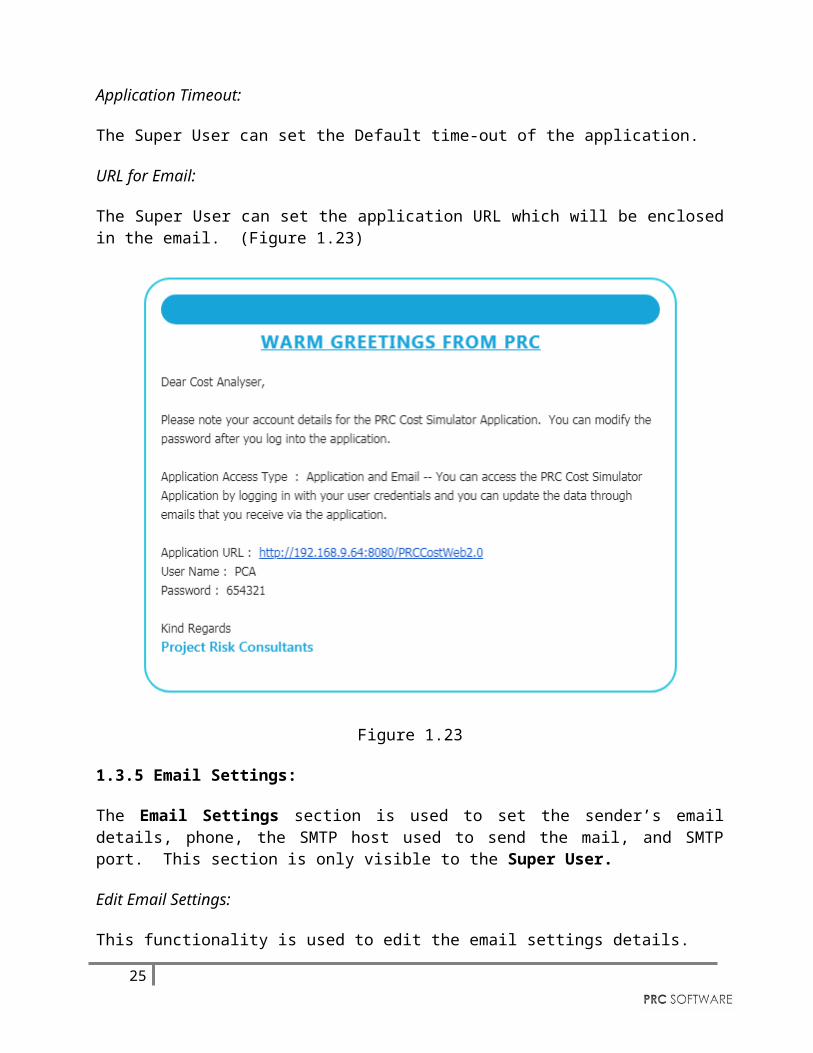
URL for Email:
The Super User can set the application URL which will be enclosed in the email. (Figure 1.23)
21
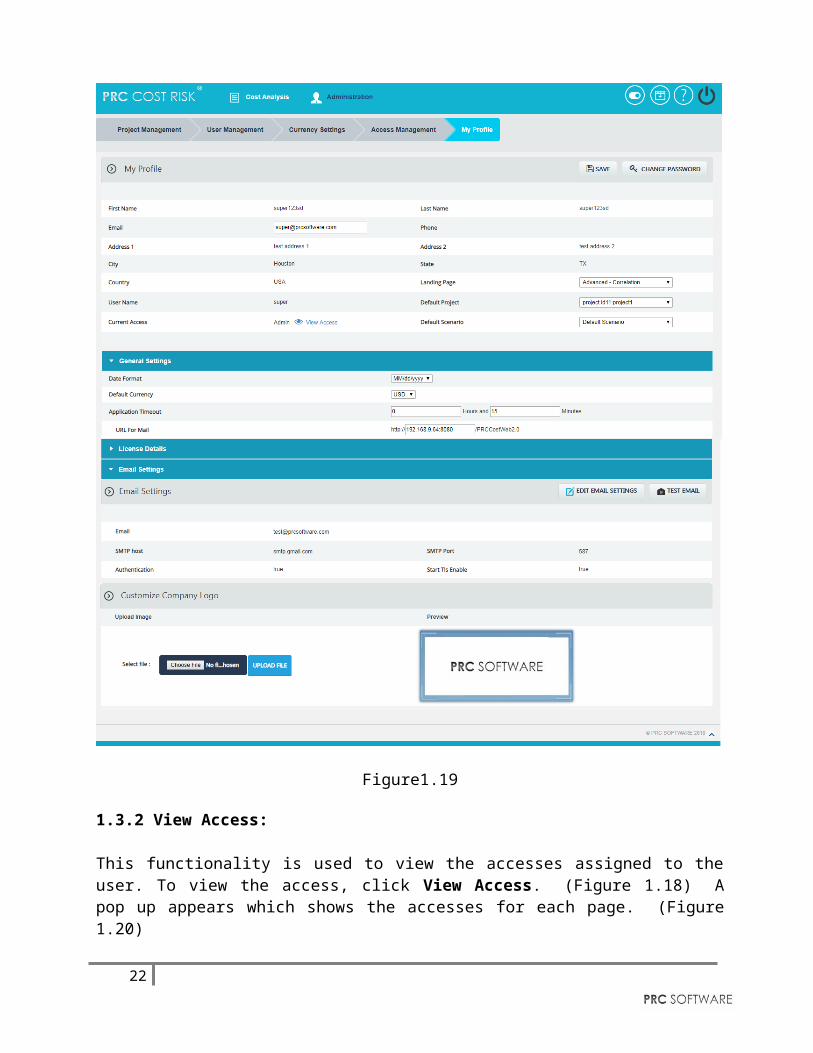
Figure 1.23
1.3.5 Email Settings:
The Email Settings section is used to set the sender’s email details, phone, the SMTP host used to send the mail, and SMTP port. This section is only visible to the Super User.
Edit Email Settings:
This functionality is used to edit the email settings details.
Steps:
1. Administration ---> My Profile 2. Click the EDIT EMAIL SETTINGS button. (Figure 1.18)3. Modify the required fields, and click the SAVE button to finish.
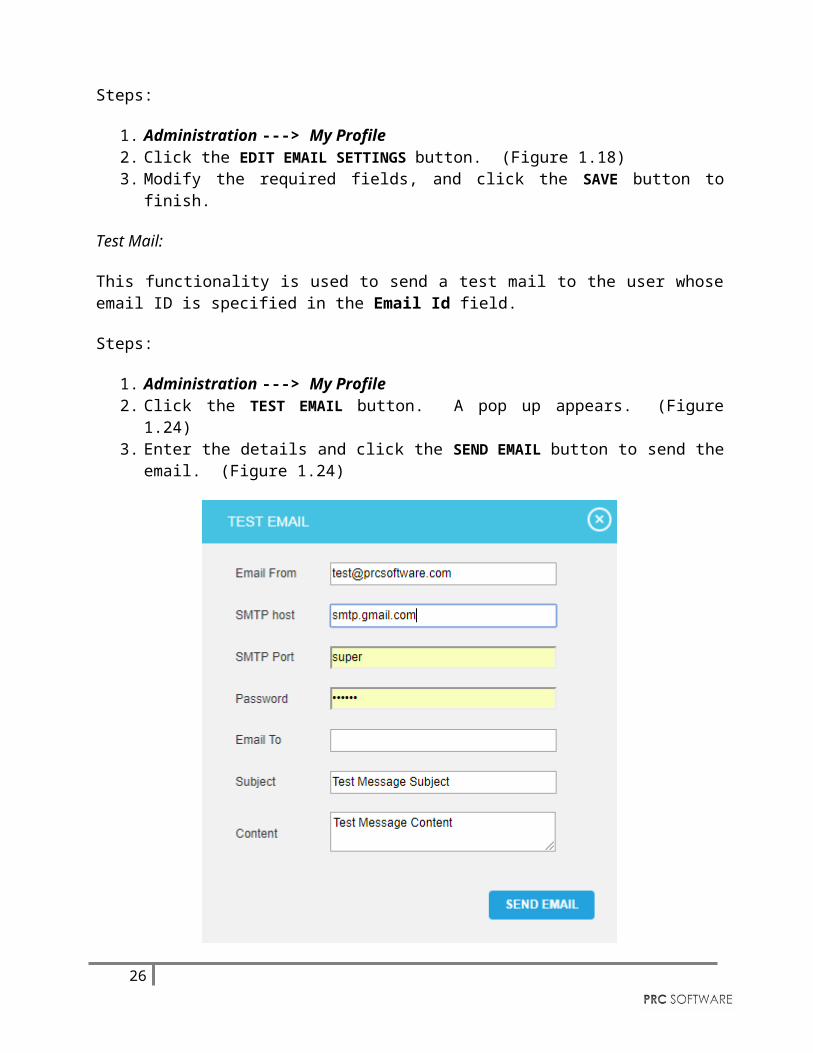
Test Mail:
This functionality is used to send a test mail to the user whose email ID is specified in the Email Id field.
22
Steps:
1. Administration ---> My Profile 2. Click the TEST EMAIL button. A pop up appears. (Figure 1.24)3. Enter the details and click the SEND EMAIL button to send the email. (Figure 1.24)
Figure 1.24
1.3.6 Company Logo:
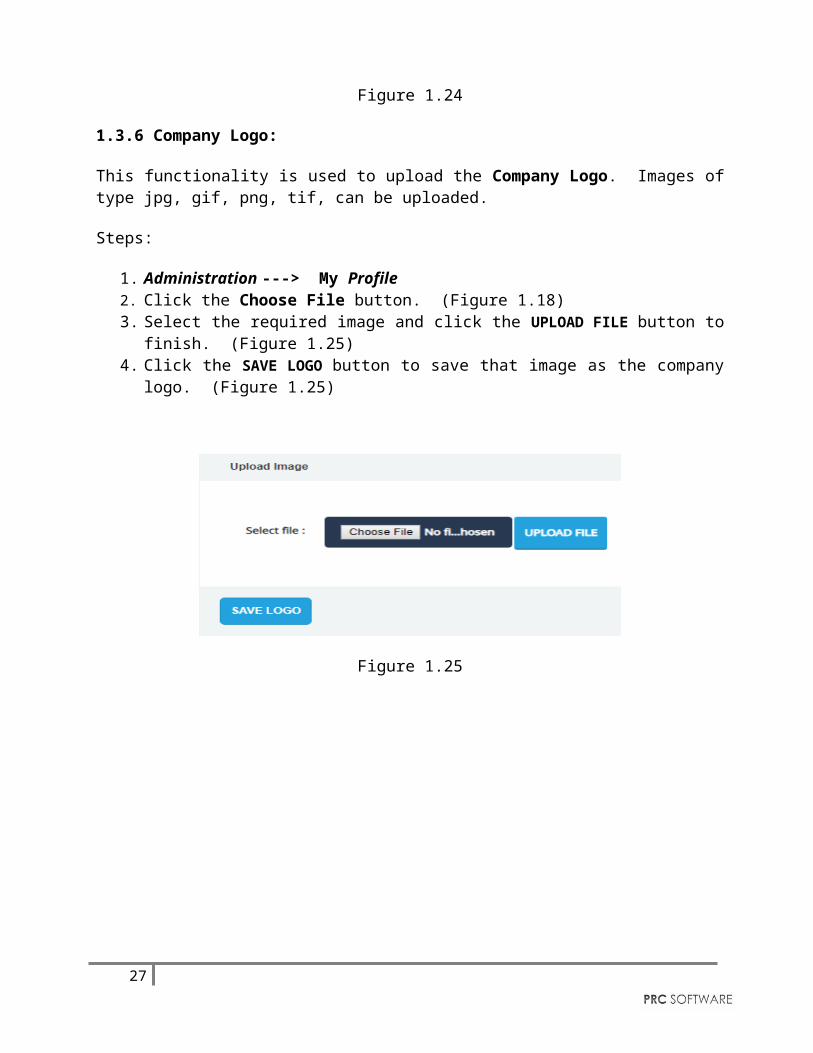
This functionality is used to upload the Company Logo. Images of type jpg, gif, png, tif, can be uploaded.
Steps:
1. Administration ---> My Profile 2. Click the Choose File button. (Figure 1.18)3. Select the required image and click the UPLOAD FILE button to finish. (Figure 1.25)4. Click the SAVE LOGO button to save that image as the company logo. (Figure 1.25)
23
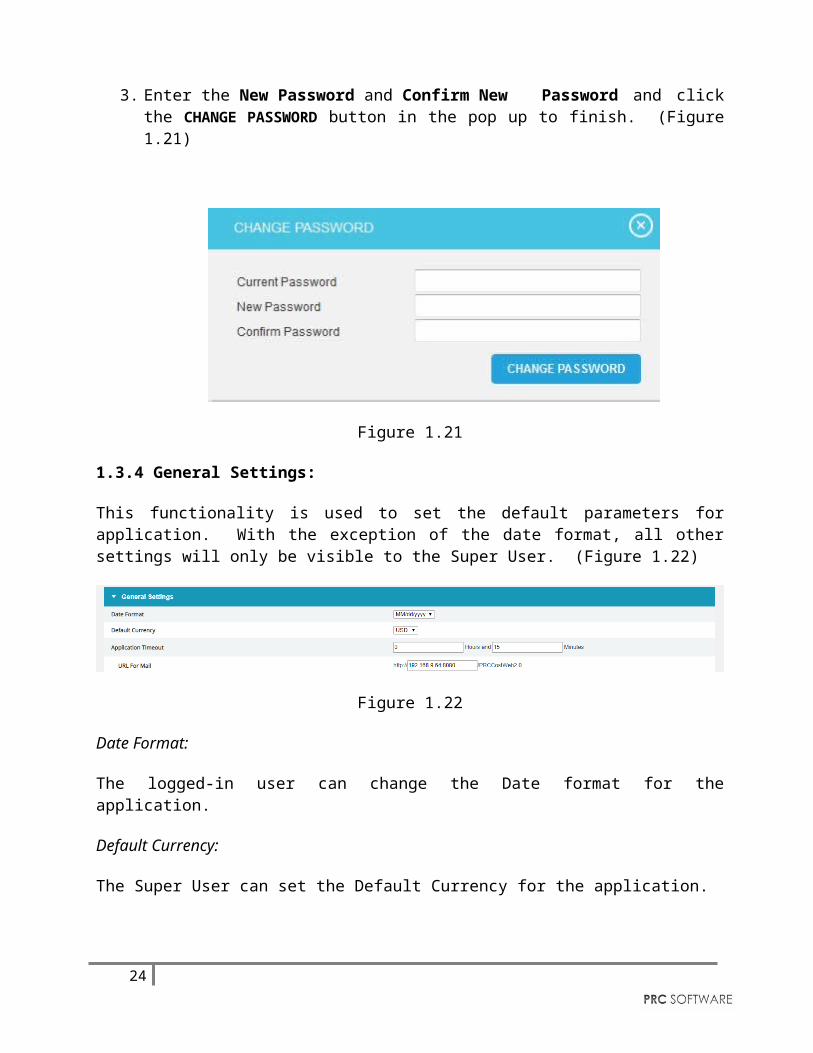
Figure 1.25
24
1.4 Currency Settings
The Currency settings page is used to set the desired currency for the PRC Simulator application. This page can be viewed or edited only by the super user.
Figure 1.26
1.4.1 Update All:
The UPDATE ALL button is to update all the currency details added in the application for which the Auto Update is on.
Steps:
1. Administration ---> Currency Settings2. Click the UPDATE ALL button to update all the currency details. (Figure 1.26)
1.4.2 Update:
The Update icon is used to update each currency details separately, for which the Auto Update is on.
Steps:
1. Administration ---> Currency Settings2. Click the Update icon to update each currency details separately. (Figure 1.26)
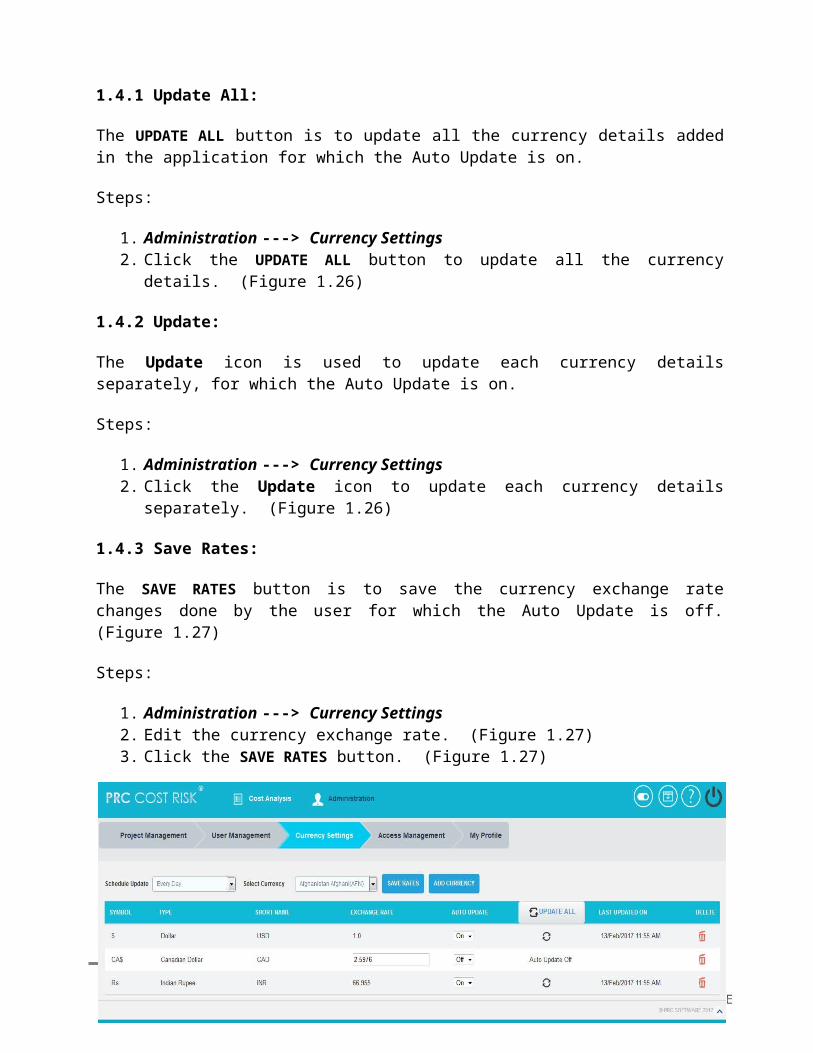
1.4.3 Save Rates:
25
The SAVE RATES button is to save the currency exchange rate changes done by the user for which the Auto Update is off. (Figure 1.27)
Steps:
1. Administration ---> Currency Settings2. Edit the currency exchange rate. (Figure 1.27)3. Click the SAVE RATES button. (Figure 1.27)
Figure 1.27
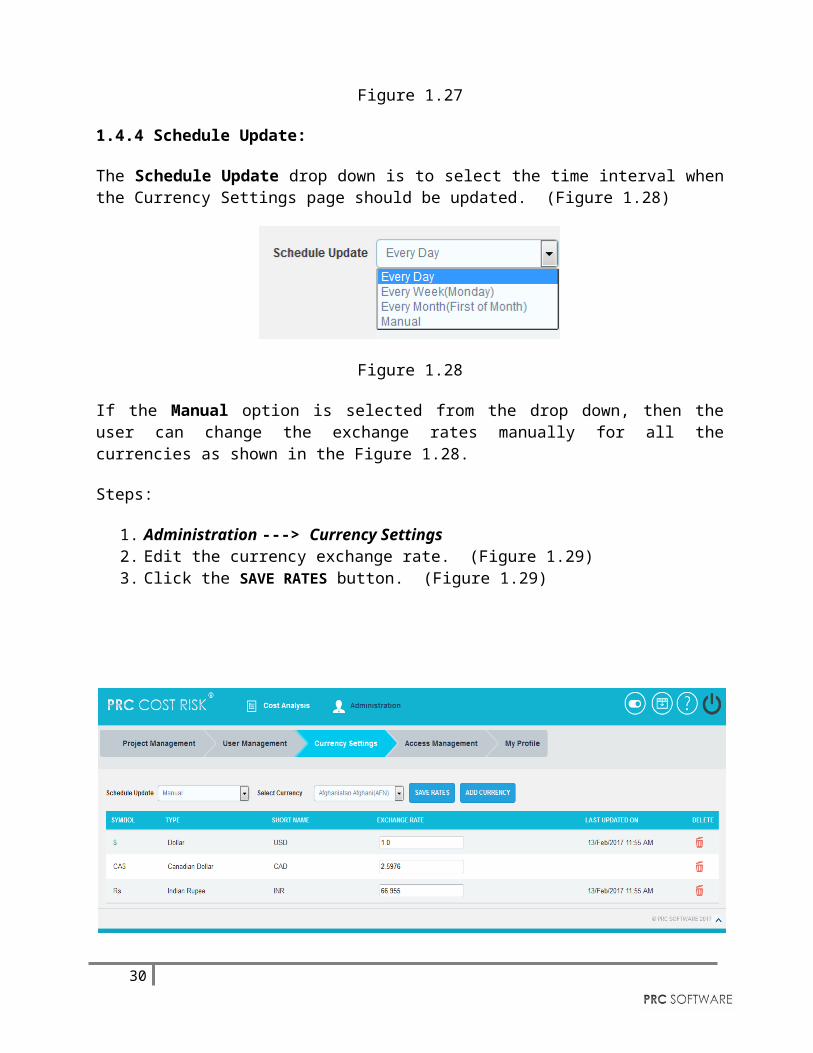
1.4.4 Schedule Update:
The Schedule Update drop down is to select the time interval when the Currency Settings page should be updated. (Figure 1.28)
Figure 1.28
If the Manual option is selected from the drop down, then the user can change the exchange rates manually for all the currencies as shown in the Figure 1.28.
Steps:
1. Administration ---> Currency Settings
26
2. Edit the currency exchange rate. (Figure 1.29)3. Click the SAVE RATES button. (Figure 1.29)
Figure 1.29
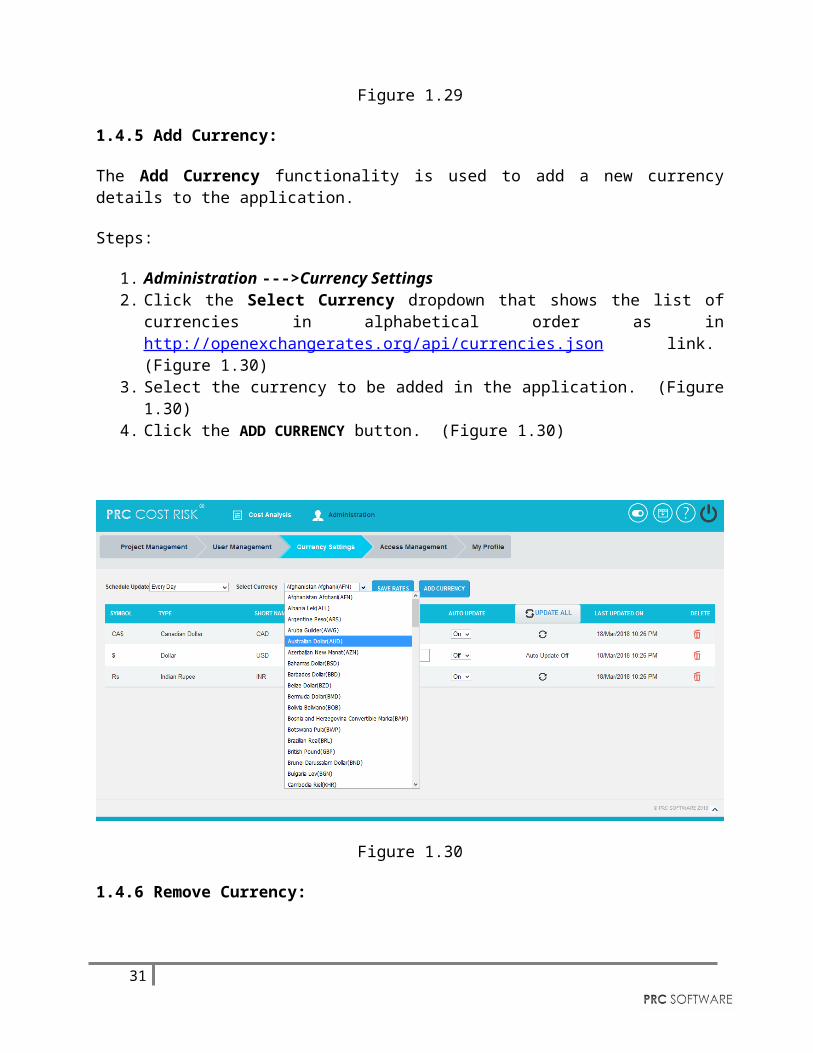
1.4.5 Add Currency:
The Add Currency functionality is used to add a new currency details to the application.
Steps:
1. Administration --->Currency Settings2. Click the Select Currency dropdown that shows the list of currencies in alphabetical
order as in http://openexchangerates.org/api/currencies.json link. (Figure 1.30)3. Select the currency to be added in the application. (Figure 1.30) 4. Click the ADD CURRENCY button. (Figure 1.30)
27
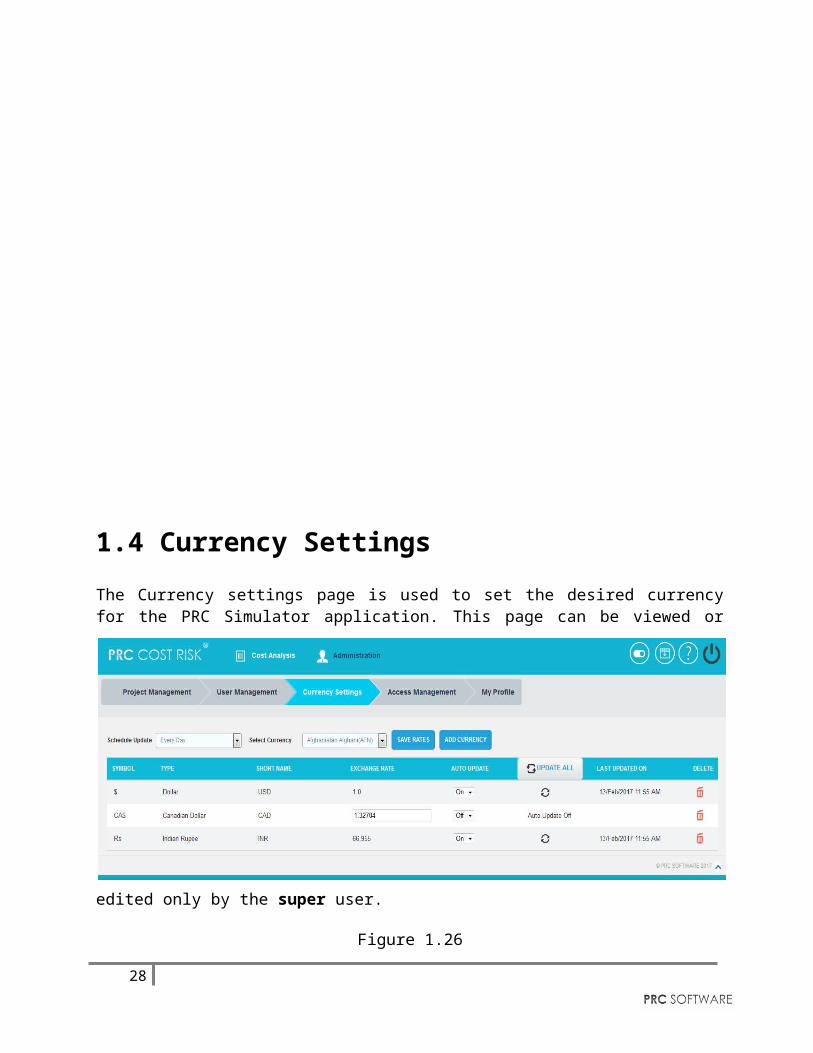
Figure 1.30
1.4.6 Remove Currency:
This functionality is used to remove currencies from the Currency Settings. While removing each currency, it will automatically add it back to the Select Currency list from where we can add it later if needed. Only the currencies which are not assigned to any of the Projects/ Threats/ Opportunities can be removed.
Steps:
1. Administration ---> Currency Settings2. Click Delete icon corresponding to each currency. (Figure 1.30)
28
1.5 Access Management
The Access Management page is used to set the accesses for the pages in the application. There are three levels of accesses such as READ/WRITE, VIEW ONLY and NO ACCESS.
To modify the data of a particular page the user must be assigned READ/WRITE access for that page. To view the page, VIEW ONLY access should be assigned. If the user should not have access to a particular page in the application, NO ACCESS may be assigned for that page. The Access Management page is visible only to the user who has READ/WRITE access. The various roles available can be viewed by selecting them from the Select Role drop down. (Figure 1.31)
Figure 1.31
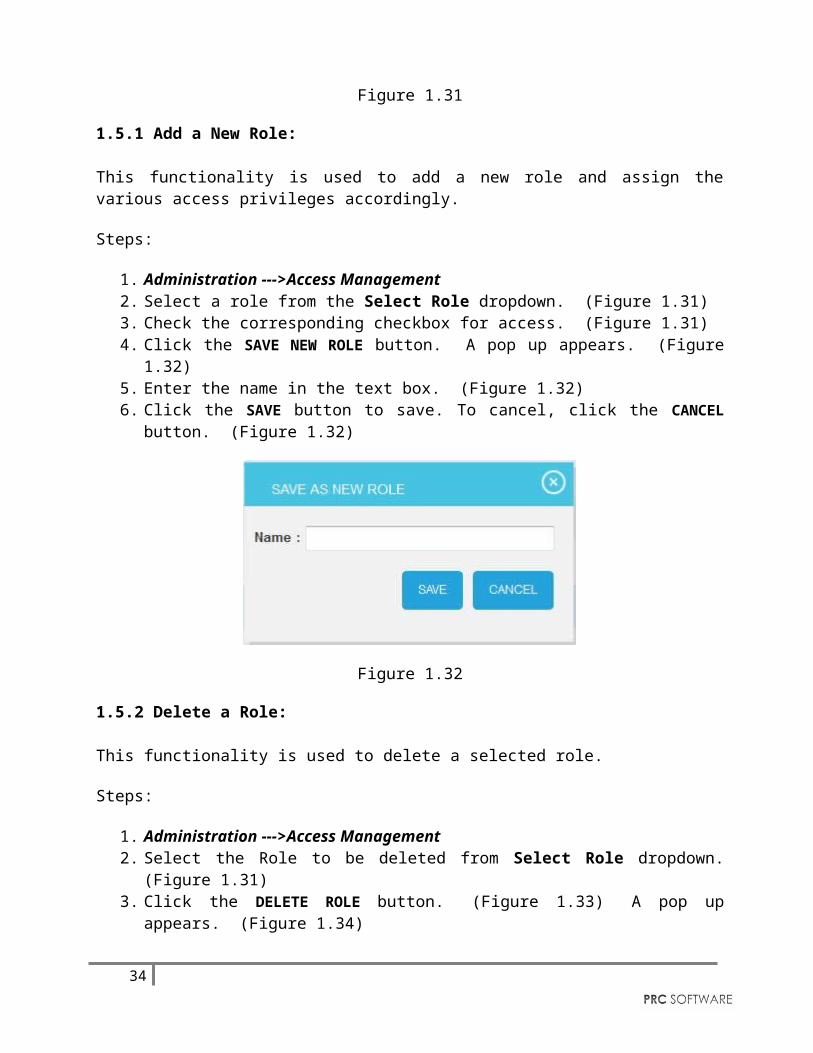
1.5.1 Add a New Role:
This functionality is used to add a new role and assign the various access privileges accordingly.
Steps:
29
1. Administration --->Access Management2. Select a role from the Select Role dropdown. (Figure 1.31)3. Check the corresponding checkbox for access. (Figure 1.31)4. Click the SAVE NEW ROLE button. A pop up appears. (Figure 1.32)5. Enter the name in the text box. (Figure 1.32)6. Click the SAVE button to save. To cancel, click the CANCEL button. (Figure 1.32)
Figure 1.32
1.5.2 Delete a Role:
This functionality is used to delete a selected role.
Steps:
1. Administration --->Access Management2. Select the Role to be deleted from Select Role dropdown. (Figure 1.31)3. Click the DELETE ROLE button. (Figure 1.33) A pop up appears. (Figure 1.34)4. Click the OK button to delete a role. To cancel, click the Cancel button. (Figure 1.34)
Figure 1.33
Figure 1.34
30
2. COST ANALYSIS
2.1 Import
The Import page allows you to import tasks to the selected project and a scenario. This page also allows importing of files which contain multiple projects after selecting an import method. The accepted file types are .xer, .mpp and .xls. (Figure 2.1)
Figure 2.1
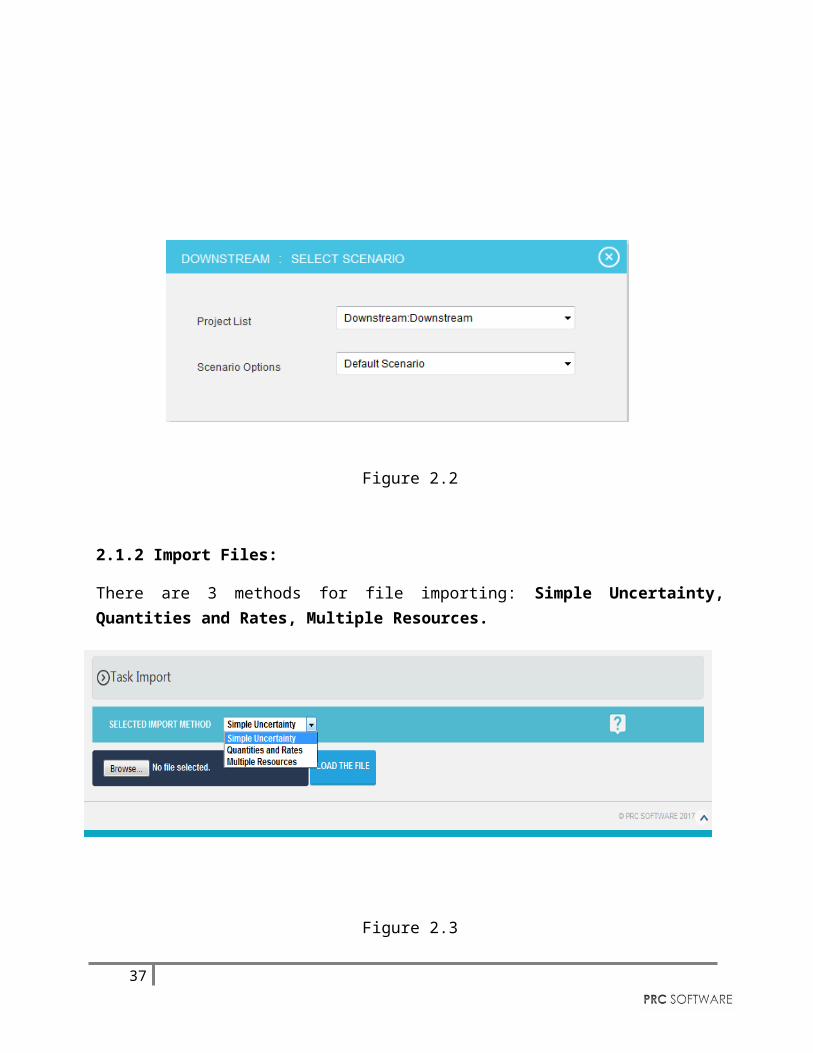
2.1.1 Select Project and Select Scenario:
This is used to select the specific project from the project list for which the tasks will be imported and also the scenario based on which the cost estimation is done.
Steps:
1. Cost Analysis --->Import 2. Select the project from the Project List dropdown, and then select the scenario from Scenario
Options dropdown. (Figure 2.2)
31
Figure 2.2
2.1.2 Import Files:
There are 3 methods for file importing: Simple Uncertainty, Quantities and Rates, Multiple Resources.
Figure 2.3
To know about the import methods, click the help icon (Figure 2.3) which shows a popup with a brief description about the import types. You can also download the template for each method. (Figure 2.4)
32
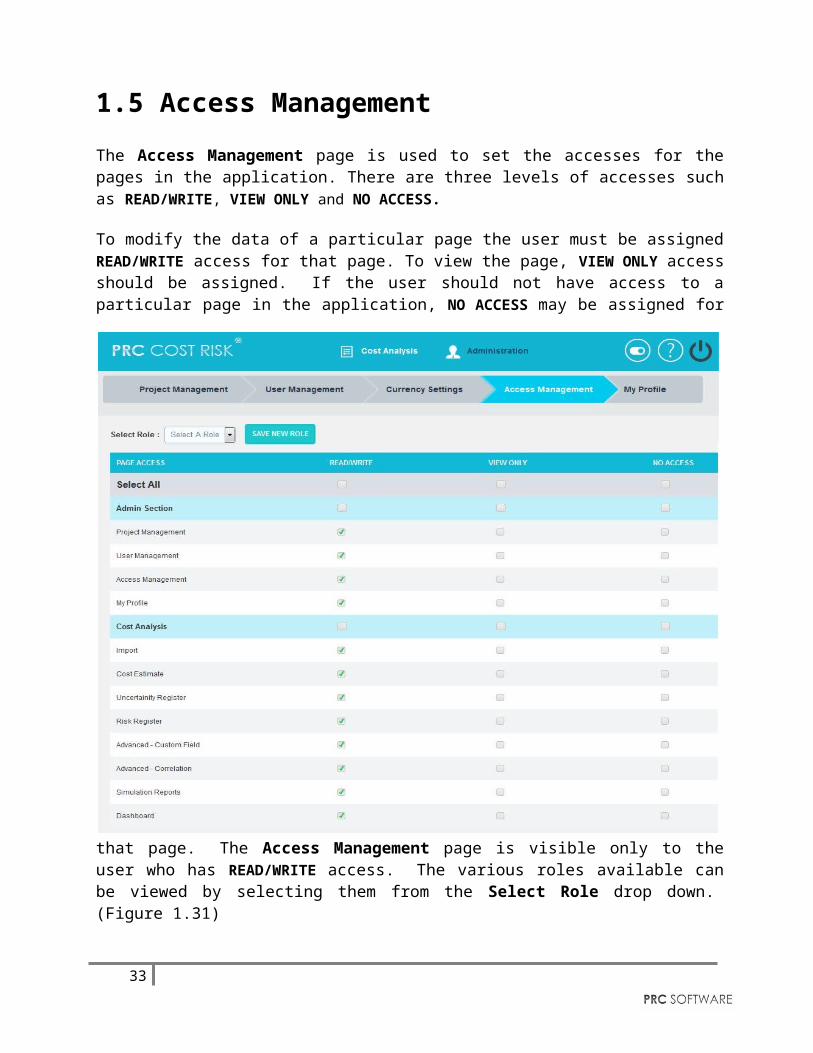
Figure 2.4
Import 1 – Simple Uncertainty
The imported file must be of type xls, mpp, and xer.
Steps:
1. Cost Analysis --->Import2. Select the import method Simple Uncertainty from the combo and the selected method
will lock automatically. (Figure 2.3)
3. To import .xls file:i. Click BROWSE button to browse a .xls file and click LOAD THE FILE
button. (Figure 2.5)ii. Map the data and click IMPORT VALUES button. (Figure 2.5)
33
4. To import .xer, .mpp files:i. Click BROWSE button to browse a .xer or .mpp file and click LOAD
THE FILE button. If there are multiple projects in the file, tick the Import all projects in the selected file check box before uploading if needed. (Figure 2.6)
Figure 2.5
34
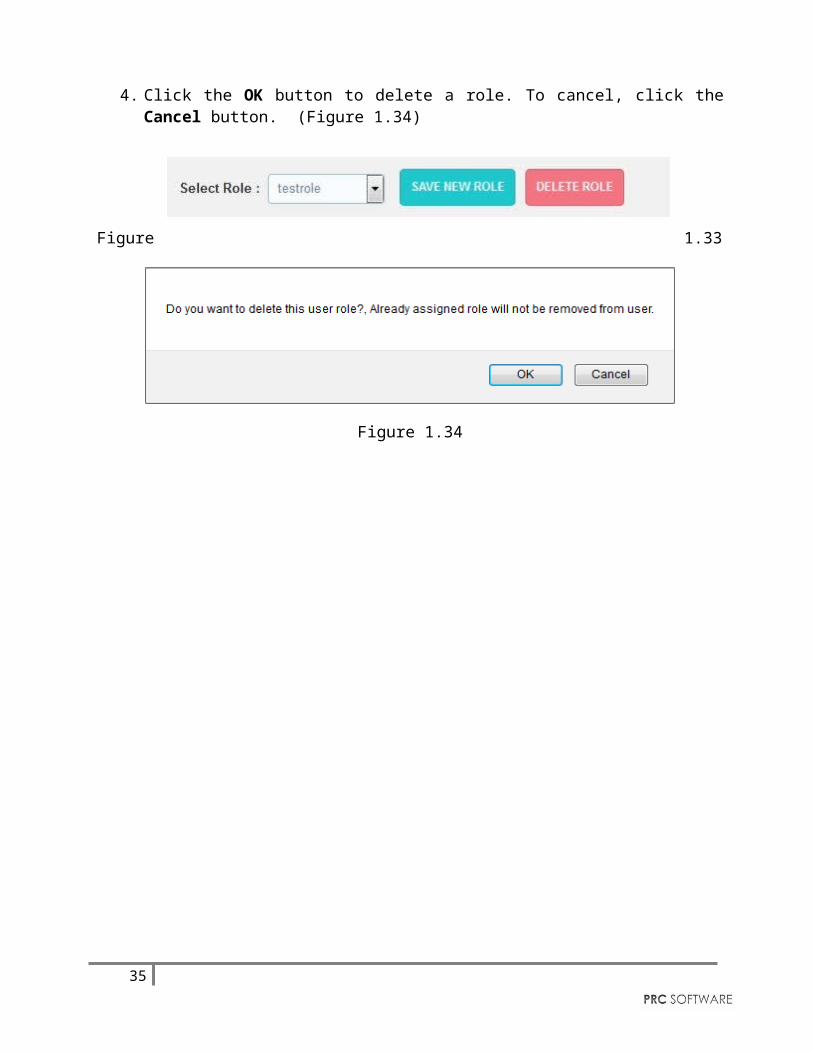
Figure 2.6
Import 2 - Quantities and Rates
The imported file must be of type xls.
Steps:
1. Cost Analysis --->Import2. Select the import method Quantities and Rates from the combo and the selected method
will lock automatically. (Figure 2.3)3. Click BROWSE button to browse a .xls file and click LOAD THE FILE button.
(Figure 2.7)4. Map the data and click IMPORT VALUES button. (Figure 2.7)
35
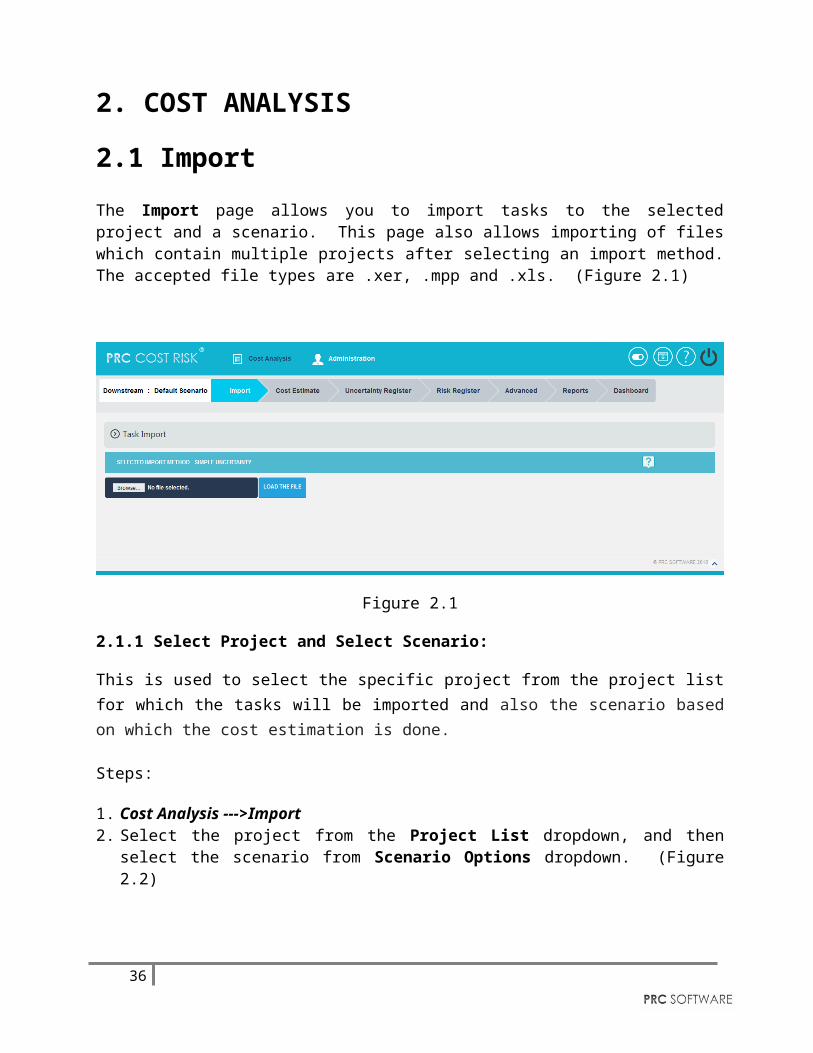
Figure 2.7
36
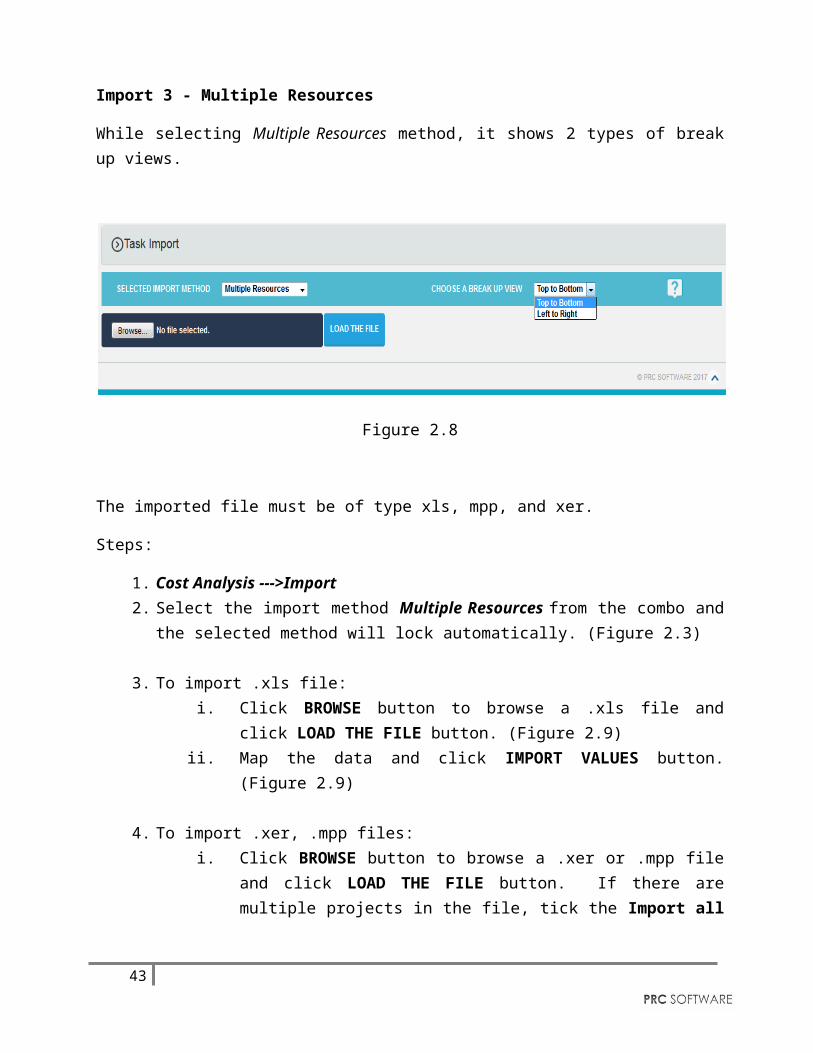
Import 3 - Multiple Resources
While selecting Multiple Resources method, it shows 2 types of break up views.
Figure 2.8
The imported file must be of type xls, mpp, and xer.
Steps:
1. Cost Analysis --->Import2. Select the import method Multiple Resources from the combo and the selected method
will lock automatically. (Figure 2.3)
3. To import .xls file:i. Click BROWSE button to browse a .xls file and click LOAD THE FILE
button. (Figure 2.9)ii. Map the data and click IMPORT VALUES button. (Figure 2.9)
4. To import .xer, .mpp files:i. Click BROWSE button to browse a .xer or .mpp file and click LOAD
THE FILE button. If there are multiple projects in the file, tick the Import all projects in the selected file check box before uploading if needed. (Figure 2.10)
37
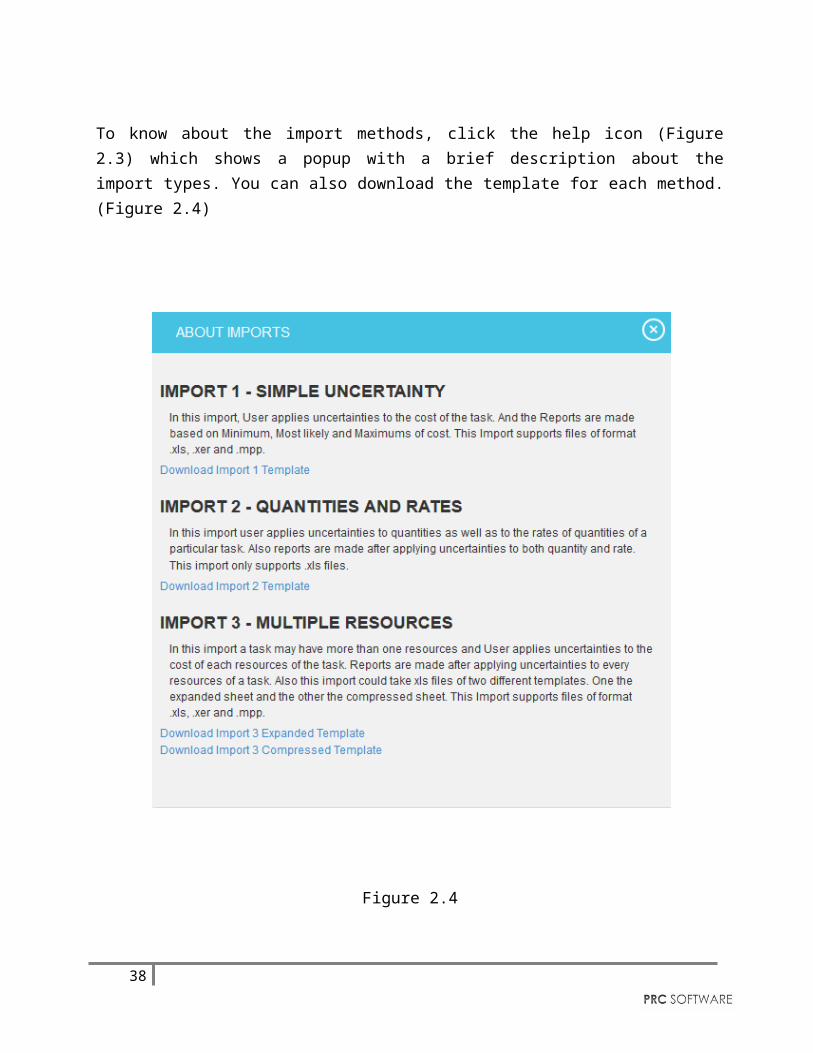
Figure 2.9
38
Figure 2.10
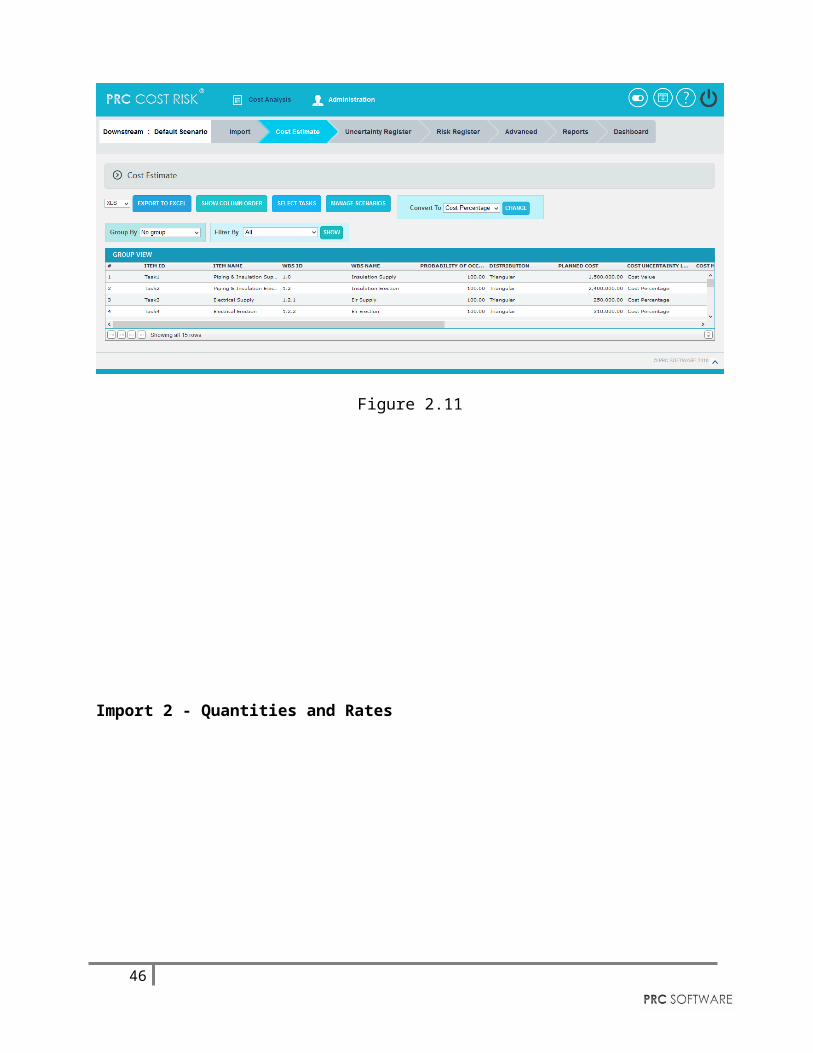
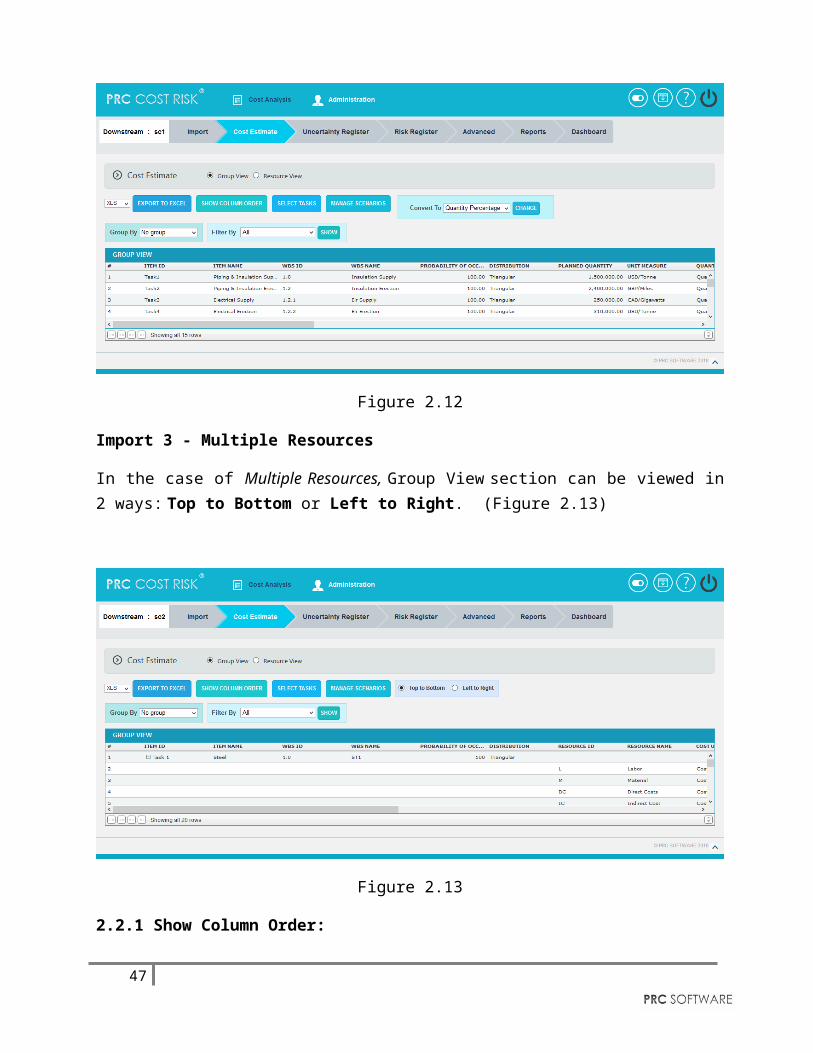
2.2 Cost EstimateThe Cost Estimate page shows all the task details of the imported project in a table format, along with the estimated cost values for each task in the project based on the import method (Simple Uncertainty/ Quantities and Rates / Multiple Resources). This page can be viewed in 2 sections; Group View and Resource View.
The Group View section helps the user to view the estimated cost values of each task in the project based on the basic identification information of each task, its resource details and the user defined fields. The default view is No grouping. (Figure 2.11 and Figure 2.12)
Import 1 – Simple Uncertainty
39

Figure 2.11
Import 2 - Quantities and Rates
Figure 2.12
Import 3 - Multiple Resources
In the case of Multiple Resources, Group View section can be viewed in 2 ways: Top to Bottom or Left to Right. (Figure 2.13)
40
Figure 2.13
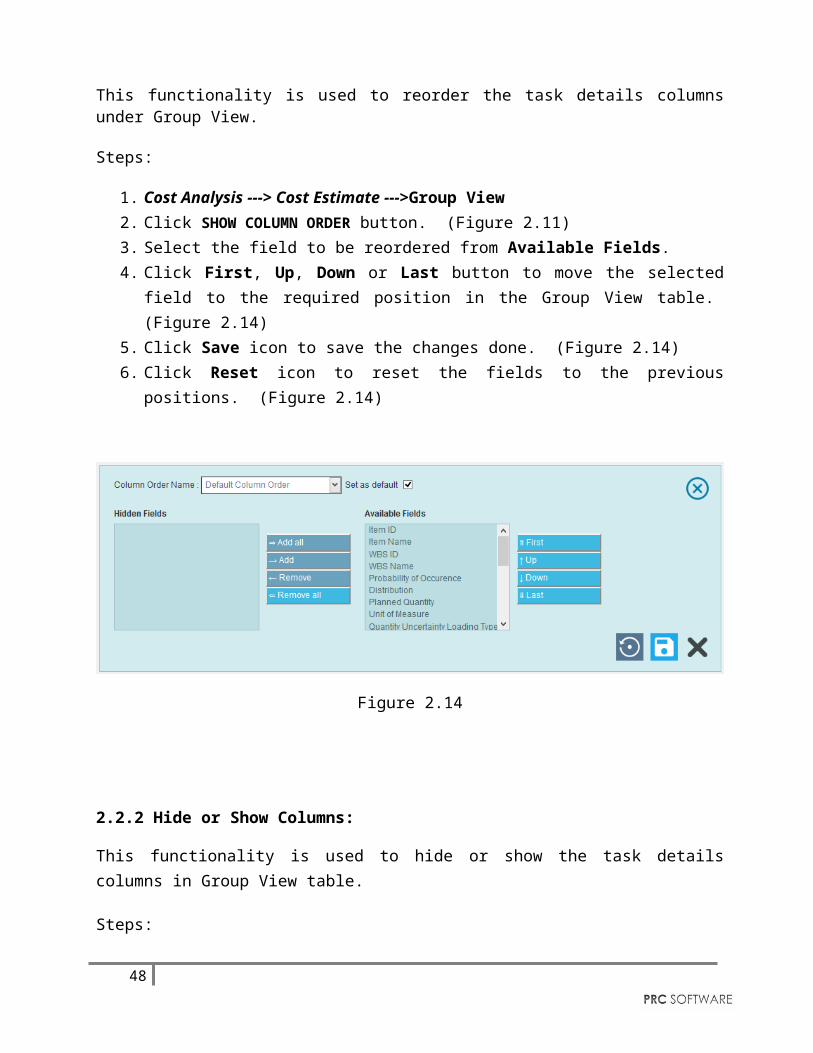
2.2.1 Show Column Order:
This functionality is used to reorder the task details columns under Group View.
Steps:
1. Cost Analysis ---> Cost Estimate --->Group View2. Click SHOW COLUMN ORDER button. (Figure 2.11)3. Select the field to be reordered from Available Fields.4. Click First, Up, Down or Last button to move the selected field to the required position
in the Group View table. (Figure 2.14)5. Click Save icon to save the changes done. (Figure 2.14) 6. Click Reset icon to reset the fields to the previous positions. (Figure 2.14)
41

Figure 2.14
2.2.2 Hide or Show Columns:
This functionality is used to hide or show the task details columns in Group View table.
Steps:
1. Cost Analysis ---> Cost Estimate --->Group View2. Click SHOW COLUMN ORDER button. (Figure 2.11)3. Select the field to hide or show in Group View table.4. Click Remove button to hide the selected field from Group View table, or click Add
button to show in the table. (Figure 2.15)5. Click Remove All button to hide all the fields from the table, or click Add All button to
show all the fields in the table. (Figure 2.15)6. Click Save icon to save the changes done. (Figure 2.15) 7. Click Reset icon to reset the fields to the previous positions. (Figure 2.15)
Figure 2.15
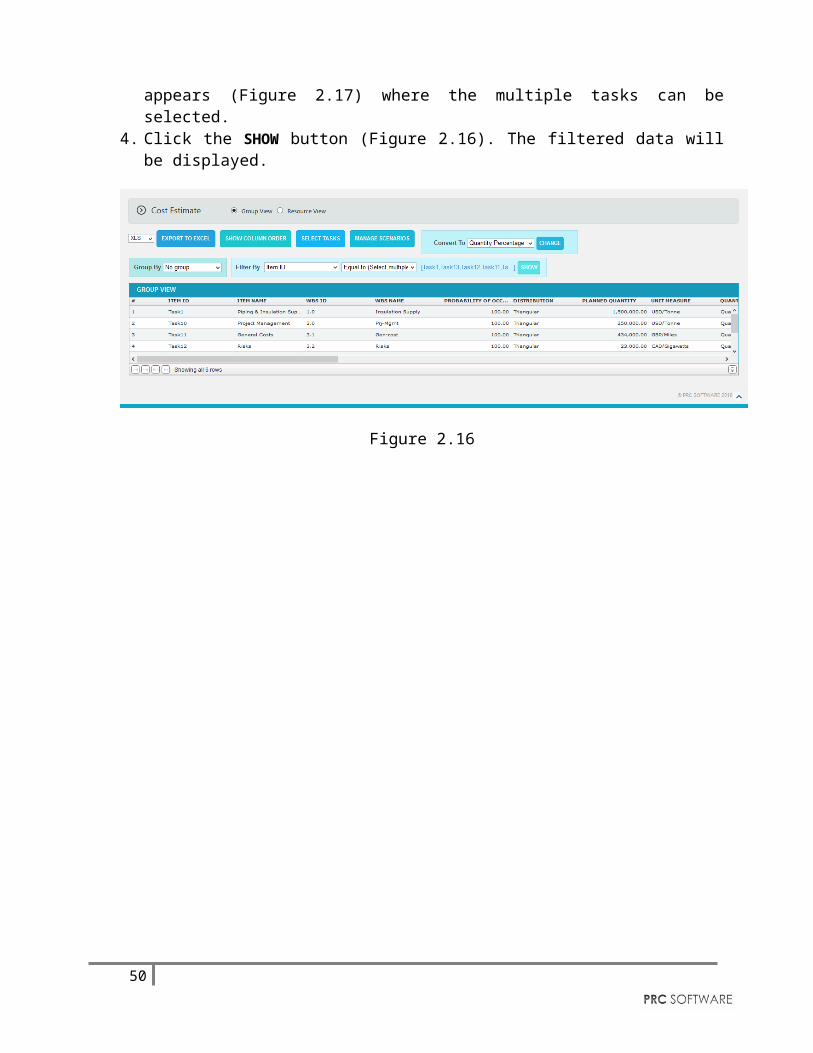
2.2.3 Filter Data:
This functionality is used to filter the data according to a particular field and its selected values.
Steps:
1. Cost Analysis ---> Cost estimate ---> Group View2. Select the required column from the Filter by dropdown. (Figure 2.11)
42
3. Enter the value in the textbox provided based on which filtering is to be done. (Figure 2.16) While giving conditions with select multiple option to filter, a pop up appears (Figure 2.17) where the multiple tasks can be selected.
4. Click the SHOW button (Figure 2.16). The filtered data will be displayed.
Figure 2.16
43
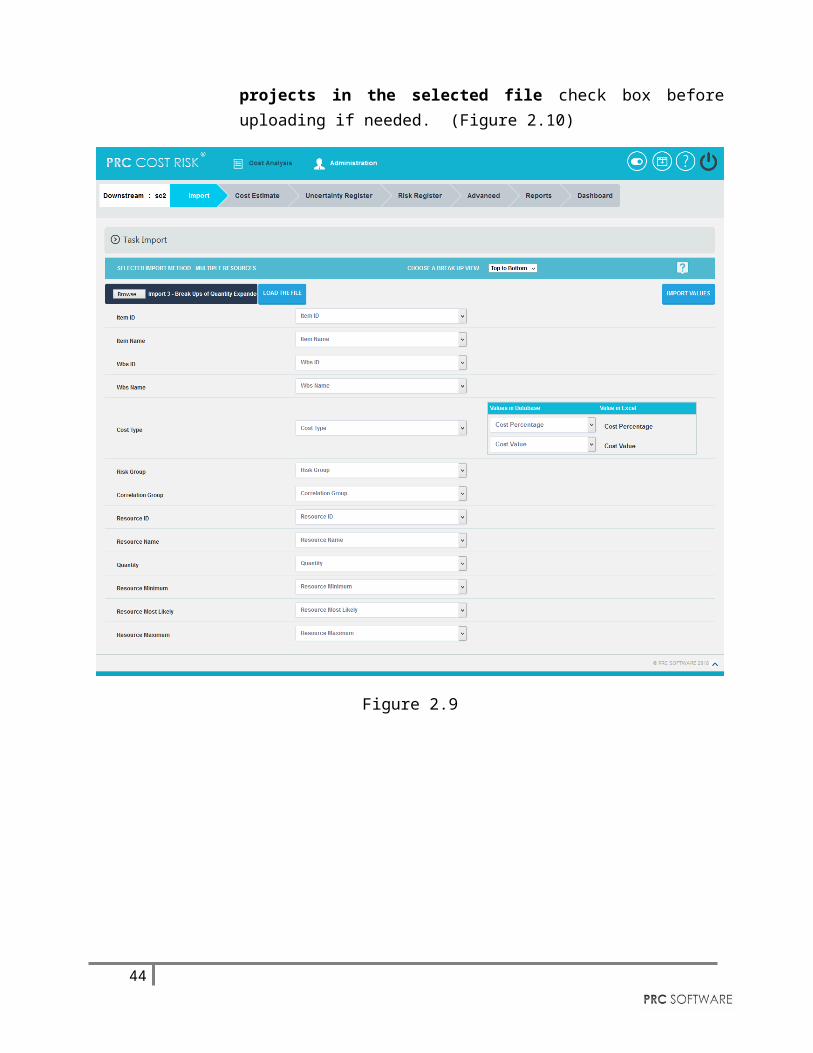
Figure 2.17
2.2.4 Group By
This functionality is used to group the column values based on a particular field.
Steps:
1. Cost Analysis --->Cost Estimate --->Group View2. Click Group By dropdown and select the required group to view the tasks. (Figure 2.18)
44
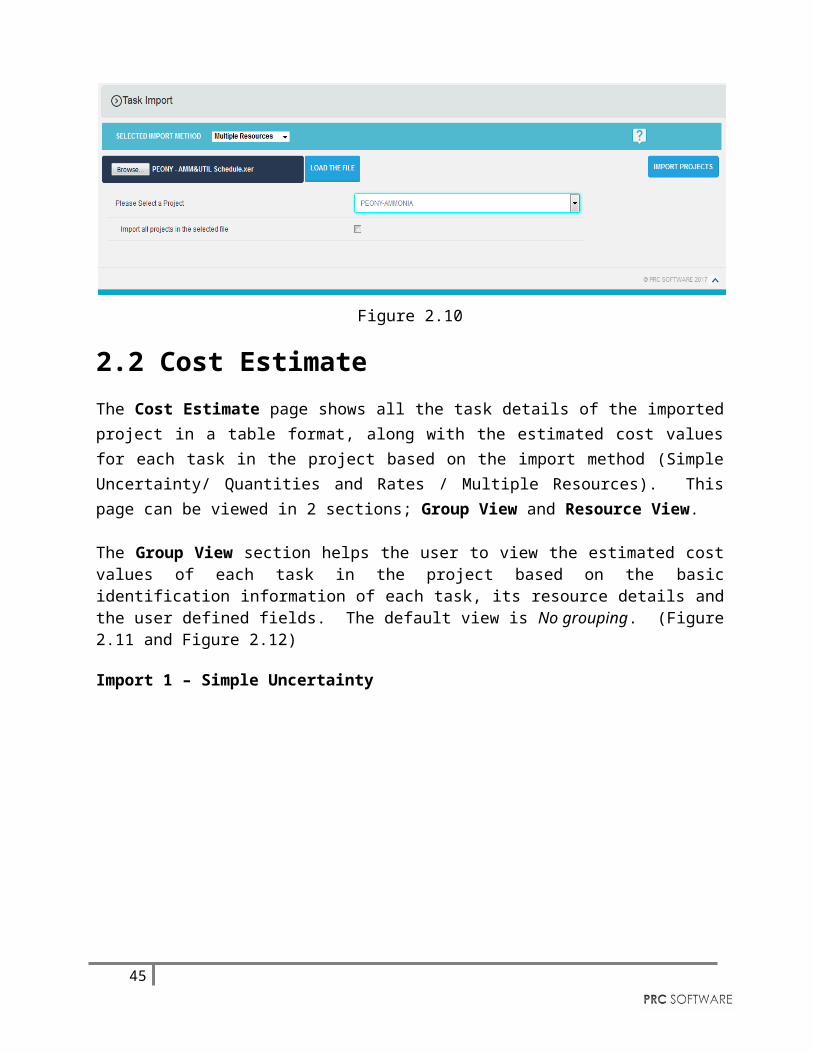
Figure 2.18
2.2.5 Convert To:
This functionality is used to convert the cost of all project tasks in Cost Value or Cost Percentage.
Steps:
1. Cost Analysis--->Cost Estimate-Group View 2. Select the required cost conversion type from Convert To dropdown. (Figure 2.11)3. Click on CHANGE button. The converted type will update in the Group View table.
(Figure 2.19)
Figure 2.19
45
2.2.6 Export to Excel:
This functionality is used to export the whole Group View table or the filtered table to MS Excel as .xls or .xlsx files type.
Steps:
1. Cost Analysis ---> Cost Estimate --->Group View2. Select the file type from dropdown and click Export to Excel button. (Figure 2.11)
2.2.7 Delete Tasks:
Tasks can be deleted by clicking the Delete icon corresponding to each row or multiple tasks can be deleted simultaneously.
Delete Multiple Tasks:
This functionality helps to delete multiple tasks simultaneously. To delete multiple tasks we must first select them by ticking the check boxes next to each task.
Steps:
1. Cost Analysis ---> Cost Estimate ---> Group View2. Click the SELECT TASKS button to select the tasks to delete. (Figure 2.11)3. Select the tasks by ticking the check boxes. (Figure 2.20)4. Click the DELETE MULTIPLE button to delete the selected tasks. (Figure 2.20)
Figure 2.20
46
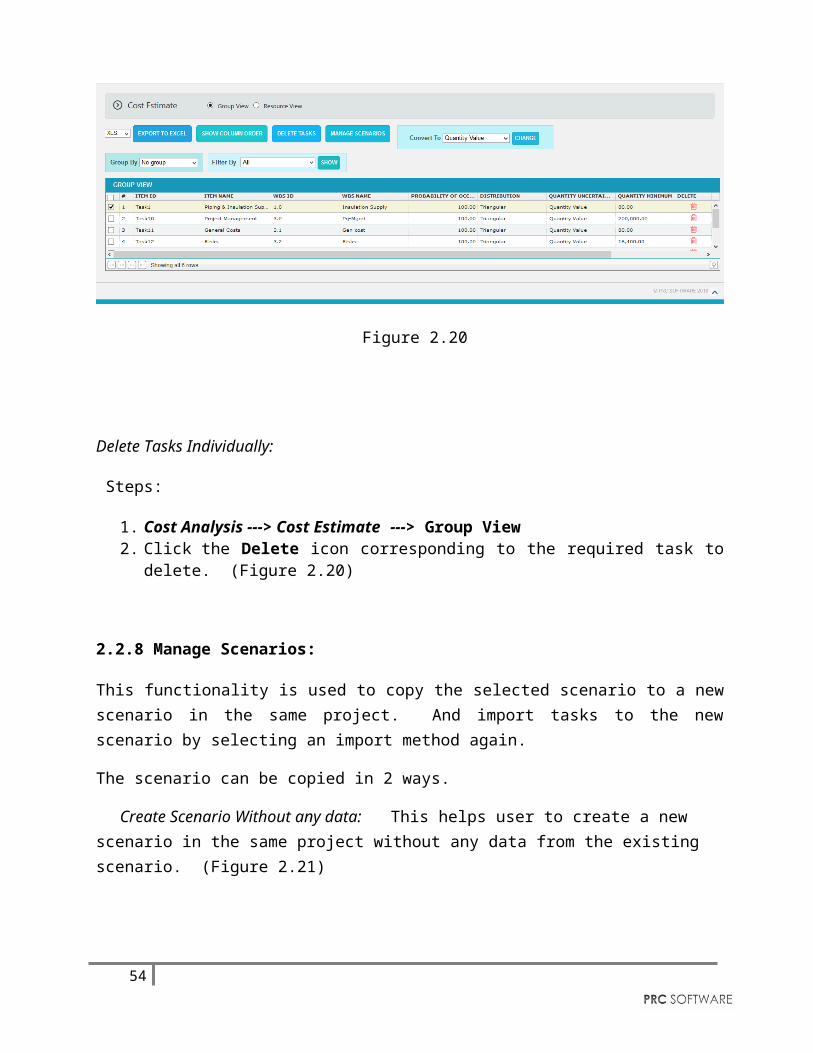
Delete Tasks Individually:
Steps:
1. Cost Analysis ---> Cost Estimate ---> Group View2. Click the Delete icon corresponding to the required task to delete. (Figure 2.20)
2.2.8 Manage Scenarios:
This functionality is used to copy the selected scenario to a new scenario in the same project. And import tasks to the new scenario by selecting an import method again.
The scenario can be copied in 2 ways.
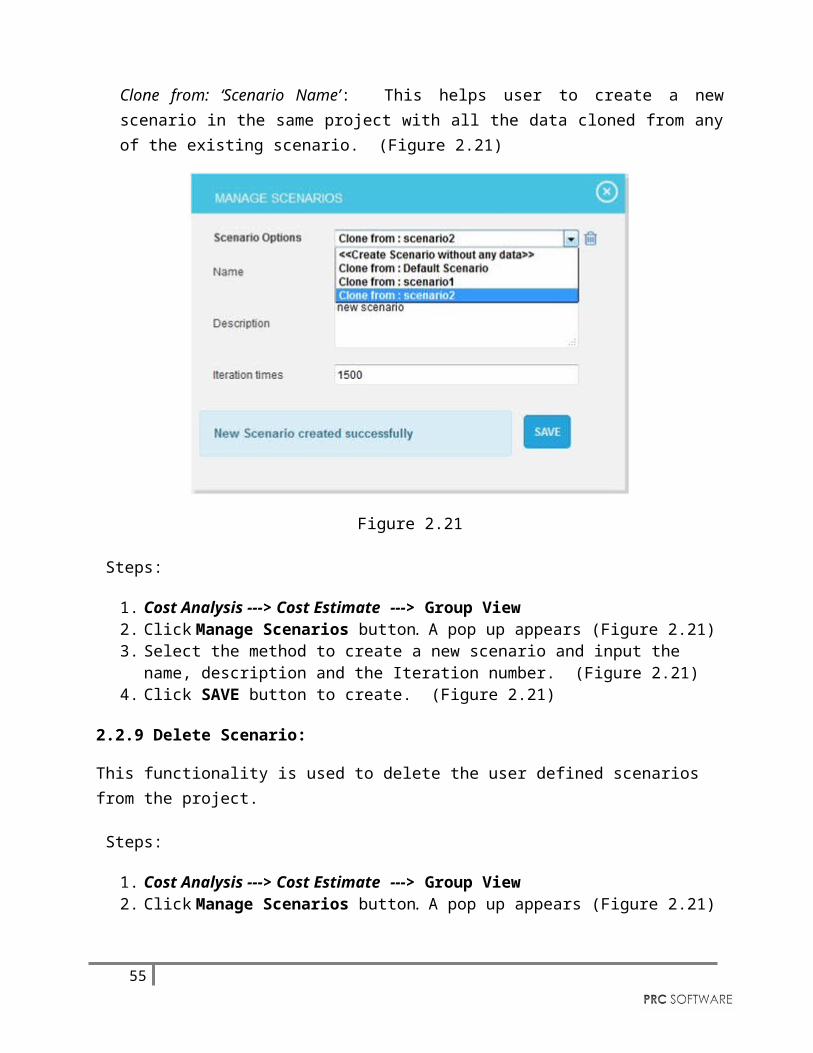
Create Scenario Without any data: This helps user to create a new scenario in the same project without any data from the existing scenario. (Figure 2.21)
Clone from: ‘Scenario Name’: This helps user to create a new scenario in the same project with all the data cloned from any of the existing scenario. (Figure 2.21)
Figure 2.21
Steps:
1. Cost Analysis ---> Cost Estimate ---> Group View2. Click Manage Scenarios button. A pop up appears (Figure 2.21)
47
3. Select the method to create a new scenario and input the name, description and the Iteration number. (Figure 2.21)
4. Click SAVE button to create. (Figure 2.21)
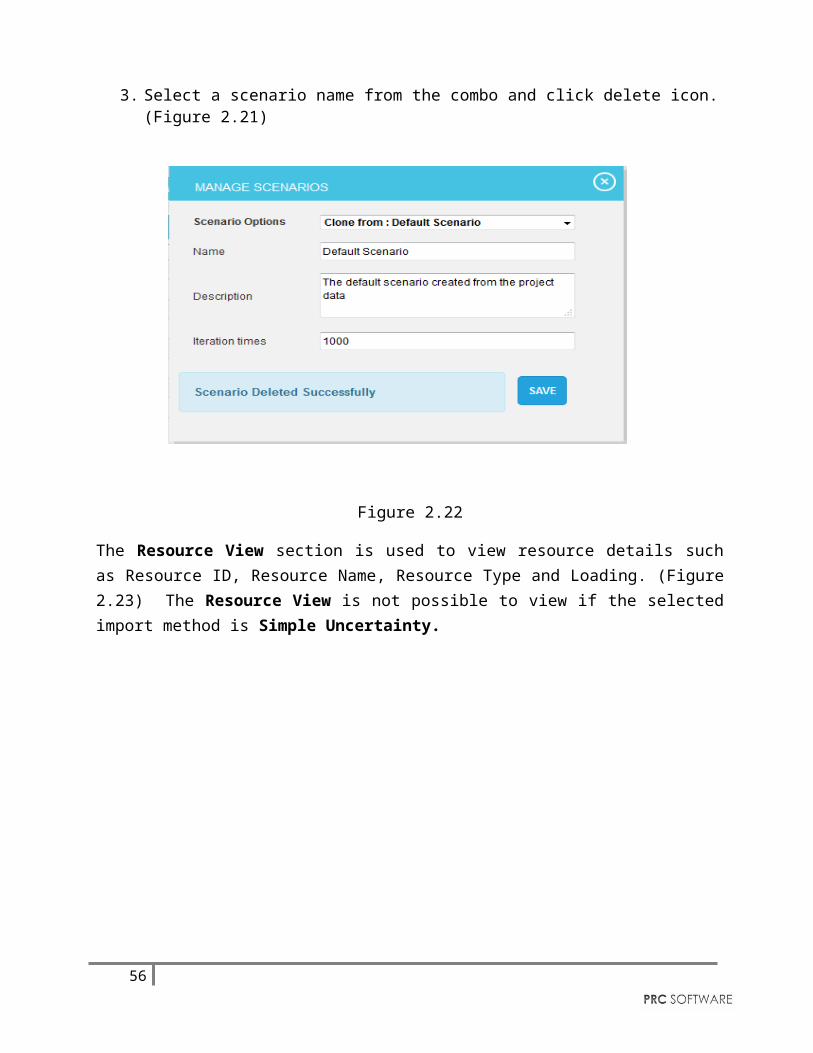
2.2.9 Delete Scenario:
This functionality is used to delete the user defined scenarios from the project.
Steps:
1. Cost Analysis ---> Cost Estimate ---> Group View2. Click Manage Scenarios button. A pop up appears (Figure 2.21)3. Select a scenario name from the combo and click delete icon. (Figure 2.21)
Figure 2.22
The Resource View section is used to view resource details such as Resource ID, Resource Name, Resource Type and Loading. (Figure 2.23) The Resource View is not possible to view if the selected import method is Simple Uncertainty.
48
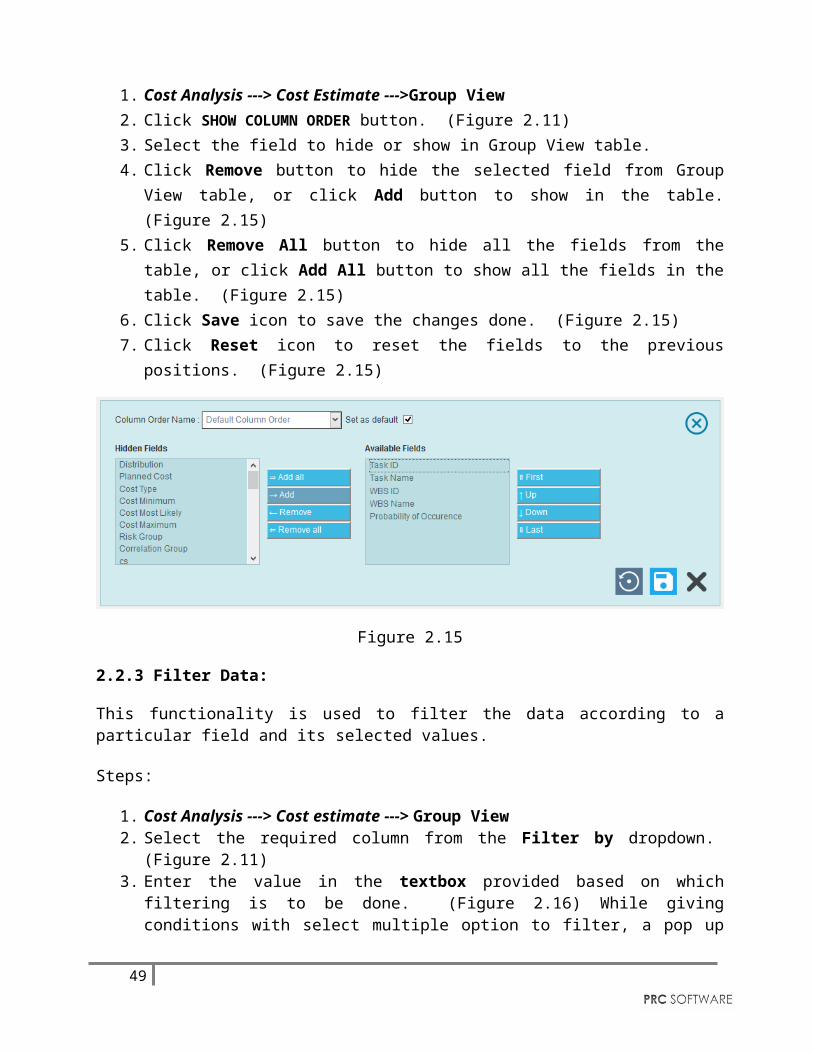
Figure 2.23
49
2.3 Uncertainty RegisterThe Uncertainty Register page allows a user to add and apply uncertainties to the project scenario. The uncertainty applied to the scenario will affect the tasks, based on the type selected. These tasks are listed as a tree structure.
Figure 2.24
2.3.1 Add Uncertainty:
This functionality is to add a new uncertainty with a name and type selected.
Steps:
1. Cost Analysis --->Uncertainty Register2. Click Name field to add a new uncertainty. Select the Type from dropdown with its logic
and value. (Figure 2.25)
50
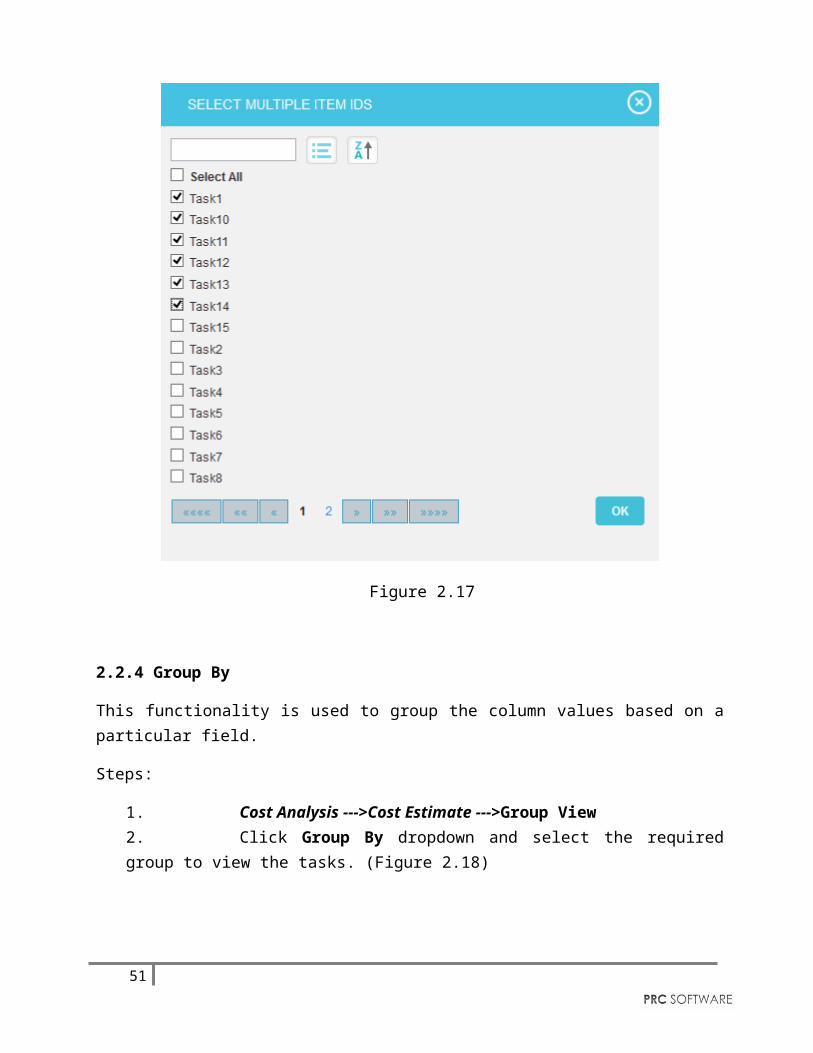
Figure 2.25
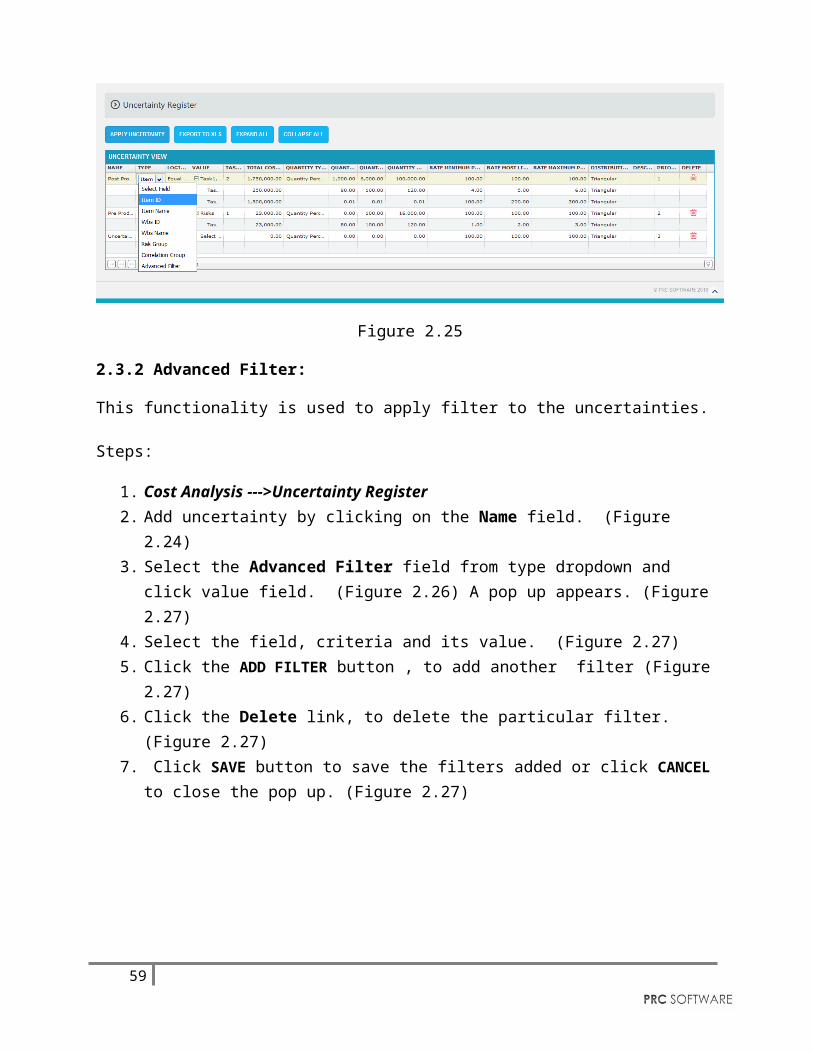
2.3.2 Advanced Filter:
This functionality is used to apply filter to the uncertainties.
Steps:
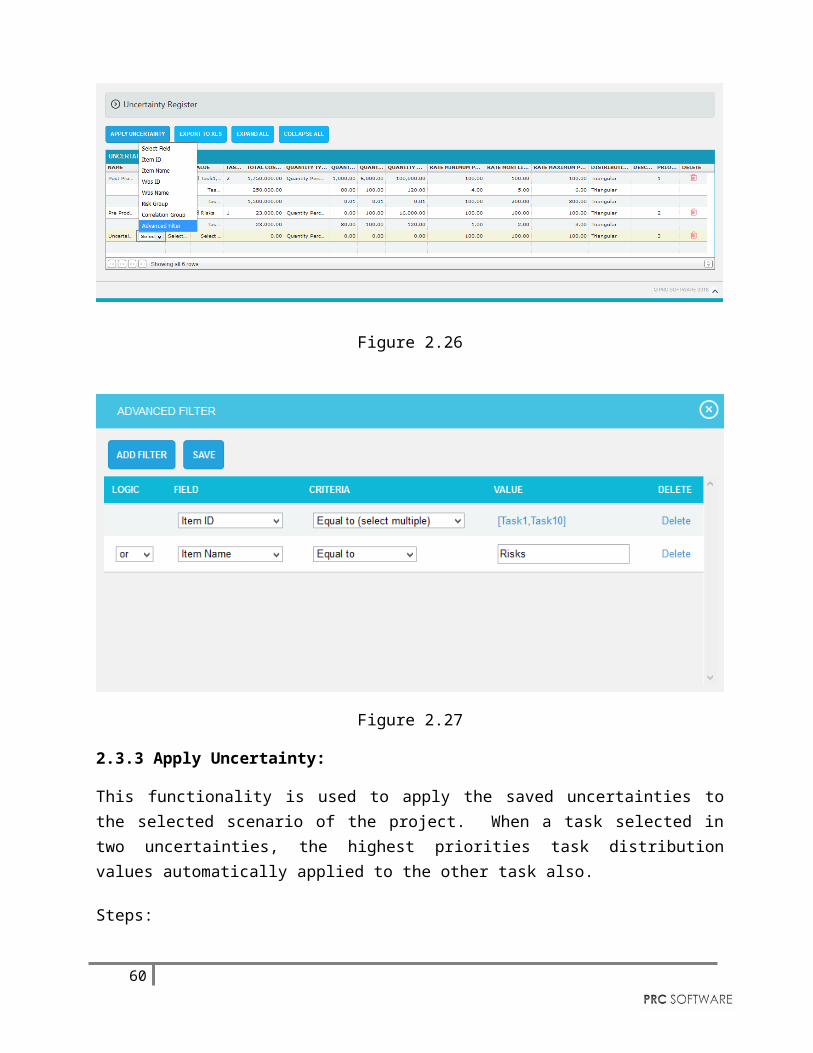
1. Cost Analysis --->Uncertainty Register2. Add uncertainty by clicking on the Name field. (Figure 2.24)3. Select the Advanced Filter field from type dropdown and click value field. (Figure 2.26)
A pop up appears. (Figure 2.27)4. Select the field, criteria and its value. (Figure 2.27)5. Click the ADD FILTER button , to add another filter (Figure 2.27)6. Click the Delete link, to delete the particular filter. (Figure 2.27)7. Click SAVE button to save the filters added or click CANCEL to close the pop up. (Figure
2.27)
Figure 2.26
51
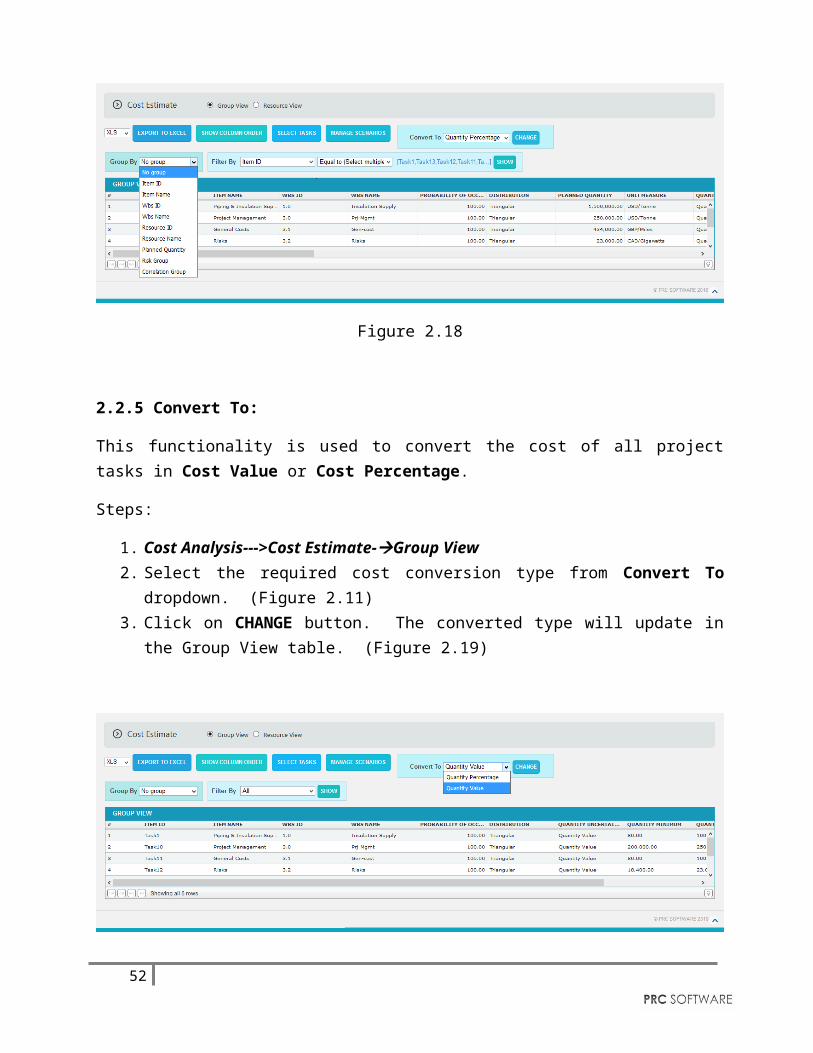
Figure 2.27
2.3.3 Apply Uncertainty:
This functionality is used to apply the saved uncertainties to the selected scenario of the project. When a task selected in two uncertainties, the highest priorities task distribution values automatically applied to the other task also.
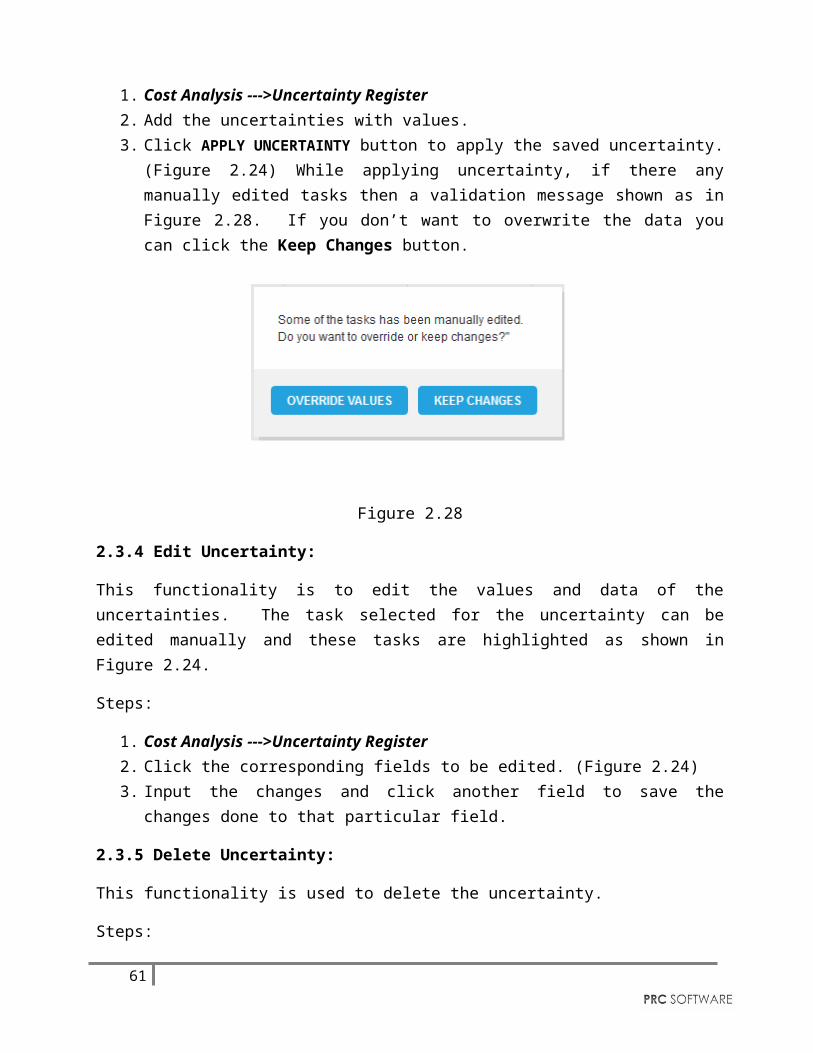
Steps:
1. Cost Analysis --->Uncertainty Register2. Add the uncertainties with values. 3. Click APPLY UNCERTAINTY button to apply the saved uncertainty. (Figure 2.24) While
applying uncertainty, if there any manually edited tasks then a validation message shown as in Figure 2.28. If you don’t want to overwrite the data you can click the Keep Changes button.
Figure 2.28
52
2.3.4 Edit Uncertainty:
This functionality is to edit the values and data of the uncertainties. The task selected for the uncertainty can be edited manually and these tasks are highlighted as shown in Figure 2.24.
Steps:
1. Cost Analysis --->Uncertainty Register2. Click the corresponding fields to be edited. (Figure 2.24)3. Input the changes and click another field to save the changes done to that particular field.
2.3.5 Delete Uncertainty:
This functionality is used to delete the uncertainty.
Steps:
1. Cost Analysis --->Uncertainty Register2. To delete the uncertainty, click the corresponding Delete icon. (Figure 2.24)3. A pop up message appears. (Figure 2.29)4. Click OK to delete or click Cancel. (Figure 2.29)
Figure 2.29
2.3.7 Export:
This functionality is used to export the entire uncertainties page to Excel.
Steps:
1. Cost Analysis --->Uncertainty Register2. Click the EXPORT TO XLS button to export the entire page to Excel. (Figure 2.24)
2.3.8 Expand All:
This functionality is used to expand the tree structure containing the tasks under value column.
53
Steps:
1. Cost Analysis --->Uncertainty Register2. Click the EXPAND ALL button to expand all the tasks. (Figure 2.26) On Expansion, the
tree structure becomes like that shown in Figure 2.30.
2.3.9 Collapse All:
This functionality is used to collapse the expanded tree.
Steps:
1. Cost Analysis --->Uncertainty Register2. Click the COLLAPSE ALL button to collapse the tasks. The tasks get collapsed and the
tree structure becomes like that shown in Figure 2.31.
Figure 2.30
Figure 2.31
54
2.4 Risk Register (Risks)The Risk Register (Risks) page allows user to add risks to the selected project. Here the risk data can be imported from PRC Risk Register or create in the page itself. The user can also input the probability percentage for each risk which is the chance of occurrence for each risk and the distribution values according to which the cost can be distributed over the risk.
Figure 2.32
2.4.1 Add Risk:
This functionality is used to add a new risk to the project.
Steps:
1. Risk Register --> Risks2. Click on Risk Id column to add new risk. (Figure 2.32)3. Give the name, type of the risk, title, probability and distribution values.
The distribution values include Normal, Beta, Triangular, Trigen, Uniform and Discrete. When a new risk is added the distribution value which is automatically selected will be Triangular.
2.4.2 Edit Risk:
This functionality is used to edit the existing risk details.
55
Steps:
1. Risk Register --> Risks2. Click on the risk which has to be modified. (Figure 2.32)3. Modify the name, type, title and probability of the risk.
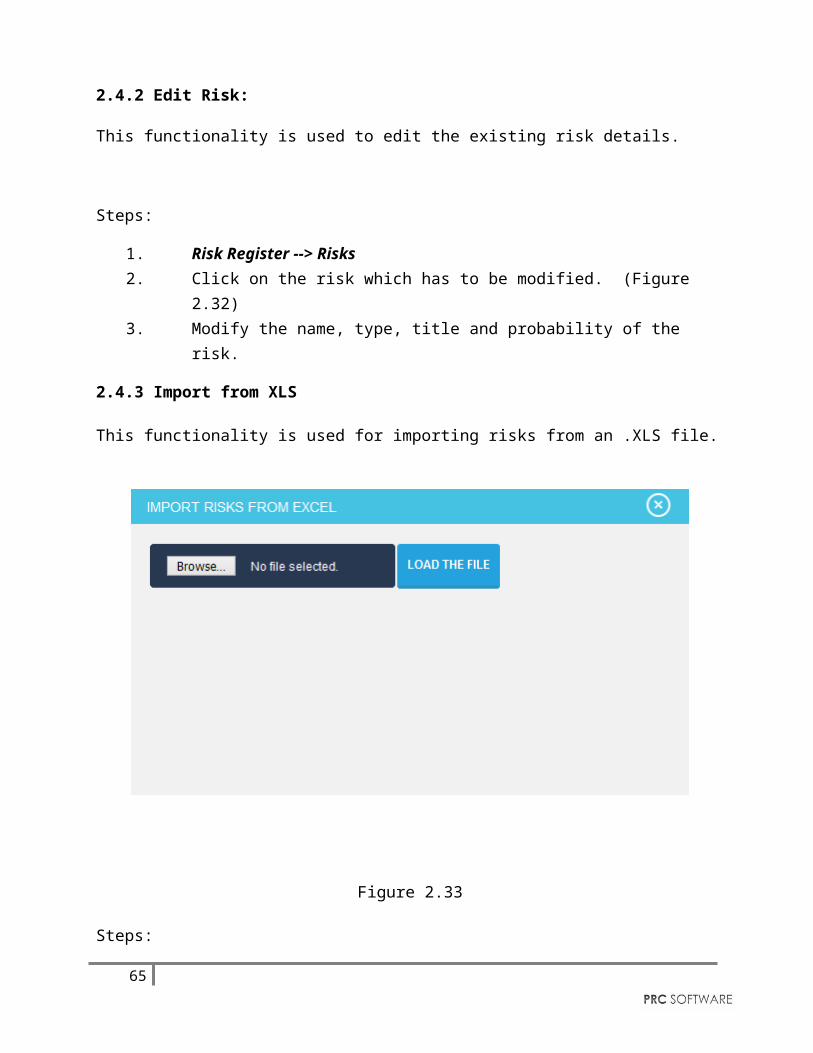
2.4.3 Import from XLS
This functionality is used for importing risks from an .XLS file.
Figure 2.33
Steps:
1. Risk Register --> Risks2. Click on the IMPORT FROM XLS button. (Figure 2.32)3. A popup appears, browse the file to be imported and upload. (Figure 2.33) 4. Map the corresponding values in the excel file and click on the IMPORT VALUES
button. (Figure 2.34)
56
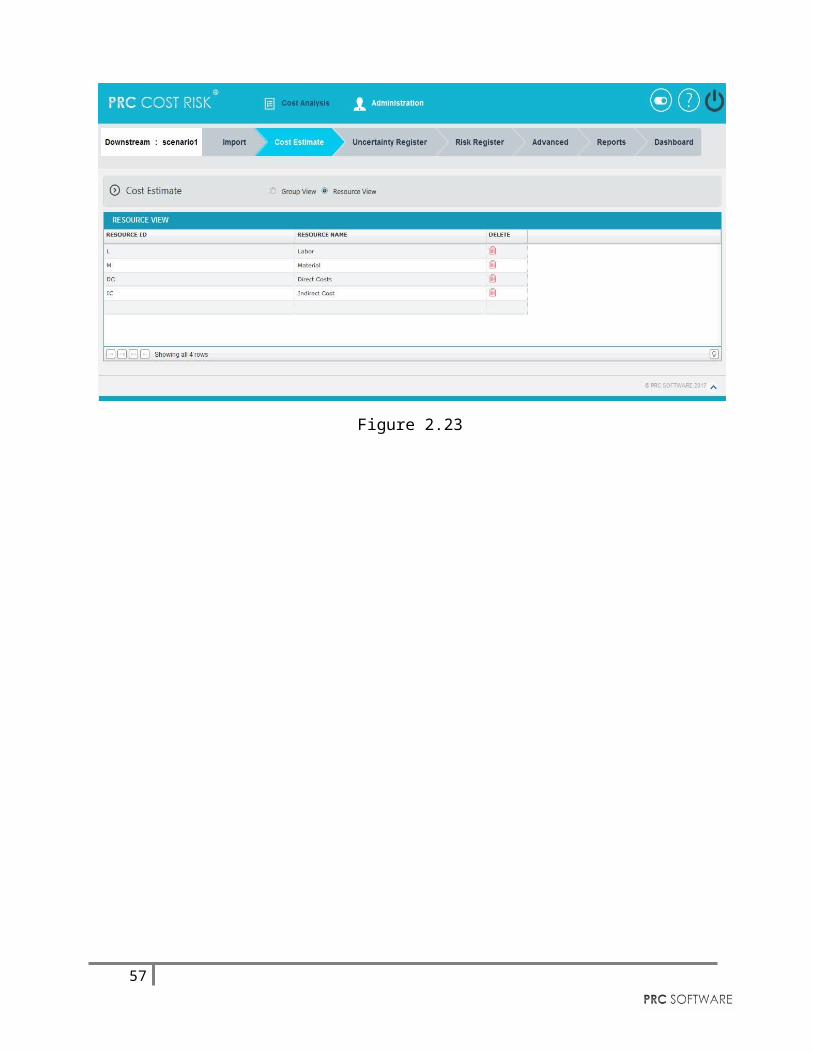
Figure 2.34
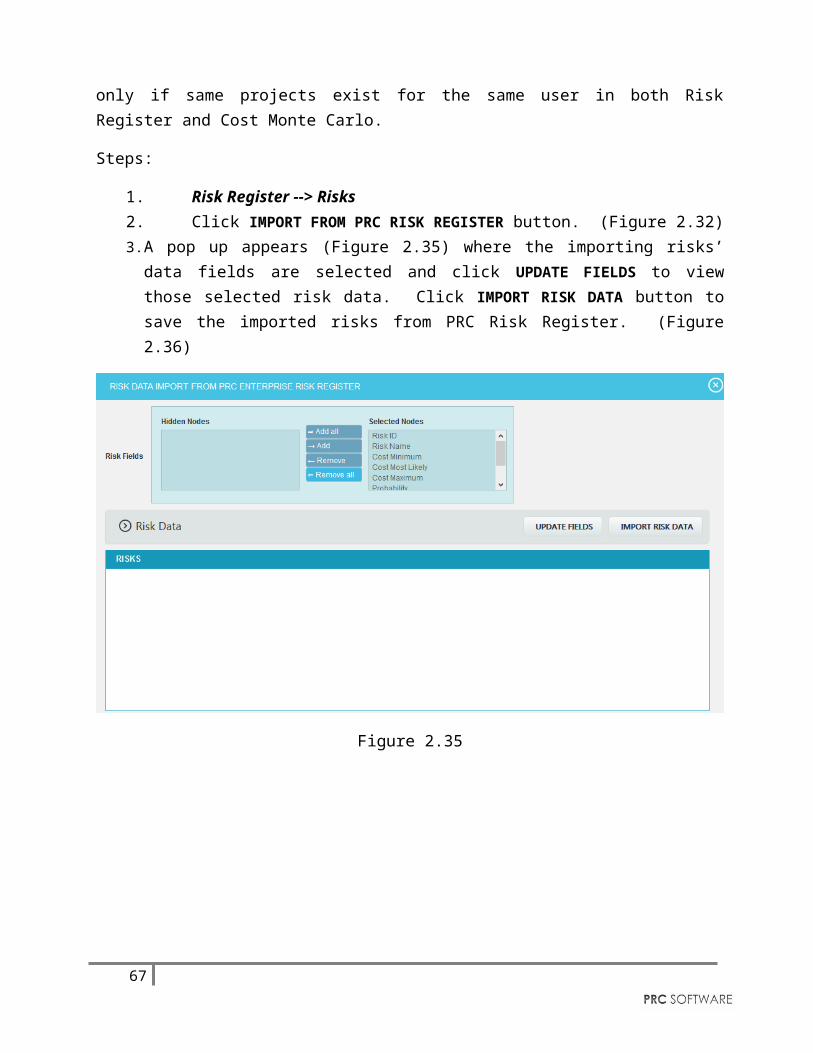
2.4.4 Import from PRC Risk Register:
This functionality is used to import the threats and opportunities data from PRC Risk Register and to assign those risks to the tasks in the PRC Cost Monte Carlo. This can be done only if same projects exist for the same user in both Risk Register and Cost Monte Carlo.
Steps:
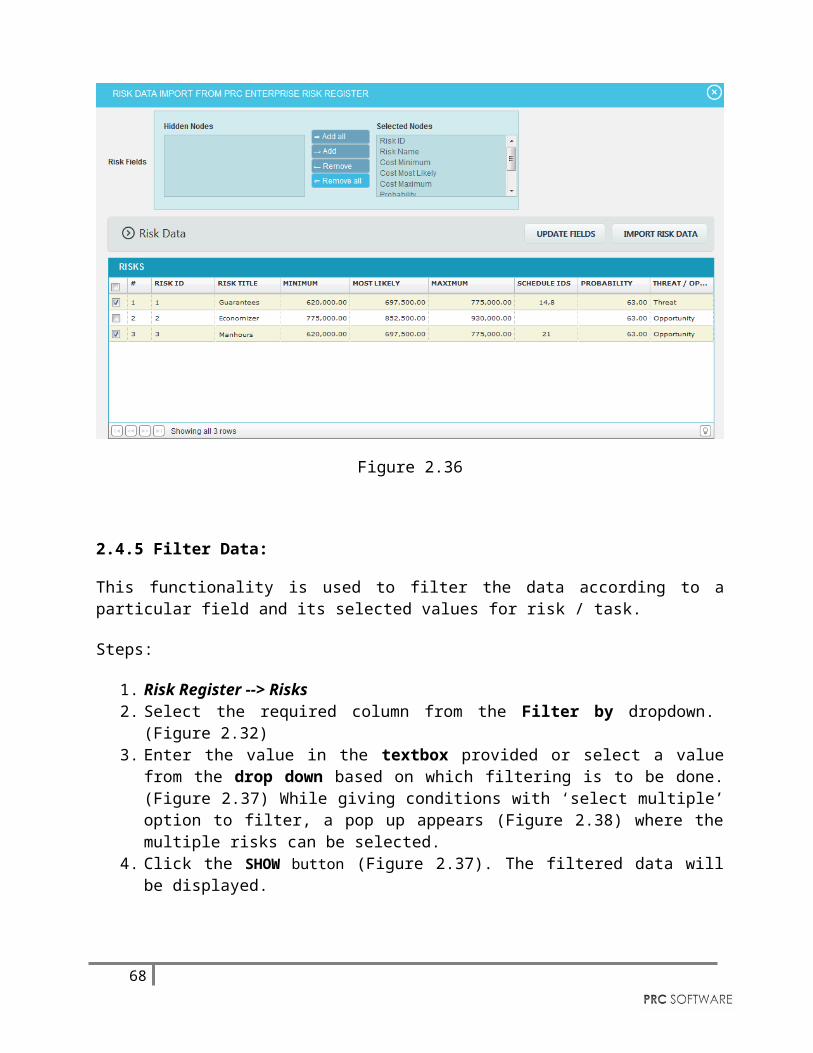
1. Risk Register --> Risks2. Click IMPORT FROM PRC RISK REGISTER button. (Figure 2.32) 3. A pop up appears (Figure 2.35) where the importing risks’ data fields are selected and
click UPDATE FIELDS to view those selected risk data. Click IMPORT RISK DATA button to save the imported risks from PRC Risk Register. (Figure 2.36)
57
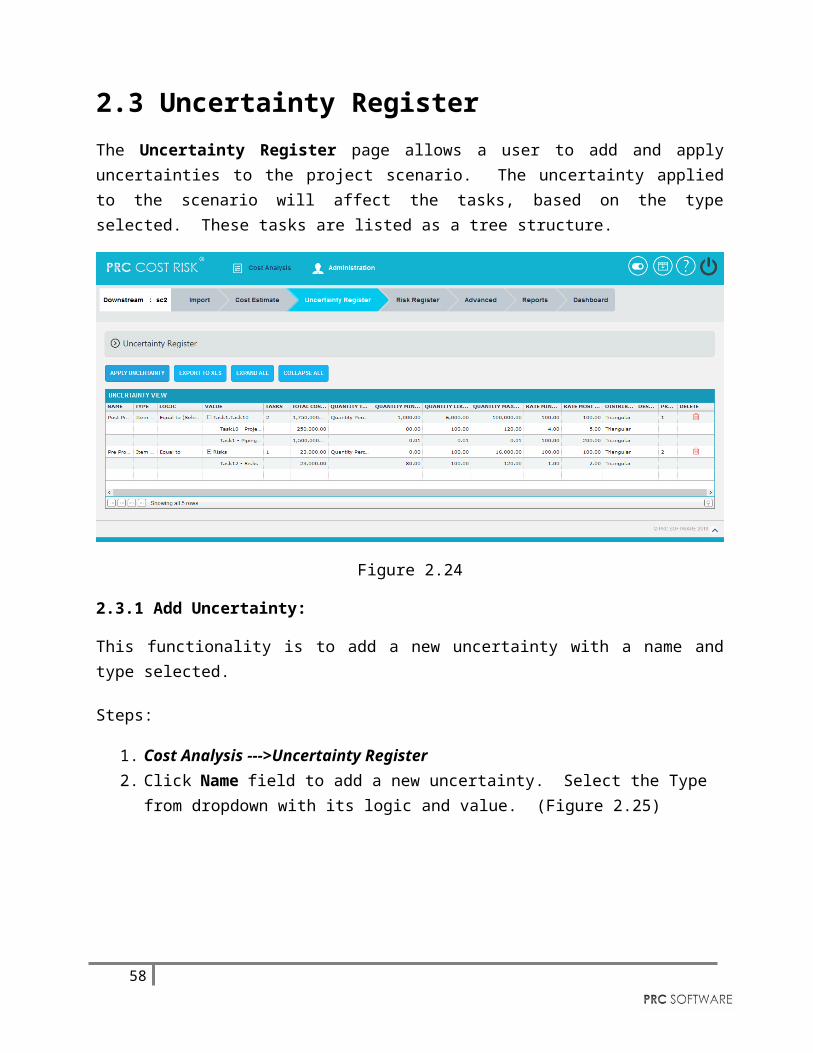
Figure 2.35
Figure 2.36
58
2.4.5 Filter Data:
This functionality is used to filter the data according to a particular field and its selected values for risk / task.
Steps:
1. Risk Register --> Risks2. Select the required column from the Filter by dropdown. (Figure 2.32) 3. Enter the value in the textbox provided or select a value from the drop down based on
which filtering is to be done. (Figure 2.37) While giving conditions with ‘select multiple’ option to filter, a pop up appears (Figure 2.38) where the multiple risks can be selected.
4. Click the SHOW button (Figure 2.37). The filtered data will be displayed.
Figure 2.37
Figure 2.38
2.4.6 Select Risks
This functionality is used to select multiple risks.
59
Steps:
1. Risk Register --> Risks2. Click on the SELECT RISKS button. (Figure 2.32) 3. Checkboxes appears on the first column of each mapping which can be ticked for selecting
corresponding mappings. (Figure 2.39)
Figure 2.39
2.4.7 Delete Multiple
This functionality is used to delete multiple risks from the project.
Steps:
1. Risk Register --> Risks2. Click on the SELECT RISKS button. (Figure 2.32) 3. Tick the checkboxes of the corresponding risks which are to be deleted. (Figure 2.39)4. Click on the DELETE RISKS button. (Figure 2.39)5. A pop up appears. Click OK to delete or click Cancel. (Figure 2.40)
Figure 2.40
60
2.5 Risk Register (Risk Mappings)The Risk Register (Risk Mappings) page allows user to assign risks to the tasks in the project selected. The risks can be of two types; Threat which gives a negative impact to the task, and Opportunity which gives a positive impact to the task. A risk can be assigned to multiple tasks in the project.
Figure 2.41
2.5.1 Map Risk to Tasks:
This functionality is used to assign the added risks to tasks.
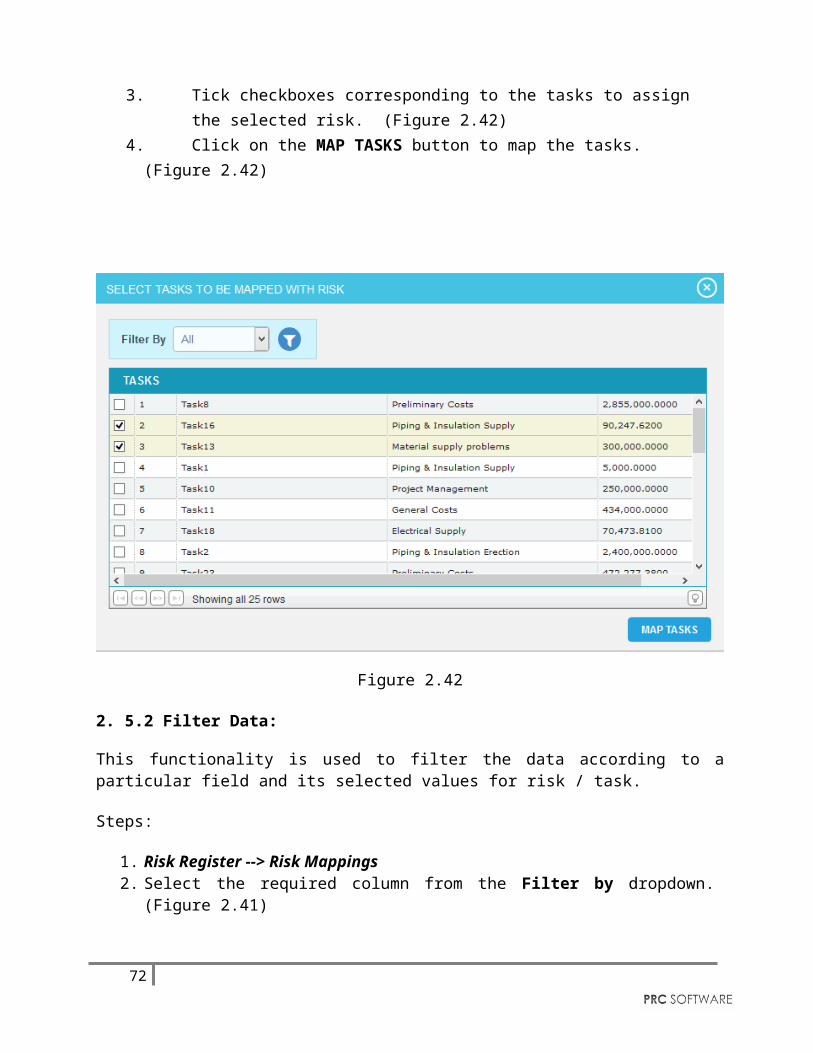
Steps:
1. Risk Register --> Risk Mappings2. Click on the risk id column which has to be assigned to the tasks. (Figure 2.41)3. Tick checkboxes corresponding to the tasks to assign the selected risk. (Figure 2.42)4. Click on the MAP TASKS button to map the tasks. (Figure 2.42)
61
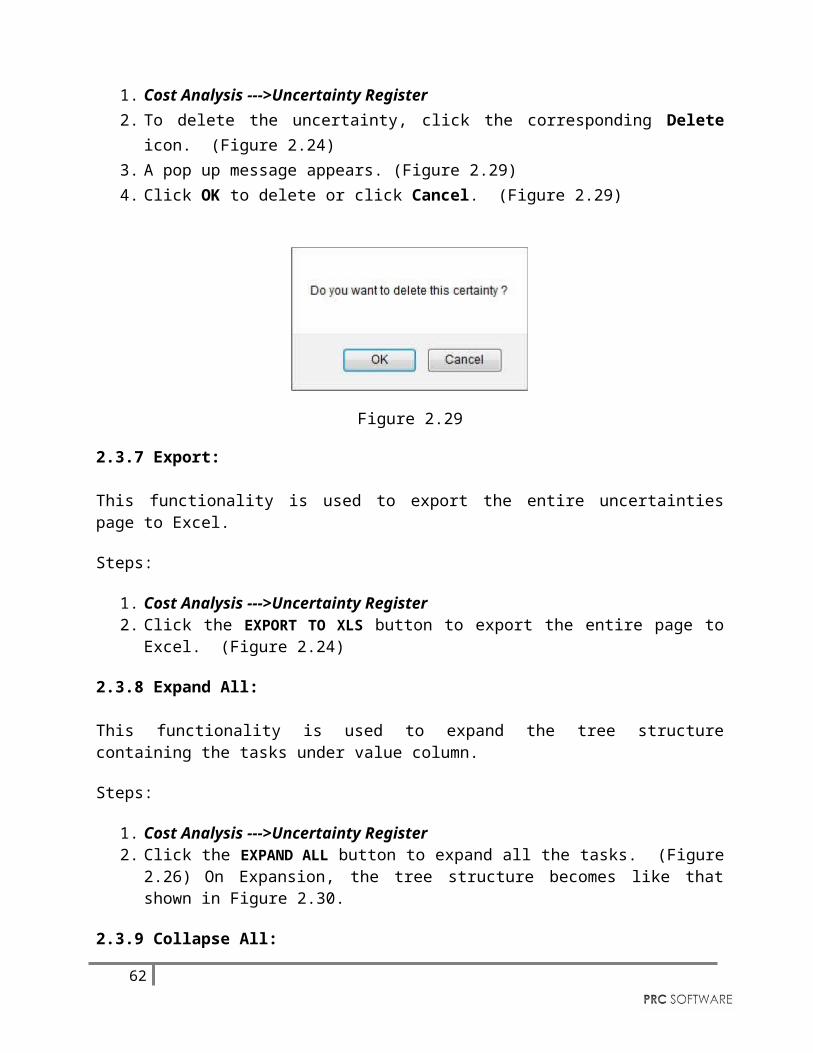
Figure 2.42
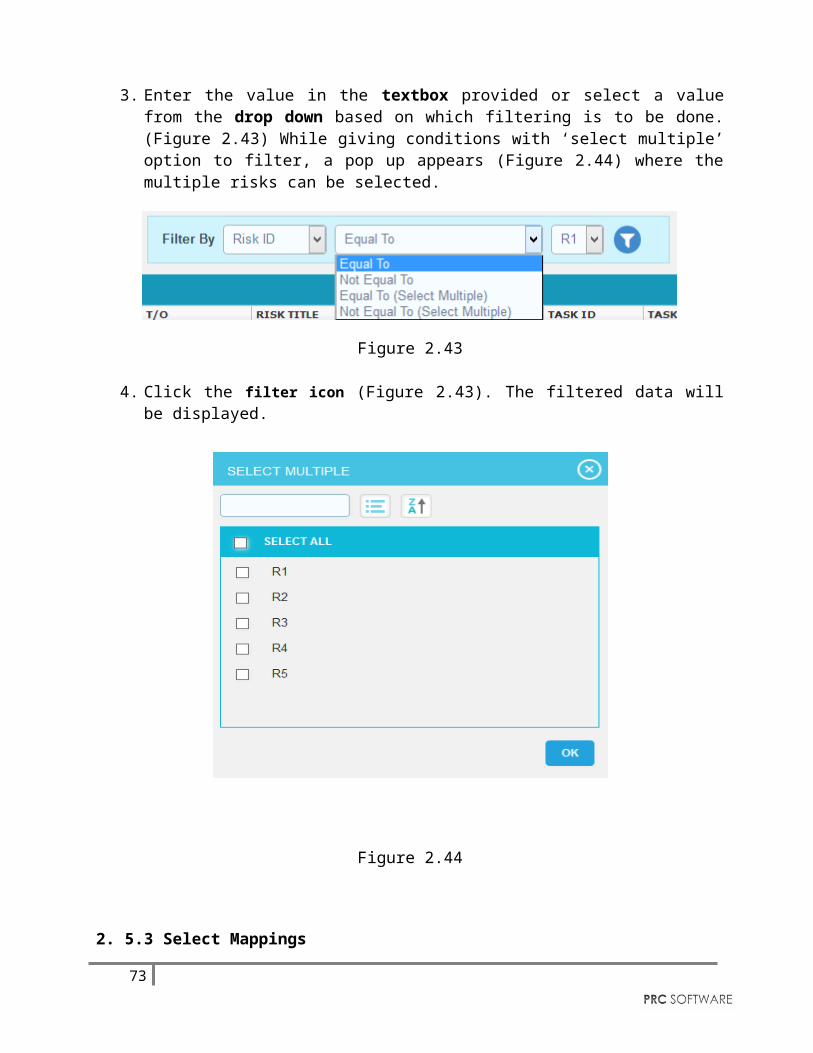
2. 5.2 Filter Data:
This functionality is used to filter the data according to a particular field and its selected values for risk / task.
Steps:
1. Risk Register --> Risk Mappings2. Select the required column from the Filter by dropdown. (Figure 2.41) 3. Enter the value in the textbox provided or select a value from the drop down based on
which filtering is to be done. (Figure 2.43) While giving conditions with ‘select multiple’ option to filter, a pop up appears (Figure 2.44) where the multiple risks can be selected.
Figure 2.43
4. Click the filter icon (Figure 2.43). The filtered data will be displayed.
62
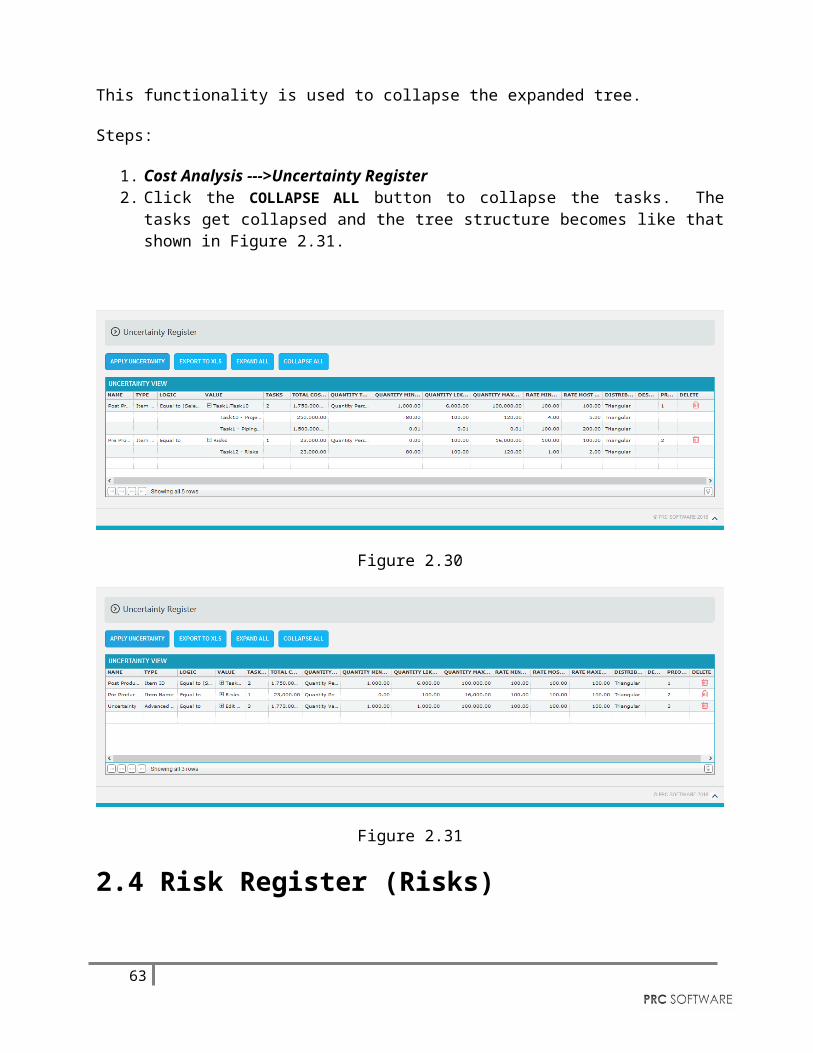
Figure 2.44
2. 5.3 Select Mappings
This functionality is used to select multiple mappings.
Steps:
1. Risk Register --> Risk Mappings2. Click on the SELECT MAPPINGS button. (Figure 2.41) 3. Checkboxes appears on the first column of each mapping which can be ticked for selecting
corresponding mappings. (Figure 2.44)
63
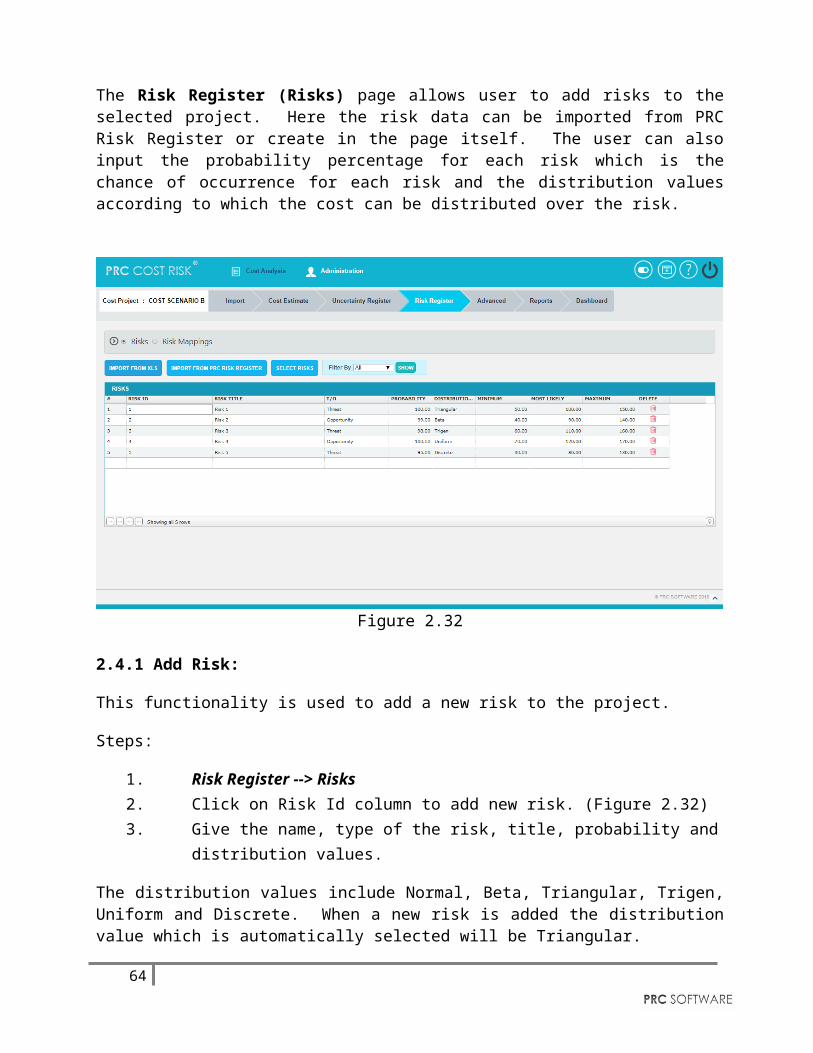
Figure 2.45
2. 5.4 Delete Multiple
This functionality is used to delete multiple mappings from the project.
Steps:
1. Risk Register --> Risk Mappings2. Click on the SELECT MAPPINGS button. (Figure 2.41) 3. Tick the checkboxes of the corresponding mappings which are to be deleted. (Figure 2.45)4. Click on the DELETE MAPPINGS button. (Figure 2.45)5. To delete single risk mappings from the project, click Delete icon corresponding to each
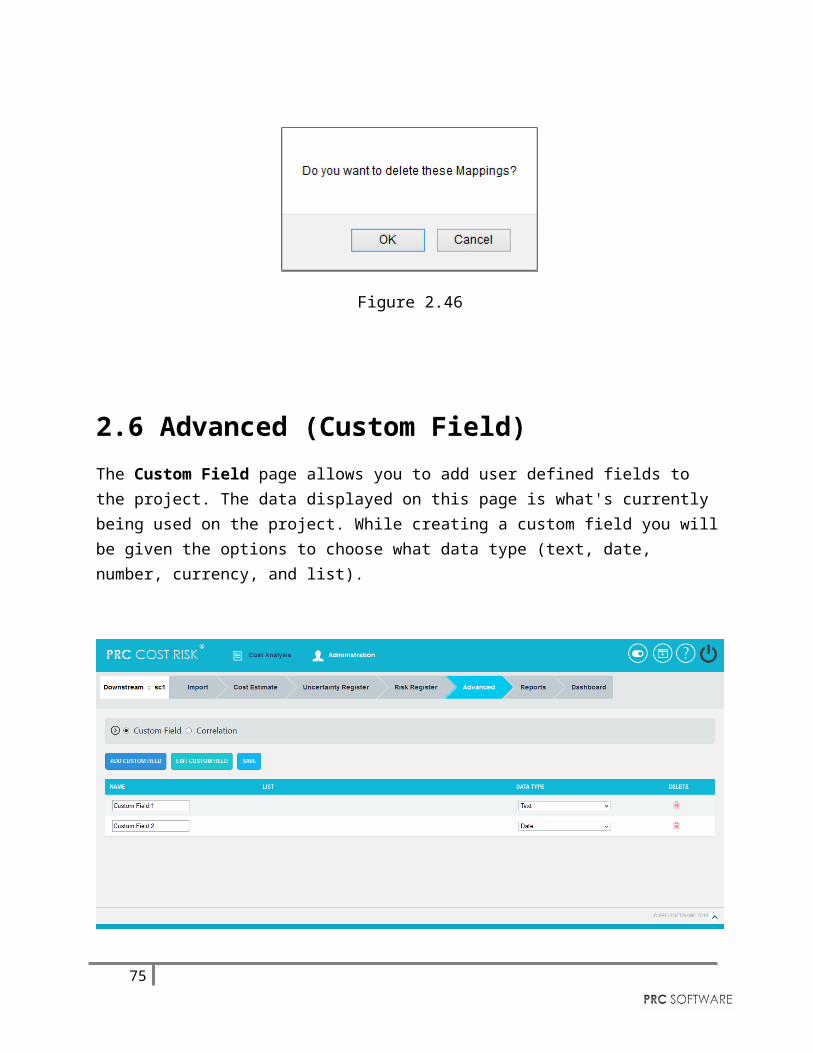
risk. (Figure 2.41)6. A pop up appears. Click OK to delete or click Cancel. (Figure 2.46)
Figure 2.46
64
2.6 Advanced (Custom Field)The Custom Field page allows you to add user defined fields to the project. The data displayed on this page is what's currently being used on the project. While creating a custom field you will be given the options to choose what data type (text, date, number, currency, and list).
Figure 2.472.6.1 Add Custom Field:
This functionality is used to add new custom field to the selected project.
Steps:
1. Cost Analysis --->Advanced --->Custom Fields 2. Click the ADD CUSTOM FIELD button. (Figure 2.47)3. Enter the custom field name in the textbox provided. (Figure 2.48)4. Select data type from the dropdown. (Figure 2.48)5. For the data type List, enter the value in the Editable Combo box provided and click the
Add button. (Figure 2.49)6. Click SAVE button to finish. (Figure 2.50)
65
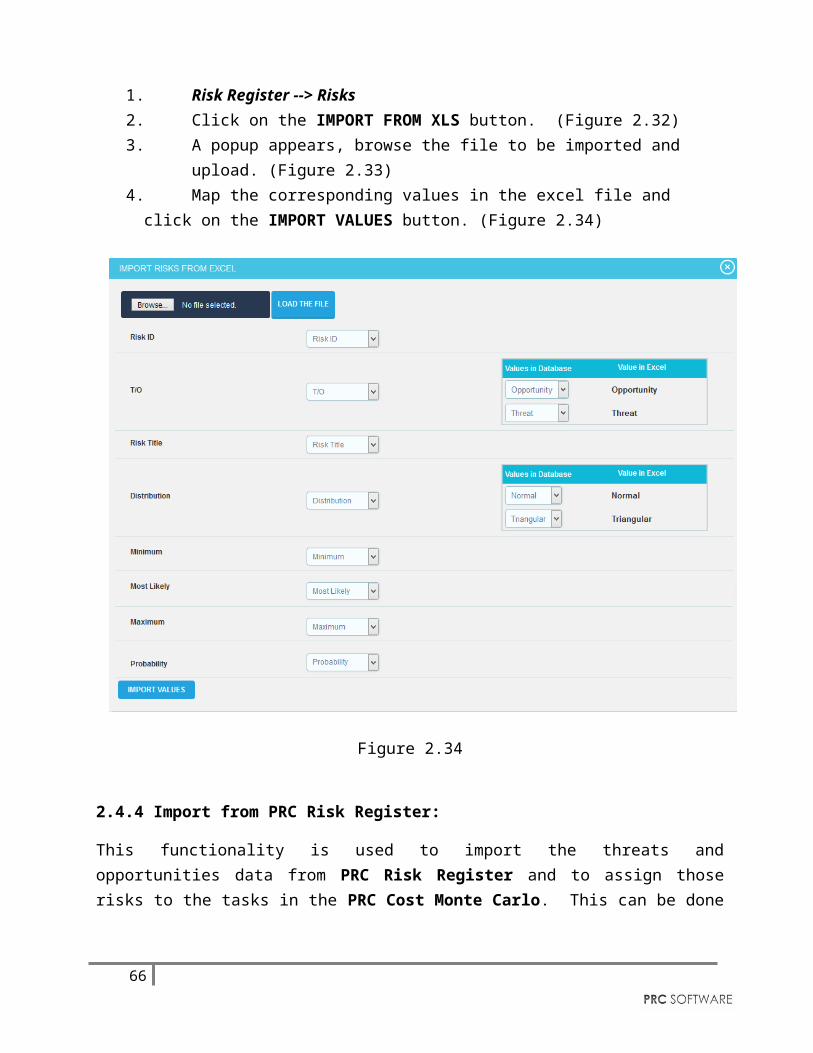
Figure 2.50
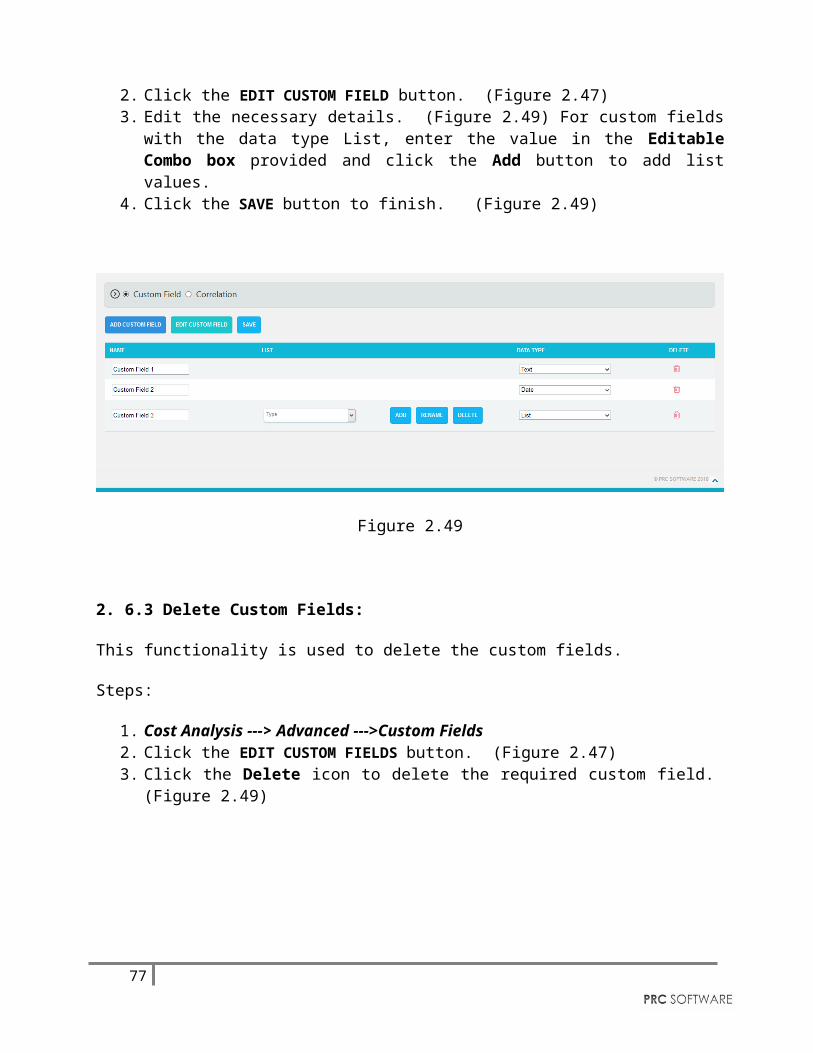
2. 6.2 Edit Custom Fields:
This functionality is used to edit existing custom fields.
Steps:
1. Cost Analysis ---> Advanced --->Custom Fields 2. Click the EDIT CUSTOM FIELD button. (Figure 2.47)3. Edit the necessary details. (Figure 2.49) For custom fields with the data type List, enter
the value in the Editable Combo box provided and click the Add button to add list values.
4. Click the SAVE button to finish. (Figure 2.49)
Figure 2.49
66
2. 6.3 Delete Custom Fields:
This functionality is used to delete the custom fields.
Steps:
1. Cost Analysis ---> Advanced --->Custom Fields 2. Click the EDIT CUSTOM FIELDS button. (Figure 2.47)3. Click the Delete icon to delete the required custom field. (Figure 2.49)
67
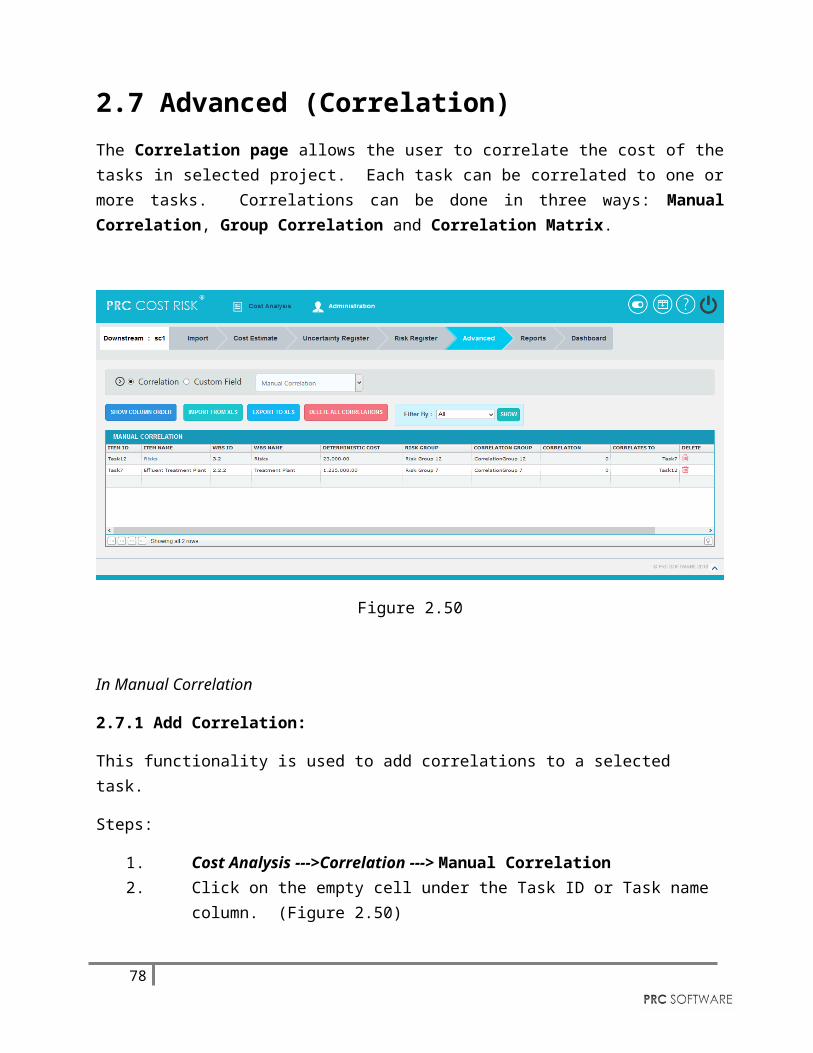
2.7 Advanced (Correlation)The Correlation page allows the user to correlate the cost of the tasks in selected project. Each task can be correlated to one or more tasks. Correlations can be done in three ways: Manual Correlation, Group Correlation and Correlation Matrix.
Figure 2.50
In Manual Correlation
2.7.1 Add Correlation:
This functionality is used to add correlations to a selected task.
Steps:
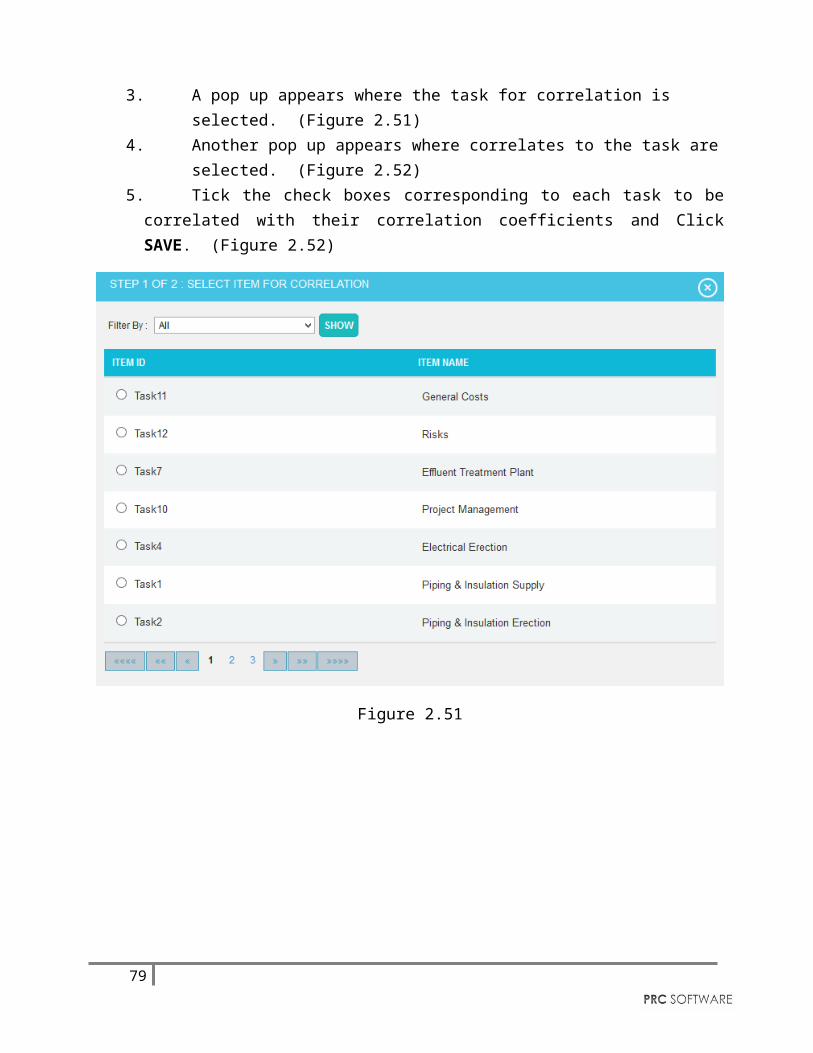
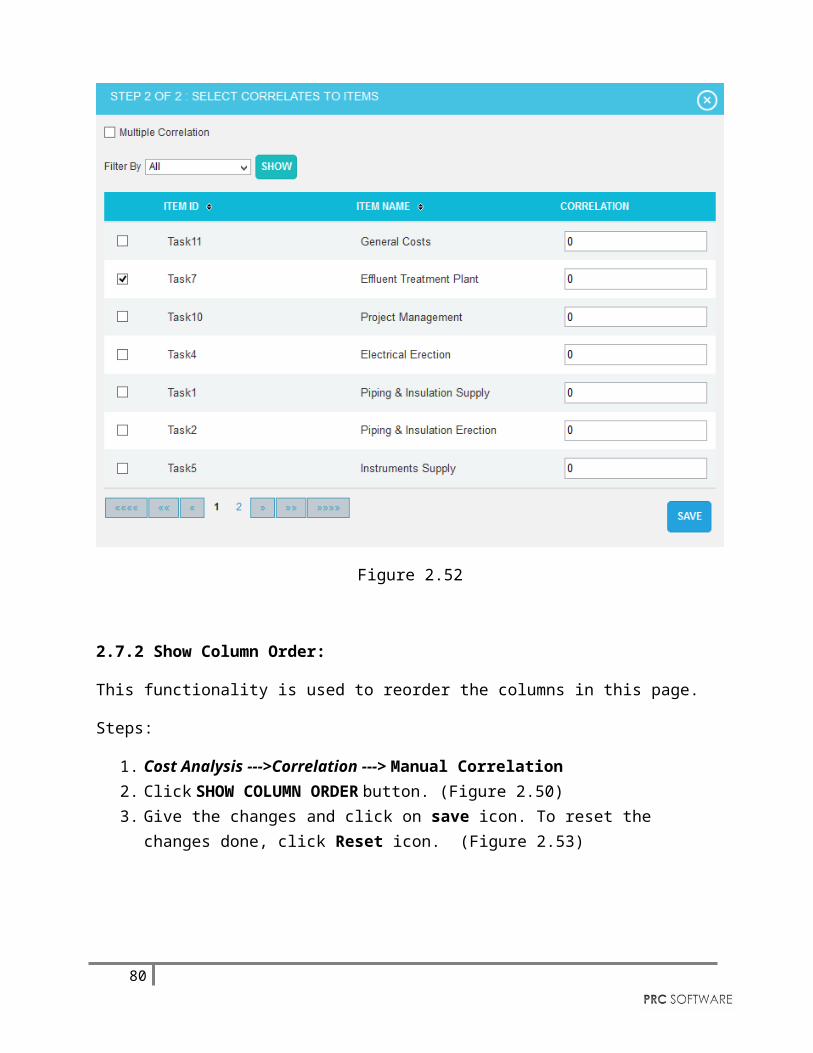
1. Cost Analysis --->Correlation ---> Manual Correlation2. Click on the empty cell under the Task ID or Task name column. (Figure 2.50)3. A pop up appears where the task for correlation is selected. (Figure 2.51)4. Another pop up appears where correlates to the task are selected. (Figure 2.52)5. Tick the check boxes corresponding to each task to be correlated with their correlation
coefficients and Click SAVE. (Figure 2.52)
68
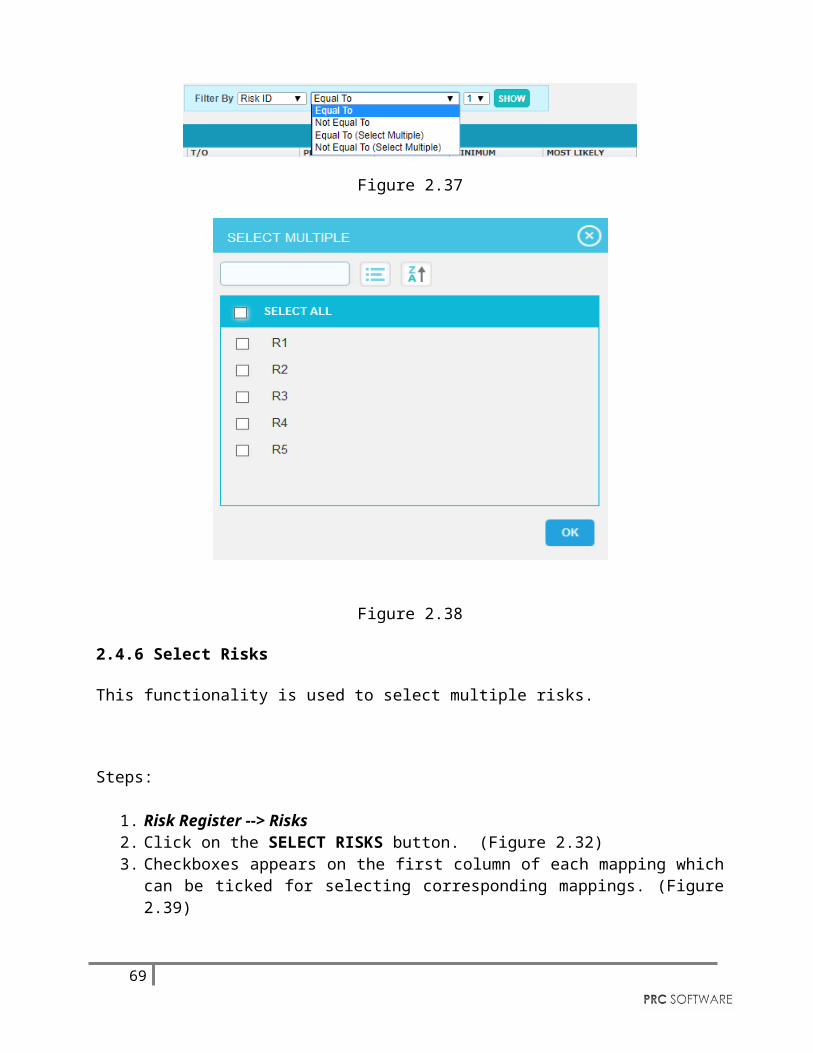
Figure 2.51
69
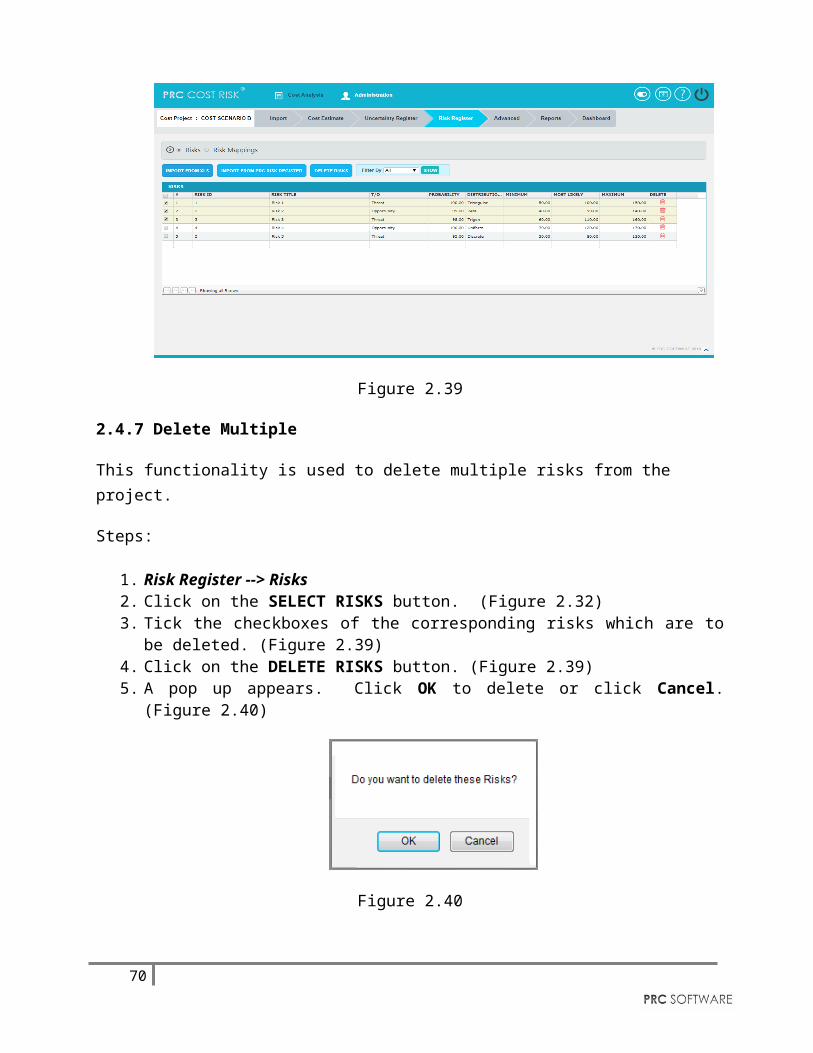
Figure 2.52
2.7.2 Show Column Order:
This functionality is used to reorder the columns in this page.
Steps:
1. Cost Analysis --->Correlation ---> Manual Correlation2. Click SHOW COLUMN ORDER button. (Figure 2.50)3. Give the changes and click on save icon. To reset the changes done, click Reset icon.
(Figure 2.53)
70
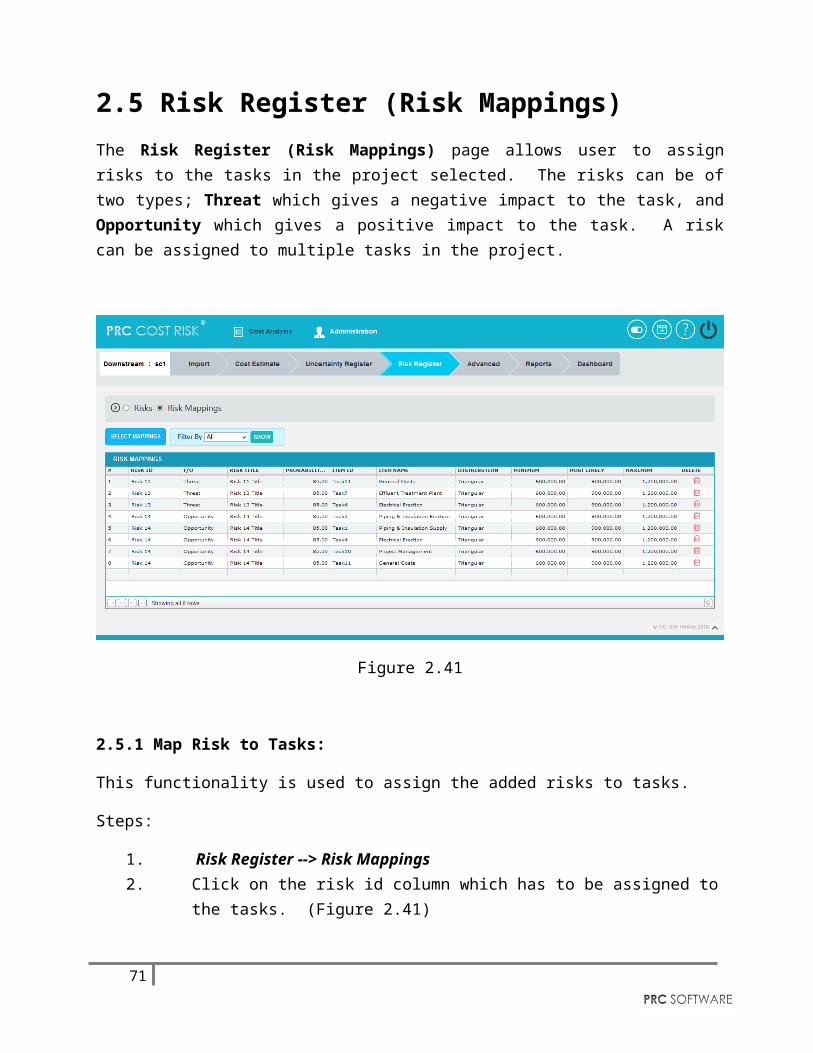
Figure 2.53
2.7.3 Delete All Correlations:
This functionality is used to delete or remove all correlations.
Steps:
1. Cost Analysis --->Correlation ---> Manual Correlation 2. Click DELETE ALL CORRELATIONS button. An alert box appears. (Figure 2.54)3. Click OK to remove or click Cancel. (Figure 2.54)
Figure 2.54
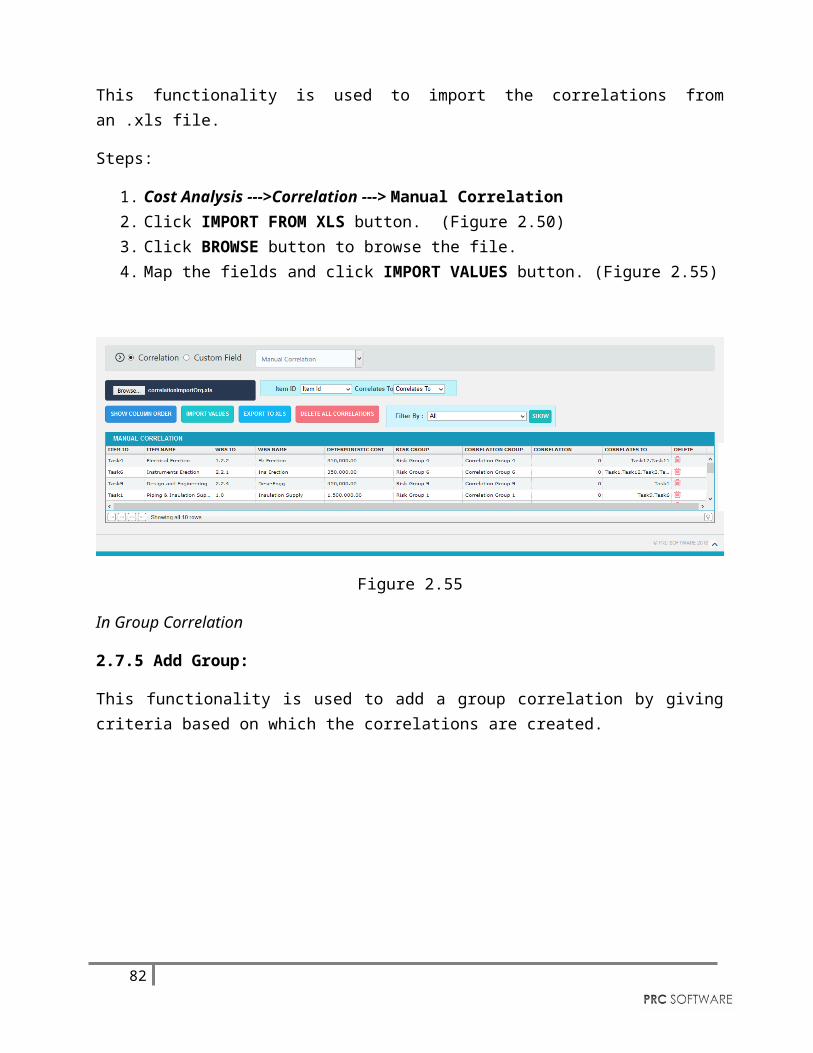
2.7.4 Import from xls:
This functionality is used to import the correlations from an .xls file.
Steps:
1. Cost Analysis --->Correlation ---> Manual Correlation 2. Click IMPORT FROM XLS button. (Figure 2.50)
71
3. Click BROWSE button to browse the file.4. Map the fields and click IMPORT VALUES button. (Figure 2.55)
Figure 2.55
In Group Correlation
2.7.5 Add Group:
This functionality is used to add a group correlation by giving criteria based on which the correlations are created.
Figure 2.56
72
Steps:
1. Cost Analysis --->Correlation ---> Group Correlation2. Click ADD GROUP button and select field, criteria and its value, and correlation
coefficient based on which the correlations are given. (Figure 2.56)3. Click SAVE button. (Figure 2.56)4. To edit a group, click Edit icon and then save the changes. (Figure 2.56)5. To delete a group, click Delete icon. (Figure 2.56)
2.7.6 Create New Correlation Group:
This functionality is used to create a new correlation group with multiple filters.
Steps:
1. Cost Analysis -Correlation - Group Correlation2. Click CREATE NEW CORRELATION GROUP button to add correlation groups.
(Figure 2.56) 3. A pop up appears where the groups are created with a correlation group name and click
SAVE button. (Figure 2.57)4. Click the ADD FILTER to add another filter in the correlation group. (Figure 2.57)
Figure 2.57
The newly created correlation group is shown in the value combo and used to filter the tasks by selecting correlation group from the field dropdown with its criteria. (Figure 2.58)
73
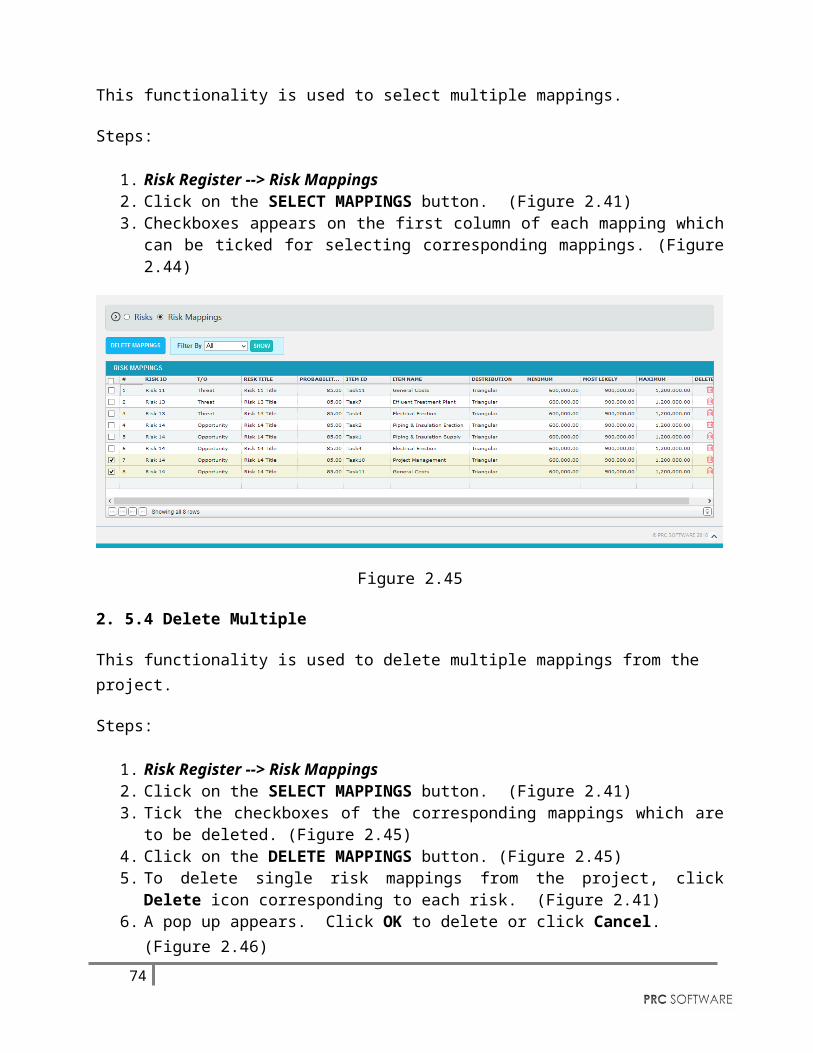
Figure 2.58
2.7.7 Delete Correlation Groups:
This functionality is used to delete the existing correlation groups.
Steps:
1. Cost Analysis --->Correlation ---> Group Correlation2. Click DELETE CORRELATION GROUPS button. (Figure 2.58) 3. A pop up appears where the existing correlation groups are selected and click DELETE
button. (Figure 2.59)
Figure 2.59
74
2.7.8 Delete All Correlations:
This functionality is used to delete or remove all correlations in every groups.
Steps:
1. Cost Analysis --->Correlation ---> Group Correlation 2. Click DELETE ALL CORRELATIONS button. An alert box appears. (Figure 2.60)3. Click OK to remove or click Cancel. (Figure 2.60)
Figure 2.60
2.7.9 Import from xls:
This functionality is used to import the correlations from an .xls file.
Steps:
1. Cost Analysis --->Correlation ---> Group Correlation2. Click IMPORT FROM XLS button. (Figure 2.56) 3. Click CHOOSE FILE button to browse the file. Map the fields and click IMPORT
VALUES button. (Figure 2.61)
75
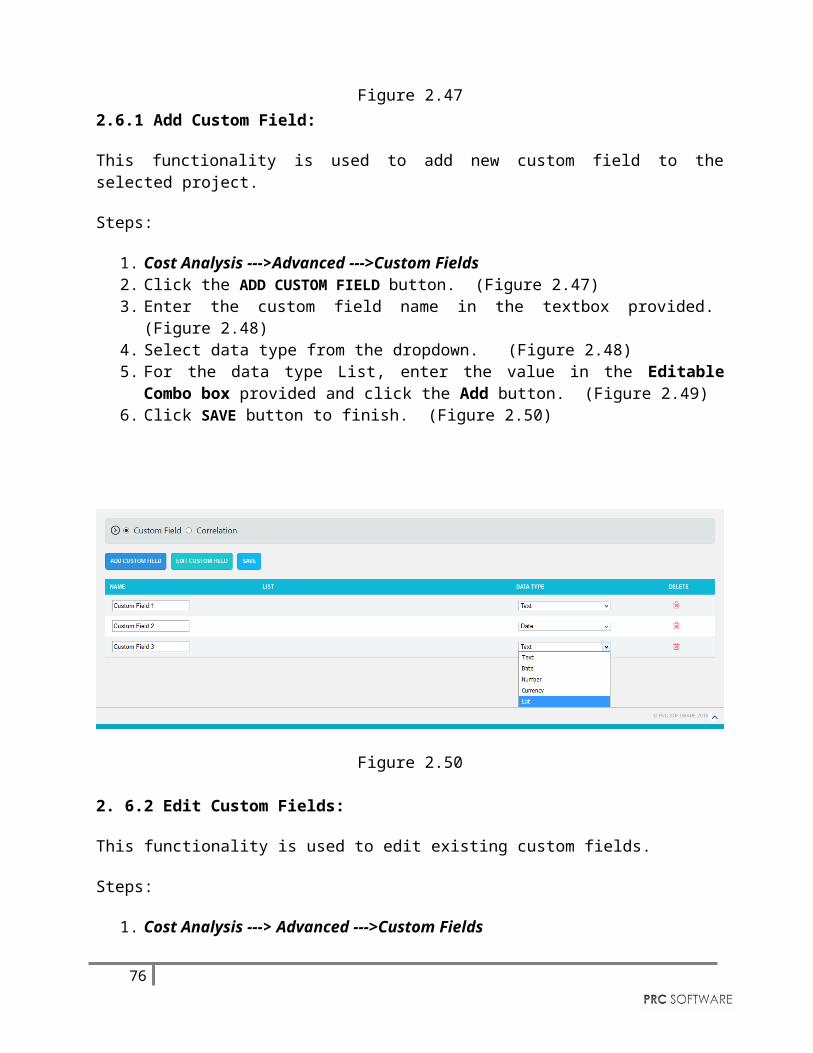
Figure 2.61
2.7.10 Export to xls:
This functionality is used to export the correlations that are added in this page to an .xls file.
Steps:
1. Cost Analysis --->Correlation ---> Manual Correlation/Group Correlation2. Click EXPORT TO XLS button (Figure 2.57 and Figure 2.61).
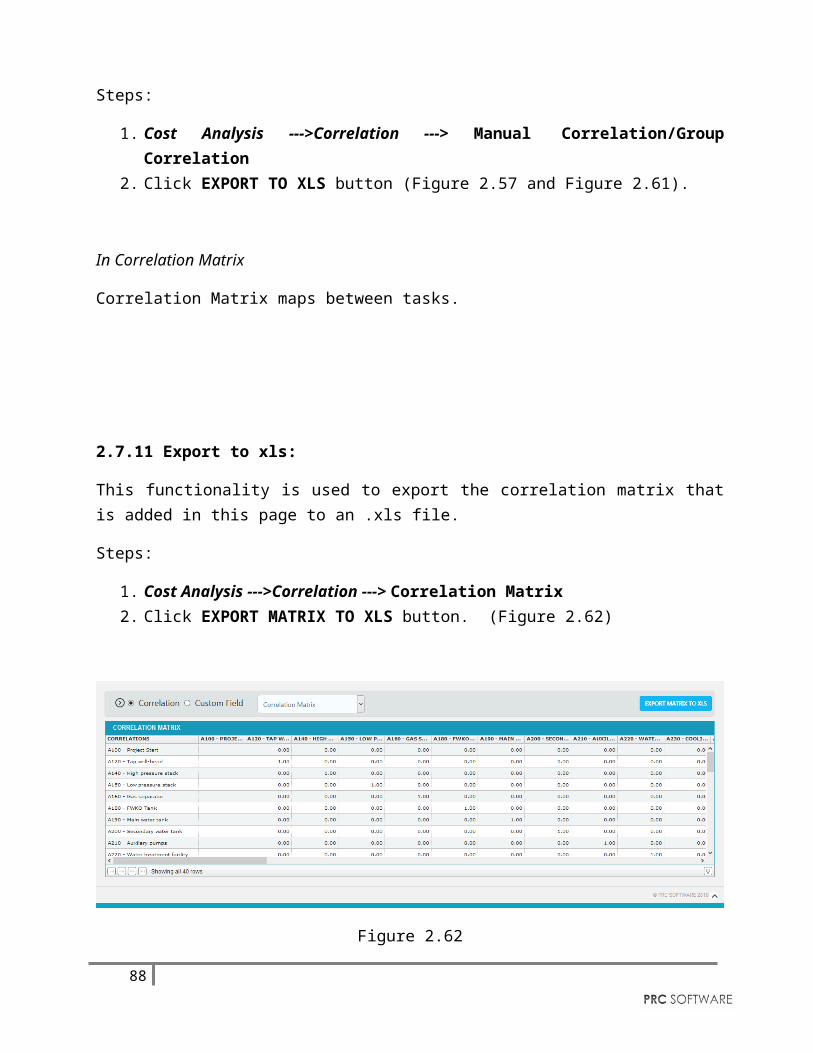
In Correlation Matrix
Correlation Matrix maps between tasks.
76
2.7.11 Export to xls:
This functionality is used to export the correlation matrix that is added in this page to an .xls file.
Steps:
1. Cost Analysis --->Correlation ---> Correlation Matrix 2. Click EXPORT MATRIX TO XLS button. (Figure 2.62)
Figure 2.62
77
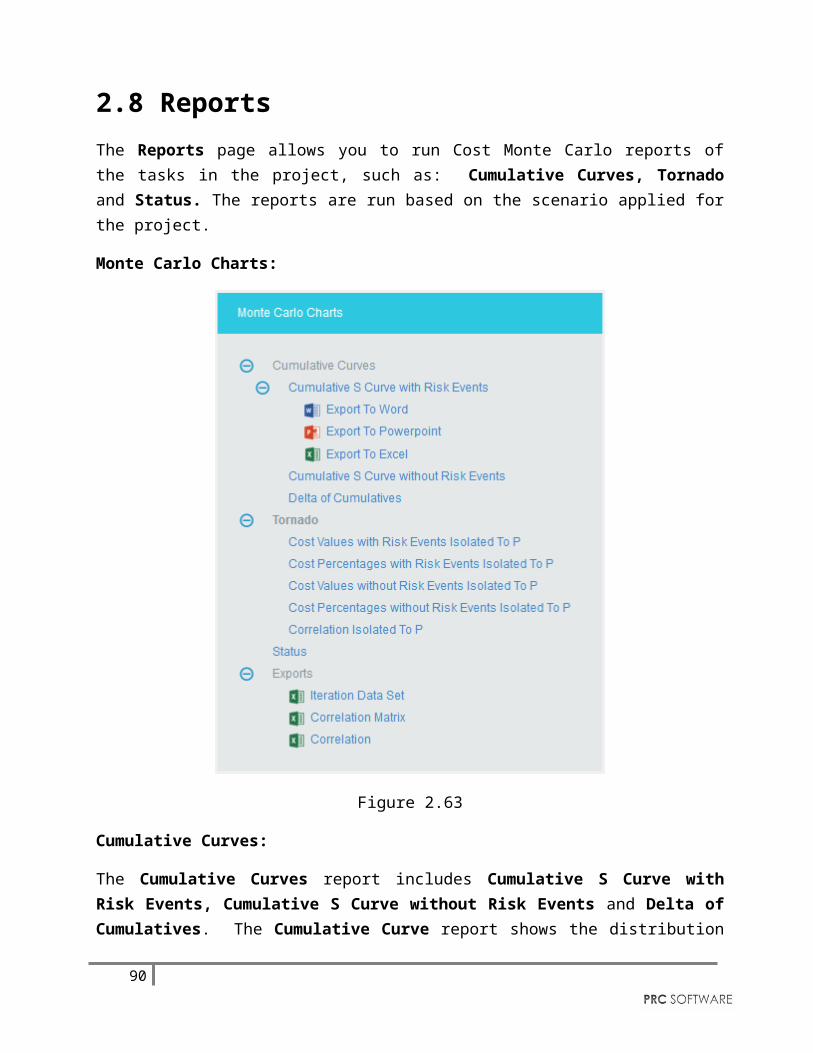
2.8 ReportsThe Reports page allows you to run Cost Monte Carlo reports of the tasks in the project, such as: Cumulative Curves, Tornado and Status. The reports are run based on the scenario applied for the project.
Monte Carlo Charts:
Figure 2.63
Cumulative Curves:
The Cumulative Curves report includes Cumulative S Curve with Risk Events, Cumulative S Curve without Risk Events and Delta of Cumulatives. The Cumulative Curve report shows the distribution of the estimated cost exposure of a selected project or task. It simulates cost values based on distribution types. The columns show the hits for each of the total amount of task simulation cost exposure.
78
The steps that are carried out to generate Cumulative Curves chart are follows:
Step 1: Generate risk groups for the given correlations. Grouping is done such that all the tasks that are correlated with one another are considered as a group.
Step 2: Generate correlated random values for each risk group. The static calculation is explained below:
a) Create a correlation matrix with correlation coefficients such that task which is more correlated comes in the first row. A correlation matrix is used to investigate the dependence between multiple variables at the same time. The result is a table containing the correlation coefficients between each variable and the others.
b) Calculate unspecified coefficients in the matrix from correlation of two related specified correlation coefficients.
b.1: Find Eigen values and Eigen vectors matrices of the inconsistent correlation matrix.
b.2: Replace the non-positive Eigen values with the smallest positive double number.
b.3: Create a Diagonal Matrix of Sqrt (1 / (Eigen Vectors^2 * Eigen Values))
b.4: Create a Diagonal Matrix of Sqrt (Eigen Values)
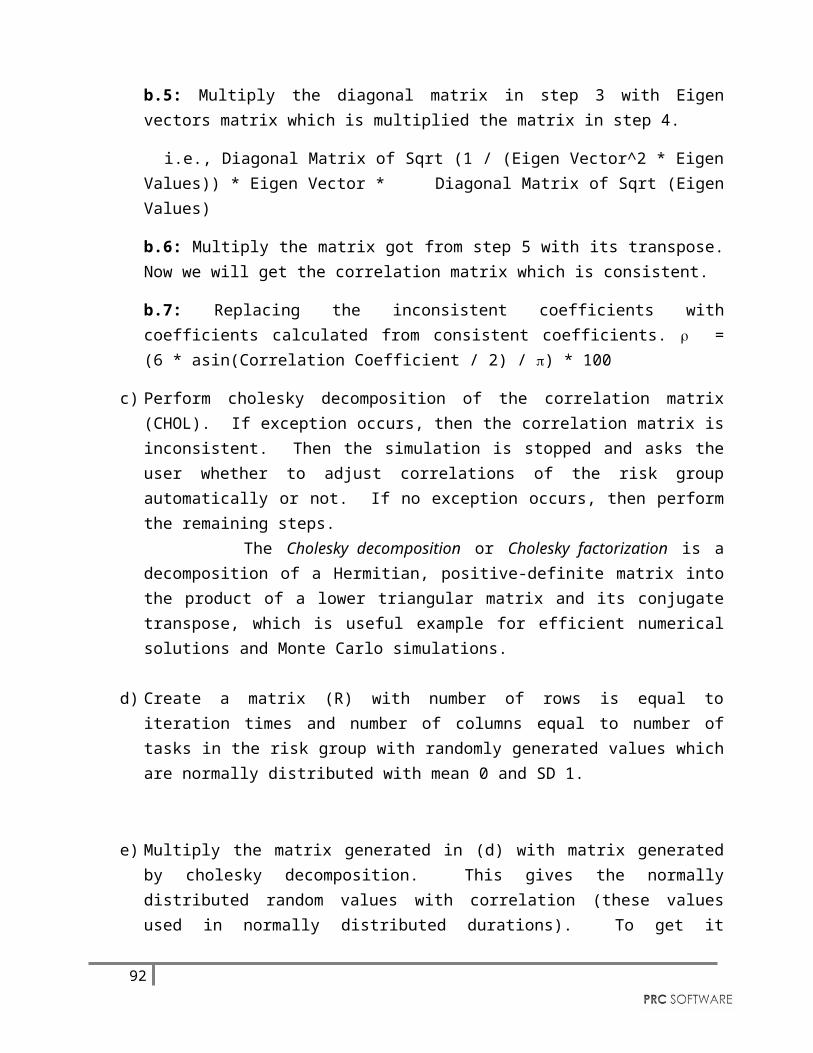
b.5: Multiply the diagonal matrix in step 3 with Eigen vectors matrix which is multiplied the matrix in step 4.
i.e., Diagonal Matrix of Sqrt (1 / (Eigen Vector^2 * Eigen Values)) * Eigen Vector * Diagonal Matrix of Sqrt (Eigen Values)
b.6: Multiply the matrix got from step 5 with its transpose. Now we will get the correlation matrix which is consistent.
b.7: Replacing the inconsistent coefficients with coefficients calculated from consistent coefficients. = (6 * asin(Correlation Coefficient / 2) / ) * 100
c) Perform cholesky decomposition of the correlation matrix (CHOL). If exception occurs, then the correlation matrix is inconsistent. Then the simulation is stopped and asks the user whether to adjust correlations of the risk group automatically or not. If no exception occurs, then perform the remaining steps.
The Cholesky decomposition or Cholesky factorization is a decomposition of a Hermitian, positive-definite matrix into the product of a lower triangular matrix and its conjugate transpose, which is useful example for efficient numerical solutions and Monte Carlo simulations.
79
d) Create a matrix (R) with number of rows is equal to iteration times and number of columns equal to number of tasks in the risk group with randomly generated values which are normally distributed with mean 0 and SD 1.
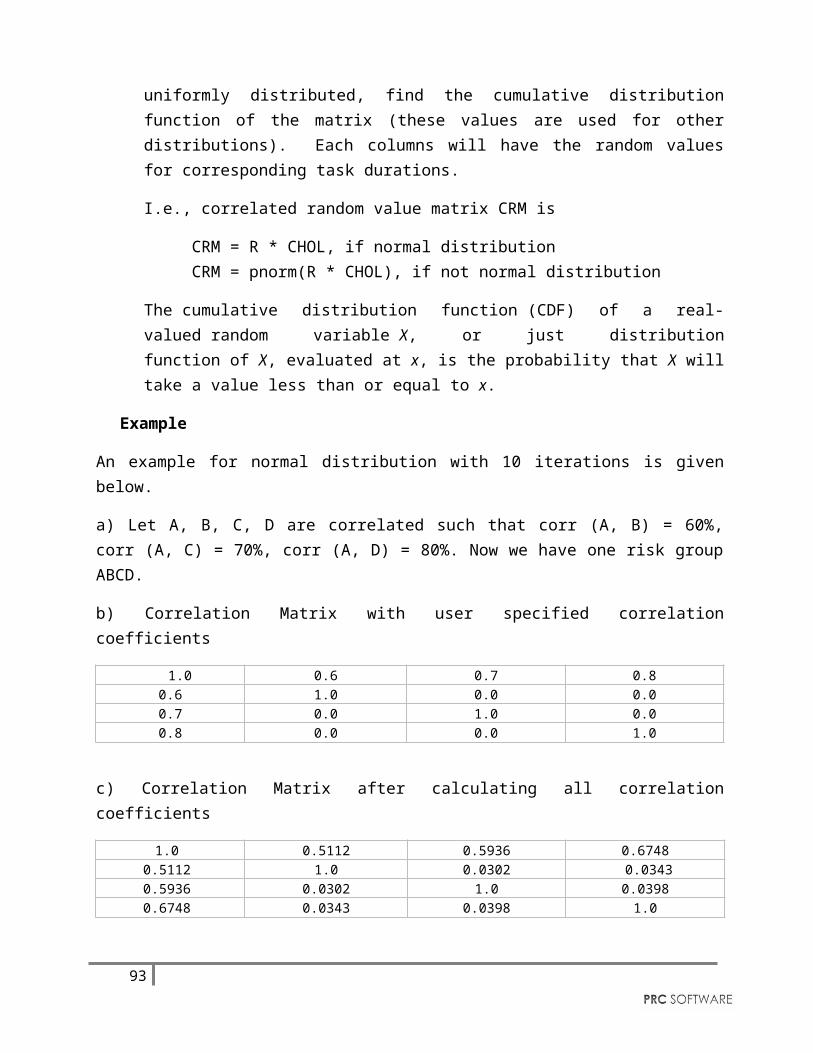
e) Multiply the matrix generated in (d) with matrix generated by cholesky decomposition. This gives the normally distributed random values with correlation (these values used in normally distributed durations). To get it uniformly distributed, find the cumulative distribution function of the matrix (these values are used for other distributions). Each columns will have the random values for corresponding task durations.
I.e., correlated random value matrix CRM is
CRM = R * CHOL, if normal distributionCRM = pnorm(R * CHOL), if not normal distribution
The cumulative distribution function (CDF) of a real-valued random variable X, or just distribution function of X, evaluated at x, is the probability that X will take a value less than or equal to x.
Example
An example for normal distribution with 10 iterations is given below.
a) Let A, B, C, D are correlated such that corr (A, B) = 60%, corr (A, C) = 70%, corr (A, D) = 80%. Now we have one risk group ABCD.
b) Correlation Matrix with user specified correlation coefficients
1.0 0.6 0.7 0.80.6 1.0 0.0 0.00.7 0.0 1.0 0.00.8 0.0 0.0 1.0
c) Correlation Matrix after calculating all correlation coefficients
1.0 0.5112 0.5936 0.67480.5112 1.0 0.0302 0.03430.5936 0.0302 1.0 0.03980.6748 0.0343 0.0398 1.0
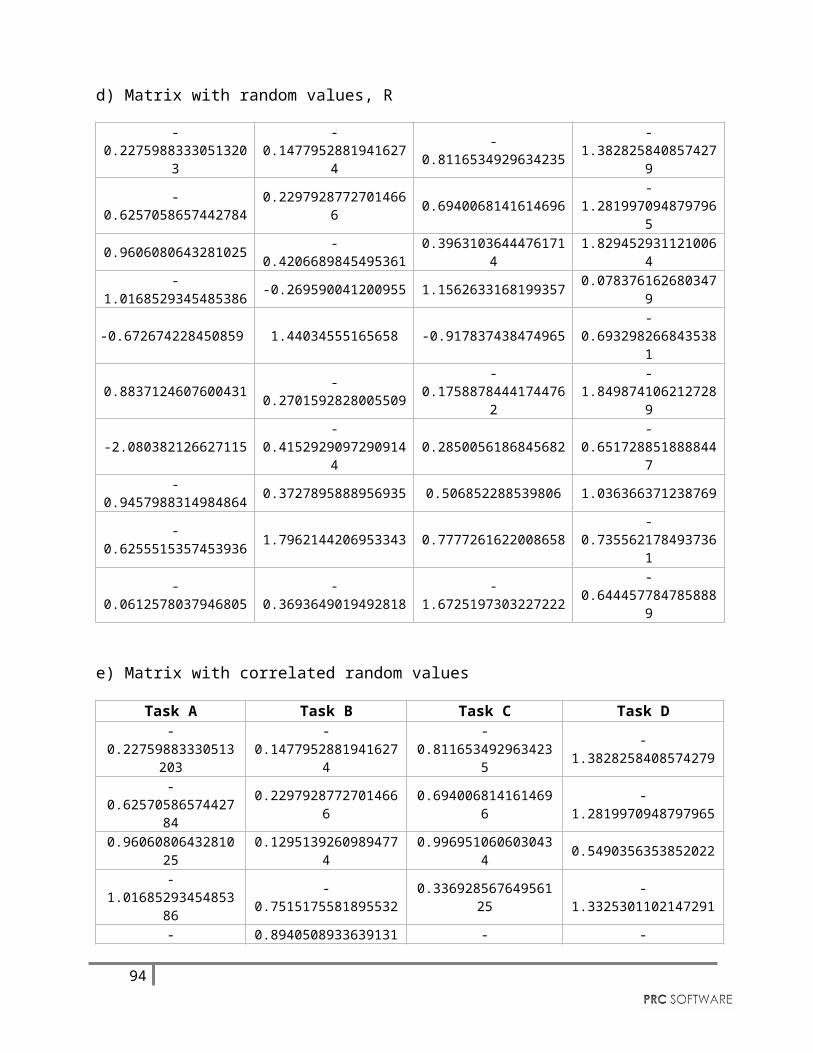
d) Matrix with random values, R
-0.22759883330513203 -0.14779528819416274 -0.8116534929634235 -1.3828258408574279-0.6257058657442784 0.22979287727014666 0.6940068141614696 -1.2819970948797965
80

0.9606080643281025 -0.4206689845495361 0.39631036444761714 1.8294529311210064-1.0168529345485386 -0.269590041200955 1.1562633168199357 0.0783761626803479-0.672674228450859 1.44034555165658 -0.917837438474965 -0.69329826684353810.8837124607600431 -0.2701592828005509 -0.17588784441744762 -1.8498741062127289-2.080382126627115 -0.41529290972909144 0.2850056186845682 -0.6517288518888447-0.9457988314984864 0.3727895888956935 0.506852288539806 1.036366371238769-0.6255515357453936 1.7962144206953343 0.7777261622008658 -0.7355621784937361-0.0612578037946805 -0.3693649019492818 -1.6725197303227222 -0.6444577847858889
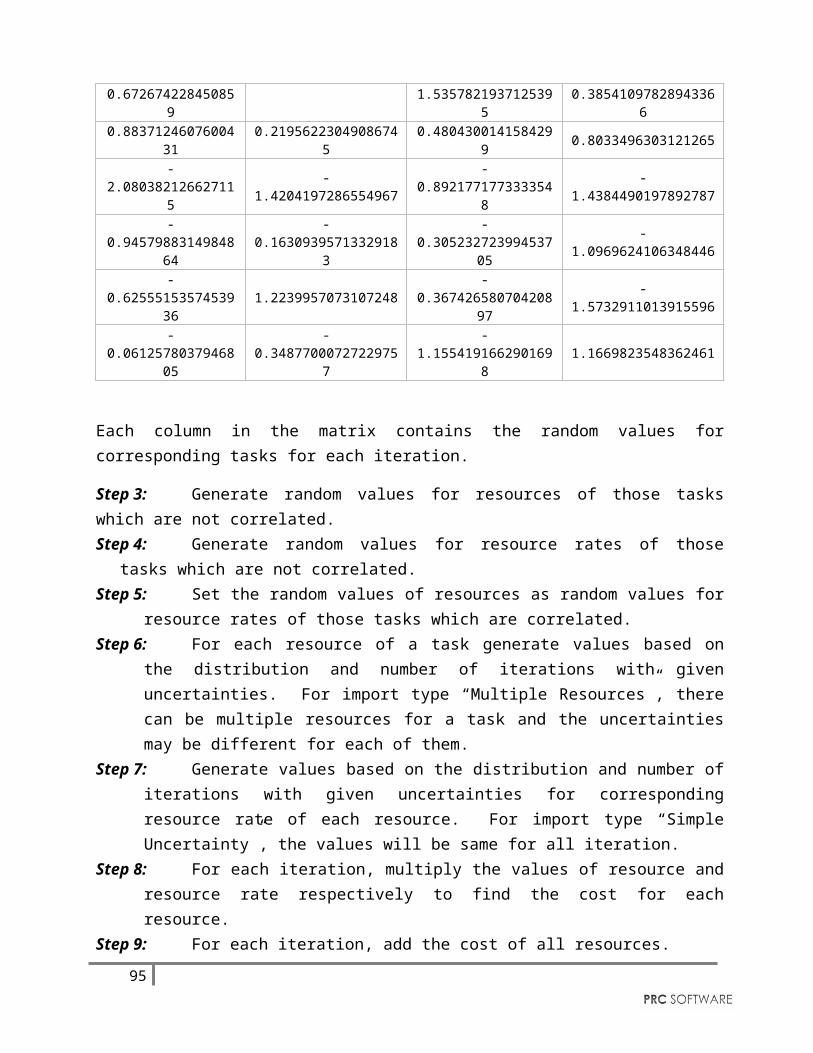
e) Matrix with correlated random values
Task A Task B Task C Task D-0.22759883330513203 -0.14779528819416274 -0.8116534929634235 -1.3828258408574279-0.6257058657442784 0.22979287727014666 0.6940068141614696 -1.28199709487979650.9606080643281025 0.12951392609894774 0.9969510606030434 0.5490356353852022-1.0168529345485386 -0.7515175581895532 0.33692856764956125 -1.3325301102147291-0.672674228450859 0.8940508933639131 -1.5357821937125395 -0.385410978289433660.8837124607600431 0.21956223049086745 0.4804300141584299 0.8033496303121265-2.080382126627115 -1.4204197286554967 -0.8921771773333548 -1.4384490197892787-0.9457988314984864 -0.16309395713329183 -0.30523272399453705 -1.0969624106348446-0.6255515357453936 1.2239957073107248 -0.36742658070420897 -1.5732911013915596-0.0612578037946805 -0.34877000727229757 -1.1554191662901698 1.1669823548362461
Each column in the matrix contains the random values for corresponding tasks for each iteration.
Step 3: Generate random values for resources of those tasks which are not correlated.Step 4: Generate random values for resource rates of those tasks which are not correlated.Step 5: Set the random values of resources as random values for resource rates of those tasks
which are correlated.Step 6: For each resource of a task generate values based on the distribution and number of
iterations with given uncertainties. For import type “Multiple Resources”, there can be multiple resources for a task and the uncertainties may be different for each of them.
Step 7: Generate values based on the distribution and number of iterations with given uncertainties for corresponding resource rate of each resource. For import type “Simple Uncertainty”, the values will be same for all iteration.
Step 8: For each iteration, multiply the values of resource and resource rate respectively to find the cost for each resource.
Step 9: For each iteration, add the cost of all resources.
Cumulative S Curve with Risk Events:
81
The Cumulative S Curve report shows the distribution of the estimated cost exposure of a selected project or task. It simulates cost values based on distribution types. The columns show the hits for each of the total amount of task simulation cost exposure. The S curve shows the cumulative frequency of the hits in percentage. To get individual task’s Cumulative S Curve report, select the task from the PROJECT REPORT dropdown.
Steps:
1. Cost Analysis--->Reports2. Click Cumulative S Curve with Risk Events link under Cumulative Curves. (Figure
2.63)3. Select the Bar width and set the Iteration Times and then click RUN ANALYSIS icon.
(Figure 2.65) The chart generated and the table is shown in the Figure 2.64
82
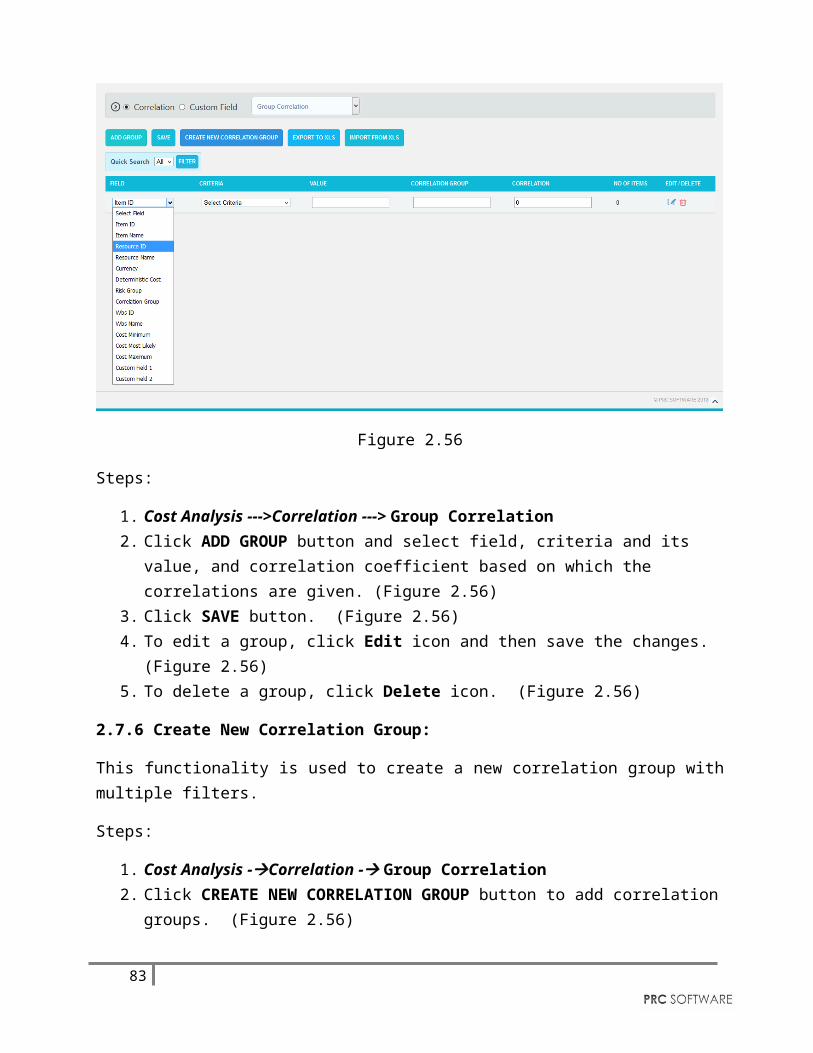
Figure 2.64
Cumulative S Curve without Risks:
The Cumulative S Curve report shows the distribution of the estimated cost exposure of a selected project or task without considering the risks associated with it. It simulates cost values based on distribution types. The columns show the hits for each of the total amount of task simulation cost exposure. The S curve shows the cumulative frequency of the hits in percentage.
Steps:
1. Cost Analysis--->Reports2. Click Cumulative S Curve without Risks link under Cumulative Curves. (Figure 2.63)3. Select the Bar width and set the Iteration Times and then click RUN ANALYSIS icon.
(Figure 2.65) The chart generated and the table is shown in the Figure 2.65
83
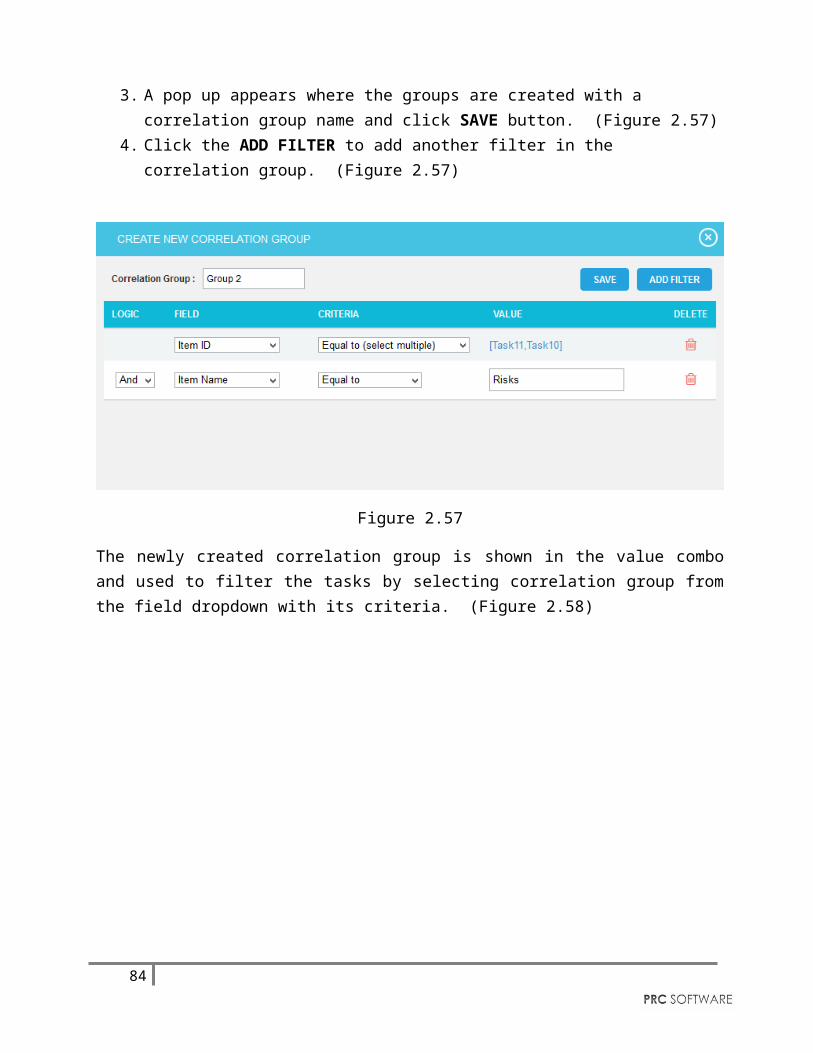
Figure 2.65
Delta of Cumulatives:
The Delta of Cumulative chart shows the variation S Curve of costs with risk and without risk.
Steps:
1. Cost Analysis--->Reports2. Click Delta of Cumulatives link under Cumulative Curves. (Figure 2.63)3. Set the Iteration Times and then click RUN ANALYSIS icon. (Figure 2.66) The chart
generated and the table is shown in the Figure 2.66
84
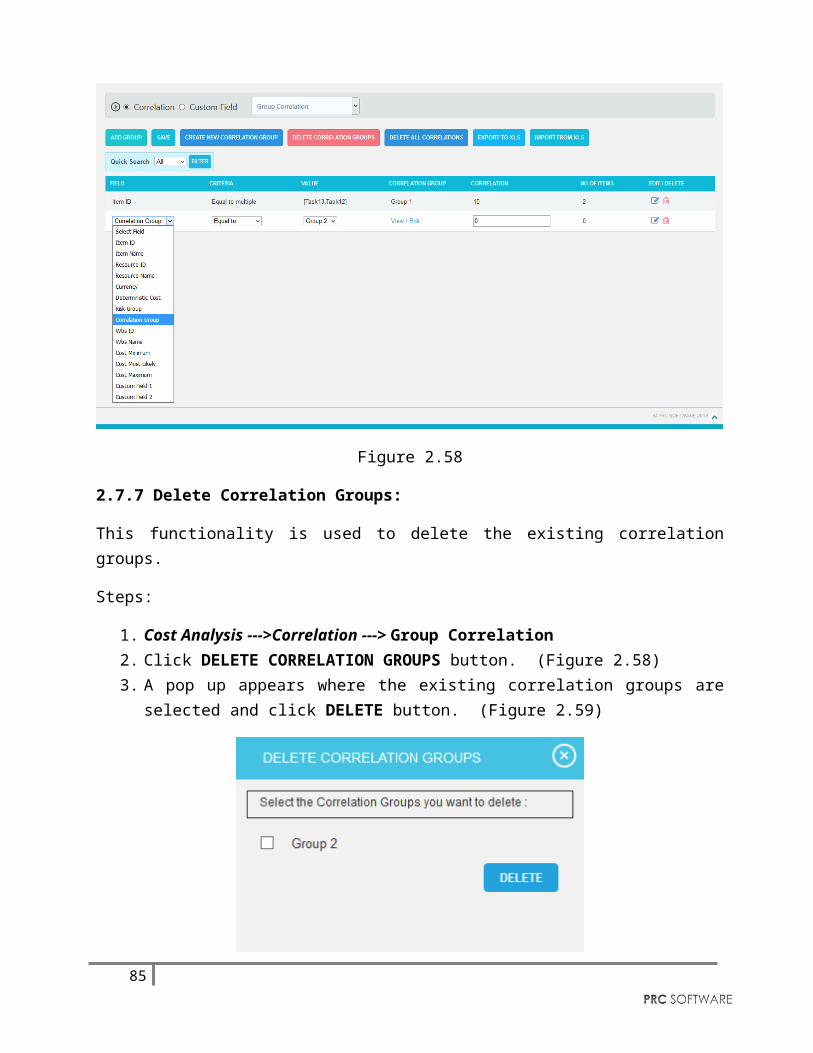
Figure 2.66
Tornado Charts:
The Cost Values with Risk Events Isolated To P, Cost Percentages with Risk Events Isolated To P, Cost Values without Risk Events Isolated To P, Cost Percentages without Risk Events Isolated To P and Correlation Isolated to P reports are Tornado Charts that depends on the simulated cost exposure values of each task up to the Pn iteration value, where ‘n’ is the percentile value of total number of iterations given. The x axis represents the cost exposure and the y axis represents the task names.
Cost Values with Risk Events Isolated To P:
85
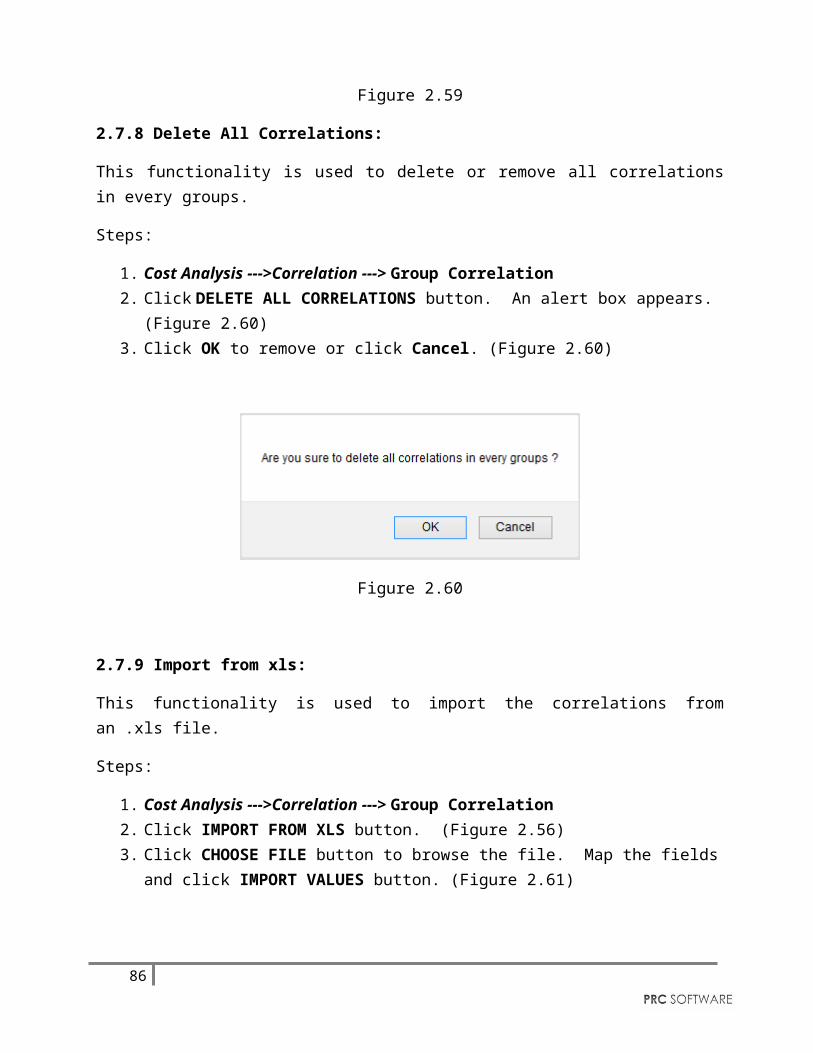
Figure 2.67
Cost Percentages with Risk Events Isolated To P:
86
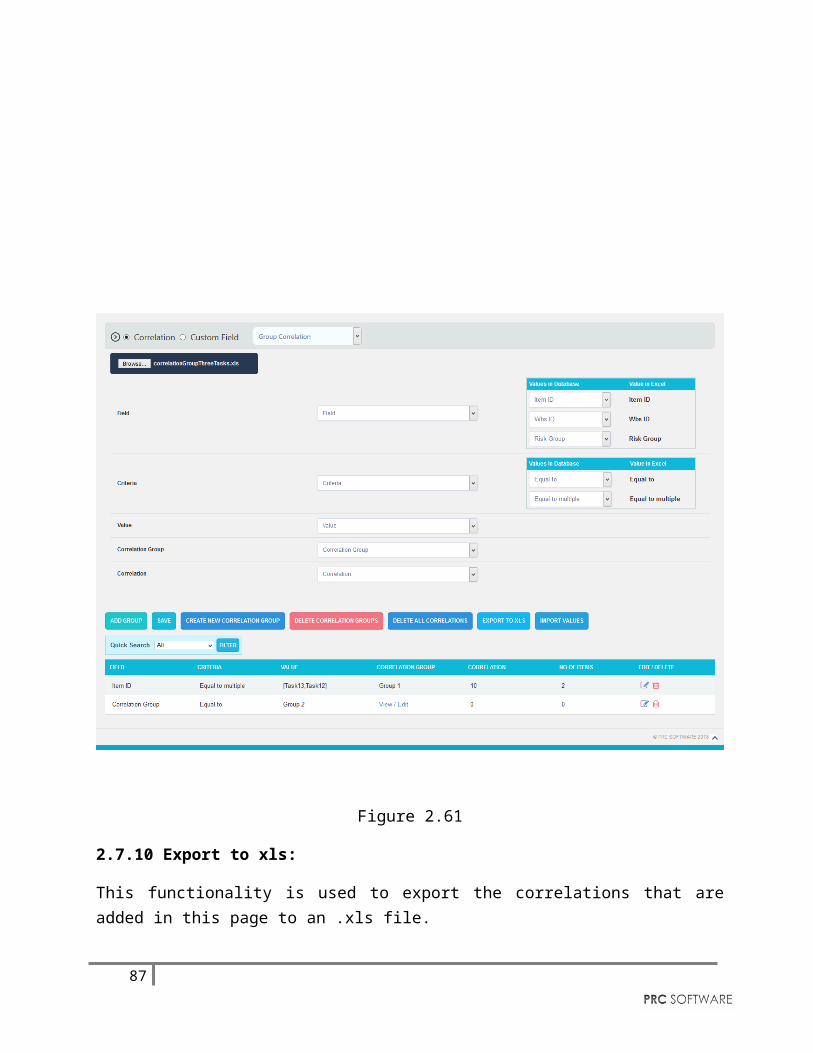
Figure 2.68
87
Cost Values without Risk Events Isolated To P:
Figure 2.69
88

Cost Percentages without Risk Events Isolated To P:
Figure 2.70
89
Correlation Isolated to P:
The step to generate the Correlation Isolated to P (n) chart is:
Pearson correlation coefficient for Total cost up to p(n) and Task cost up to p(n) * 100
Figure 2.71
90
Status charts:
This Monte Carlo chart is a pie chart which shows the total number of tasks included in the project. And the number of risks mapped to the tasks as threat and opportunities are also counted.
Steps:
1. Cost Analysis ---> Reports2. Click Status link under Monte Carlo Charts. (Figure 2.64) The chart generated and the
table is shown in the Figure 2.72
Figure 2.72
91
Tornado Charts:
Iteration Data Set:
This functionality is used to export the tasks with risk events and without risk events along with Item Id, Item Name and Budgeted cost of the selected project to MS Excel. A sample spreadsheet is shown in Figure 2.73. Iterations value are calculated for each task separately based on the number of iteration specified.
Figure 2.73
Correlation Matrix:
This functionality is used to generate a matrix of correlations existing between the tasks in the selected project. A sample spreadsheet is shown in Figure 2.74.
Figure 2.74
92
Correlation:
This functionality is used to generate the correlation between the tasks and their details in a tabular format. The columns to be displayed are determined by the selected column order in correlation page in the application. A sample spreadsheet is shown in Figure 2.75.
Figure 2.75
Export to Word:
This functionality is used to export the Cost Monte Carlo reports and data table as a Word document.
Steps:
1. Cost Analysis ---> Reports2. Click the Export to Word link. (Figure 2.64)
Export to PowerPoint:
This functionality is used to export the Cost Monte Carlo reports generated to PowerPoint.
Steps:
1. Cost Analysis ---> Reports2. Click the Export to PowerPoint link. (Figure 2.64)
93
Export to Excel:
This functionality is used to export the Cost Monte Carlo reports as an excel file.
Steps:
1. Cost Analysis ---> Reports2. Click the Export to Excel link. (Figure 2.64)
94
2.9 DashboardThe Project Dashboard page shows the 8 fixed graphs of the selected project, the Cumulative S Curve with Risk Events, Cumulative S Curve Without Risk Events, Delta of Cumulatives, Cost Values with Risk Events Isolated To P, Cost Percentages with Risk Events Isolated To P, Cost Values without Risk Events Isolated To P, Cost Percentages without Risk Events Isolated To P and Input Count. The Dashboard page is visible to only those users with Read/Write or View access.
To get individual task’s Cumulative S Curve, Cumulative S Curve without Risks and Delta of Cumulatives reports, select the particular task from the PROJECT REPORT dropdown.
95
96
Figure 2.76
2.9.1 Run Analysis
This functionality is used to generate Cumulative S Curve chart based on the number of iteration.
Steps:
1. Cost Analysis ---> Dashboard 2. Click RUN ANALYSIS icon to generate the task simulation reports. (Figure 2.77)
Figure 2.77
2.9.2 Check All:
This functionality is used to select all the charts in Dashboard page. (Figure 2.78)
Figure 2.78
2.9.3 Uncheck All:
This functionality is used to uncheck the selected charts. (Figure 2.79)
Figure 2.79
97
2.9.4 Export to Word:
This functionality is used to export the selected chart to MS Word.
Steps:
1. Cost Analysis ---> Dashboard 2. Select the chart using the provided checkbox in the corner of each chart. (Figure 2.76)3. Click the Word icon to export the chart to MS Word. (Figure 2.80)
Figure 2.80
2.9.5 Download Iteration Data:
This functionality is used to export the iteration data along with task details to MS Excel.
Steps:
1. Cost Analysis ---> Dashboard 2. Select the chart using the provided checkbox in the corner of each chart. (Figure 2.76)3. Click the Download Iteration Data icon to export the chart to MS Excel. (Figure 2.81)
Figure 2.81
2.9.6 Export to Excel:
This functionality is used to export the selected chart to MS Excel.
Steps:
1. Cost Analysis-Dashboard2. Select the chart using the provided checkbox in the corner of each chart. (Figure 2.76)3. Click the Excel icon to export the chart to MS Excel. (Figure 2.82)
98
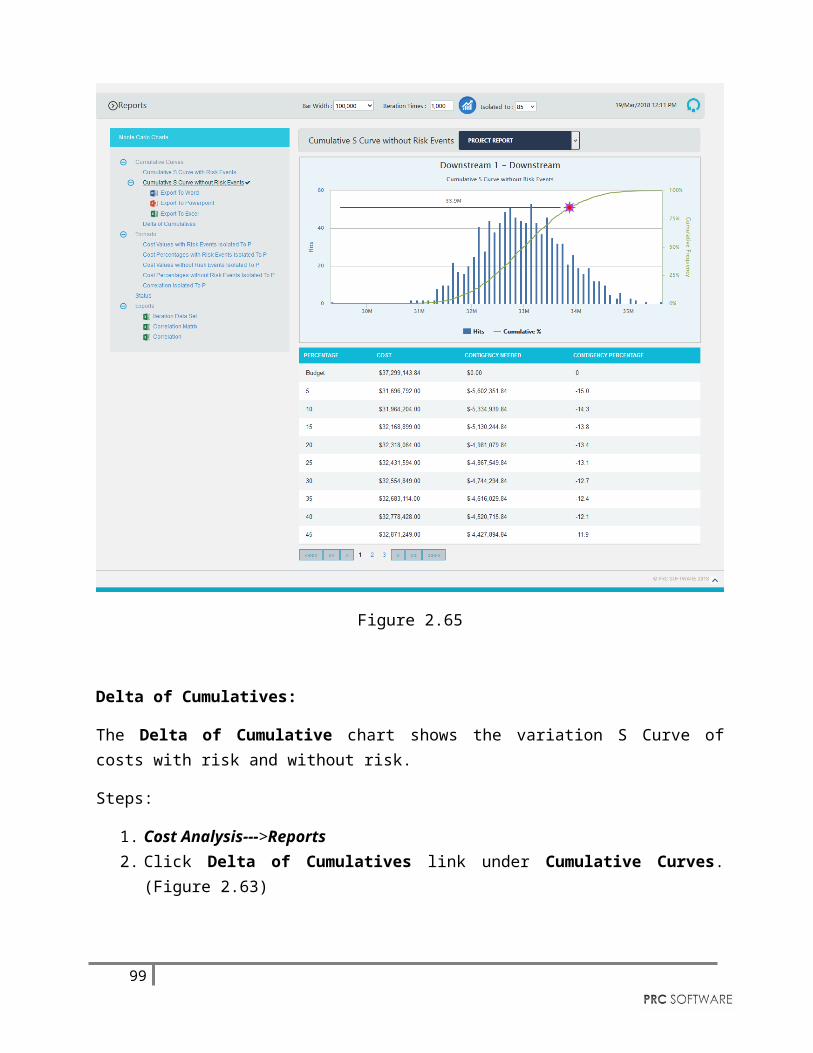
Figure 2.82
2.9.7 Export to Power Point:
This functionality is used to export the selected chart to MS Power Point.
Steps:
1. Cost Analysis ---> Dashboard 2. Select the chart using the provided checkbox in the corner of each chart. (Figure 2.76)3. Click the Power point icon to export the chart to MS Power Point. (Figure 2.83)
Figure 2.83
2.9.8 Download as zip:
This functionality allows you to download the selected reports as zip. (Figure 2.84)
Figure 2.84
99