Embed Size (px)
Citation preview
GLOBAL OVERVIEW ON GRID-PARITY EVENT DYNAMICS
Ch. Breyer and A. Gerlach
Q-Cells SE, Sonnenallee 17 - 21, 06766 Bitterfeld-Wolfen OT Thalheim, Germany,
Phone +49 (0) 3494 66 99-0, Fax +49 (0) 3494 66 99-199, E-mail: [email protected]
ABSTRACT
Grid-parity is a very important milestone for further photovoltaic (PV) diffusion. A grid-parity model is presented,
which is based on levelized cost of electricity (LCOE) coupled with the experience curve approach. Relevant
assumptions for the model are given and its key driving forces are discussed in detail. Results of the analysis are
shown for more than 150 countries and a total of 305 market segments all over the world. High PV industry growth
rates enable a fast reduction of LCOE. Depletion of fossil fuel resources and climate change mitigation forces
societies to internalize these effects and pave the way for sustainable energy technologies. First grid-parity events
occur right now. The 2010s are characterized by ongoing grid-parity events throughout the most regions in the world,
reaching an addressable market of about 75% up to 90% of total global electricity market. In consequence, new
political frameworks for maximizing social benefits will be required. In parallel, PV industry tackle its next
milestone, fuel-parity. In conclusion, PV is on the pathway to become a highly competitive energy technology.
Keywords
Grid-parity, Fuel-parity, Economic Analysis, Energy Options, PV Markets, Modelling, Sustainable, Strategy
1 INTRODUCTION
Installations of Photovoltaic (PV) power plants have
shown high growth rates around the world.[1] As a
consequence of this growth PV electricity generation cost
continuously decreases. The contrary trend is shown by
electricity prices for end-users. The intersection of these
two trends is defined as grid-parity and indicates cost
neutral PV installations. The purpose of the presented
study is a detailed analysis of global grid-parity event
dynamics for nearly all countries in the world and
respective residential and industrial market segments in
the years to come. Key motivation of this work was to
learn more about the geographic and temporal
distribution in the occurrence of grid-parity in the world.
This paper presents a detailed analysis of grid-parity
dynamics based on the levelized cost of electricity
(LCOE) concept coupled with the experience curve
approach (section 2) including a broad discussion of the
key driving forces of the model (section 3). Results of the
analysis are shown for Europe, the Americas, Africa and
the Asia-Pacific region (section 4). Finally, consequences
of these results are discussed (section 4 and 5).
This conference contribution presents results of Q-Cells
research. First results for Europe had been a cornerstone
that led to the 12% supply target of European electricity
demand by 2020 of the European Photovoltaic Industry
Association (EPIA) as announced on the 23rd PVSEC in
Valencia in 2008.[2,3] Results for the US had been
published first in the US [4] and together with all
European Union (EU) member states on the 24th PVSEC
in Hamburg in 2009.[5] Results for Japan, India, Middle
East and North Africa (MENA) and Asia had been
presented at respective regional conferences.[6-9] In this
study we present results for 151 countries plus some
regional aggregations of the US, India and China. We
now cover 98.0% of world population and 99.7% of
global gross domestic product (GDP), therefore we have
now finalised our work of the last years focussed on
understanding global grid-parity event dynamics.
2 GRID-PARITY MODEL
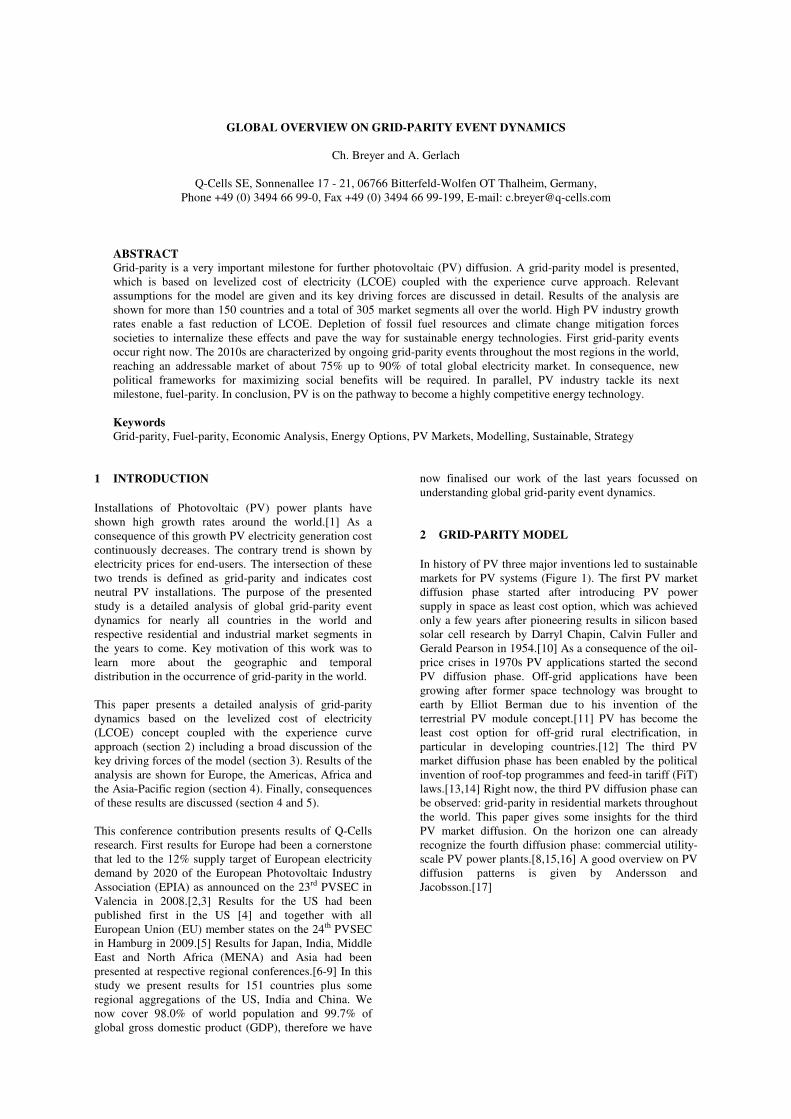
In history of PV three major inventions led to sustainable
markets for PV systems (Figure 1). The first PV market
diffusion phase started after introducing PV power
supply in space as least cost option, which was achieved
only a few years after pioneering results in silicon based
solar cell research by Darryl Chapin, Calvin Fuller and
Gerald Pearson in 1954.[10] As a consequence of the oil-
price crises in 1970s PV applications started the second
PV diffusion phase. Off-grid applications have been
growing after former space technology was brought to
earth by Elliot Berman due to his invention of the
terrestrial PV module concept.[11] PV has become the
least cost option for off-grid rural electrification, in
particular in developing countries.[12] The third PV
market diffusion phase has been enabled by the political
invention of roof-top programmes and feed-in tariff (FiT)
laws.[13,14] Right now, the third PV diffusion phase can
be observed: grid-parity in residential markets throughout
the world. This paper gives some insights for the third
PV market diffusion. On the horizon one can already
recognize the fourth diffusion phase: commercial utility-
scale PV power plants.[8,15,16] A good overview on PV
diffusion patterns is given by Andersson and
Jacobsson.[17]
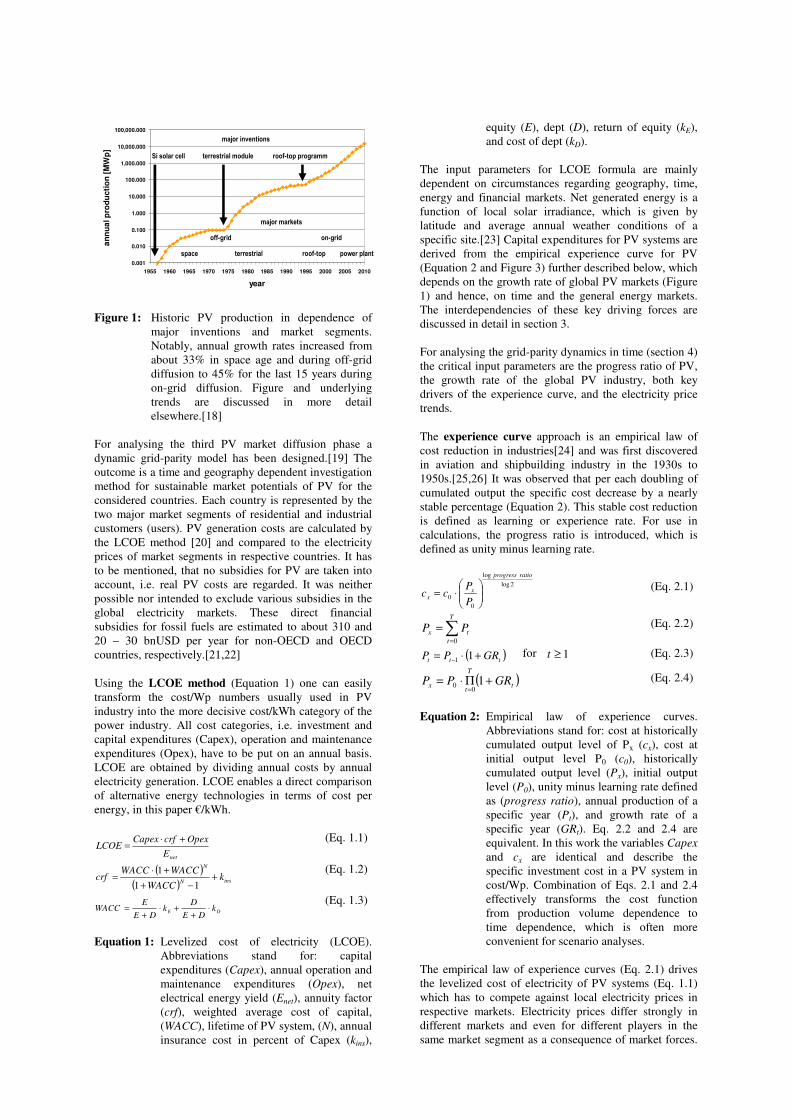
Figure 1: Historic PV production in dependence of
major inventions and market segments.
Notably, annual growth rates increased from
about 33% in space age and during off-grid
diffusion to 45% for the last 15 years during
on-grid diffusion. Figure and underlying
trends are discussed in more detail
elsewhere.[18]
For analysing the third PV market diffusion phase a
dynamic grid-parity model has been designed.[19] The
outcome is a time and geography dependent investigation
method for sustainable market potentials of PV for the
considered countries. Each country is represented by the
two major market segments of residential and industrial
customers (users). PV generation costs are calculated by
the LCOE method [20] and compared to the electricity
prices of market segments in respective countries. It has
to be mentioned, that no subsidies for PV are taken into
account, i.e. real PV costs are regarded. It was neither
possible nor intended to exclude various subsidies in the
global electricity markets. These direct financial
subsidies for fossil fuels are estimated to about 310 and
20 – 30 bnUSD per year for non-OECD and OECD
countries, respectively.[21,22]
Using the LCOE method (Equation 1) one can easily
transform the cost/Wp numbers usually used in PV
industry into the more decisive cost/kWh category of the
power industry. All cost categories, i.e. investment and
capital expenditures (Capex), operation and maintenance
expenditures (Opex), have to be put on an annual basis.
LCOE are obtained by dividing annual costs by annual
electricity generation. LCOE enables a direct comparison
of alternative energy technologies in terms of cost per
energy, in this paper €/kWh.
netE
OpexcrfCapexLCOE
+⋅=
(Eq. 1.1)
( )
( )insN
N
kWACC
WACCWACCcrf +
−+
+⋅=
11
1 (Eq. 1.2)
DE kDE
Dk
DE
EWACC ⋅
++⋅
+=
(Eq. 1.3)
Equation 1: Levelized cost of electricity (LCOE).
Abbreviations stand for: capital
expenditures (Capex), annual operation and
maintenance expenditures (Opex), net
electrical energy yield (Enet), annuity factor
(crf), weighted average cost of capital,
(WACC), lifetime of PV system, (N), annual
insurance cost in percent of Capex (kins),
equity (E), dept (D), return of equity (kE),
and cost of dept (kD).
The input parameters for LCOE formula are mainly
dependent on circumstances regarding geography, time,
energy and financial markets. Net generated energy is a
function of local solar irradiance, which is given by
latitude and average annual weather conditions of a
specific site.[23] Capital expenditures for PV systems are
derived from the empirical experience curve for PV
(Equation 2 and Figure 3) further described below, which
depends on the growth rate of global PV markets (Figure
1) and hence, on time and the general energy markets.
The interdependencies of these key driving forces are
discussed in detail in section 3.
For analysing the grid-parity dynamics in time (section 4)
the critical input parameters are the progress ratio of PV,
the growth rate of the global PV industry, both key
drivers of the experience curve, and the electricity price
trends.
The experience curve approach is an empirical law of
cost reduction in industries[24] and was first discovered
in aviation and shipbuilding industry in the 1930s to
1950s.[25,26] It was observed that per each doubling of
cumulated output the specific cost decrease by a nearly
stable percentage (Equation 2). This stable cost reduction
is defined as learning or experience rate. For use in
calculations, the progress ratio is introduced, which is
defined as unity minus learning rate.
2log
log
0
0
ratioprogress
xx
P
Pcc
⋅=
(Eq. 2.1)
∑=
=T
t
tx PP0
(Eq. 2.2)
( )ttt GRPP +⋅=−
11 for 1≥t (Eq. 2.3)
( )t
T
tx GRPP +Π⋅=
=1
00
(Eq. 2.4)
Equation 2: Empirical law of experience curves.
Abbreviations stand for: cost at historically
cumulated output level of Px (cx), cost at
initial output level P0 (c0), historically
cumulated output level (Px), initial output
level (P0), unity minus learning rate defined
as (progress ratio), annual production of a
specific year (Pt), and growth rate of a
specific year (GRt). Eq. 2.2 and 2.4 are
equivalent. In this work the variables Capex
and cx are identical and describe the
specific investment cost in a PV system in
cost/Wp. Combination of Eqs. 2.1 and 2.4
effectively transforms the cost function
from production volume dependence to
time dependence, which is often more
convenient for scenario analyses.
The empirical law of experience curves (Eq. 2.1) drives
the levelized cost of electricity of PV systems (Eq. 1.1)
which has to compete against local electricity prices in
respective markets. Electricity prices differ strongly in
different markets and even for different players in the
same market segment as a consequence of market forces.
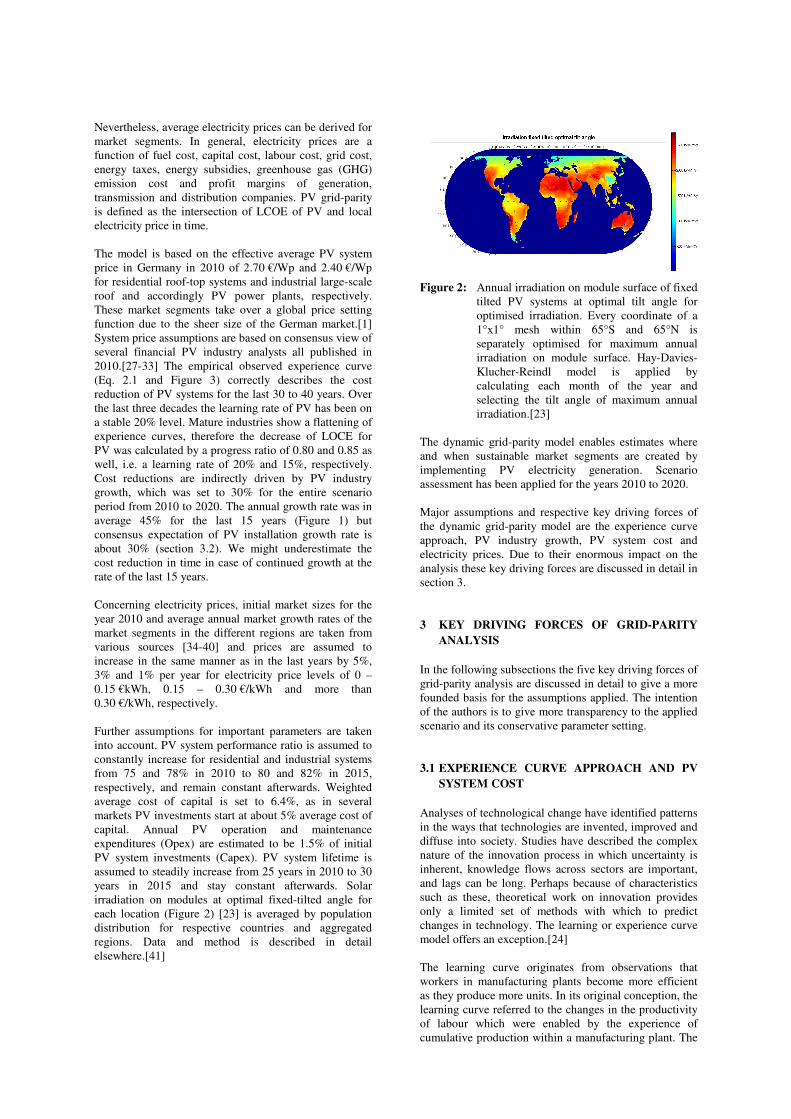
0.001
0.010
0.100
1.000
10.000
100.000
1,000.000
10,000.000
100,000.000
1955 1960 1965 1970 1975 1980 1985 1990 1995 2000 2005 2010
year
an
nu
al p
rod
uc
tio
n [
MW
p]
space terrestrial roof-top power plant
Si solar cell terrestrial module roof-top programm
major markets
major inventions
off-grid on-grid
Nevertheless, average electricity prices can be derived for
market segments. In general, electricity prices are a
function of fuel cost, capital cost, labour cost, grid cost,
energy taxes, energy subsidies, greenhouse gas (GHG)
emission cost and profit margins of generation,
transmission and distribution companies. PV grid-parity
is defined as the intersection of LCOE of PV and local
electricity price in time.
The model is based on the effective average PV system
price in Germany in 2010 of 2.70 €/Wp and 2.40 €/Wp
for residential roof-top systems and industrial large-scale
roof and accordingly PV power plants, respectively.
These market segments take over a global price setting
function due to the sheer size of the German market.[1]
System price assumptions are based on consensus view of
several financial PV industry analysts all published in
2010.[27-33] The empirical observed experience curve
(Eq. 2.1 and Figure 3) correctly describes the cost
reduction of PV systems for the last 30 to 40 years. Over
the last three decades the learning rate of PV has been on
a stable 20% level. Mature industries show a flattening of
experience curves, therefore the decrease of LOCE for
PV was calculated by a progress ratio of 0.80 and 0.85 as
well, i.e. a learning rate of 20% and 15%, respectively.
Cost reductions are indirectly driven by PV industry
growth, which was set to 30% for the entire scenario
period from 2010 to 2020. The annual growth rate was in
average 45% for the last 15 years (Figure 1) but
consensus expectation of PV installation growth rate is
about 30% (section 3.2). We might underestimate the
cost reduction in time in case of continued growth at the
rate of the last 15 years.
Concerning electricity prices, initial market sizes for the
year 2010 and average annual market growth rates of the
market segments in the different regions are taken from
various sources [34-40] and prices are assumed to
increase in the same manner as in the last years by 5%,
3% and 1% per year for electricity price levels of 0 –
0.15 €kWh, 0.15 – 0.30 €/kWh and more than
0.30 €/kWh, respectively.
Further assumptions for important parameters are taken
into account. PV system performance ratio is assumed to
constantly increase for residential and industrial systems
from 75 and 78% in 2010 to 80 and 82% in 2015,
respectively, and remain constant afterwards. Weighted
average cost of capital is set to 6.4%, as in several
markets PV investments start at about 5% average cost of
capital. Annual PV operation and maintenance
expenditures (Opex) are estimated to be 1.5% of initial
PV system investments (Capex). PV system lifetime is
assumed to steadily increase from 25 years in 2010 to 30
years in 2015 and stay constant afterwards. Solar
irradiation on modules at optimal fixed-tilted angle for
each location (Figure 2) [23] is averaged by population
distribution for respective countries and aggregated
regions. Data and method is described in detail
elsewhere.[41]
Figure 2: Annual irradiation on module surface of fixed
tilted PV systems at optimal tilt angle for
optimised irradiation. Every coordinate of a
1°x1° mesh within 65°S and 65°N is
separately optimised for maximum annual
irradiation on module surface. Hay-Davies-
Klucher-Reindl model is applied by
calculating each month of the year and
selecting the tilt angle of maximum annual
irradiation.[23]
The dynamic grid-parity model enables estimates where
and when sustainable market segments are created by
implementing PV electricity generation. Scenario
assessment has been applied for the years 2010 to 2020.
Major assumptions and respective key driving forces of
the dynamic grid-parity model are the experience curve
approach, PV industry growth, PV system cost and
electricity prices. Due to their enormous impact on the
analysis these key driving forces are discussed in detail in
section 3.
3 KEY DRIVING FORCES OF GRID-PARITY
ANALYSIS
In the following subsections the five key driving forces of
grid-parity analysis are discussed in detail to give a more
founded basis for the assumptions applied. The intention
of the authors is to give more transparency to the applied
scenario and its conservative parameter setting.
3.1 EXPERIENCE CURVE APPROACH AND PV
SYSTEM COST
Analyses of technological change have identified patterns
in the ways that technologies are invented, improved and
diffuse into society. Studies have described the complex
nature of the innovation process in which uncertainty is
inherent, knowledge flows across sectors are important,
and lags can be long. Perhaps because of characteristics
such as these, theoretical work on innovation provides
only a limited set of methods with which to predict
changes in technology. The learning or experience curve
model offers an exception.[24]
The learning curve originates from observations that
workers in manufacturing plants become more efficient
as they produce more units. In its original conception, the
learning curve referred to the changes in the productivity
of labour which were enabled by the experience of
cumulative production within a manufacturing plant. The
experience curve approach was further developed to
provide a more general formulation of the concept,
including not just labour but all manufacturing costs and
aggregating entire industries rather than single plants.
[24] A good overview on experience curves in general
and PV in particular is given by Nemet [24] and Swanson
[42]. Consensus results of different studies on learning
rates in PV industry led to a well accepted learning rate
of 20% (Figure 3), hence a progress ratio of 0.80.[43-]
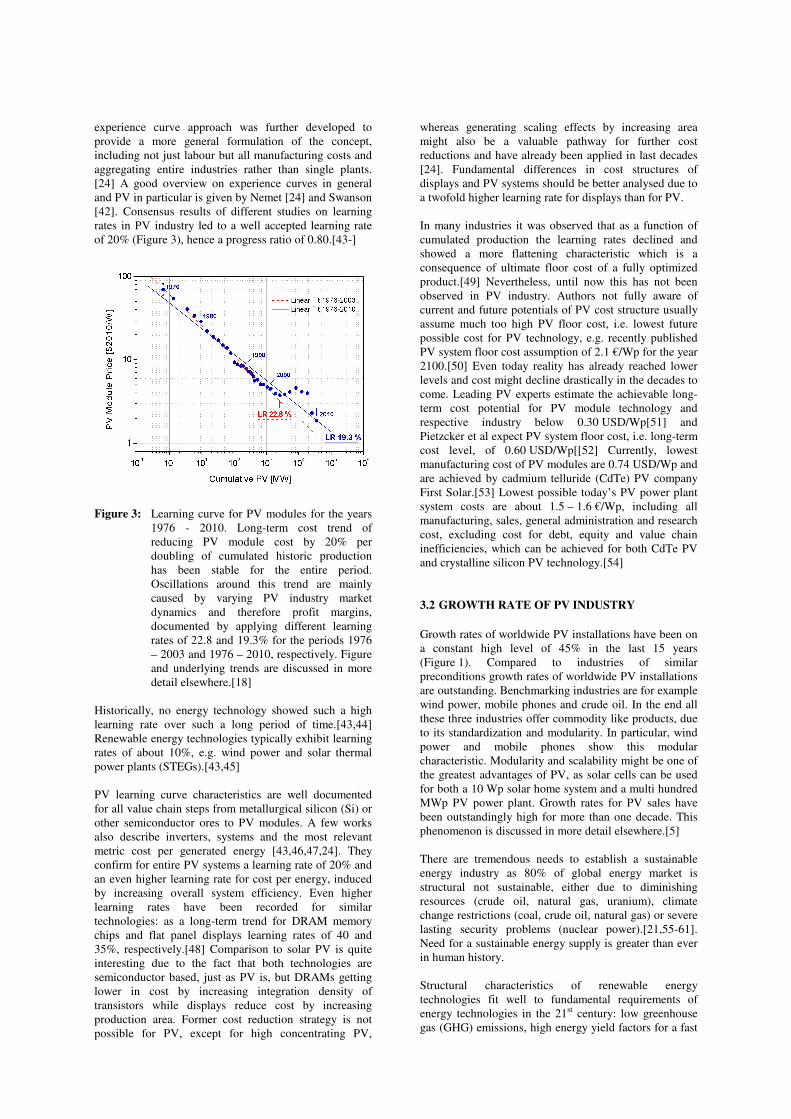
Figure 3: Learning curve for PV modules for the years
1976 - 2010. Long-term cost trend of
reducing PV module cost by 20% per
doubling of cumulated historic production
has been stable for the entire period.
Oscillations around this trend are mainly
caused by varying PV industry market
dynamics and therefore profit margins,
documented by applying different learning
rates of 22.8 and 19.3% for the periods 1976
– 2003 and 1976 – 2010, respectively. Figure
and underlying trends are discussed in more
detail elsewhere.[18]
Historically, no energy technology showed such a high
learning rate over such a long period of time.[43,44]
Renewable energy technologies typically exhibit learning
rates of about 10%, e.g. wind power and solar thermal
power plants (STEGs).[43,45]
PV learning curve characteristics are well documented
for all value chain steps from metallurgical silicon (Si) or
other semiconductor ores to PV modules. A few works
also describe inverters, systems and the most relevant
metric cost per generated energy [43,46,47,24]. They
confirm for entire PV systems a learning rate of 20% and
an even higher learning rate for cost per energy, induced
by increasing overall system efficiency. Even higher
learning rates have been recorded for similar
technologies: as a long-term trend for DRAM memory
chips and flat panel displays learning rates of 40 and
35%, respectively.[48] Comparison to solar PV is quite
interesting due to the fact that both technologies are
semiconductor based, just as PV is, but DRAMs getting
lower in cost by increasing integration density of
transistors while displays reduce cost by increasing
production area. Former cost reduction strategy is not
possible for PV, except for high concentrating PV,
whereas generating scaling effects by increasing area
might also be a valuable pathway for further cost
reductions and have already been applied in last decades
[24]. Fundamental differences in cost structures of
displays and PV systems should be better analysed due to
a twofold higher learning rate for displays than for PV.
In many industries it was observed that as a function of
cumulated production the learning rates declined and
showed a more flattening characteristic which is a
consequence of ultimate floor cost of a fully optimized
product.[49] Nevertheless, until now this has not been
observed in PV industry. Authors not fully aware of
current and future potentials of PV cost structure usually
assume much too high PV floor cost, i.e. lowest future
possible cost for PV technology, e.g. recently published
PV system floor cost assumption of 2.1 €/Wp for the year
2100.[50] Even today reality has already reached lower
levels and cost might decline drastically in the decades to
come. Leading PV experts estimate the achievable long-
term cost potential for PV module technology and
respective industry below 0.30 USD/Wp[51] and
Pietzcker et al expect PV system floor cost, i.e. long-term
cost level, of 0.60 USD/Wp[[52] Currently, lowest
manufacturing cost of PV modules are 0.74 USD/Wp and
are achieved by cadmium telluride (CdTe) PV company
First Solar.[53] Lowest possible today’s PV power plant
system costs are about 1.5 – 1.6 €/Wp, including all
manufacturing, sales, general administration and research
cost, excluding cost for debt, equity and value chain
inefficiencies, which can be achieved for both CdTe PV
and crystalline silicon PV technology.[54]
3.2 GROWTH RATE OF PV INDUSTRY
Growth rates of worldwide PV installations have been on
a constant high level of 45% in the last 15 years
(Figure 1). Compared to industries of similar
preconditions growth rates of worldwide PV installations
are outstanding. Benchmarking industries are for example
wind power, mobile phones and crude oil. In the end all
these three industries offer commodity like products, due
to its standardization and modularity. In particular, wind
power and mobile phones show this modular
characteristic. Modularity and scalability might be one of
the greatest advantages of PV, as solar cells can be used
for both a 10 Wp solar home system and a multi hundred
MWp PV power plant. Growth rates for PV sales have
been outstandingly high for more than one decade. This
phenomenon is discussed in more detail elsewhere.[5]
There are tremendous needs to establish a sustainable
energy industry as 80% of global energy market is
structural not sustainable, either due to diminishing
resources (crude oil, natural gas, uranium), climate
change restrictions (coal, crude oil, natural gas) or severe
lasting security problems (nuclear power).[21,55-61].
Need for a sustainable energy supply is greater than ever
in human history.
Structural characteristics of renewable energy
technologies fit well to fundamental requirements of
energy technologies in the 21st century: low greenhouse
gas (GHG) emissions, high energy yield factors for a fast
substitution of today’s not sustainable technologies, i.e.
short energy payback times (EPBT), and pathways to
reach a sustainable low cost level. PV well fulfils these
requirements: GHG emissions are between 15 – 45
gCO2eq/kWh [62-65], energy yield factors are between 10
– 30 due to a EPBT of 0.8 to 2.5 years [62-65] and fast
declining LCOE (section 3.1 and 4).
Remarkably, fundamental growth limits are still
outstandingly far away for PV embedded in respective
local and global electricity systems. For PV it will take a
long time to reach these limits which are estimated to be
at least between 1,500 and 12,000 GWp total installed
capacity within the next four decades and depending on
economically available storage solutions and global
wealth convergence.[18] There are several studies
outlining technologically and economically feasible
pathways for a PV share in local, nationwide, continental
and even global electricity systems of 25 up to 100%.[66-
72] One of the authors of this paper was involved in an
estimate of overall energy supply potential of solar power
[72], which was calculated for solar thermal electricity
power generation (STEG), but due to nearly identical
overall land use efficiencies it can be transferred to PV
and by applying the storage assumptions of Denholm and
Margolis [68] and Zweibel et al. [66] it would be
possible to entirely transfer the outcome to PV.
Growth rates of PV seem not to be limited for at least the
next one to two decades. The assumption in this paper of
an average annual 30% growth rate of PV industry in the
scenario period of 2010 to 2020 is considered to be very
conservative. Annual growth trend for the last 15 years
has been 45% (Figure 1). Nevertheless, consensus of
scientific researchers and financial analysts is a growth
rate of about 30%.[1,73,28,29,31,74-76] However, it has
been very common to underestimate both near and long-
term growth rates of PV.[77]
3.3 PV SYSTEM PERFORMANCE
The key performance index of PV is LCOE and therefore
improvements in lifetime, performance ratio and yield
(kWh/kWp), e.g. better temperature coefficients and
better low light performance, will increase the yield and
therefore decrease the LCOE. There are indications that
PV module lifetime is longer than the assumed 25 years
[78] which will further improve LCOE. Better
performance and longer lifetimes of key components will
improve the performance ratio and lower operation and
maintenance, hence improve LCOE.
3.4 ELECTRICITY PRICES
Real electricity price escalation for residential market
segments has been on average 4.3% p.a. in the years
2000 to 2007 in the EU [34] and on average 3.6% p.a. in
the years 2000 to 2006 in the US [35]. Cost trends in
other regions in the world are dependent on local
electricity subsidies or taxes, vulnerability to oil and
natural gas price volatility, increase in environmental
standards and stranded power plant investments.
In liberalized electricity markets, like in the EU and the
US, electricity prices are coupled to respective electricity
wholesale prices. These wholesale prices are typically a
function of available supply and demand and are
dependent on the last class of power plants which is
needed to cover supply (merit-order). Therefore, the cost
structure of natural gas (NG) power plants strongly
influences wholesale prices. The cost structure of NG
power plants itself is dominated by NG fuel cost. It has
been observed for the last three decades that NG prices
are strongly correlated to crude oil prices [21], thus in the
end the global crude oil price determines end-users
electricity prices in liberalized electricity markets.
Probability is high that historical peak-oil occurs in the
years till 2015 which will be accompanied by high crude
oil prices [55-57] and consequently high electricity
prices. Regulated markets in the world also face
increasing electricity cost due to rising fuel prices.
Global electricity supply is dominated by coal, NG,
hydro-electric, nuclear and oil power plants, which
generate 40.9, 20.1, 16.4, 14.7 and 5.7% of electricity.
[86] All other sources, in particular renewable energy
sources, still contribute to a minor fraction.
Social cost of climate change mitigation will have to be
internalized in energy cost for having real price signals of
energy use.[59] Conservative estimates clearly show that
social cost of climate change are in the order of
70 €/tCO2.[59] Electricity prices outside the EU reflect
no CO2 cost and respective prices in the EU started to
internalize GHG emissions in the mid 2000s, but on a
subcritical low level of 10 – 25 €/tCO2. Maybe marginal
cost of GHG emissions to tackle climate change will be
even higher than 70 €/tCO2. Regions dependent on fossil
fuel fired power plants, in particular coal, will be affected
by high escalation rates of true electricity cost.
Other social cost of electricity supply are also not
internalised in electricity prices, but have to be paid.
Such cost are for instance: higher mortality and multiple
illnesses due to heavy metal emissions of coal and oil
power plants, military conflicts due to diminishing
energy resources, reduced ecological value of destroyed
ecosystems by use and exploitation of conventional
energy and insecurity due to nuclear proliferation,
nuclear terrorism and unclear nuclear waste disposal.
Summing up, the assumption of future electricity price
escalation rates is very likely to be conservative.
3.5 ACCESS TO ELECTRICITY
Prerequisite for grid-parity analysis is access to an
electricity grid. This is not the case for about 1.5 billion
people in the world.[79] Most of them live in rural areas
in Sub-Sahara Africa (about 590 million), South Asia
(about 610 million) and East Asia (about 195 million).
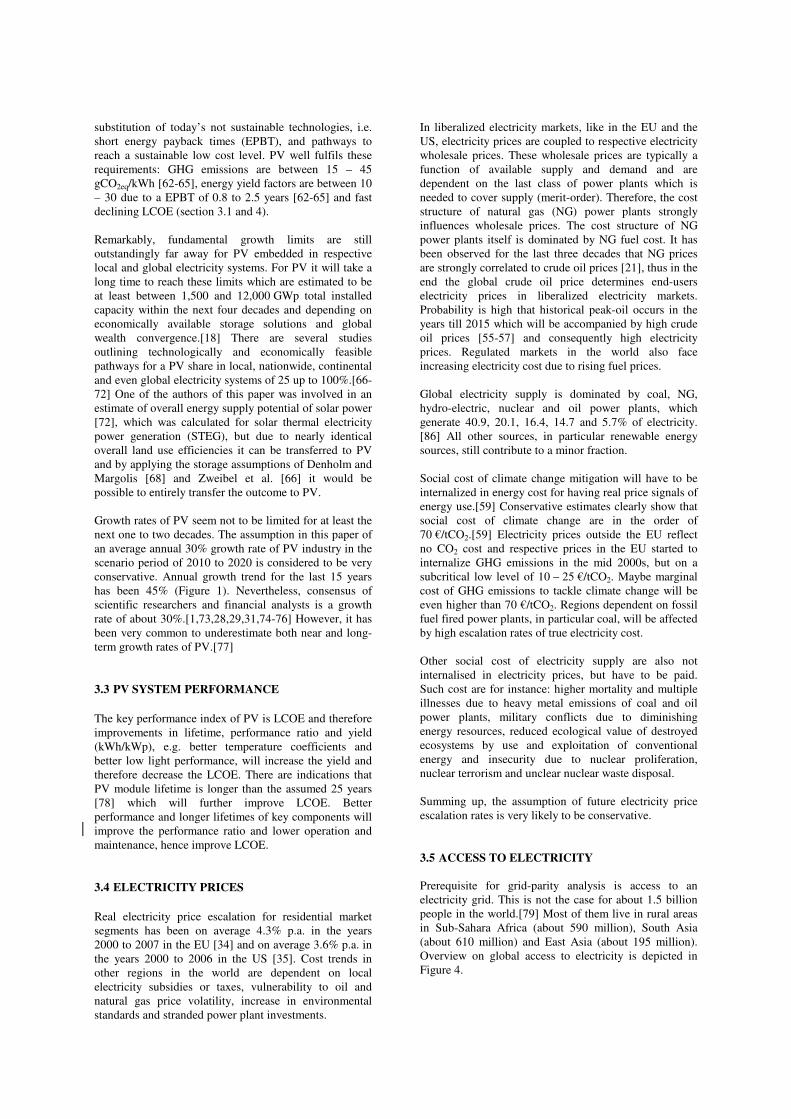
Overview on global access to electricity is depicted in
Figure 4.
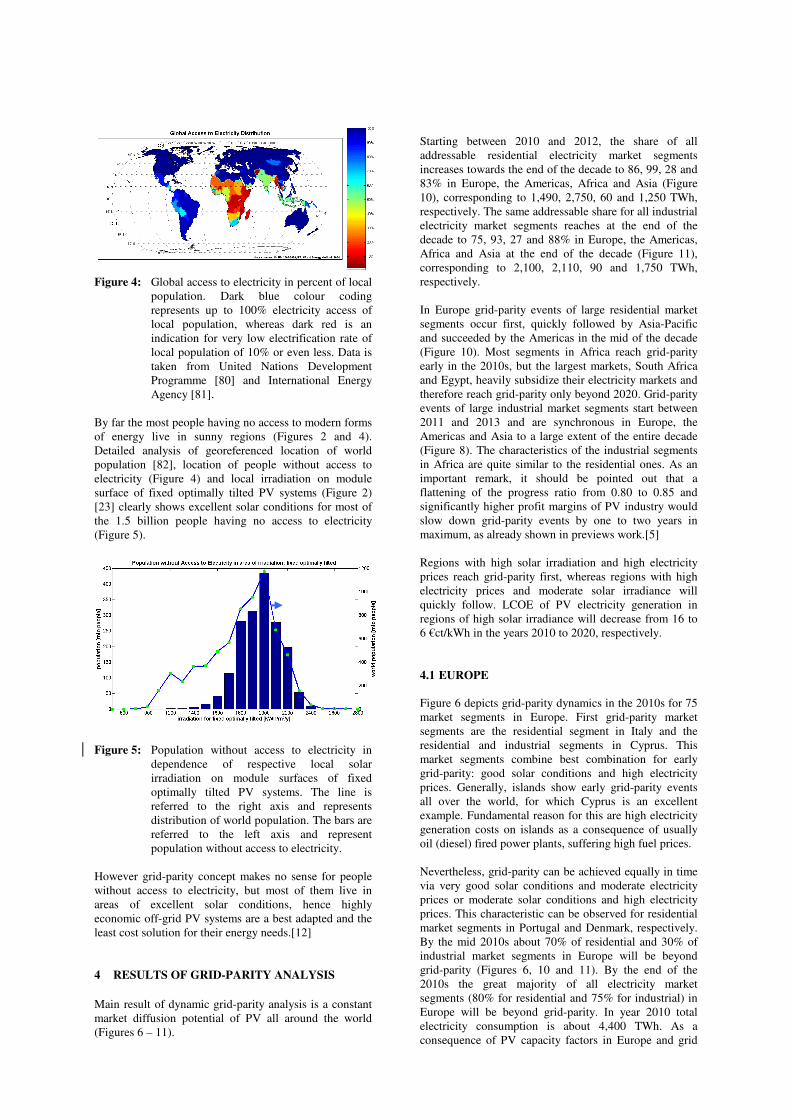
Figure 4: Global access to electricity in percent of local
population. Dark blue colour coding
represents up to 100% electricity access of
local population, whereas dark red is an
indication for very low electrification rate of
local population of 10% or even less. Data is
taken from United Nations Development
Programme [80] and International Energy
Agency [81].
By far the most people having no access to modern forms
of energy live in sunny regions (Figures 2 and 4).
Detailed analysis of georeferenced location of world
population [82], location of people without access to
electricity (Figure 4) and local irradiation on module
surface of fixed optimally tilted PV systems (Figure 2)
[23] clearly shows excellent solar conditions for most of
the 1.5 billion people having no access to electricity
(Figure 5).
Figure 5: Population without access to electricity in
dependence of respective local solar
irradiation on module surfaces of fixed
optimally tilted PV systems. The line is
referred to the right axis and represents
distribution of world population. The bars are
referred to the left axis and represent
population without access to electricity.
However grid-parity concept makes no sense for people
without access to electricity, but most of them live in
areas of excellent solar conditions, hence highly
economic off-grid PV systems are a best adapted and the
least cost solution for their energy needs.[12]
4 RESULTS OF GRID-PARITY ANALYSIS
Main result of dynamic grid-parity analysis is a constant
market diffusion potential of PV all around the world
(Figures 6 – 11).
Starting between 2010 and 2012, the share of all
addressable residential electricity market segments
increases towards the end of the decade to 86, 99, 28 and
83% in Europe, the Americas, Africa and Asia (Figure
10), corresponding to 1,490, 2,750, 60 and 1,250 TWh,
respectively. The same addressable share for all industrial
electricity market segments reaches at the end of the
decade to 75, 93, 27 and 88% in Europe, the Americas,
Africa and Asia at the end of the decade (Figure 11),
corresponding to 2,100, 2,110, 90 and 1,750 TWh,
respectively.
In Europe grid-parity events of large residential market
segments occur first, quickly followed by Asia-Pacific
and succeeded by the Americas in the mid of the decade
(Figure 10). Most segments in Africa reach grid-parity
early in the 2010s, but the largest markets, South Africa
and Egypt, heavily subsidize their electricity markets and
therefore reach grid-parity only beyond 2020. Grid-parity
events of large industrial market segments start between
2011 and 2013 and are synchronous in Europe, the
Americas and Asia to a large extent of the entire decade
(Figure 8). The characteristics of the industrial segments
in Africa are quite similar to the residential ones. As an
important remark, it should be pointed out that a
flattening of the progress ratio from 0.80 to 0.85 and
significantly higher profit margins of PV industry would
slow down grid-parity events by one to two years in
maximum, as already shown in previews work.[5]
Regions with high solar irradiation and high electricity
prices reach grid-parity first, whereas regions with high
electricity prices and moderate solar irradiance will
quickly follow. LCOE of PV electricity generation in
regions of high solar irradiance will decrease from 16 to
6 €ct/kWh in the years 2010 to 2020, respectively.
4.1 EUROPE
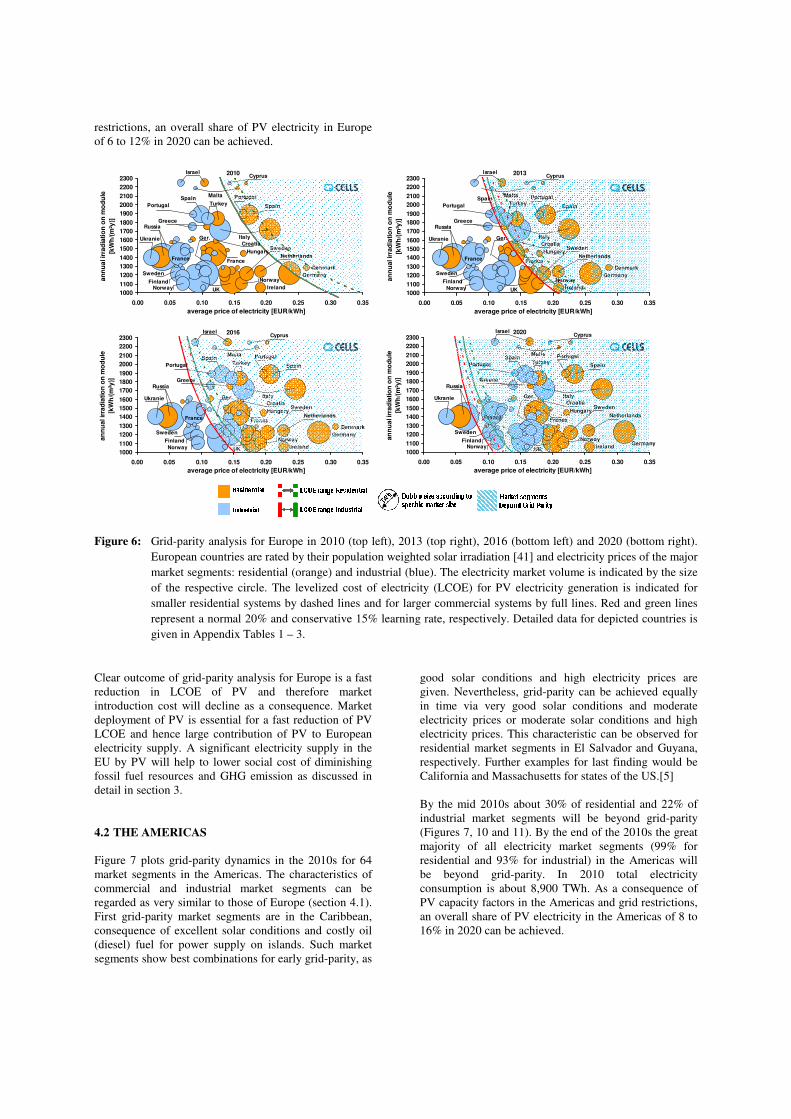
Figure 6 depicts grid-parity dynamics in the 2010s for 75
market segments in Europe. First grid-parity market
segments are the residential segment in Italy and the
residential and industrial segments in Cyprus. This
market segments combine best combination for early
grid-parity: good solar conditions and high electricity
prices. Generally, islands show early grid-parity events
all over the world, for which Cyprus is an excellent
example. Fundamental reason for this are high electricity
generation costs on islands as a consequence of usually
oil (diesel) fired power plants, suffering high fuel prices.
Nevertheless, grid-parity can be achieved equally in time
via very good solar conditions and moderate electricity
prices or moderate solar conditions and high electricity
prices. This characteristic can be observed for residential
market segments in Portugal and Denmark, respectively.
By the mid 2010s about 70% of residential and 30% of
industrial market segments in Europe will be beyond
grid-parity (Figures 6, 10 and 11). By the end of the
2010s the great majority of all electricity market
segments (80% for residential and 75% for industrial) in
Europe will be beyond grid-parity. In year 2010 total
electricity consumption is about 4,400 TWh. As a
consequence of PV capacity factors in Europe and grid
restrictions, an overall share of PV electricity in Europe
of 6 to 12% in 2020 can be achieved.
Figure 6: Grid-parity analysis for Europe in 2010 (top left), 2013 (top right), 2016 (bottom left) and 2020 (bottom right).
European countries are rated by their population weighted solar irradiation [41] and electricity prices of the major
market segments: residential (orange) and industrial (blue). The electricity market volume is indicated by the size
of the respective circle. The levelized cost of electricity (LCOE) for PV electricity generation is indicated for
smaller residential systems by dashed lines and for larger commercial systems by full lines. Red and green lines
represent a normal 20% and conservative 15% learning rate, respectively. Detailed data for depicted countries is
given in Appendix Tables 1 – 3.
Clear outcome of grid-parity analysis for Europe is a fast
reduction in LCOE of PV and therefore market
introduction cost will decline as a consequence. Market
deployment of PV is essential for a fast reduction of PV
LCOE and hence large contribution of PV to European
electricity supply. A significant electricity supply in the
EU by PV will help to lower social cost of diminishing
fossil fuel resources and GHG emission as discussed in
detail in section 3.
4.2 THE AMERICAS
Figure 7 plots grid-parity dynamics in the 2010s for 64
market segments in the Americas. The characteristics of
commercial and industrial market segments can be
regarded as very similar to those of Europe (section 4.1).
First grid-parity market segments are in the Caribbean,
consequence of excellent solar conditions and costly oil
(diesel) fuel for power supply on islands. Such market
segments show best combinations for early grid-parity, as
good solar conditions and high electricity prices are
given. Nevertheless, grid-parity can be achieved equally
in time via very good solar conditions and moderate
electricity prices or moderate solar conditions and high
electricity prices. This characteristic can be observed for
residential market segments in El Salvador and Guyana,
respectively. Further examples for last finding would be
California and Massachusetts for states of the US.[5]
By the mid 2010s about 30% of residential and 22% of
industrial market segments will be beyond grid-parity
(Figures 7, 10 and 11). By the end of the 2010s the great
majority of all electricity market segments (99% for
residential and 93% for industrial) in the Americas will
be beyond grid-parity. In 2010 total electricity
consumption is about 8,900 TWh. As a consequence of
PV capacity factors in the Americas and grid restrictions,
an overall share of PV electricity in the Americas of 8 to
16% in 2020 can be achieved.
2010
Denmark
Cyprus
UK
Finland
France
Germany
Hungary
Ireland
Israel
Croatia
Netherlands
Norway
Italy
Russia
Spain
Sweden
Portugal
Turkey
Ukranie Ger.
Sweden
France
Spain
Greece
Malta
Norway
Portugal
1000
1100
1200
1300
1400
1500
1600
1700
1800
1900
2000
2100
2200
2300
0.00 0.05 0.10 0.15 0.20 0.25 0.30 0.35
average price of electricity [EUR/kWh]
an
nu
al ir
rad
iati
on
on
mo
du
le
[kW
h/(m
²y)]
2013
Denmark
Cyprus
UK
Finland
France
Germany
Hungary
Ireland
Israel
Croatia
Netherlands
Norway
Italy
Russia
Spain
Sweden
PortugalTurkey
Ukranie Ger.
Sweden
France
Spain
Greece
Malta
Norway
Portugal
1000
1100
1200
1300
1400
1500
1600
1700
1800
1900
2000
2100
2200
2300
0.00 0.05 0.10 0.15 0.20 0.25 0.30 0.35
average price of electricity [EUR/kWh]
an
nu
al ir
rad
iati
on
on
mo
du
le
[kW
h/(
m²y
)]
2016
Denmark
Cyprus
UK
Finland
France
Germany
Hungary
Ireland
Israel
Croatia
Netherlands
Norway
Italy
Russia
Spain
Sweden
PortugalTurkey
Ukranie Ger.
Sweden
France
Spain
Greece
Malta
Norway
Portugal
1000
1100
1200
1300
1400
1500
1600
1700
1800
1900
2000
2100
2200
2300
0.00 0.05 0.10 0.15 0.20 0.25 0.30 0.35
average price of electricity [EUR/kWh]
an
nu
al ir
rad
iati
on
on
mo
du
le
[kW
h/(
m²y
)]
2020 Cyprus
UK
Finland
France
Germany
Hungary
Ireland
Israel
Croatia
Netherlands
Norway
Italy
Russia
Spain
Sweden
PortugalTurkey
Ukranie Ger.
Sweden
France
Spain
Greece
Malta
Norway
Portugal
1000
1100
1200
1300
1400
1500
1600
1700
1800
1900
2000
2100
2200
2300
0.00 0.05 0.10 0.15 0.20 0.25 0.30 0.35
average price of electricity [EUR/kWh]
an
nu
al ir
rad
iati
on
on
mo
du
le
[kW
h/(
m²y
)]
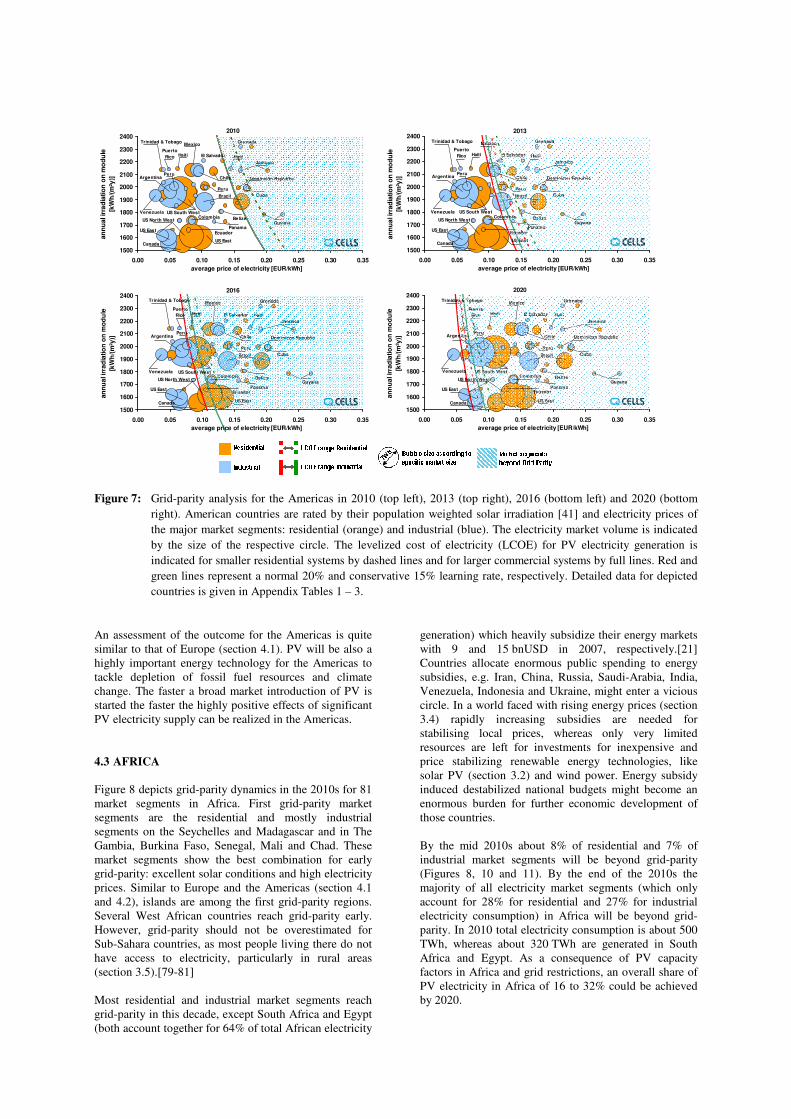
Figure 7: Grid-parity analysis for the Americas in 2010 (top left), 2013 (top right), 2016 (bottom left) and 2020 (bottom
right). American countries are rated by their population weighted solar irradiation [41] and electricity prices of
the major market segments: residential (orange) and industrial (blue). The electricity market volume is indicated
by the size of the respective circle. The levelized cost of electricity (LCOE) for PV electricity generation is
indicated for smaller residential systems by dashed lines and for larger commercial systems by full lines. Red and
green lines represent a normal 20% and conservative 15% learning rate, respectively. Detailed data for depicted
countries is given in Appendix Tables 1 – 3.
An assessment of the outcome for the Americas is quite
similar to that of Europe (section 4.1). PV will be also a
highly important energy technology for the Americas to
tackle depletion of fossil fuel resources and climate
change. The faster a broad market introduction of PV is
started the faster the highly positive effects of significant
PV electricity supply can be realized in the Americas.
4.3 AFRICA
Figure 8 depicts grid-parity dynamics in the 2010s for 81
market segments in Africa. First grid-parity market
segments are the residential and mostly industrial
segments on the Seychelles and Madagascar and in The
Gambia, Burkina Faso, Senegal, Mali and Chad. These
market segments show the best combination for early
grid-parity: excellent solar conditions and high electricity
prices. Similar to Europe and the Americas (section 4.1
and 4.2), islands are among the first grid-parity regions.
Several West African countries reach grid-parity early.
However, grid-parity should not be overestimated for
Sub-Sahara countries, as most people living there do not
have access to electricity, particularly in rural areas
(section 3.5).[79-81]
Most residential and industrial market segments reach
grid-parity in this decade, except South Africa and Egypt
(both account together for 64% of total African electricity
generation) which heavily subsidize their energy markets
with 9 and 15 bnUSD in 2007, respectively.[21]
Countries allocate enormous public spending to energy
subsidies, e.g. Iran, China, Russia, Saudi-Arabia, India,
Venezuela, Indonesia and Ukraine, might enter a vicious
circle. In a world faced with rising energy prices (section
3.4) rapidly increasing subsidies are needed for
stabilising local prices, whereas only very limited
resources are left for investments for inexpensive and
price stabilizing renewable energy technologies, like
solar PV (section 3.2) and wind power. Energy subsidy
induced destabilized national budgets might become an
enormous burden for further economic development of
those countries.
By the mid 2010s about 8% of residential and 7% of
industrial market segments will be beyond grid-parity
(Figures 8, 10 and 11). By the end of the 2010s the
majority of all electricity market segments (which only
account for 28% for residential and 27% for industrial
electricity consumption) in Africa will be beyond grid-
parity. In 2010 total electricity consumption is about 500
TWh, whereas about 320 TWh are generated in South
Africa and Egypt. As a consequence of PV capacity
factors in Africa and grid restrictions, an overall share of
PV electricity in Africa of 16 to 32% could be achieved
by 2020.
2020
Belize
Brazil
Canada
Colombia
Cuba
El Salvador
Grenada
Haiti
Jamaica
Panama
Peru
US South West
Trinidad & Tobago
US East
US North West
Ecuador
Venezuela
Argentina Dominican Republic
Guyana
Haiti
Mexico
ChilePeru
Puerto
Rico
US East
1500
1600
1700
1800
1900
2000
2100
2200
2300
2400
0.00 0.05 0.10 0.15 0.20 0.25 0.30 0.35
average price of electricity [EUR/kWh]
an
nu
al ir
rad
iati
on
on
mo
du
le
[kW
h/(
m²y
)]
2010
Belize
Brazil
Canada
Colombia
Cuba
El Salvador
Grenada
Haiti
Jamaica
Panama
Peru
US South West
Trinidad & Tobago
US East
US North West
Ecuador
Venezuela
Argentina Dominican Republic
Guyana
Haiti
Mexico
ChilePeru
Puerto
Rico
US East
1500
1600
1700
1800
1900
2000
2100
2200
2300
2400
0.00 0.05 0.10 0.15 0.20 0.25 0.30 0.35
average price of electricity [EUR/kWh]
an
nu
al ir
rad
iati
on
on
mo
du
le
[kW
h/(m
²y)]
2013
Belize
Brazil
Canada
Colombia
Cuba
El Salvador
Grenada
Haiti
Jamaica
Panama
Peru
US South West
Trinidad & Tobago
US East
US North West
Ecuador
Venezuela
Argentina Dominican Republic
Guyana
Haiti
Mexico
ChilePeru
Puerto
Rico
US East
1500
1600
1700
1800
1900
2000
2100
2200
2300
2400
0.00 0.05 0.10 0.15 0.20 0.25 0.30 0.35
average price of electricity [EUR/kWh]
an
nu
al ir
rad
iati
on
on
mo
du
le
[kW
h/(m
²y)]
2016
Belize
Brazil
Canada
Colombia
Cuba
El Salvador
Grenada
Haiti
Jamaica
Panama
Peru
US South West
Trinidad & Tobago
US East
US North West
Ecuador
Venezuela
Argentina Dominican Republic
Guyana
Haiti
Mexico
ChilePeru
Puerto
Rico
US East
1500
1600
1700
1800
1900
2000
2100
2200
2300
2400
0.00 0.05 0.10 0.15 0.20 0.25 0.30 0.35
average price of electricity [EUR/kWh]
an
nu
al ir
rad
iatio
n o
n m
od
ule
[kW
h/(m
²y)]
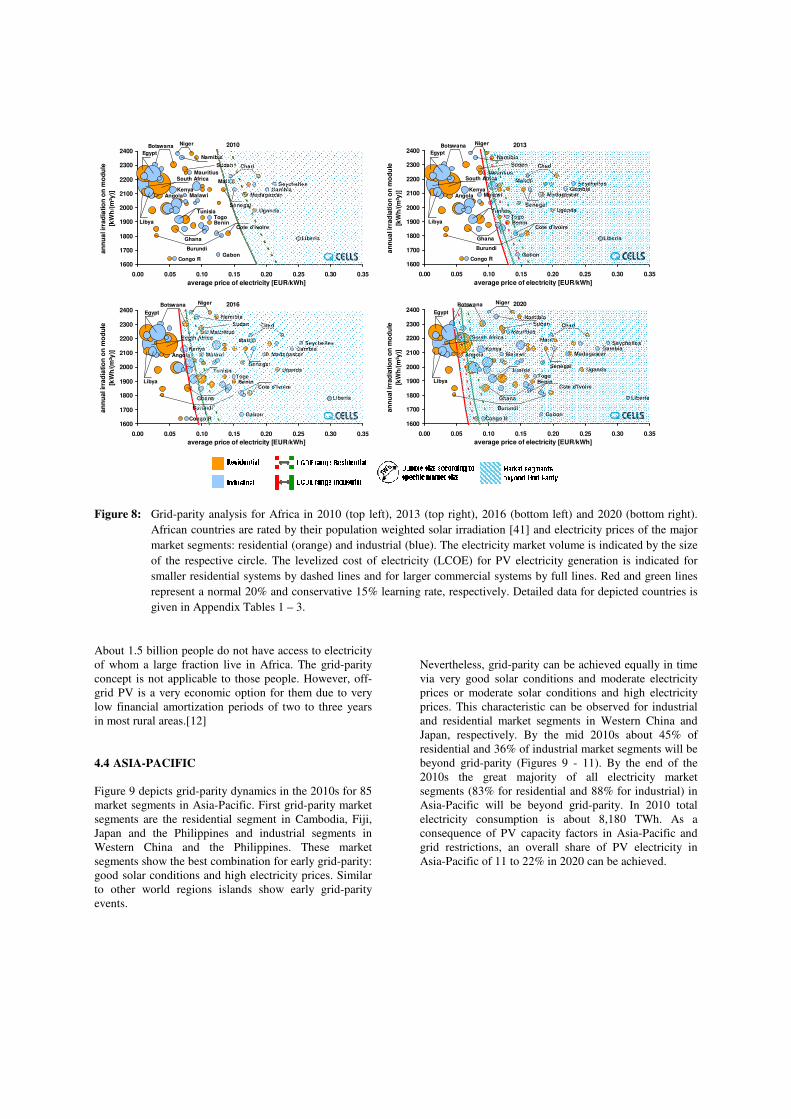
Figure 8: Grid-parity analysis for Africa in 2010 (top left), 2013 (top right), 2016 (bottom left) and 2020 (bottom right).
African countries are rated by their population weighted solar irradiation [41] and electricity prices of the major
market segments: residential (orange) and industrial (blue). The electricity market volume is indicated by the size
of the respective circle. The levelized cost of electricity (LCOE) for PV electricity generation is indicated for
smaller residential systems by dashed lines and for larger commercial systems by full lines. Red and green lines
represent a normal 20% and conservative 15% learning rate, respectively. Detailed data for depicted countries is
given in Appendix Tables 1 – 3.
About 1.5 billion people do not have access to electricity
of whom a large fraction live in Africa. The grid-parity
concept is not applicable to those people. However, off-
grid PV is a very economic option for them due to very
low financial amortization periods of two to three years
in most rural areas.[12]
4.4 ASIA-PACIFIC
Figure 9 depicts grid-parity dynamics in the 2010s for 85
market segments in Asia-Pacific. First grid-parity market
segments are the residential segment in Cambodia, Fiji,
Japan and the Philippines and industrial segments in
Western China and the Philippines. These market
segments show the best combination for early grid-parity:
good solar conditions and high electricity prices. Similar
to other world regions islands show early grid-parity
events.
Nevertheless, grid-parity can be achieved equally in time
via very good solar conditions and moderate electricity
prices or moderate solar conditions and high electricity
prices. This characteristic can be observed for industrial
and residential market segments in Western China and
Japan, respectively. By the mid 2010s about 45% of
residential and 36% of industrial market segments will be
beyond grid-parity (Figures 9 - 11). By the end of the
2010s the great majority of all electricity market
segments (83% for residential and 88% for industrial) in
Asia-Pacific will be beyond grid-parity. In 2010 total
electricity consumption is about 8,180 TWh. As a
consequence of PV capacity factors in Asia-Pacific and
grid restrictions, an overall share of PV electricity in
Asia-Pacific of 11 to 22% in 2020 can be achieved.
2010
Angola
Benin
Madagascar
Uganda
Gabon
GambiaMalawi
Botswana
Burundi
Congo R
South Africa
Cote d'Ivoire
Egypt
Ghana
Mali
Mauritius
Namibia
Niger
Sudan
TogoTunisia
Chad
Kenya
Liberia
Libya
Senegal
Seychelles
1600
1700
1800
1900
2000
2100
2200
2300
2400
0.00 0.05 0.10 0.15 0.20 0.25 0.30 0.35
average price of electricity [EUR/kWh]
an
nu
al ir
rad
iatio
n o
n m
od
ule
[kW
h/(
m²y
)]
2013
Angola
Benin
Madagascar
Uganda
Gabon
GambiaMalawi
Botswana
Burundi
Congo R
South Africa
Cote d'Ivoire
Egypt
Ghana
Mali
Mauritius
Namibia
Niger
Sudan
TogoTunisia
Chad
Kenya
Liberia
Libya
Senegal
Seychelles
1600
1700
1800
1900
2000
2100
2200
2300
2400
0.00 0.05 0.10 0.15 0.20 0.25 0.30 0.35
average price of electricity [EUR/kWh]
an
nu
al ir
rad
iati
on
on
mo
du
le
[kW
h/(m
²y)]
2016
Angola
Benin
Madagascar
Uganda
Gabon
GambiaMalawi
Botswana
Burundi
Congo R
South Africa
Cote d'Ivoire
Egypt
Ghana
Mali
Mauritius
Namibia
Niger
Sudan
TogoTunisia
Chad
Kenya
Liberia
Libya
Senegal
Seychelles
1600
1700
1800
1900
2000
2100
2200
2300
2400
0.00 0.05 0.10 0.15 0.20 0.25 0.30 0.35
average price of electricity [EUR/kWh]
an
nu
al ir
rad
iatio
n o
n m
od
ule
[kW
h/(m
²y)]
2020
Angola
Benin
Madagascar
Uganda
Gabon
GambiaMalawi
Botswana
Burundi
Congo R
South Africa
Cote d'Ivoire
Egypt
Ghana
Mali
Mauritius
Namibia
Niger
Sudan
TogoTunisia
Chad
Kenya
Liberia
Libya
Senegal
Seychelles
1600
1700
1800
1900
2000
2100
2200
2300
2400
0.00 0.05 0.10 0.15 0.20 0.25 0.30 0.35
average price of electricity [EUR/kWh]
an
nu
al ir
rad
iatio
n o
n m
od
ule
[kW
h/(m
²y)]
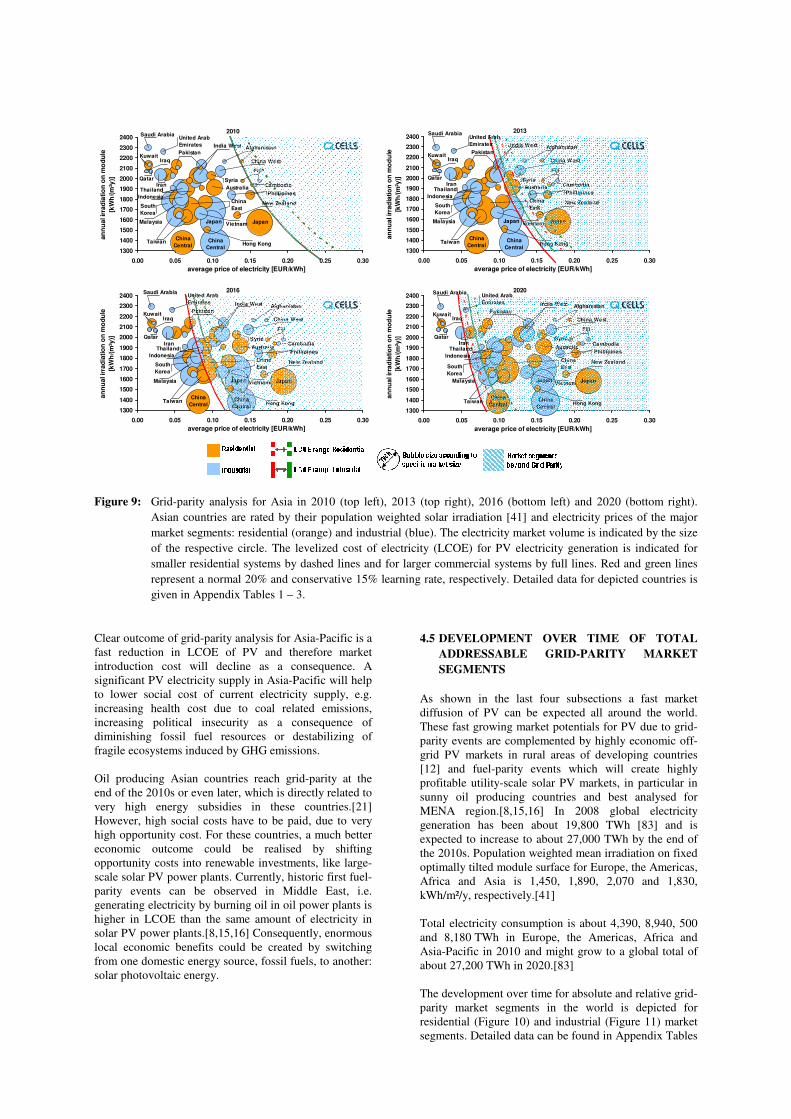
Figure 9: Grid-parity analysis for Asia in 2010 (top left), 2013 (top right), 2016 (bottom left) and 2020 (bottom right).
Asian countries are rated by their population weighted solar irradiation [41] and electricity prices of the major
market segments: residential (orange) and industrial (blue). The electricity market volume is indicated by the size
of the respective circle. The levelized cost of electricity (LCOE) for PV electricity generation is indicated for
smaller residential systems by dashed lines and for larger commercial systems by full lines. Red and green lines
represent a normal 20% and conservative 15% learning rate, respectively. Detailed data for depicted countries is
given in Appendix Tables 1 – 3.
Clear outcome of grid-parity analysis for Asia-Pacific is a
fast reduction in LCOE of PV and therefore market
introduction cost will decline as a consequence. A
significant PV electricity supply in Asia-Pacific will help
to lower social cost of current electricity supply, e.g.
increasing health cost due to coal related emissions,
increasing political insecurity as a consequence of
diminishing fossil fuel resources or destabilizing of
fragile ecosystems induced by GHG emissions.
Oil producing Asian countries reach grid-parity at the
end of the 2010s or even later, which is directly related to
very high energy subsidies in these countries.[21]
However, high social costs have to be paid, due to very
high opportunity cost. For these countries, a much better
economic outcome could be realised by shifting
opportunity costs into renewable investments, like large-
scale solar PV power plants. Currently, historic first fuel-
parity events can be observed in Middle East, i.e.
generating electricity by burning oil in oil power plants is
higher in LCOE than the same amount of electricity in
solar PV power plants.[8,15,16] Consequently, enormous
local economic benefits could be created by switching
from one domestic energy source, fossil fuels, to another:
solar photovoltaic energy.
4.5 DEVELOPMENT OVER TIME OF TOTAL
ADDRESSABLE GRID-PARITY MARKET
SEGMENTS
As shown in the last four subsections a fast market
diffusion of PV can be expected all around the world.
These fast growing market potentials for PV due to grid-
parity events are complemented by highly economic off-
grid PV markets in rural areas of developing countries
[12] and fuel-parity events which will create highly
profitable utility-scale solar PV markets, in particular in
sunny oil producing countries and best analysed for
MENA region.[8,15,16] In 2008 global electricity
generation has been about 19,800 TWh [83] and is
expected to increase to about 27,000 TWh by the end of
the 2010s. Population weighted mean irradiation on fixed
optimally tilted module surface for Europe, the Americas,
Africa and Asia is 1,450, 1,890, 2,070 and 1,830,
kWh/m²/y, respectively.[41]
Total electricity consumption is about 4,390, 8,940, 500
and 8,180 TWh in Europe, the Americas, Africa and
Asia-Pacific in 2010 and might grow to a global total of
about 27,200 TWh in 2020.[83]
The development over time for absolute and relative grid-
parity market segments in the world is depicted for
residential (Figure 10) and industrial (Figure 11) market
segments. Detailed data can be found in Appendix Tables
2010
Afghanistan
Australia
China
East
China West
China
Central
Thailand
Japan
China
Central Hong Kong
India West
Japan
Kuwait
New Zealand
Pakistan
Phillipines
Qatar
Malaysia
Saudi Arabia
South
Korea
Taiwan
United Arab
Emirates
Cambodia
Fiji
Indonesia
Iran
Iraq
Syria
Vietnam
1300
1400
1500
1600
1700
1800
1900
2000
2100
2200
2300
2400
0.00 0.05 0.10 0.15 0.20 0.25 0.30
average price of electricity [EUR/kWh]
an
nu
al ir
rad
iatio
n o
n m
od
ule
[kW
h/(m
²y)]
2013
Afghanistan
Australia
China
East
China West
China
Central
Thailand
Japan
China
Central Hong Kong
India West
Japan
Kuwait
New Zealand
Pakistan
Phillipines
Qatar
Malaysia
Saudi Arabia
South
Korea
Taiwan
United Arab
Emirates
Cambodia
Fiji
Indonesia
Iran
Iraq
Syria
Vietnam
1300
1400
1500
1600
1700
1800
1900
2000
2100
2200
2300
2400
0.00 0.05 0.10 0.15 0.20 0.25 0.30
average price of electricity [EUR/kWh]
an
nu
al ir
rad
iatio
n o
n m
od
ule
[kW
h/(m
²y)]
2016
Afghanistan
Australia
China
East
China West
China
Central
Thailand
Japan
China
Central Hong Kong
India West
Japan
Kuwait
New Zealand
Pakistan
Phillipines
Qatar
Malaysia
Saudi Arabia
South
Korea
Taiwan
United Arab
Emirates
Cambodia
Fiji
Indonesia
Iran
Iraq
Syria
Vietnam
1300
1400
1500
1600
1700
1800
1900
2000
2100
2200
2300
2400
0.00 0.05 0.10 0.15 0.20 0.25 0.30
average price of electricity [EUR/kWh]
an
nu
al ir
rad
iatio
n o
n m
od
ule
[kW
h/(m
²y)]
2020
Afghanistan
Australia
China
East
China West
China
Central
Thailand
Japan
China
Central Hong Kong
India West
Japan
Kuwait
New Zealand
Pakistan
Phillipines
Qatar
Malaysia
Saudi Arabia
South
Korea
Taiwan
United Arab
Emirates
Cambodia
Fiji
Indonesia
Iran
Iraq
Syria
Vietnam
1300
1400
1500
1600
1700
1800
1900
2000
2100
2200
2300
2400
0.00 0.05 0.10 0.15 0.20 0.25 0.30
average price of electricity [EUR/kWh]
an
nu
al ir
rad
iati
on
on
mo
du
le
[kW
h/(
m²y
)]

1 – 3.
First residential grid-parity events occur today in all
regions in the world and continue throughout the entire
decade (Figure 10). Very early grid-parity showing
market segments are Cyprus, Italy, the Caribbean and
West Africa. At the end of this decade more than 80% of
market segments in Europe, the Americas and Asia are
beyond residential grid-parity. Exception is given for
Africa, due to energy subsidies in South Africa and
Egypt, which represent more than 60% of electricity
generation in Africa. Residential grid-parity is
complemented by highly economic off-grid PV in rural
regions of developing countries. This is the case for
about 1.5 billion people in the world, mostly living in
Africa and South Asia.
Figure 10: Grid-Parity market volume for residential
segments in absolute (top) and relative
(bottom) numbers for all regions in the world
in the years 2010 to 2020. Detailed data is
given in Appendix Tables 1 – 3.
Residential grid-parity analysis (Figures 6 – 10) is
performed for 154 countries in the world. These countries
account for 98.0% of world population [84], 99.7% of
global gross domestic product [85], 99.5% of global
electricity consumption [86] and 99.2% of global
greenhouse gas emissions [87]. Detailed data is given in
Appendix Tables 1 – 3.
First industrial grid-parity events occur today in all
regions in the world and often on islands. They continue
throughout the entire decade (Figure 11). Very early
market segments are Cyprus, West Africa, Seychelles,
Caribbean, Cambodia and Fiji. Europe, the Americas and
Asia-Pacific show quite similar characteristics of
industrial grid-parity events throughout the entire decade.
At end of decade more than 75% of market segments in
Europe, the Americas and Asia are beyond industrial
grid-parity. Exception is given for Africa, due to energy
subsidies in South Africa and Egypt. Further exception
are mainly oil producing countries used to substantially
subsidizing their energy markets, e.g. Russia, Saudi-
Arabia, Libya, Venezuela, Iran, Iraq, Kuwait, Qatar,
Oman and Angola.
Figure 11: Grid-Parity market volume for industrial
segments in absolute (top) and relative
(bottom) numbers for all regions in the world
in the years 2010 to 2020. Detailed data is
given in Appendix Tables 1 – 3.
Nevertheless, significant opportunity cost might become
a pressing burden for these countries, as most could
substitute substantial amounts of currently burnt oil and
natural gas resources by renewable energy sources like
solar PV. As consequence of fuel-parity in these
countries fast growing utility-scale solar PV power plant
markets are very likely. PV power plants can be used as
fuel saving technology. Usually, solar PV sceptics claim
that PV would be one of the most expensive options for
reducing greenhouse gas (GHG) emissions.[88-91] After
fuel-parity, PV LCOE are lower in cost than LCOE of oil
fired power plants, used as baseload power plants in
several countries in the world. As a consequence,
reducing GHG emissions by combining oil power plants
and PV power plants generates economic GHG reduction
benefits. The authors of this publication encourage all
readers to be aware of this new fact that might be
surprising, in particular for conventional energy
economists.
Industrial grid-parity analysis (Figures 6 – 9 and 11) is
performed for 151 countries in the world. These countries
account for 97.7% of world population [84], 99.3% of
global gross domestic product [85], 99.6% of global
electricity consumption [86] and 99.1% of global
greenhouse gas emissions [87]. Detailed data is given in
Appendix Tables 1 – 3.
0
1,000
2,000
3,000
4,000
5,000
6,000
2010 2011 2012 2013 2014 2015 2016 2017 2018 2019 2020
ma
rke
t v
olu
me
RE
S [
TW
h]
Asia Americas Africa Europe
0%
10%
20%
30%
40%
50%
60%
70%
80%
90%
100%
2010 2011 2012 2013 2014 2015 2016 2017 2018 2019 2020
ma
rke
t v
olu
me
RE
S [
% o
f to
tal m
ark
et
20
20
]
Asia Americas Africa Europe
0
1,000
2,000
3,000
4,000
5,000
6,000
7,000
2010 2011 2012 2013 2014 2015 2016 2017 2018 2019 2020
ma
rke
t v
olu
me
IN
D [
TW
h]
Asia Americas Africa Europe
0%
10%
20%
30%
40%
50%
60%
70%
80%
90%
100%
2010 2011 2012 2013 2014 2015 2016 2017 2018 2019 2020
ma
rke
t v
olu
me
IN
D [
% o
f to
tal m
ark
et
20
20
]
Asia Americas Africa Europe
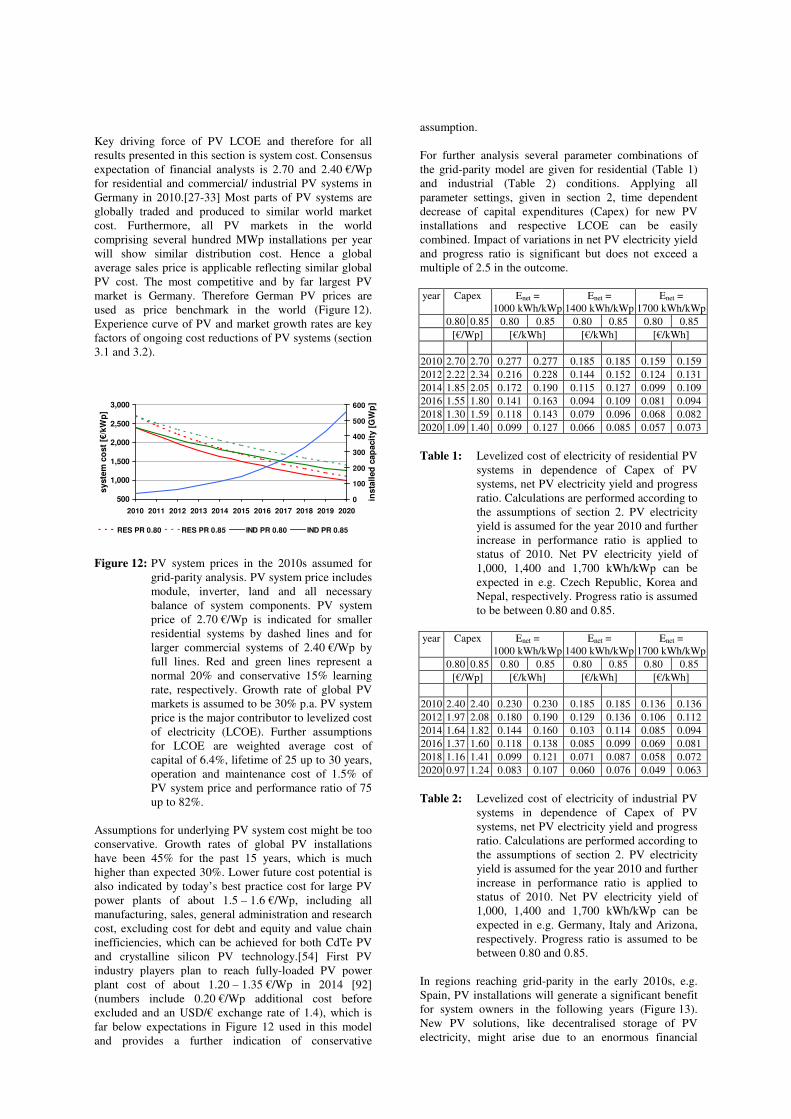
Key driving force of PV LCOE and therefore for all
results presented in this section is system cost. Consensus
expectation of financial analysts is 2.70 and 2.40 €/Wp
for residential and commercial/ industrial PV systems in
Germany in 2010.[27-33] Most parts of PV systems are
globally traded and produced to similar world market
cost. Furthermore, all PV markets in the world
comprising several hundred MWp installations per year
will show similar distribution cost. Hence a global
average sales price is applicable reflecting similar global
PV cost. The most competitive and by far largest PV
market is Germany. Therefore German PV prices are
used as price benchmark in the world (Figure 12).
Experience curve of PV and market growth rates are key
factors of ongoing cost reductions of PV systems (section
3.1 and 3.2).
Figure 12: PV system prices in the 2010s assumed for
grid-parity analysis. PV system price includes
module, inverter, land and all necessary
balance of system components. PV system
price of 2.70 €/Wp is indicated for smaller
residential systems by dashed lines and for
larger commercial systems of 2.40 €/Wp by
full lines. Red and green lines represent a
normal 20% and conservative 15% learning
rate, respectively. Growth rate of global PV
markets is assumed to be 30% p.a. PV system
price is the major contributor to levelized cost
of electricity (LCOE). Further assumptions
for LCOE are weighted average cost of
capital of 6.4%, lifetime of 25 up to 30 years,
operation and maintenance cost of 1.5% of
PV system price and performance ratio of 75
up to 82%.
Assumptions for underlying PV system cost might be too
conservative. Growth rates of global PV installations
have been 45% for the past 15 years, which is much
higher than expected 30%. Lower future cost potential is
also indicated by today’s best practice cost for large PV
power plants of about 1.5 – 1.6 €/Wp, including all
manufacturing, sales, general administration and research
cost, excluding cost for debt and equity and value chain
inefficiencies, which can be achieved for both CdTe PV
and crystalline silicon PV technology.[54] First PV
industry players plan to reach fully-loaded PV power
plant cost of about 1.20 – 1.35 €/Wp in 2014 [92]
(numbers include 0.20 €/Wp additional cost before
excluded and an USD/€ exchange rate of 1.4), which is
far below expectations in Figure 12 used in this model
and provides a further indication of conservative
assumption.
For further analysis several parameter combinations of
the grid-parity model are given for residential (Table 1)
and industrial (Table 2) conditions. Applying all
parameter settings, given in section 2, time dependent
decrease of capital expenditures (Capex) for new PV
installations and respective LCOE can be easily
combined. Impact of variations in net PV electricity yield
and progress ratio is significant but does not exceed a
multiple of 2.5 in the outcome.
year Capex Enet =
1000 kWh/kWp
Enet =
1400 kWh/kWp
Enet =
1700 kWh/kWp
0.80 0.85 0.80 0.85 0.80 0.85 0.80 0.85
[€/Wp] [€/kWh] [€/kWh] [€/kWh]
2010 2.70 2.70 0.277 0.277 0.185 0.185 0.159 0.159
2012 2.22 2.34 0.216 0.228 0.144 0.152 0.124 0.131
2014 1.85 2.05 0.172 0.190 0.115 0.127 0.099 0.109
2016 1.55 1.80 0.141 0.163 0.094 0.109 0.081 0.094
2018 1.30 1.59 0.118 0.143 0.079 0.096 0.068 0.082
2020 1.09 1.40 0.099 0.127 0.066 0.085 0.057 0.073
Table 1: Levelized cost of electricity of residential PV
systems in dependence of Capex of PV
systems, net PV electricity yield and progress
ratio. Calculations are performed according to
the assumptions of section 2. PV electricity
yield is assumed for the year 2010 and further
increase in performance ratio is applied to
status of 2010. Net PV electricity yield of
1,000, 1,400 and 1,700 kWh/kWp can be
expected in e.g. Czech Republic, Korea and
Nepal, respectively. Progress ratio is assumed
to be between 0.80 and 0.85.
year Capex Enet =
1000 kWh/kWp
Enet =
1400 kWh/kWp
Enet =
1700 kWh/kWp
0.80 0.85 0.80 0.85 0.80 0.85 0.80 0.85
[€/Wp] [€/kWh] [€/kWh] [€/kWh]
2010 2.40 2.40 0.230 0.230 0.185 0.185 0.136 0.136
2012 1.97 2.08 0.180 0.190 0.129 0.136 0.106 0.112
2014 1.64 1.82 0.144 0.160 0.103 0.114 0.085 0.094
2016 1.37 1.60 0.118 0.138 0.085 0.099 0.069 0.081
2018 1.16 1.41 0.099 0.121 0.071 0.087 0.058 0.072
2020 0.97 1.24 0.083 0.107 0.060 0.076 0.049 0.063
Table 2: Levelized cost of electricity of industrial PV
systems in dependence of Capex of PV
systems, net PV electricity yield and progress
ratio. Calculations are performed according to
the assumptions of section 2. PV electricity
yield is assumed for the year 2010 and further
increase in performance ratio is applied to
status of 2010. Net PV electricity yield of
1,000, 1,400 and 1,700 kWh/kWp can be
expected in e.g. Germany, Italy and Arizona,
respectively. Progress ratio is assumed to be
between 0.80 and 0.85.
In regions reaching grid-parity in the early 2010s, e.g.
Spain, PV installations will generate a significant benefit
for system owners in the following years (Figure 13).
New PV solutions, like decentralised storage of PV
electricity, might arise due to an enormous financial
500
1,000
1,500
2,000
2,500
3,000
2010 2011 2012 2013 2014 2015 2016 2017 2018 2019 2020
syste
m c
ost
[€/k
Wp
]
0
100
200
300
400
500
600
insta
lled
cap
acit
y [
GW
p]
RES PR 0.80 RES PR 0.85 IND PR 0.80 IND PR 0.85
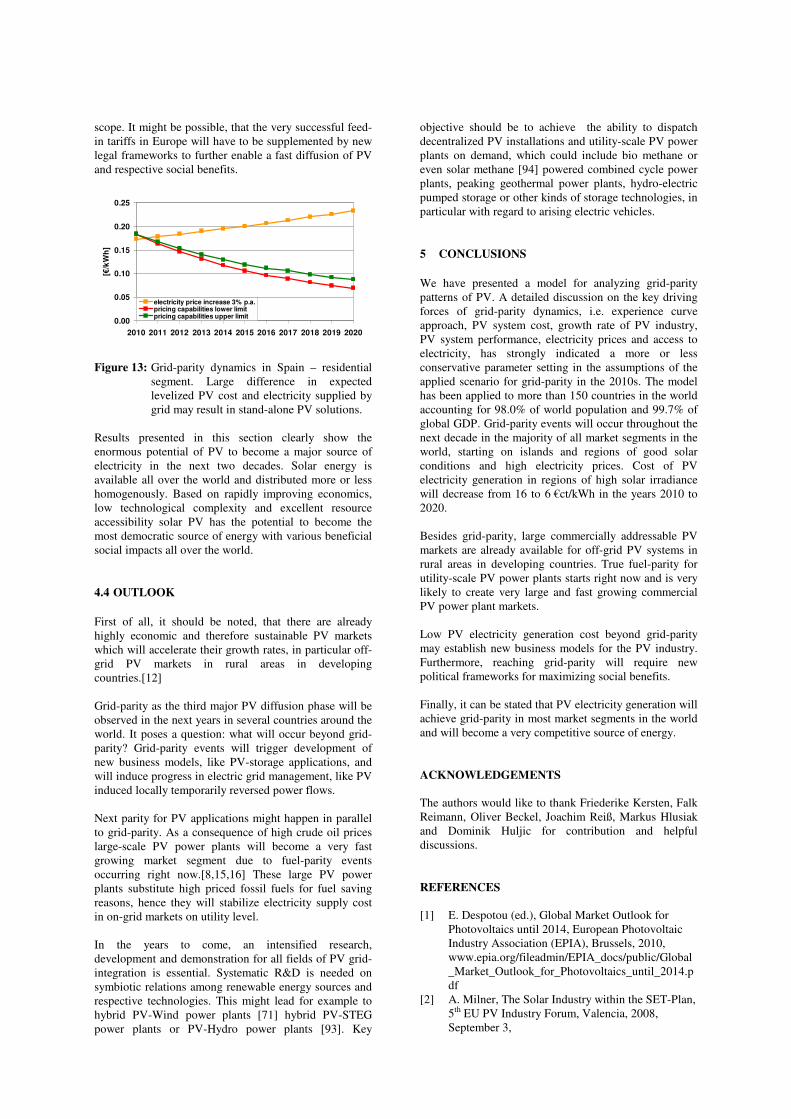
scope. It might be possible, that the very successful feed-
in tariffs in Europe will have to be supplemented by new
legal frameworks to further enable a fast diffusion of PV
and respective social benefits.
0.00
0.05
0.10
0.15
0.20
0.25
2010 2011 2012 2013 2014 2015 2016 2017 2018 2019 2020
[€/k
Wh
]
electricity price increase 3% p.a.pricing capabilities lower limitpricing capabilities upper limit
Figure 13: Grid-parity dynamics in Spain – residential
segment. Large difference in expected
levelized PV cost and electricity supplied by
grid may result in stand-alone PV solutions.
Results presented in this section clearly show the
enormous potential of PV to become a major source of
electricity in the next two decades. Solar energy is
available all over the world and distributed more or less
homogenously. Based on rapidly improving economics,
low technological complexity and excellent resource
accessibility solar PV has the potential to become the
most democratic source of energy with various beneficial
social impacts all over the world.
4.4 OUTLOOK
First of all, it should be noted, that there are already
highly economic and therefore sustainable PV markets
which will accelerate their growth rates, in particular off-
grid PV markets in rural areas in developing
countries.[12]
Grid-parity as the third major PV diffusion phase will be
observed in the next years in several countries around the
world. It poses a question: what will occur beyond grid-
parity? Grid-parity events will trigger development of
new business models, like PV-storage applications, and
will induce progress in electric grid management, like PV
induced locally temporarily reversed power flows.
Next parity for PV applications might happen in parallel
to grid-parity. As a consequence of high crude oil prices
large-scale PV power plants will become a very fast
growing market segment due to fuel-parity events
occurring right now.[8,15,16] These large PV power
plants substitute high priced fossil fuels for fuel saving
reasons, hence they will stabilize electricity supply cost
in on-grid markets on utility level.
In the years to come, an intensified research,
development and demonstration for all fields of PV grid-
integration is essential. Systematic R&D is needed on
symbiotic relations among renewable energy sources and
respective technologies. This might lead for example to
hybrid PV-Wind power plants [71] hybrid PV-STEG
power plants or PV-Hydro power plants [93]. Key
objective should be to achieve the ability to dispatch
decentralized PV installations and utility-scale PV power
plants on demand, which could include bio methane or
even solar methane [94] powered combined cycle power
plants, peaking geothermal power plants, hydro-electric
pumped storage or other kinds of storage technologies, in
particular with regard to arising electric vehicles.
5 CONCLUSIONS
We have presented a model for analyzing grid-parity
patterns of PV. A detailed discussion on the key driving
forces of grid-parity dynamics, i.e. experience curve
approach, PV system cost, growth rate of PV industry,
PV system performance, electricity prices and access to
electricity, has strongly indicated a more or less
conservative parameter setting in the assumptions of the
applied scenario for grid-parity in the 2010s. The model
has been applied to more than 150 countries in the world
accounting for 98.0% of world population and 99.7% of
global GDP. Grid-parity events will occur throughout the
next decade in the majority of all market segments in the
world, starting on islands and regions of good solar
conditions and high electricity prices. Cost of PV
electricity generation in regions of high solar irradiance
will decrease from 16 to 6 €ct/kWh in the years 2010 to
2020.
Besides grid-parity, large commercially addressable PV
markets are already available for off-grid PV systems in
rural areas in developing countries. True fuel-parity for
utility-scale PV power plants starts right now and is very
likely to create very large and fast growing commercial
PV power plant markets.
Low PV electricity generation cost beyond grid-parity
may establish new business models for the PV industry.
Furthermore, reaching grid-parity will require new
political frameworks for maximizing social benefits.
Finally, it can be stated that PV electricity generation will
achieve grid-parity in most market segments in the world
and will become a very competitive source of energy.
ACKNOWLEDGEMENTS
The authors would like to thank Friederike Kersten, Falk
Reimann, Oliver Beckel, Joachim Reiß, Markus Hlusiak
and Dominik Huljic for contribution and helpful
discussions.
REFERENCES
[1] E. Despotou (ed.), Global Market Outlook for
Photovoltaics until 2014, European Photovoltaic
Industry Association (EPIA), Brussels, 2010,
www.epia.org/fileadmin/EPIA_docs/public/Global
_Market_Outlook_for_Photovoltaics_until_2014.p
df
[2] A. Milner, The Solar Industry within the SET-Plan,
5th EU PV Industry Forum, Valencia, 2008,
September 3,
www.epia.org/index.php?eID=tx_nawsecuredl&u=
0&file=filemin/EPIA_docs/documents/23EUPVSE
C/Presentations/IF_3_4_Milner.pdf
[3] M. Latour, Photovoltaic industry substantially
revises its target to supply 12% of European
electricity demand by 2020, European Photovoltaic
Industry Association (EPIA), Brussels, 2008,
September 4,
www.epia.org/fileadmin/EPIA_docs/documents/pre
ss/380904_PR_12_Electricity_EN_FINAL.pdf
[4] B. Schubert, Q-Cells presentation, PHTON’s 1st
TECAF Conference, San Francisco, 2008,
December 4
[5] Ch. Breyer, A. Gerlach, J. Mueller, H. Behacker, A.
Milner, Grid-Parity Analysis for EU and US
regions and market segments – Dynamics of Grid-
Parity and Dependence on Solar Irradiance, local
Electricity Prices and PV Progress Ratio,
Proceedings 24th European Photovoltaic Solar
Energy Conference, Hamburg, 2009, September 21
– 25, DOI:10.4229/24thEUPVSEC2009-6DV.2.34
[6] H. Klärner, M. Schultz, SET for 2020, PV Japan,
Chiba, 2009, June 24
[7] M. Kar, Grid Parity of PV Power in India, Indo-
German Energy Symposium, New Delhi, 2010,
April 28
[8] Ch. Breyer, Value of Solar PV Electricity in
MENA Region, Casablanca Forum: Large-Scale
Solar Power in MENA: Vision and Reality,
Casablanca, June 15 – 16, http://www.casablanca-
forum.org/media/material/Q-
Cells_ValueOfSolarPVelectricityInMENAregion_
CasablancaForum_cb_final_print_100616.pdf
[9] O. Beckel, Grid Parity in Asian Photovoltaic
Markets, First Asia Solar Energy Forum, Manila,
July 5 - 6
[10] D.M. Chapin, C.S. Fuller, G.L. Pearson, A new
silicon p-n junction photocell for converting solar
radiation into electrical power, J. Appl. Phys.,
1954, 25, 676-677
[11] J. Perlin, From Space to Earth – The Story of Solar
Electricity, aatec publications, Ann Arbor, 1999
[12] Ch. Breyer, A. Gerlach, M. Hlusiak, C. Peters, P.
Adelmann, J. Winiecki, H. Schützeichel, S.
Tsegaye, W. Gashie, Electrifing the Poor: Highly
economic off-grid PV Systems in Ethiopia – A
Basis for sustainable rural Development,
Proceedings 24th European Photovoltaic Solar
Energy Conference, Hamburg, 2009, September 21
– 25, DOI: 10.4229/24thEUPVSEC2009-5EP.2.3
[13] O. Ikki and I. Kaizuka, PV in Japan – Yesterday,
Today and Tomorrow, in: W. Palz (ed.), Power for
the World – The Emergence of Electricity from the
Sun, Pan Stanford Publishing, Singapore, 2010
[14] H.-J. Fell, Will This Work? Is It Realistic? –
Thoughts and Acts of a Political Practitioner with a
Solar Vision, in: W. Palz (ed.), Power for the
World – The Emergence of Electricity from the
Sun, Pan Stanford Publishing, Singapore, 2010
[15] Ch. Breyer, A. Gerlach, O. Beckel, Value of Solar
PV Electricity in MENA Region, IEEE EnergyCon,
Manama, 2010, December 18 – 22, submitted
[16] Ch. Breyer, A. Gerlach, D. Schäfer, Fuel-Parity:
New Very Large and Sustainable Market Segments
for PV Systems, IEEE EnergyCon, Manama, 2010,
December 18 – 22, submitted
[17] B.A. Andersson and S. Jacobsson, Monitoring and
assessing technology choice: the case of solar cells,
Energy Policy, 2000, 28, 1037-1047
[18] Ch. Breyer, Ch. Birkner, F. Kersten, A. Gerlach, G.
Stryi-Hipp, J.Ch. Goldschmidt, D.F. Montoro, M.
Riede, Research and Development Investments in
PV – A limiting Factor for a fast PV Diffusion?,
this conference
[19] A. Gerlach, Wirtschaftlichkeit von Photovoltaik in
nicht subventionierten Märkten, Diploma thesis,
Clausthal University of Technology, 2009
[20] W. Short, D.J. Packey, T. Holt, A Manual for the
Economic Evaluation of Energy Efficiency and
Renewable Energy Technologies, National
Renewable Energy Laboratory (NREL), NREL/TP-
462-5173, Golden, 1995,
www.nrel.gov/csp/troughnet/pdfs/5173.pdf
[21] N. Tanaka (ed.), World Energy Outlook 2008,
International Energy Agency (IEA), Paris, 2008
[22] European Commission, R&D Investment in the
Priority Technologies of the European Strategic
Energy Technology Plan, European Commission
(EC), Brussels, 2009, SEC(2009) 1296,
http://ec.europa.eu/energy/technology/set_plan/doc/
2009_comm_investing_development_low_carbon_
technologies_en.pdf
[23] Ch. Breyer, J. Schmid, Global Distribution of
optimal Tilt Angles for fixed tilted PV Systems,
this conference
[24] G.F. Nemet, Beyond the learning curve: factors
influencing cost reductions in photovoltaics,
Energy Policy, 2006, 34, 3218-3232
[25] T.P. Wright, Factors Affecting the Cost of
Airplanes, J. Aeronautical Sciences, 1936, 3, 122-
126
[26] L. Rapping, Learning and World War II Production
Functions, Rev. of Economics and Statistics, 1965,
47, 81-86
[27] E. Ayclcek, W. Schneider, A.-K. Bohlen, B. Jeggle,
W. Seeliger, Sector Analysis Photovoltaics 2010:
From vertical to horizontal integration –
Renewables and Grid Integration, Landesbank
Baden-Württemberg (LBBW), Stuttgart, 2010,
released April 27
[28] P. Bumm, Solar Power, Cheuvreux – Crédit
Agricole Group, 2010, Frankfurt (Main), released
March 4
[29] S. O’Rourke, P. Kim, H. Polavarapu (eds.), Solar
Photovoltaic Industry 2010 global outlook Déjà
vu?, Deutsche Bank Securities, New York, 2010,
released February 8
[30] Photon, Entwicklung der Anlagenpreise, Photon –
Das Solarstrom-Magazin, 2010 (4), 143
[31] V. Shah, J. Greenblatt, R. Madlani, A. Basu, Solar-
Investor Guide 2010, Barclays Capital, New York,
2010, released May 14
[32] S. Gupta, S. Lu, A. Humphrey, S. Srethapramote, J.
Paradise, Global Solar: Sovereign Debt Concerns
… Not a Solar Eclipse, Morgan Stanley Asia,
Singapore, 2010, released May 10
[33] M. Reuter, A.K. Gruse, European PV
ModulePriceMonitor: First Quarter Results 2010,
EuPD Research, Bonn, 2010, released February
[34] European Commission, Eurostat, Environment and
energy, http://epp.eurostat.ec.europa.eu
[35] Energy Information Administration (EIA) – An
agency of US Department of Energy (DoE),
Electricity U.S. Data,
www.eia.doe.gov/fuelelectric.html
[36] Energy Information Administration (EIA) – An
agency of US Department of Energy (DoE),
International Electricity Prices and Fuel Costs,
www.eia.doe.gov/emeu/international/electricitypric
e.html
[37] Energy Efficiency in the Construction Sector in the
Mediterranean (MED-ENEC), www.med-enec.com
[38] Union of Producers, Transporters and Distributors
of Electric Power in Africa (UPDEA), Comparative
study of electricity tariffs used in Africa, 2009,
www.updea-
africa.org/updea/DocWord/TarifAng2010.pdf
[39] Central Electricity Regulatory Commission
(CERC), New Delhi, India, www.cercind.gov.in
[40] Q-Cells Research, Headquarters, China Office,
Tokyo Office, India Office, Q-Cells, 2010
[41] Ch. Breyer, J. Schmid, Population Density and
Area weighted Solar Irradiation: global Overview
on Solar Resource Conditions for fixed tilted, 1-
axis and 2-axes PV Systems, this conference
[42] R.M. Swanson, A vision for crystalline silicon
photovoltaics, Progress in Photovoltaics, 2006, 14,
443-453
[43] N. Tanaka (ed.), Energy Technology Perspectives
2008 – Scenarios and Strategies to 2050,
International Energy Agency (IEA), Paris, 2008
[44] G.F. Nemet, Interim monitoring of cost dynamics
for publicly supported energy technologies, Energy
Policy, 2009, 37, 825-835
[45] R. Pitz-Paal, J. Dersch, B. Milow (eds.), Ecostar –
European Concentrated Solar Thermal Road-
Mapping, German Aerospace Center (DLR),
Cologne, 2004, www.trec-
uk.org.uk/reports/ecostar_report_2004.pdf
[46] M. Schaffhorst, The Way to Competitiveness of PV
– An Experience Curve and Break-even Analysis,
PhD Thesis, Faculty of Electrical Engineering and
Computer Science, University of Kassel, 2006,
www.upress.uni-kassel.de/online/frei/978-3-89958-
241-3.volltext.frei.pdf
[47] M. Meinhardt, B. Burger, A. Engler, PV-
Systemtechnik – Motor der Kostenreduktion für die
Photovoltaische Stromerzeugung,
ForschungsVerbund Sonnenenergie (FVS),
Produktionstechnologie für die Solarenergie,
Jahrestagung, Hannover, 2007, September 26 – 27,
www.fvee.de/fileadmin/publikationen/Themenhefte
/th2007/th2007.pdf
[48] W. Hoffmann, S. Wieder, T. Pellkofer,
Differentiated Price Experience Curves as
Evaluation Tool for Judging the further
Development of Crystalline Silicon and Thin Film
PV Solar Electricity Products, Proceedings 24th
European Photovoltaic Solar Energy Conference,
Hamburg, 2009, September 21 – 25
[49] L.E. Yelle, The learning curve: historical review
and comprehensive survey, Decision Science,
1979, 10, 302-328
[50] U.K. Rout, M. Blesl, U. Fahl, U. Remme, A. Voß,
Uncertainty in the learning rates of energy
technologies: An experiment in a global multi-
regional energy system model, Energy Policy,
2009, 37, 4927-4942
[51] A.E. Curtright, M.G. Morgan, D.W. Keith, Expert
Assessments of Future Photovoltaic Technologies,
Environ. Sci. Technol., 2008, 42, 9031-9038
[52] R. Pietzcker, S. Manger, N. Bauer, G. Luderer, T.
Bruckner, The Role of Concentrating Solar Power
and Photovoltaics for Climate Protection,
Proceedings 10th IAEE European Energy
Conference, Vienna, 2009, September 7 - 10
[53] R.J. Gillette, B. Sohn, J. Meyerhoff, L. Polizzotto,
Q2 2010 Earnings Call, First Solar, 2010, released
July 29, www.firstsolar.com, http://phx.corporate-
ir.net/External.File?item=UGFyZW50SUQ9NTU1
MjV8Q2hpbGRJRD0tMXxUeXBlPTM=&t=1
[54] Ch. Breyer, How favourable is PV?,
Frühjahrssitzung Arbeitskreis Energie der,
Deutsche Physikalische Gesellschaft (DPG), Bad
Honnef 2009, May 6, www.uni-
saarland.de/fak7/fze/AKE_Archiv/AKE2010F/AK
E2010F_Vortraege/AKE2010F_02Breyer_PV-
HowFavourable.pdf
[55] J. Schindler and W. Zittel (eds.), Crude Oil - The
supply outlook, Energy Watch Group, Berlin,
2008,
www.energywatchgroup.org/fileadmin/global/pdf/2
008-02_EWG_Oil_Report_updated.pdf
[56] P. de Almeida and P.D. Silva, The peak of oil
production – Timings and market recognition,
Energy Policy, 2009, 37, 1267-1276
[57] U. Bardi, Peak oil: The four stages of a new idea,
Energy, 2009, 34, 323-326
[58] R.K. Pachauri (ed.), IPCC 4th Assessment Report:
Climate Change 2007, Intergovernal Panel on
Climate Change (IPCC), Geneva, 2007,
www.ipcc.ch
[59] N. Stern (ed.), Stern Review on the economics of
climate change, HM Treasury, London, 2006,
www.sternreview.org.uk
[60] B. Meyer, S. Schmidt, V. Eidems, Staatliche
Förderung der Atomenergie, Greenpeace e.V.,
Hamburg, 2009,
www.greenpeace.de/fileadmin/gpd/user_upload/the
men/atomkraft/Studie_Subventionen_Atomenergie.
[61] F. Barnaby and J. Kemp (eds.), Secure Energy? –
Civil Nuclear Power, Security and Global
Warming, Oxford Research Group, London, 2007,
http://oxfordresearchgroup.org.uk/publications/brie
fing_papers/secure_energy_civil_nuclear_power_se
curity_and_global_warming
[62] E.A. Alsema, M.J. de Wild-Scholten, Reduction of
the Environmental Impacts in Crystalline Silicon
Module Manufacturing, Proceedings 22nd European
Photovoltaic Solar Energy Conference, Milan,
2007, September 3 - 7
[63] V.M. Fthenakis and H.C. Kim, Greenhouse-gas
emissions from solar electric- and nuclear power: A
life-cycle study, Energy Policy, 2007, 35, 2549-
2557
[64] V.M. Fthenakis, H.C. Kim, Photovoltaics: Life-
cycle analyses, Solar Energy, 2010, in press
[65] M.J. de Wild-Scholten M. de, M. Schottler, Solar
as an environmental product: Thin-film modules –
production processes and their environmental
assessment, Thin Film Industry Forum, Berlin,
2009, April 24
[66] K. Zweibel, E.M. James, F. Vasilis, A solar grand
plan, Scientific American, 2008, 298(1), 64-73
[67] J. Mason, V. Fthenakis, K. Zweibel, T. Hanson, T.
Nikolakakis, Coupling PV and CAES Power Plants
to Transform Intermittent PV Electricity into a
Dispatchable Electricity Source, Progress in
Photovoltaics, 2008, 16, 649-668
[68] P. Denholm and R.M. Margolis, Evaluating the
limits of solar photovoltaics (PV) in electric power
systems utilizing energy storage and other enabling
technologies, Energy Policy, 2007, 35, 4424-4433
[69] M. Braun, T. Degner, T. Glotzbach, Y.-M. Saint-
Drenan, Value of PV Energy in Germany - Benefit
from the Substitution of Conventional Power Plants
and Local Power Generation, Proceedings 23rd
European Photovoltaic Solar Energy Conference,
Valencia, 2008, September 1 - 5
[70] R. Mackensen, K. Rohrig, L. Adzic, Y.-M. Saint-
Drenan, No limits for a full electricity supply by
renewables, Institut für Solare
Energieversorgungstechnik (ISET), ewec 2008,
Brussels, 2008,
www.ewec2008proceedings.info/ewec2008/allfiles
2/117_EWEC2008fullpaper.pdf
[71] C. Hoffmann, M. Greiner, L. v. Bremen, K. Knorr,
S. Bofinger, M. Speckmann, K. Rohrig, Design of
transport and storage capacities for a future
European power supply system with a high share of
renewable energies, 3rd International Renewable
Energy Storage Conference IRES, Berlin, 2008,
November 24 - 25
[72] Ch. Breyer and G. Knies, Global Energy Supply
Potential of Concentrating Solar Power, Proc.
SolarPACES 2009, Berlin, 2009, September 15 –
18
[73] N. Tanaka (ed.), Technology Roadmap: Solar
photovoltaic Energy, International Energy Agency
(IEA), Paris, 2010,
www.iea.org/papers/2009/PV_roadmap_targets_pri
nting.pdf
[74] W. Krewitt, J. Nitsch, K. Nienhaus, Globale
Energieszenarien - Bedeutung der Erneuerbaren
Energien und der Energieeffizienz, FVEE
Jahrestagung, Berlin, 2008, November 24 – 25,
www.fvee.de/fileadmin/publikationen/Themenhefte
/th2009/th2009_03_02
[75] S. Teske (ed.), energy [r]evolution: A Sustainable
World Energy Outlook, Greenpeace International,
Amsterdam, 2010,
www.greenpeace.org/international/Global/internati
onal/publications/climate/2010/fullreport.pdf
[76] P. Mints, First Markets and Applications for OPV,
Navigant Consulting, Organics Photovoltaic
Summit, Boston, 2009, October 15 - 16
[77] C. Gredler, Das Wachstumspotenzial der
Photovoltaik und der Windkraft – divergierende
Wahrnehmungen zentraler Akteure, Diploma
Thesis, University Salzburg, 2008
[78] P. Grunow and S. Lehmann, General assessment of
the reliability of crystalline silicon photovoltaic
modules, Photovoltaik Institut Berlin AG, Berlin
2009
[79] International Energy Agency, World Energy
Outlook, Electricity Access Database, International
Energy Agency (IEA), Paris, 2008,
www.worldenergyoutlook.org/database_electricity/
electricity_access_database.htm
[80] United Nations, Human Development Report
2007/2008, UN Development Programme, New
York, 2007,
http://hdr.undp.org/en/reports/global/hdr2007-
2008/
[81] International Energy Agency (IEA), World Energy
Outlook 2006, Paris, 2006,
www.iea.org/textbase/nppdf/free/2006/weo2006.pd
f
[82] D. Balk and G. Yetman, The Global Distribution of
Population: Gridded Population of the World
Version 3 (GPWv3), Center for International Earth
Science Information Network (CIESIN), New
York, 2005, http://sedac.ciesin.columbia.edu/gpw
[83] N. Tanaka (ed.), World Energy Outlook 2009,
International Energy Agency (IEA), Paris, 2009
[84] United Nations, World Population Prospects: The
2008 Revision Highlights, UN Department of
Economic and Social Affairs, Population Division,
Working Paper No. ESA/P/WP.210, New York,
2009,
http://esa.un.org/unpd/wpp2008/pdf/WPP2008_Hi
ghlights.pdf
[85] World Bank, Gross domestic product 2008, World
Development Indicators database, World Bank,
Washington, 2009,
http://siteresources.worldbank.org/DATASTATIST
ICS/Resources/GDP.pdf
[86] International Energy Agency, Key World Energy
Statistics 2009, International Energy Agency (IEA),
Paris, 2009,
www.iea.org/textbase/nppdf/free/2009/key_stats_2
009.pdf
[87] United Nations, Carbon Dioxide Emissions (CO2),
Department of Economic and Social Affairs
Statistics Division, New York, 2009,
http://mdgs.un.org/unsd/mdg/SeriesDetail.aspx?srid
=749&crid=
[88] M. Frondel, N. Ritter, C.M. Schmidt, C. Vance,
Economic impacts from the promotion of
renewable energy technologies: The German
experience, Energy Policy, 2010, 38, 4048–4056
[89] L. Birnbaum, A. Hartmann, C. Malorny, J. Riese,
T. Vahlenkamp, J. Hein, K. Mittelbach, M.
Schröder, Kosten und Potenziale der Vermeidung
von Treibhausgasemissionen in Deutschland, study
on behalf of Bundesverband der Deutschen
Industrie (BDI), McKinsey & Company, Berlin,
2007,
www.mckinsey.de/downloads/presse/2007/070925
_Kosten_und_Potenziale_der_Vermeidung_von_Tr
eibhausgasemissionen_in_Deutschland.pdf
[90] T. Nauclér, P.-A. Enkvist (eds.), Pathways to a
Low-Carbon Economy: Version 2 of the Global
Greenhouse Gas Abatement Cost Curve, McKinsey
& Company, 2009,
https://solutions.mckinsey.com/ClimateDesk/defaul
t.aspx
[91] W. Sandner, M. Keilhacker, G. Litfin, E. Umbach,
Elektrizität: Schlüssel zu einem nachhaltigen und
klimaverträglichen Energiesystem, Deutsche
Physikalische Gesellschaft e.V., Bad Honnef, 2010
[92] K. Asali, Value of PV for Large Scale Solar Power
Plants in MENA, First Solar, Hannover Messe,
SOLAR XXL – Solar solutions to power the
Middle East and North Africa, 2010, April 22
[93] Kreditanstalt für Wiederaufbau (KfW), PV-Hydro
Initiative: Stages 1 & 2 – Assessement of the
Potential for the Commercialization of Conjunctive
Photovoltaic – Hydro Power Generation, KfW and
United Nations Environmental Programme (UNEP)
prepared by Lahmeyer International and Solar-
Institut Jülich, 2001
[94] M. Sterner, Bioenergy and renewable power
methane in integrated 100% renewable energy
systems, PhD thesis, University of Kassel, 2009
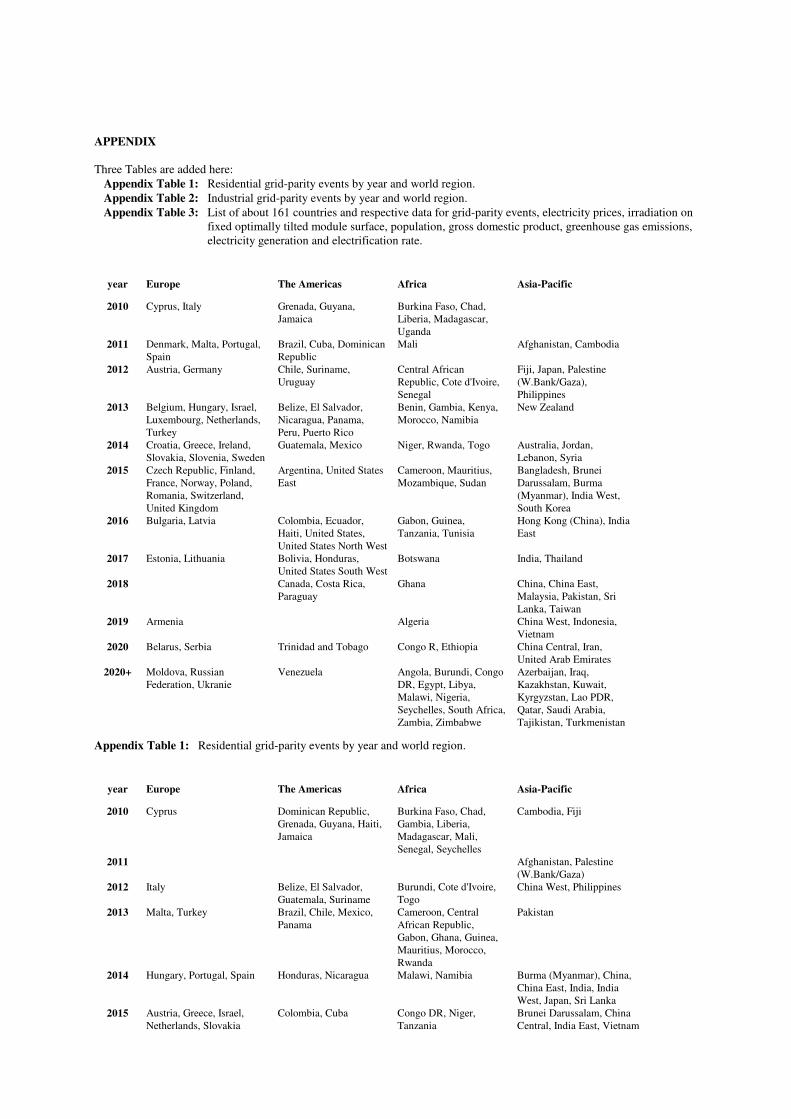
APPENDIX
Three Tables are added here:
Appendix Table 1: Residential grid-parity events by year and world region.
Appendix Table 2: Industrial grid-parity events by year and world region.
Appendix Table 3: List of about 161 countries and respective data for grid-parity events, electricity prices, irradiation on
fixed optimally tilted module surface, population, gross domestic product, greenhouse gas emissions,
electricity generation and electrification rate.
year Europe The Americas Africa Asia-Pacific
2010 Cyprus, Italy Grenada, Guyana,
Jamaica
Burkina Faso, Chad,
Liberia, Madagascar,
Uganda
2011 Denmark, Malta, Portugal,
Spain
Brazil, Cuba, Dominican
Republic
Mali Afghanistan, Cambodia
2012 Austria, Germany Chile, Suriname,
Uruguay
Central African
Republic, Cote d'Ivoire,
Senegal
Fiji, Japan, Palestine
(W.Bank/Gaza),
Philippines
2013 Belgium, Hungary, Israel,
Luxembourg, Netherlands,
Turkey
Belize, El Salvador,
Nicaragua, Panama,
Peru, Puerto Rico
Benin, Gambia, Kenya,
Morocco, Namibia
New Zealand
2014 Croatia, Greece, Ireland,
Slovakia, Slovenia, Sweden
Guatemala, Mexico Niger, Rwanda, Togo Australia, Jordan,
Lebanon, Syria
2015 Czech Republic, Finland,
France, Norway, Poland,
Romania, Switzerland,
United Kingdom
Argentina, United States
East
Cameroon, Mauritius,
Mozambique, Sudan
Bangladesh, Brunei
Darussalam, Burma
(Myanmar), India West,
South Korea
2016 Bulgaria, Latvia Colombia, Ecuador,
Haiti, United States,
United States North West
Gabon, Guinea,
Tanzania, Tunisia
Hong Kong (China), India
East
2017 Estonia, Lithuania Bolivia, Honduras,
United States South West
Botswana India, Thailand
2018 Canada, Costa Rica,
Paraguay
Ghana China, China East,
Malaysia, Pakistan, Sri
Lanka, Taiwan
2019 Armenia Algeria China West, Indonesia,
Vietnam
2020 Belarus, Serbia Trinidad and Tobago Congo R, Ethiopia China Central, Iran,
United Arab Emirates
2020+ Moldova, Russian
Federation, Ukranie
Venezuela Angola, Burundi, Congo
DR, Egypt, Libya,
Malawi, Nigeria,
Seychelles, South Africa,
Zambia, Zimbabwe
Azerbaijan, Iraq,
Kazakhstan, Kuwait,
Kyrgyzstan, Lao PDR,
Qatar, Saudi Arabia,
Tajikistan, Turkmenistan
Appendix Table 1: Residential grid-parity events by year and world region.
year Europe The Americas Africa Asia-Pacific
2010 Cyprus Dominican Republic,
Grenada, Guyana, Haiti,
Jamaica
Burkina Faso, Chad,
Gambia, Liberia,
Madagascar, Mali,
Senegal, Seychelles
Cambodia, Fiji
2011 Afghanistan, Palestine
(W.Bank/Gaza)
2012 Italy Belize, El Salvador,
Guatemala, Suriname
Burundi, Cote d'Ivoire,
Togo
China West, Philippines
2013 Malta, Turkey Brazil, Chile, Mexico,
Panama
Cameroon, Central
African Republic,
Gabon, Ghana, Guinea,
Mauritius, Morocco,
Rwanda
Pakistan
2014 Hungary, Portugal, Spain Honduras, Nicaragua Malawi, Namibia Burma (Myanmar), China,
China East, India, India
West, Japan, Sri Lanka
2015 Austria, Greece, Israel,
Netherlands, Slovakia
Colombia, Cuba Congo DR, Niger,
Tanzania
Brunei Darussalam, China
Central, India East, Vietnam
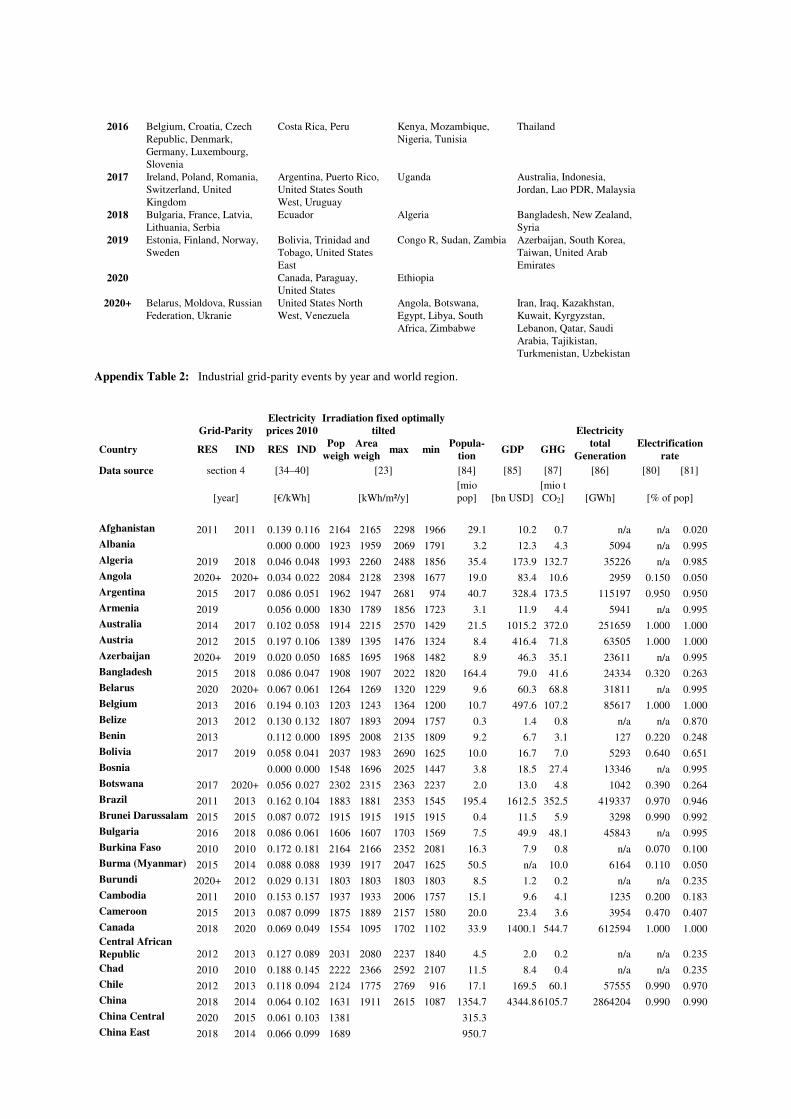
2016 Belgium, Croatia, Czech
Republic, Denmark,
Germany, Luxembourg,
Slovenia
Costa Rica, Peru Kenya, Mozambique,
Nigeria, Tunisia
Thailand
2017 Ireland, Poland, Romania,
Switzerland, United
Kingdom
Argentina, Puerto Rico,
United States South
West, Uruguay
Uganda Australia, Indonesia,
Jordan, Lao PDR, Malaysia
2018 Bulgaria, France, Latvia,
Lithuania, Serbia
Ecuador Algeria Bangladesh, New Zealand,
Syria
2019 Estonia, Finland, Norway,
Sweden
Bolivia, Trinidad and
Tobago, United States
East
Congo R, Sudan, Zambia Azerbaijan, South Korea,
Taiwan, United Arab
Emirates
2020 Canada, Paraguay,
United States
Ethiopia
2020+ Belarus, Moldova, Russian
Federation, Ukranie
United States North
West, Venezuela
Angola, Botswana,
Egypt, Libya, South
Africa, Zimbabwe
Iran, Iraq, Kazakhstan,
Kuwait, Kyrgyzstan,
Lebanon, Qatar, Saudi
Arabia, Tajikistan,
Turkmenistan, Uzbekistan
Appendix Table 2: Industrial grid-parity events by year and world region.
Grid-Parity
Electricity
prices 2010
Irradiation fixed optimally
tilted Electricity
Country RES IND RES IND Pop
weigh
Area
weigh max min
Popula-
tion GDP GHG
total
Generation
Electrification
rate
Data source section 4 [34–40] [23] [84] [85] [87] [86] [80] [81]
[year] [€/kWh] [kWh/m²/y]
[mio
pop] [bn USD]
[mio t
CO2] [GWh] [% of pop]
Afghanistan 2011 2011 0.139 0.116 2164 2165 2298 1966 29.1 10.2 0.7 n/a n/a 0.020
Albania 0.000 0.000 1923 1959 2069 1791 3.2 12.3 4.3 5094 n/a 0.995
Algeria 2019 2018 0.046 0.048 1993 2260 2488 1856 35.4 173.9 132.7 35226 n/a 0.985
Angola 2020+ 2020+ 0.034 0.022 2084 2128 2398 1677 19.0 83.4 10.6 2959 0.150 0.050
Argentina 2015 2017 0.086 0.051 1962 1947 2681 974 40.7 328.4 173.5 115197 0.950 0.950
Armenia 2019 0.056 0.000 1830 1789 1856 1723 3.1 11.9 4.4 5941 n/a 0.995
Australia 2014 2017 0.102 0.058 1914 2215 2570 1429 21.5 1015.2 372.0 251659 1.000 1.000
Austria 2012 2015 0.197 0.106 1389 1395 1476 1324 8.4 416.4 71.8 63505 1.000 1.000
Azerbaijan 2020+ 2019 0.020 0.050 1685 1695 1968 1482 8.9 46.3 35.1 23611 n/a 0.995
Bangladesh 2015 2018 0.086 0.047 1908 1907 2022 1820 164.4 79.0 41.6 24334 0.320 0.263
Belarus 2020 2020+ 0.067 0.061 1264 1269 1320 1229 9.6 60.3 68.8 31811 n/a 0.995
Belgium 2013 2016 0.194 0.103 1203 1243 1364 1200 10.7 497.6 107.2 85617 1.000 1.000
Belize 2013 2012 0.130 0.132 1807 1893 2094 1757 0.3 1.4 0.8 n/a n/a 0.870
Benin 2013 0.112 0.000 1895 2008 2135 1809 9.2 6.7 3.1 127 0.220 0.248
Bolivia 2017 2019 0.058 0.041 2037 1983 2690 1625 10.0 16.7 7.0 5293 0.640 0.651
Bosnia 0.000 0.000 1548 1696 2025 1447 3.8 18.5 27.4 13346 n/a 0.995
Botswana 2017 2020+ 0.056 0.027 2302 2315 2363 2237 2.0 13.0 4.8 1042 0.390 0.264
Brazil 2011 2013 0.162 0.104 1883 1881 2353 1545 195.4 1612.5 352.5 419337 0.970 0.946
Brunei Darussalam 2015 2015 0.087 0.072 1915 1915 1915 1915 0.4 11.5 5.9 3298 0.990 0.992
Bulgaria 2016 2018 0.086 0.061 1606 1607 1703 1569 7.5 49.9 48.1 45843 n/a 0.995
Burkina Faso 2010 2010 0.172 0.181 2164 2166 2352 2081 16.3 7.9 0.8 n/a 0.070 0.100
Burma (Myanmar) 2015 2014 0.088 0.088 1939 1917 2047 1625 50.5 n/a 10.0 6164 0.110 0.050
Burundi 2020+ 2012 0.029 0.131 1803 1803 1803 1803 8.5 1.2 0.2 n/a n/a 0.235
Cambodia 2011 2010 0.153 0.157 1937 1933 2006 1757 15.1 9.6 4.1 1235 0.200 0.183
Cameroon 2015 2013 0.087 0.099 1875 1889 2157 1580 20.0 23.4 3.6 3954 0.470 0.407
Canada 2018 2020 0.069 0.049 1554 1095 1702 1102 33.9 1400.1 544.7 612594 1.000 1.000
Central African
Republic 2012 2013 0.127 0.089 2031 2080 2237 1840 4.5 2.0 0.2 n/a n/a 0.235
Chad 2010 2010 0.188 0.145 2222 2366 2592 2107 11.5 8.4 0.4 n/a n/a 0.235
Chile 2012 2013 0.118 0.094 2124 1775 2769 916 17.1 169.5 60.1 57555 0.990 0.970
China 2018 2014 0.064 0.102 1631 1911 2615 1087 1354.7 4344.8 6105.7 2864204 0.990 0.990
China Central 2020 2015 0.061 0.103 1381 315.3
China East 2018 2014 0.066 0.099 1689 950.7
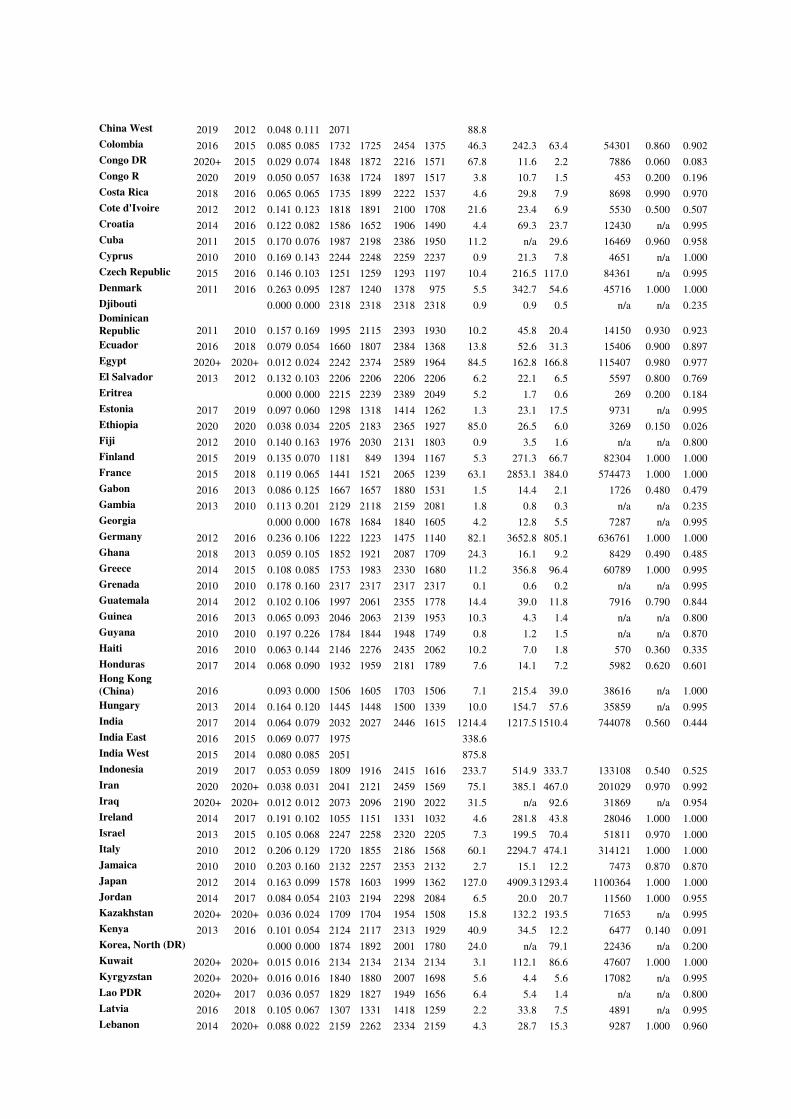
China West 2019 2012 0.048 0.111 2071 88.8
Colombia 2016 2015 0.085 0.085 1732 1725 2454 1375 46.3 242.3 63.4 54301 0.860 0.902
Congo DR 2020+ 2015 0.029 0.074 1848 1872 2216 1571 67.8 11.6 2.2 7886 0.060 0.083
Congo R 2020 2019 0.050 0.057 1638 1724 1897 1517 3.8 10.7 1.5 453 0.200 0.196
Costa Rica 2018 2016 0.065 0.065 1735 1899 2222 1537 4.6 29.8 7.9 8698 0.990 0.970
Cote d'Ivoire 2012 2012 0.141 0.123 1818 1891 2100 1708 21.6 23.4 6.9 5530 0.500 0.507
Croatia 2014 2016 0.122 0.082 1586 1652 1906 1490 4.4 69.3 23.7 12430 n/a 0.995
Cuba 2011 2015 0.170 0.076 1987 2198 2386 1950 11.2 n/a 29.6 16469 0.960 0.958
Cyprus 2010 2010 0.169 0.143 2244 2248 2259 2237 0.9 21.3 7.8 4651 n/a 1.000
Czech Republic 2015 2016 0.146 0.103 1251 1259 1293 1197 10.4 216.5 117.0 84361 n/a 0.995
Denmark 2011 2016 0.263 0.095 1287 1240 1378 975 5.5 342.7 54.6 45716 1.000 1.000
Djibouti 0.000 0.000 2318 2318 2318 2318 0.9 0.9 0.5 n/a n/a 0.235
Dominican
Republic 2011 2010 0.157 0.169 1995 2115 2393 1930 10.2 45.8 20.4 14150 0.930 0.923
Ecuador 2016 2018 0.079 0.054 1660 1807 2384 1368 13.8 52.6 31.3 15406 0.900 0.897
Egypt 2020+ 2020+ 0.012 0.024 2242 2374 2589 1964 84.5 162.8 166.8 115407 0.980 0.977
El Salvador 2013 2012 0.132 0.103 2206 2206 2206 2206 6.2 22.1 6.5 5597 0.800 0.769
Eritrea 0.000 0.000 2215 2239 2389 2049 5.2 1.7 0.6 269 0.200 0.184
Estonia 2017 2019 0.097 0.060 1298 1318 1414 1262 1.3 23.1 17.5 9731 n/a 0.995
Ethiopia 2020 2020 0.038 0.034 2205 2183 2365 1927 85.0 26.5 6.0 3269 0.150 0.026
Fiji 2012 2010 0.140 0.163 1976 2030 2131 1803 0.9 3.5 1.6 n/a n/a 0.800
Finland 2015 2019 0.135 0.070 1181 849 1394 1167 5.3 271.3 66.7 82304 1.000 1.000
France 2015 2018 0.119 0.065 1441 1521 2065 1239 63.1 2853.1 384.0 574473 1.000 1.000
Gabon 2016 2013 0.086 0.125 1667 1657 1880 1531 1.5 14.4 2.1 1726 0.480 0.479
Gambia 2013 2010 0.113 0.201 2129 2118 2159 2081 1.8 0.8 0.3 n/a n/a 0.235
Georgia 0.000 0.000 1678 1684 1840 1605 4.2 12.8 5.5 7287 n/a 0.995
Germany 2012 2016 0.236 0.106 1222 1223 1475 1140 82.1 3652.8 805.1 636761 1.000 1.000
Ghana 2018 2013 0.059 0.105 1852 1921 2087 1709 24.3 16.1 9.2 8429 0.490 0.485
Greece 2014 2015 0.108 0.085 1753 1983 2330 1680 11.2 356.8 96.4 60789 1.000 0.995
Grenada 2010 2010 0.178 0.160 2317 2317 2317 2317 0.1 0.6 0.2 n/a n/a 0.995
Guatemala 2014 2012 0.102 0.106 1997 2061 2355 1778 14.4 39.0 11.8 7916 0.790 0.844
Guinea 2016 2013 0.065 0.093 2046 2063 2139 1953 10.3 4.3 1.4 n/a n/a 0.800
Guyana 2010 2010 0.197 0.226 1784 1844 1948 1749 0.8 1.2 1.5 n/a n/a 0.870
Haiti 2016 2010 0.063 0.144 2146 2276 2435 2062 10.2 7.0 1.8 570 0.360 0.335
Honduras 2017 2014 0.068 0.090 1932 1959 2181 1789 7.6 14.1 7.2 5982 0.620 0.601
Hong Kong
(China) 2016 0.093 0.000 1506 1605 1703 1506 7.1 215.4 39.0 38616 n/a 1.000
Hungary 2013 2014 0.164 0.120 1445 1448 1500 1339 10.0 154.7 57.6 35859 n/a 0.995
India 2017 2014 0.064 0.079 2032 2027 2446 1615 1214.4 1217.5 1510.4 744078 0.560 0.444
India East 2016 2015 0.069 0.077 1975 338.6
India West 2015 2014 0.080 0.085 2051 875.8
Indonesia 2019 2017 0.053 0.059 1809 1916 2415 1616 233.7 514.9 333.7 133108 0.540 0.525
Iran 2020 2020+ 0.038 0.031 2041 2121 2459 1569 75.1 385.1 467.0 201029 0.970 0.992
Iraq 2020+ 2020+ 0.012 0.012 2073 2096 2190 2022 31.5 n/a 92.6 31869 n/a 0.954
Ireland 2014 2017 0.191 0.102 1055 1151 1331 1032 4.6 281.8 43.8 28046 1.000 1.000
Israel 2013 2015 0.105 0.068 2247 2258 2320 2205 7.3 199.5 70.4 51811 0.970 1.000
Italy 2010 2012 0.206 0.129 1720 1855 2186 1568 60.1 2294.7 474.1 314121 1.000 1.000
Jamaica 2010 2010 0.203 0.160 2132 2257 2353 2132 2.7 15.1 12.2 7473 0.870 0.870
Japan 2012 2014 0.163 0.099 1578 1603 1999 1362 127.0 4909.3 1293.4 1100364 1.000 1.000
Jordan 2014 2017 0.084 0.054 2103 2194 2298 2084 6.5 20.0 20.7 11560 1.000 0.955
Kazakhstan 2020+ 2020+ 0.036 0.024 1709 1704 1954 1508 15.8 132.2 193.5 71653 n/a 0.995
Kenya 2013 2016 0.101 0.054 2124 2117 2313 1929 40.9 34.5 12.2 6477 0.140 0.091
Korea, North (DR) 0.000 0.000 1874 1892 2001 1780 24.0 n/a 79.1 22436 n/a 0.200
Kuwait 2020+ 2020+ 0.015 0.016 2134 2134 2134 2134 3.1 112.1 86.6 47607 1.000 1.000
Kyrgyzstan 2020+ 2020+ 0.016 0.016 1840 1880 2007 1698 5.6 4.4 5.6 17082 n/a 0.995
Lao PDR 2020+ 2017 0.036 0.057 1829 1827 1949 1656 6.4 5.4 1.4 n/a n/a 0.800
Latvia 2016 2018 0.105 0.067 1307 1331 1418 1259 2.2 33.8 7.5 4891 n/a 0.995
Lebanon 2014 2020+ 0.088 0.022 2159 2262 2334 2159 4.3 28.7 15.3 9287 1.000 0.960
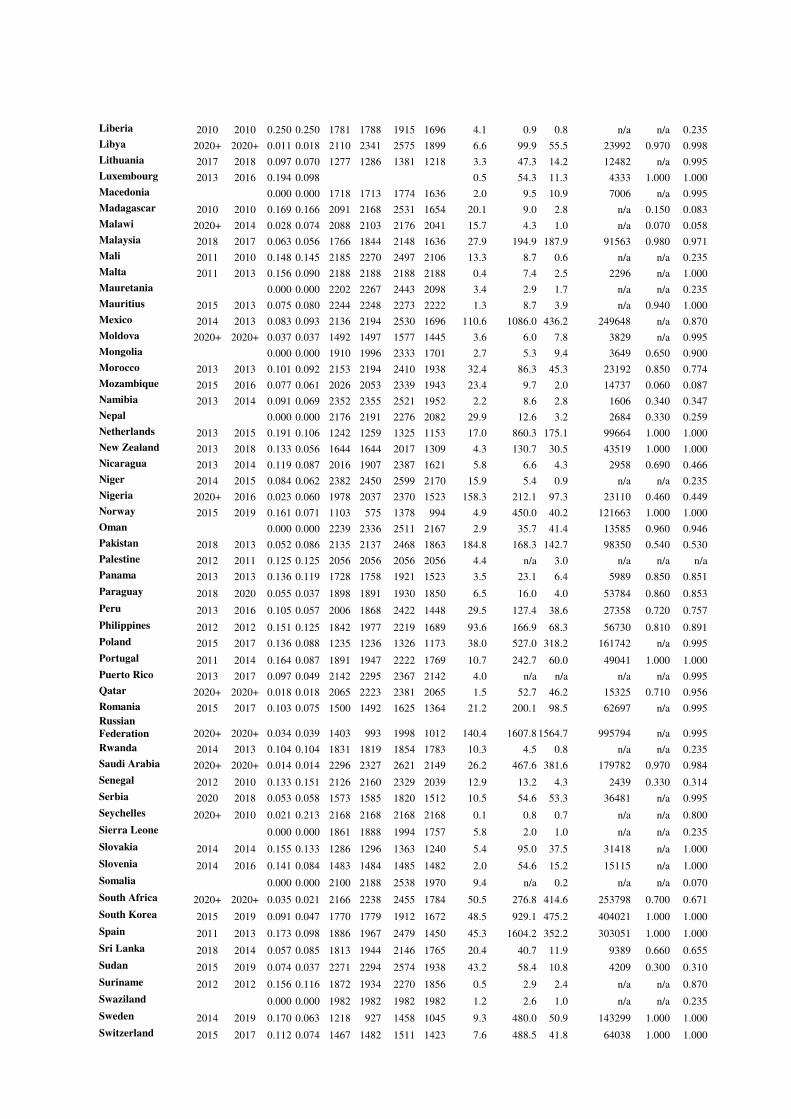
Liberia 2010 2010 0.250 0.250 1781 1788 1915 1696 4.1 0.9 0.8 n/a n/a 0.235
Libya 2020+ 2020+ 0.011 0.018 2110 2341 2575 1899 6.6 99.9 55.5 23992 0.970 0.998
Lithuania 2017 2018 0.097 0.070 1277 1286 1381 1218 3.3 47.3 14.2 12482 n/a 0.995
Luxembourg 2013 2016 0.194 0.098 0.5 54.3 11.3 4333 1.000 1.000
Macedonia 0.000 0.000 1718 1713 1774 1636 2.0 9.5 10.9 7006 n/a 0.995
Madagascar 2010 2010 0.169 0.166 2091 2168 2531 1654 20.1 9.0 2.8 n/a 0.150 0.083
Malawi 2020+ 2014 0.028 0.074 2088 2103 2176 2041 15.7 4.3 1.0 n/a 0.070 0.058
Malaysia 2018 2017 0.063 0.056 1766 1844 2148 1636 27.9 194.9 187.9 91563 0.980 0.971
Mali 2011 2010 0.148 0.145 2185 2270 2497 2106 13.3 8.7 0.6 n/a n/a 0.235
Malta 2011 2013 0.156 0.090 2188 2188 2188 2188 0.4 7.4 2.5 2296 n/a 1.000
Mauretania 0.000 0.000 2202 2267 2443 2098 3.4 2.9 1.7 n/a n/a 0.235
Mauritius 2015 2013 0.075 0.080 2244 2248 2273 2222 1.3 8.7 3.9 n/a 0.940 1.000
Mexico 2014 2013 0.083 0.093 2136 2194 2530 1696 110.6 1086.0 436.2 249648 n/a 0.870
Moldova 2020+ 2020+ 0.037 0.037 1492 1497 1577 1445 3.6 6.0 7.8 3829 n/a 0.995
Mongolia 0.000 0.000 1910 1996 2333 1701 2.7 5.3 9.4 3649 0.650 0.900
Morocco 2013 2013 0.101 0.092 2153 2194 2410 1938 32.4 86.3 45.3 23192 0.850 0.774
Mozambique 2015 2016 0.077 0.061 2026 2053 2339 1943 23.4 9.7 2.0 14737 0.060 0.087
Namibia 2013 2014 0.091 0.069 2352 2355 2521 1952 2.2 8.6 2.8 1606 0.340 0.347
Nepal 0.000 0.000 2176 2191 2276 2082 29.9 12.6 3.2 2684 0.330 0.259
Netherlands 2013 2015 0.191 0.106 1242 1259 1325 1153 17.0 860.3 175.1 99664 1.000 1.000
New Zealand 2013 2018 0.133 0.056 1644 1644 2017 1309 4.3 130.7 30.5 43519 1.000 1.000
Nicaragua 2013 2014 0.119 0.087 2016 1907 2387 1621 5.8 6.6 4.3 2958 0.690 0.466
Niger 2014 2015 0.084 0.062 2382 2450 2599 2170 15.9 5.4 0.9 n/a n/a 0.235
Nigeria 2020+ 2016 0.023 0.060 1978 2037 2370 1523 158.3 212.1 97.3 23110 0.460 0.449
Norway 2015 2019 0.161 0.071 1103 575 1378 994 4.9 450.0 40.2 121663 1.000 1.000
Oman 0.000 0.000 2239 2336 2511 2167 2.9 35.7 41.4 13585 0.960 0.946
Pakistan 2018 2013 0.052 0.086 2135 2137 2468 1863 184.8 168.3 142.7 98350 0.540 0.530
Palestine 2012 2011 0.125 0.125 2056 2056 2056 2056 4.4 n/a 3.0 n/a n/a n/a
Panama 2013 2013 0.136 0.119 1728 1758 1921 1523 3.5 23.1 6.4 5989 0.850 0.851
Paraguay 2018 2020 0.055 0.037 1898 1891 1930 1850 6.5 16.0 4.0 53784 0.860 0.853
Peru 2013 2016 0.105 0.057 2006 1868 2422 1448 29.5 127.4 38.6 27358 0.720 0.757
Philippines 2012 2012 0.151 0.125 1842 1977 2219 1689 93.6 166.9 68.3 56730 0.810 0.891
Poland 2015 2017 0.136 0.088 1235 1236 1326 1173 38.0 527.0 318.2 161742 n/a 0.995
Portugal 2011 2014 0.164 0.087 1891 1947 2222 1769 10.7 242.7 60.0 49041 1.000 1.000
Puerto Rico 2013 2017 0.097 0.049 2142 2295 2367 2142 4.0 n/a n/a n/a n/a 0.995
Qatar 2020+ 2020+ 0.018 0.018 2065 2223 2381 2065 1.5 52.7 46.2 15325 0.710 0.956
Romania 2015 2017 0.103 0.075 1500 1492 1625 1364 21.2 200.1 98.5 62697 n/a 0.995
Russian
Federation 2020+ 2020+ 0.034 0.039 1403 993 1998 1012 140.4 1607.8 1564.7 995794 n/a 0.995
Rwanda 2014 2013 0.104 0.104 1831 1819 1854 1783 10.3 4.5 0.8 n/a n/a 0.235
Saudi Arabia 2020+ 2020+ 0.014 0.014 2296 2327 2621 2149 26.2 467.6 381.6 179782 0.970 0.984
Senegal 2012 2010 0.133 0.151 2126 2160 2329 2039 12.9 13.2 4.3 2439 0.330 0.314
Serbia 2020 2018 0.053 0.058 1573 1585 1820 1512 10.5 54.6 53.3 36481 n/a 0.995
Seychelles 2020+ 2010 0.021 0.213 2168 2168 2168 2168 0.1 0.8 0.7 n/a n/a 0.800
Sierra Leone 0.000 0.000 1861 1888 1994 1757 5.8 2.0 1.0 n/a n/a 0.235
Slovakia 2014 2014 0.155 0.133 1286 1296 1363 1240 5.4 95.0 37.5 31418 n/a 1.000
Slovenia 2014 2016 0.141 0.084 1483 1484 1485 1482 2.0 54.6 15.2 15115 n/a 1.000
Somalia 0.000 0.000 2100 2188 2538 1970 9.4 n/a 0.2 n/a n/a 0.070
South Africa 2020+ 2020+ 0.035 0.021 2166 2238 2455 1784 50.5 276.8 414.6 253798 0.700 0.671
South Korea 2015 2019 0.091 0.047 1770 1779 1912 1672 48.5 929.1 475.2 404021 1.000 1.000
Spain 2011 2013 0.173 0.098 1886 1967 2479 1450 45.3 1604.2 352.2 303051 1.000 1.000
Sri Lanka 2018 2014 0.057 0.085 1813 1944 2146 1765 20.4 40.7 11.9 9389 0.660 0.655
Sudan 2015 2019 0.074 0.037 2271 2294 2574 1938 43.2 58.4 10.8 4209 0.300 0.310
Suriname 2012 2012 0.156 0.116 1872 1934 2270 1856 0.5 2.9 2.4 n/a n/a 0.870
Swaziland 0.000 0.000 1982 1982 1982 1982 1.2 2.6 1.0 n/a n/a 0.235
Sweden 2014 2019 0.170 0.063 1218 927 1458 1045 9.3 480.0 50.9 143299 1.000 1.000
Switzerland 2015 2017 0.112 0.074 1467 1482 1511 1423 7.6 488.5 41.8 64038 1.000 1.000
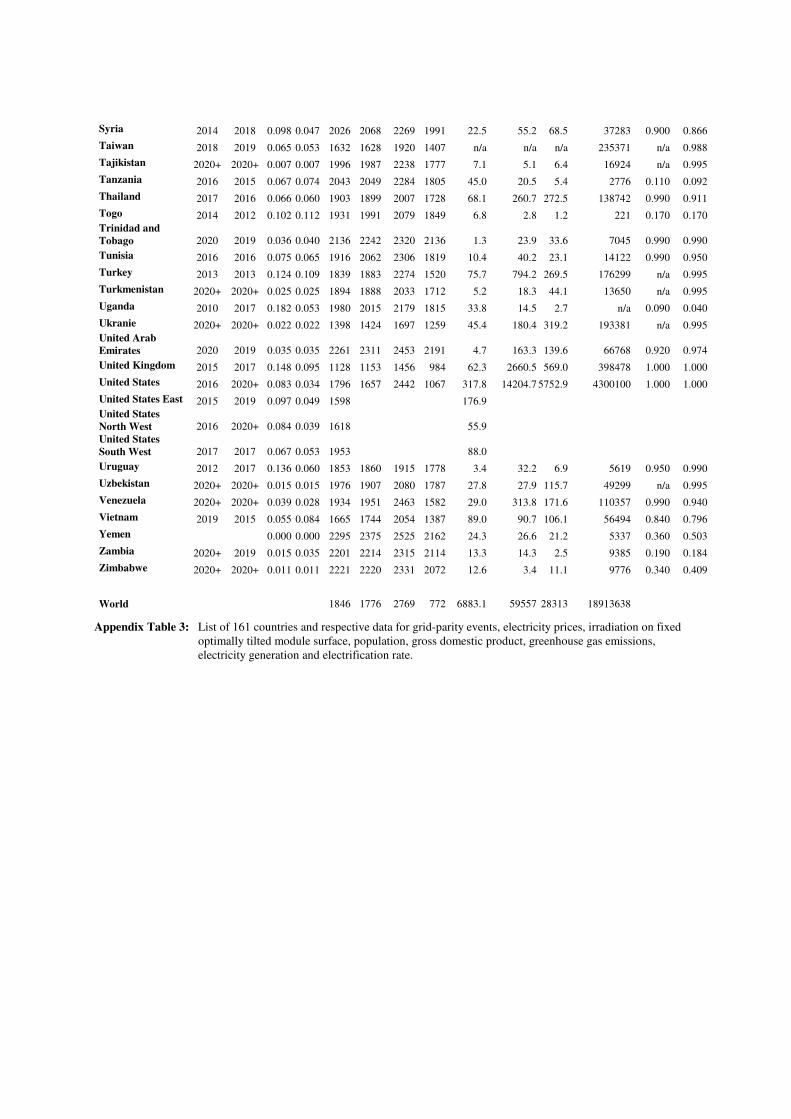
Syria 2014 2018 0.098 0.047 2026 2068 2269 1991 22.5 55.2 68.5 37283 0.900 0.866
Taiwan 2018 2019 0.065 0.053 1632 1628 1920 1407 n/a n/a n/a 235371 n/a 0.988
Tajikistan 2020+ 2020+ 0.007 0.007 1996 1987 2238 1777 7.1 5.1 6.4 16924 n/a 0.995
Tanzania 2016 2015 0.067 0.074 2043 2049 2284 1805 45.0 20.5 5.4 2776 0.110 0.092
Thailand 2017 2016 0.066 0.060 1903 1899 2007 1728 68.1 260.7 272.5 138742 0.990 0.911
Togo 2014 2012 0.102 0.112 1931 1991 2079 1849 6.8 2.8 1.2 221 0.170 0.170
Trinidad and
Tobago 2020 2019 0.036 0.040 2136 2242 2320 2136 1.3 23.9 33.6 7045 0.990 0.990
Tunisia 2016 2016 0.075 0.065 1916 2062 2306 1819 10.4 40.2 23.1 14122 0.990 0.950
Turkey 2013 2013 0.124 0.109 1839 1883 2274 1520 75.7 794.2 269.5 176299 n/a 0.995
Turkmenistan 2020+ 2020+ 0.025 0.025 1894 1888 2033 1712 5.2 18.3 44.1 13650 n/a 0.995
Uganda 2010 2017 0.182 0.053 1980 2015 2179 1815 33.8 14.5 2.7 n/a 0.090 0.040
Ukranie 2020+ 2020+ 0.022 0.022 1398 1424 1697 1259 45.4 180.4 319.2 193381 n/a 0.995
United Arab
Emirates 2020 2019 0.035 0.035 2261 2311 2453 2191 4.7 163.3 139.6 66768 0.920 0.974
United Kingdom 2015 2017 0.148 0.095 1128 1153 1456 984 62.3 2660.5 569.0 398478 1.000 1.000
United States 2016 2020+ 0.083 0.034 1796 1657 2442 1067 317.8 14204.7 5752.9 4300100 1.000 1.000
United States East 2015 2019 0.097 0.049 1598 176.9
United States
North West 2016 2020+ 0.084 0.039 1618 55.9
United States
South West 2017 2017 0.067 0.053 1953 88.0
Uruguay 2012 2017 0.136 0.060 1853 1860 1915 1778 3.4 32.2 6.9 5619 0.950 0.990
Uzbekistan 2020+ 2020+ 0.015 0.015 1976 1907 2080 1787 27.8 27.9 115.7 49299 n/a 0.995
Venezuela 2020+ 2020+ 0.039 0.028 1934 1951 2463 1582 29.0 313.8 171.6 110357 0.990 0.940
Vietnam 2019 2015 0.055 0.084 1665 1744 2054 1387 89.0 90.7 106.1 56494 0.840 0.796
Yemen 0.000 0.000 2295 2375 2525 2162 24.3 26.6 21.2 5337 0.360 0.503
Zambia 2020+ 2019 0.015 0.035 2201 2214 2315 2114 13.3 14.3 2.5 9385 0.190 0.184
Zimbabwe 2020+ 2020+ 0.011 0.011 2221 2220 2331 2072 12.6 3.4 11.1 9776 0.340 0.409
World 1846 1776 2769 772 6883.1 59557 28313 18913638
Appendix Table 3: List of 161 countries and respective data for grid-parity events, electricity prices, irradiation on fixed
optimally tilted module surface, population, gross domestic product, greenhouse gas emissions,
electricity generation and electrification rate.