Embed Size (px)
Citation preview

03.05.2011 | www.gtai.com 1
©Chri
s S
chm
idt
- is
tockphoto
PV Germany:
New Investment Opportunities with Grid Parity
Tobias Homann
Taipei, May 2011

03.05.2011 | www.gtai.com 2
Executive Summary
Germany is the world‟s leading PV market with 17.2 GWp of cumulated
PV Power and 7.4 GWp of newly installations in 2010. It will remain the
largest market for the next years.
Customers in largest segment favor “Made in Germany” quality.
The German PV cluster has a unique concentration of manufacturers,
suppliers, project developers and R&D institutes. It offers easy access
to know-how and existing infrastructure.
Experience of engineering companies and local authorities enables fast
realization of manufacturing projects.
Significant investment opportunities exist at all stages of the value
chain and in all technologies.
GTAI supports you to become part of the world‟s leading PV cluster.

03.05.2011 | www.gtai.com 3
I. Germany Trade & Invest
II. The German PV Policy & Market
III. The German PV Industry
IV. Advantages of Germany as an Investment Location
03.05.2011 | www.gtai.com 4
www.gtai.com
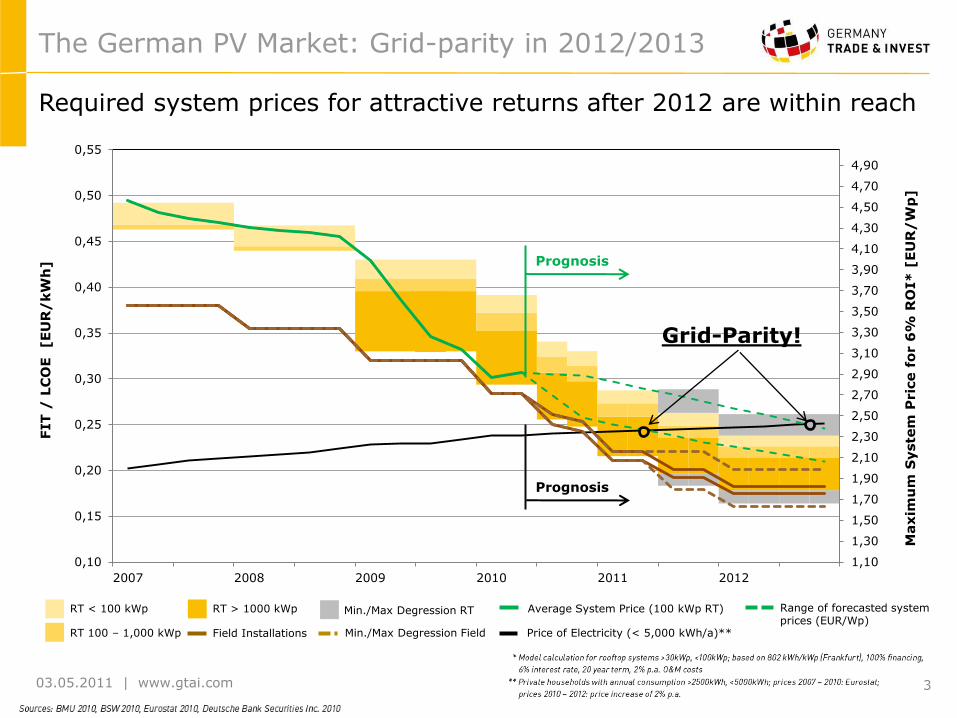
Germany Trade & Invest is the foreign trade and inward investment promotion agency of the Federal Republic of Germany.
The agency is promoted by the Federal Ministry of Economics and Technology and the Federal Government Commissioner for the New Federal States in accordance with a German Parliament resolution.
Germany Trade & Invest
Germany Trade & Invest acts as an one-stop agency for international investors covering the entire investment decision process:
Preparation and
coordination of site visits
Cost factor assessment
Finance & incentives
consulting
Information on tax & legal
issues
Link to business partners,
local authorities, and
service providers
Facilitation of administrative
permits
Support in negotiating with
cooperation partners
PR support
Recruitment assistance
Implementation Decision Strategy
Identification of business
opportunities
Competitor profiling
Determination of project-
specific location factors
Macro location analysis

03.05.2011 | www.gtai.com 5
Example: Milestones of a PV manufacturing project
European location analysis (long list)
Detailed site evaluation
Initial site visits
Re-evaluation of site analysis
(short list)
In-depth site visit (LOIs)
Incentive comparison
Detailed incentives
assessment
Incentive calculation
Approval of incentives
Incentives application
Negotiation of incentives
(LOI)
Meeting with financing partners
Negotiation of Conditions
(Term Sheet)
Building and Environmental
permit
Discussion about
infrastructure upgrades
Detailed site matrix
(plot analysis)
Meeting with engineering companies
Start of construction
Utility prices and reliability comparison
LOIs for utility supply
Discussion of utility
requirements
Site Decision. MoU
Advice on financial structure
Financial agreement
Site Selection
Incentives
Financing
Utilities
Engineering
Months (est.): 0 2 4 6 8 T
The Role of Germany Trade & Invest
Germany Trade & Invest closely supports the project team throughout
the investment decision making process

03.05.2011 | www.gtai.com 6
The Role of Germany Trade & Invest – Success Stories
*) As planned by company 1) Current number of employees 2) GTAI support: from start of project to construction
Germany Trade & Invest has successfully supported some of the most
renowned PV companies in their location decisions
Size and Type of Facility*
Invest-ment
Volume*
446 MWp Module Factory (CdTe)
€ 275 Mil.
100 MWp Integrated
Factory (Ribbon-
Si)
€ 180 Mil.
500 MWp Module Factory (CIGS)
€ 25 Mil.
120 MWp Module Factory (CIS)
€ 210 Mil.
120 MWp Module Factory
(a-Si/µc-Si)
€ 95 Mil.
80 MWp Cell
Factory (c-Si)
€ 50 Mil.
180 MWp Module Factory (a-Si/a-
Si)
€ 140 Mil.
Job creation1 650 1200 50 200 240 160 170
Time-frame2
June 2005 –
June 2006
Sept 2004 –
July 2005
July 2005 –
Mar 2007
Jan 2006 –
May 2007
July 2006 –
June 2007
July 2006 –
Aug 2007
Oct 2007 –
Aug 2008
Country of Origin
USA Norway
USA USA France Norway Canada UAE
120 MWp Module Factory
(a-Si/µc-Si)
€ 95 Mil.
80 MWp Cell
Factory (c-Si)
€ 50 Mil.
180 MWp Module Factory (a-Si/a-
Si)
€ 140 Mil.
240 160 170
July 2006 –
June 2007
July 2006 –
Aug 2007
Oct 2007 –
Aug 2008
Norway Canada UAE Norway
PV Glass Processing
Factory
€ 24 Mil.
65*
Nov 2007 –
Oct 2009
Norway
PV Glass Processing
Factory
€ 24 Mil.
65*
Nov 2007 –
Oct 2009
Norway
100 MWp Cell
Factory (c-Si)
€ 42 Mil.
160*
Dec 2008 –
Feb 2010
Norway
100 MWp Cell
Factory (c-Si)
€ 42 Mil.
160*
Dec 2008 –
Feb 2010

03.05.2011 | www.gtai.com 7
I. Germany Trade & Invest
II. The German PV Policy & Market
III. The German PV Industry
IV. Advantages of Germany as an Investment Location

03.05.2011 | www.gtai.com 8
The German PV Market
Germany is the world‟s leading PV market
Turnover (incl. exports) € 12.22 bn
Number of jobs 107,800
German PV Market 20102
German PV Industry 20103
New PV Installations 2010 in MWp1
Sources: 1) Solarbuzz estimates March 2011 2) Preliminary numbers by Federal Network Agency March 2011 3) ZSW estimates March 2011
Total 18.2 GWp
Newly installed PV power 7.4 GWp
Investments in new installations3 € 19.5 bn
Total installed PV power 17.2 GWp
Germany
7,644 (42%)
Italy
3,822
Other
Europe 3,276
USA
910
Japan
910
Rest of
World 1,638

03.05.2011 | www.gtai.com 9
Source: Federal Network Agency 2011
Installations in January 2011 grew 20% compared to January 2010
Installed PV capacity by month [in MWp]
The German PV Market: Comparison by Month
3 16 55 115 150
206 307 291
327 378
497
1,461
222 163
331
454
573
2,109
663
363
654
341 360
1,174
266
0
500
1.000
1.500
2.000
2.5002009: 3.8 GWp
2010: 7.4 GWp
2011

03.05.2011 | www.gtai.com 10
3,845
6,900 5,500
4,300 4,515 4,650
0
2.000
4.000
6.000
8.000
10.000
12.000
14.000
2009 2010e 2011e 2012e 2013e 2014e
Germany Italy France
Spain Greece Rest of Europe
Source: Bank Sarasin, Nov. 2010
The German PV Market
Annual PV installations [MWp] in Germany will exceed those in other
main markets for years to come:
USA Asia Europe
5,720
10,620
9,833 9,525
10,951
12,374
Latest forecasts for annual installations in Germany in 2011:
10.5 GWp (Photon Consulting, Feb. 2011) 8.2 GWp (Solarbuzz, Feb. 2011) 7.2 GWp (HIS iSupply, March 2011) 7 GWp (Bloomberg NEF, Feb. 2011)
0
1.000
2.000
3.000
4.000
5.000
6.000
7.000
8.000
2009 2011e 2013e
China Japan India Rest of Asia
0
1.000
2.000
3.000
4.000
5.000
6.000
7.000
8.000
9.000
2009 2011e 2013e
7 GWp (EuPD, Feb. 2011) 5.8 GWp (Deutsche Bank, Feb. 2011) 5-6 GWp (Jefferies & Company, Jan. 2011) 4.5 GWp (Barclays Capital, Feb. 2011)

03.05.2011 | www.gtai.com 11
Fixed feed-in tariff for 20 years
Tariff level depends on the type of electricity generation, the first year of plant operation, and the plant‟s capacity.
Electricity grid operators are obligated to make it a priority to purchase and transmit electricity from renewable energy sources.
The cost benefits are apportioned to all grid system operators across the country and passed on by them to electricity customers
No market cap
FiT degression enforces yearly price reductions
Very unbureaucratic initiating process
Transparent (public register) and reliant
The Renewable Energy Sources Act (EEG)
Source: BMU 2010
EEG has proven to be highly efficient:
High installation volume as adequate ROI ensured
Drives down costs as tariffs lowered
… copied by 52 countries worldwide
EEG: the major market driver, since year 2000
03.05.2011 | www.gtai.com 12
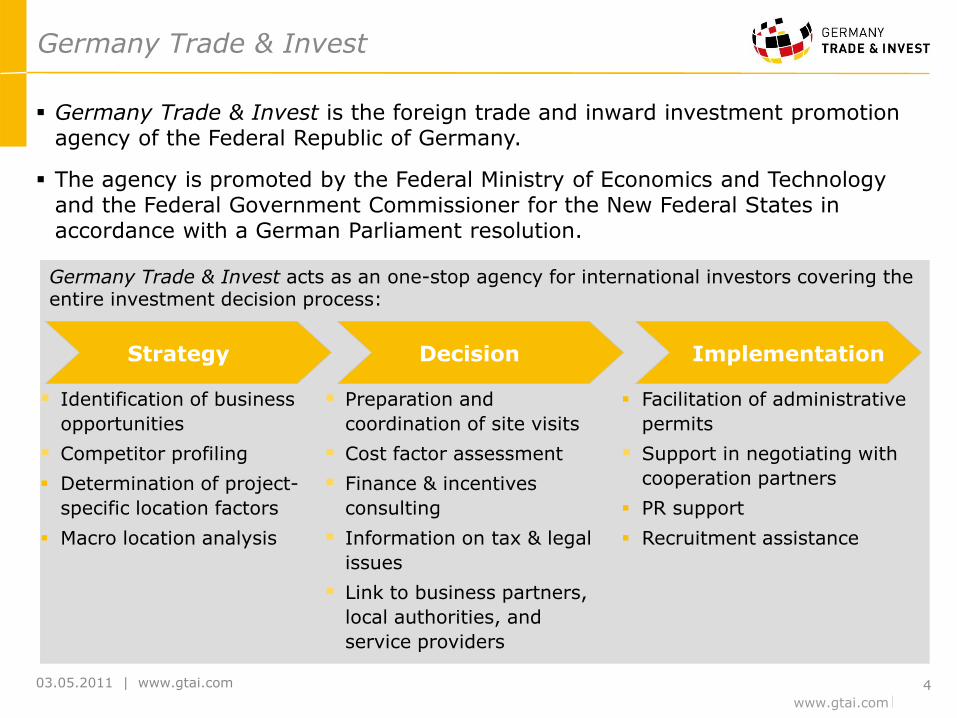
Rooftop installations
Field installations
On conversion area2
On other area
On cropland
System size ≤ 30 kW 30 –
100 kW 100 –
1,000 kW ≥ 1,000 kW All sizes All sizes All sizes
Degression rate
January 1st 2011 13% No feed-in tariff anymore
from July 1st 2010
July/Sept.3 1st 2011 0% or 3% or 6% or 9% or 12% or 15% *
January 1st 2012 9% +/- X% **
Feed-in tariff 4
(€ct/kWh)
2010 from Oct. 33.03 31.42 29.73 24.79 25.37 24.26 -
2011
from Jan. 28.74 27.33 25.86 21.56 22.07 21.11 -
from July/Sept.3
24.43 - 28.74 23.23 - 27.33 21.98 - 25.86 18.33 - 21.56 18.76 - 22.073 17.94 - 21.113 -
2012 from Jan. 21.84 - 26.15 20.77 - 24.87 19.66 - 23.54 16.39 - 19.62 16.77 - 20.08 16.04 - 19.21 -
Notes: 1) Decided by German parliament February 2011; to be revised again at end of 2011; EEG = Renewable Energy Sources Act; 2) Fallow land with ecological impact from former military, commercial, public or traffic use or area within 110m from autobahn or railroad 3) Field installation‟s tariffs are reduced at Sept. 1st 2011 4) The tariff of the year of installation is paid for 20 years. Source: German parliament resolution from July 2010; Tariffs of July 2011 and January 2012 according to parliament resolution from July 2010
EEG amendment1 July 2011
German PV Feed-in Tariff
Degression rate adjustment * At July/September3 1st 2011 following degression rate depending on volume of newly installed PV capacity based on early 2011 projection (March - May multiplied by 4): ** At January 1st 2012 degression rate of 9% and if difference between volumes of Oct. 2010 - Sept. 2011 and of early 2011 projection an adjustment of X% to balance following percentage points:
< 3,500 MWp: 0%
> 3,500 MWp: 3%
> 4,500 MWp: 6%
> 5,500 MWp: 9%
> 6,500 MWp: 12%
> 7,500 MWp: 15%
“Own-Consumption-Bonus” A bonus for the electricity generated for own consumption for rooftop systems ≤ 500kWp:
0-30% of generated electricity: FIT minus 16.38 €ct/kWh
30-100% of generated electricity: FIT minus 12.00 €ct/kWh
03.05.2011 | www.gtai.com 13
1,10
1,30
1,50
1,70
1,90
2,10
2,30
2,50
2,70
2,90
3,10
3,30
3,50
3,70
3,90
4,10
4,30
4,50
4,70
4,90
0,10
0,15
0,20
0,25
0,30
0,35
0,40
0,45
0,50
0,55
2007 2008 2009 2010 2011 2012
Maxim
um
Syste
m P
ric
e f
or 6
% R
OI*
[EU
R/
Wp
]
FIT
/ L
CO
E
[EU
R/
kW
h] Prognosis
Prognosis
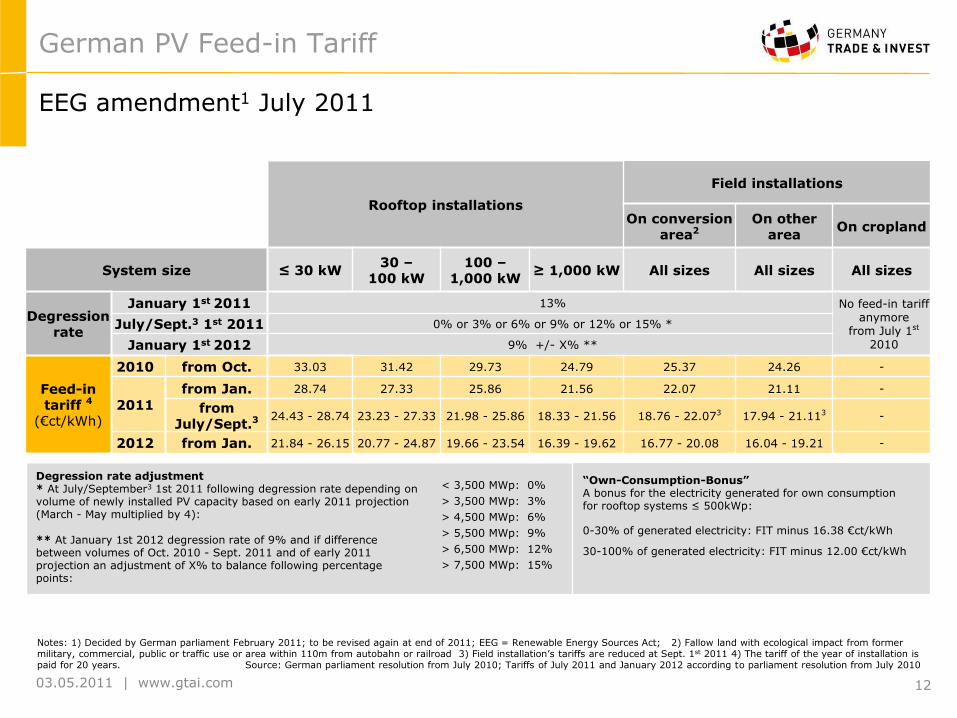
Average System Price (100 kWp RT) RT < 100 kWp
RT 100 – 1,000 kWp
RT > 1000 kWp Min./Max Degression RT
Field Installations Min./Max Degression Field Price of Electricity (< 5,000 kWh/a)**
Grid-Parity!
Required system prices for attractive returns after 2012 are within reach
The German PV Market: Grid-parity in 2012/2013
Range of forecasted system prices (EUR/Wp)

03.05.2011 | www.gtai.com 14
The Principle of the „Own-Consumption Bonus“
Wattage
Time of day
0h 3h 6h 9h 12h 15h 18h 21h 24h
Feed-in tariff: 28.74 to 26.24 €ct/kWh1
„Own-Consumption-Bonus“: 15.43 to 9.86 €ct/kWh2
PLUS cost savings
Energy from grid: Costs ~ 22 €ct/kWh3
Funding through feed-in tariff system AND cost savings on grid energy:
Rooftop systems ≤ 500kWp may generate income of > 37 €ct/kWh in 2011
500 kWp max. PV Energy
Energy Demand
„Inhouse“ consumption of PV Energy
Notes: 1) Depending on size of system according to feed-in tariff classification (example based on FIT before July 2011) | 2) Applicable for rooftop systems ≤ 500kWp only | 3) Depending on electricity retail price of respective utility company. Source: German parliament resolution from July 2010
03.05.2011 | www.gtai.com 14

03.05.2011 | www.gtai.com 15
Installed capacity in 2010
Source: Federal Network Agency 2011; Images: Solarwatt, BP, Geosol Note: Figures do not sum to 100%, because of rounding
Systems up to 30kWp are dominating the market, with systems below
10kWp accounting for 43% of the total number of installations
The German PV Market: Installations per Segment
Up to 30kWp 30 - 100kWp 100kWp – 1MWp Over 1MWp
Number of PV systems installed in 2010
TOTAL: 7.4 GWp
35%
23%
23%
19%
84% 13%
3%
0.2%
TOTAL: 249,845
installations
0
5.000
10.000
15.000
20.000
25.000
< 1
kW
p
1 k
Wp
2 k
Wp
3 k
Wp
4 k
Wp
5 k
Wp
6 k
Wp
7 k
Wp
8 k
Wp
9 k
Wp
10 k
Wp
11 k
Wp
12 k
Wp
13 k
Wp
14 k
Wp
15 k
Wp
16 k
Wp
17 k
Wp
18 k
Wp
19 k
Wp
20 k
Wp
21 k
Wp
22 k
Wp
23 k
Wp
24 k
Wp
25 k
Wp
26 k
Wp
27 k
Wp
28 k
Wp
29 k
Wp
30 k
Wp

03.05.2011 | www.gtai.com 16
17.6%
23.8%
50.2%
31.2%
45.1%
37.7%
33.3%
19.4%
7.7%
17.9%
11.7%
Premium Medium class low price No product class assignable
The German PV Market: Customer Preference
Buying decision - Premium modules favored
Source: 1) Sonne Wind & Wärme 1/2011: survey among 25 PV wholesalers, 2010 forecasted; 2) EuPD Research 2009: survey among 202 system owners
36.0%
31.8%
32.2%
30.9%
23.8%
27.8%
8.0%
9.5%
2010
2009
Private Commercial Farmers Others
4.4% Private users
Commercial customers
Farmers
Largest segment: Private users1
Private users favor premium modules²

03.05.2011 | www.gtai.com 17
The German PV Market: Further Characteristics
Image: Sharp
Image: BP
Image: ‚Geosol Image: ‚Geosol
Regional distribution of newly installed
capacity 20101
The German PV market is far from saturation
Others <1%
Sources: 1) Federal Network Agency 2011; 2) IEA 2004; 3) BSW 2011
Market size: Over 201,000 ha of PV-
suitable residential rooftops2
Market growth potential: A potential
rooftop PV capacity of at least 120 GWp.
Experience: More than 860,000 PV
systems have already been installed.3
A mature sales structure: Highly
experienced system integrators and
project developers facilitate easy market
entry and enable rapid market growth for
module manufacturers. Bavaria 33% Baden-
Württemberg 13%
Rheinland-Pfalz 5%
Hessen 5%
Thuringia 2%
Saxony 3%
Saxony-Anhalt 4% North Rhine-
Westphalia 12%
Niedersachsen 11%
Schleswig- Holstein
5% Mecklenburg- Vorpommern
2% Hamburg
Berlin
Brandenburg 5%
Saarland
Bremen

03.05.2011 | www.gtai.com 18
FiTs of major European PV markets
The European Feed-in Tariffs 2011
Sources: BMU 2011 and countries„ respective energy acts 2010/2011 Feed-in tariffs subject to change; *Exchange rate (USD-Euro) from 19.01.2011
UK • Tariff between €0.33 and €0.47/kWh
depending on type and size • Contract duration: 25 years
Belgium: System of green certificates Tariffs vary according to region Min. €0.15/kWh: e.g. Flanders:
€0.45/kWh (contract duration 20 years)
France: Tariffs: €0.58/kWh (rooftop ≤3kWp),
€0.37-0.51/kWh (rooftop >3kWp depending on type of building), €0.276-0.352/kWh (ground-mounted >250kWp), depending on location
Special support in overseas departments Contract duration: 20 years
Portugal Tariff between €0.35 and €0.55/kWh
depending on size/type Contract duration: 15 years or
21GWh/MW Cap: 150MWp (ground-mounted) and
50MW (BIPV)
Spain Tariffs: €0.298/kWh (rooftop ≤20kWp),
€0.209/kWh (rooftop >20kWp), €0.138/kWh (ground-mounted)
Power plant limit size: Rooftop 2MWp; ground-mounted 10MWp
Contract duration: 25 years Cap: 481 MWp (2010); 2011 cap tba
Czech Republic: Tariffs: €0.305/kWh (<30kWp),
€0.236/kWh (30-100kWp), €0.22/kWh (>100kWp)
Solar tax: 26-28% (2011-2013) Contract duration: 20 years Italy Tariff between €0.346 and €0.47/kWh
depending on size/type 2% degression rate per year Contract duration: 20 years Cap :1,200MWp Bulgaria: Tariff s: €0.41/kWh (≤5kW),
€0.37/kWh (>5kW) Contract duration: 25 years Greece: Tariff of €0.55/kWh (rooftop ≤10 kWp) Degression of 5% p.a. 2012-2019 Tariff of €0.37-0.47/kWh depending on
size and location Contract duration: 20 years, linked to
inflation
Turkey* Tariff of €0.01/kWh for 10 years Bonus between €0.02-0.18/kWh for
locally produced components Cap: 600MWp until end of 2013
Germany: Tariff between €0.21 and €0.28/kWh
depending on type/size Quick application process Contract duration: 20 years No cap
03.05.2011 | www.gtai.com 19
I. Germany Trade & Invest
II. The German PV Policy & Market
III. The German PV Industry
IV. Advantages of Germany as an Investment Location
03.05.2011 | www.gtai.com 20
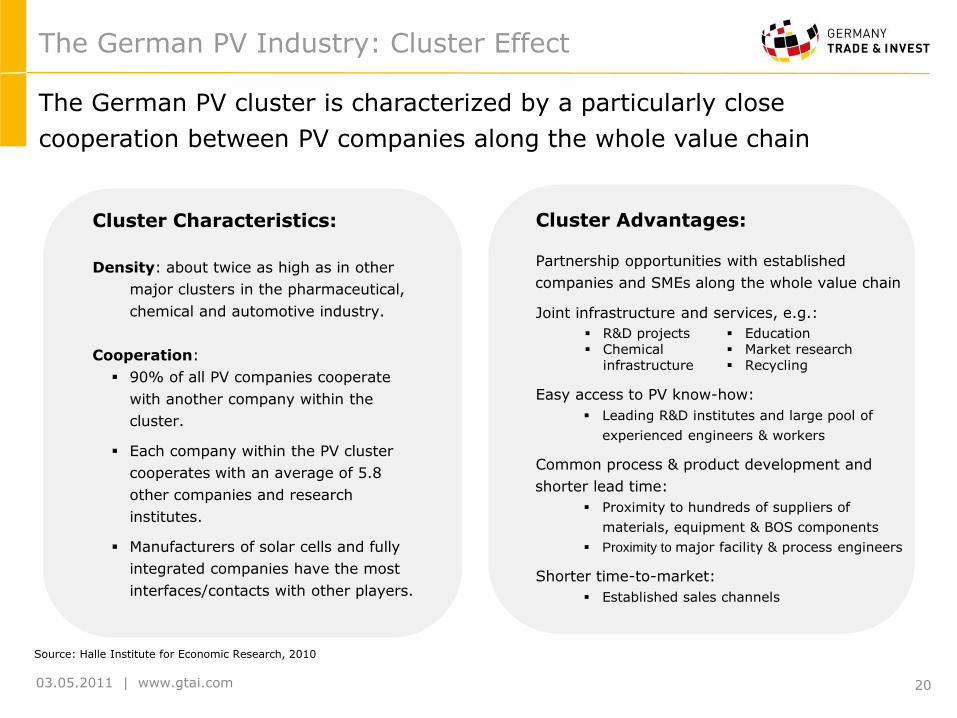
Cluster Advantages:
Partnership opportunities with established
companies and SMEs along the whole value chain
Joint infrastructure and services, e.g.:
Easy access to PV know-how:
Leading R&D institutes and large pool of
experienced engineers & workers
Common process & product development and
shorter lead time:
Proximity to hundreds of suppliers of
materials, equipment & BOS components
Proximity to major facility & process engineers
Shorter time-to-market:
Established sales channels
Cluster Characteristics:
Density: about twice as high as in other
major clusters in the pharmaceutical,
chemical and automotive industry.
Cooperation:
90% of all PV companies cooperate
with another company within the
cluster.
Each company within the PV cluster
cooperates with an average of 5.8
other companies and research
institutes.
Manufacturers of solar cells and fully
integrated companies have the most
interfaces/contacts with other players.
The German PV Industry: Cluster Effect
Source: Halle Institute for Economic Research, 2010
The German PV cluster is characterized by a particularly close
cooperation between PV companies along the whole value chain
R&D projects Chemical
infrastructure
Education Market research Recycling

03.05.2011 | www.gtai.com 21
Germany hosts the world‟s largest PV cluster: (I) Companies in wafer-based technologies
1)Planned / under construction 2)Total number of employees at respective location
The German PV Industry
Source: Germany Trade & Invest, Information provided by the respective company, February 2011
Germany
Value Chain No. Companies Selected Locations Capacity
2011 [MWp] Empl. ²
Silicon 01 Wacker Chemie Burghausen, Nünchritz 33,000t 1766
02 PV Crystalox Solar Silicon Bitterfeld-Wolfen 1,800t 115
03 Joint Solar Silicon Rheinfelden 850t n/a
04 Schmid Pilot Production Spreewitz1 150t 90
Wafer 05 PV Crystalox Erfurt 400 145
06 SCHOTT Solar Wafer Jena 300 400
Cell 07 Q-Cells Bitterfeld-Wolfen 500 1300
08 SCHOTT Solar Alzenau 305 520
09 ITS Innotech Solar Halle 135 36
10 Sunways Konstanz, Arnstadt 116 350
11 Solland Solar Cells Aachen 110 275
12 ARISE Technologies Bischofswerda, Gelsenkirchen 85 160
13 Systaic Heilbronn - 40
Module 14 CENTROSOLAR Wismar 350 700
15 aleo solar (Bosch) Prenzlau 280 801
16 SOLON Berlin, Greifswald 251 470
17 SOLARWATT Dresden 240 470
18 Solar-Fabrik Freiburg 210 350
19 Scheuten Solar Technology Gelsenkirchen 20 270
20 Heckert Solar Chemnitz 180 205
21 ALGATEC Solar Prösen, Großräschen 130 233
22 asola Erfurt 45 120
23 Antaris JuraWatt Neumarkt 40 45
24 solarnova Wedel 25 40
25 alfasolar Hannover 20 85
26 arinna Berlin 20 50
27 GSS Korbußen 20 44
28 Webasto Solar Landsberg/Lech 20 40
29 Solarbau Süd Großbettlingen 15 43
30 Sunware Duisburg < 1 20
31 Sunovation Klingenberg < 1 5
32 Q-mo solar Teltow < 1 5
33 Wulfmeier Solar Bielefeld < 1 5
34 Q-Cells Bitterfeld-Wolfen1 - 1300
Fully Integrated
35 SolarWorld Freiberg 1000/250/550 990
36 Bosch Solar Energy Arnstadt 400/430/n/a1 1500
(Wafer/Cell/ Module)
37 Conergy Frankfurt (Oder) 200/250/250 700
38 Sovello Bitterfeld-Wolfen 180/180/180 1200
CPV 39 Concentrix Solar Freiburg 25 80
Stuttgart
Munich
Hamburg
Düsseldorf
Berlin
Dresden
Frankfurt
Leipzig
16
05
01
07
15
02
03
04
06
08
11
10
13
17
14
18
22
27
24
16
10
01
22
31
11
21
26
33
20
09
36
38
35
37
25
12
19
30
39
24
32
34
29
21
TSMC-Centrosolar

03.05.2011 | www.gtai.com 22
Germany hosts the world‟s largest PV cluster: (II) Companies in thin-film & other technologies
The German PV Industry
1)Planned / under construction 2)Total number of employees at respective location
Source: Germany Trade & Invest, Information provided by the respective company, February 2011
Value Chain
No. Companies Selected Locations Capacity 2011
[MWp] Empl.²
Thin Film
40 Schüco TF Großröhrsdorf 110 150
41 Masdar PV Ichtershausen 75 270
42 Malibu (Schüco) Osterweddingen 45 120
a-Si 43 Inventux Berlin 40 200
a-Si/μc-Si 44 Bosch Thin Film Erfurt 40 195
45 SCHOTT Solar Thin Film Jena 35 200
46 EPV SOLAR Senftenberg 30 110
47 Wilms Gruppe Bitterfeld-Wolfen 25 79
48 CENTROSOLAR Paderborn 6.5 10
49 Solibro (Q-Cells) Bitterfeld-Wolfen 135 500
50 AVANCIS Torgau 120 223
51 Nanosolar Luckenwalde 120 77
52 Sulfurcell Berlin 35 250
CIS 53 Global Solar Berlin 35 100
CIGS 54 Würth Solar Schwäbisch Hall 30 280
CIGSSe 55 Bosch Solar CIS Tech Brandenburg 30 150
56 Odersun Frankfurt (Oder), Fürstenwalde 25 330
57 Solarion Leipzig Pilot 50
58 CIS Solartechnik Bremerhaven Pilot 25
59 PVflex Solar Fürstenwalde Pilot 20
60 First Solar Frankfurt (Oder) 447 600
CdTe 61 Calyxo (Q-Cells) Bitterfeld-Wolfen 25 140
62 ANTEC Solar Arnstadt1 n/a n/a
Poly-Si 63 CSG Solar Bitterfeld-Wolfen - 44
GaAs 64 Azur Space Solar Power Heilbronn 250 135
OPV 65 heliatek Dresden1 - 55
PV & Thermal
66 Solarzentrum Allgäu Altdorf-Biessenhofen 2 100
67 solarhybrid Markranstädt n/a 50
68 Grammer Solar Amberg n/a 45
69 Heli Solar Blankenburg1 n/a 5
Leipzig 55
Germany
Stuttgart
Munich
Hamburg
Düsseldorf
Berlin
Dresden
Frankfurt
54 64
58
65
42
62 44
41 45
57
61 63 49 46
40
60 56
59 51
52
55
43 53
69
67
66
68
48
56 47
50
Walsin Lihwa -Solarion

03.05.2011 | www.gtai.com 23
Collaborating with first-class PV research ensures a sustainable edge
The German PV R&D Institutes
Si feedstock
Wafer based cell technology
Thin film technology
Organic cell technology
Process & production technology
Systems
17 26
36
43
32
35
14
21
42 34
This list is not intended to be exhaustive.
Source: Germany Trade & Invest, September 2009
Nr . Institute Location Activities
1 Fraunhofer Center for Silicon Photovoltaics (CSP ) Halle
2 Fraunhofer Institute of Integrated Systems and Device Technology (IISB),
Erlangen Crystal Growth Laboratory
3 Fraunhofer Technology Center for Semiconducter Materials (THM) Freiberg
4 Institute of Crystal Growth (IKZ) Berlin
5 Fraunhofer Institute for Solar Energy Systems (ISE) Freiburg
6 Freiberg University of Mining and Technology, Institute for Experimental Physics Freiberg
7 International Solar Energy Research Center (ISC-Konstanz) Konstanz
8 University of Konstanz - Dept. of Physics, Section Photovoltaics Konstanz
9 Fraunhofer Institute for Solar Energy Systems (ISE) Freiburg
10 Institute for Solar Energy Research (ISFH) Hameln
11 Bavarian Center for Applied Energy Research (ZAE) Erlangen
12 CeNIDE - Center for Nanointegration, University of Duisburg-Essen Duisburg, Essen
13 CISLAB - Institute of Solid-State Physics, University of Jena Jena
14 Technical University of Ilmenau, Dept. for Experimental Physics Ilmenau
15 University of Technology Darmstadt, Dept. for Material Sciences Darmstadt
16 PV Competence Centre Berlin (PVCOMB), Helmholtz Centre Berlin Berlin
17 Justus-Liebig University of Gießen, Institute of Physics Gießen
18 Institute for Solar Technologies (IST-Frankfurt) Frankfurt (Oder)
19 Next Energy - EWE Research Centre for Energy Technology, University of Oldenburg Oldenburg
20 University of Oldenburg, Institute of Physics Oldenburg
21 University of Stuttgart, Institute of Physical Electronics (IPE) Stuttgart
22 Institute of Photonic Technology (IPHT) Jena
23 Institute of Photovoltaics, Research Centre Jülich (IPV) Jülich
24 Centre for Solar Energy and Hydrogen Research Baden-Württemberg (ZSW) Stuttgart, Widderstall
25 CeNS - Center for NanoScience, Ludwig-Maximilians-University Munich Munich
26 Department of Physics, University of Technology Munich Munich
27 Fraunhofer Institute for Applied Polymer Research (IAP) Potsdam
28 Fraunhofer Institute for Photonic Mircosystems Dresden
29 Light Technology Institute, Karlsruhe Institute of Technology (KIT) Karlsruhe
30 Technical University Dresden, Institute for Applied Photo Physics (IAPP) Dresden
31 University of Hannover, Institute of Physical Chemistry and Electrochemistry (PCI) Hannover
32 University of Potsdam, Institute for Physics and Astronomy Potsdam
33 University of Würzburg, Institute of Experminental Physics VI Würzburg
34 Thuringian Institute of Textile and Plastics Research (TITK) Rudolstadt
35 Center for Organic Materials and Electronics Devices (COMEDD) Dresden
36 Fraunhofer Institute for Electron Beam and Plasma Technology (FEP) Dresden
37 Fraunhofer Institute for Laser Technology (ILT) Aachen
38 Fraunhofer Institute for Production Technology and Automation (IPA) Stuttgart
39 Fraunhofer Institute for Silicate Research, (ISC-Würzburg) Würzburg
40 Fraunhofer-Institute for Surface Engineering and Thin Films (IST-Braunschweig) Braunschweig
41 Fraunhofer Institute for Material and Beam Technology (IWS) Dresden
42 KIT - Karlsruhe Institute of Technology Karlsruhe
43 Institute for Plastics Technologies & Recycling (IKTR) Weißandt-Gölzau
44 Laser Zentrum Hannover (LZH) Hannover
45 Photovoltaic Institute Berlin (PI-Berlin) Berlin
46 Institute for Microsensorics (CIS), Solar Centre Erfurt
47 Chair for Thermodynamics, University of Technology Munich Munich
48 Institut für Solare Energieversorgungstechnik (IWES) Kassel
41
27
28
29
33
Stuttgart
Munich
Hanover
Düsseldorf
Bremen
Berlin
Dresden
Frankfurt
1 1
2
4
6
7
8 7
9
10
15
16
15
17
20
21
22 23 23
9
10
11
11
24
14
16
20
21
9
31
11
356
16
38
39
7
40
41
45
46
24 24
9
48
10
32
3
19
25
26
47
14
12 12
13
5

03.05.2011 | www.gtai.com 24
Proximity to leading PV equipment companies accelerates production ramp-up (I)
1)Total number of employees at respective location This list is not intended to be exhaustive.
Source: Germany Trade & Invest, Information provided by the respective company, August 2010
The German PV Equipment Industry
Equipment No. Companies Selected Locations Empl.1
Silicon 01 centrotherm SiTec Blaubeuren 150 - Equipment 02 Decker Berching 50
03 G+R GreenTech Regenstauf 200
04 PVA TePla Wettenberg, Jena 300
05 STANGL Semiconductor Equipment Fürstenfeldbrück 170
Ingot/Wafer 06 ALD Vacuum Technologies Hanau 365 - Equipment 07 Centrotherm SiTec Blaubeuren 150
08 Elma Singen 190
09 G&N Erlangen 33 10 Herbert Arnold Weilburg 190
11 HK Präzisionstechnik Obernburg 40
12 KUKA Systems Augsburg 1200 13 LOG-O-MATIC Mainaschaff 20 14 PVA TePla Wettenberg, Jena 300
15 RENA Gütenbach, Berg, Herrenberg 1150
16 Schmid Freudenstadt, Niedereschach 750
17 STANGL Semiconductor Equipment Fürstenfeldbrück 170
Cell 18 centrotherm photovoltaics group Blaubeuren 1500
- Turnkey Lines
19 Roth & Rau Hohenstein-Ernstthal 500 20 Schmid Freudenstadt, Niedereschach 750
21 SINGULUS TECHNOLOGIES Kahl 270
Cell 22 centrotherm thermal solutions Blaubeuren 470
- Thermal Equipment
23 ATV TECHNOLOGIE Vaterstetten 24 24 Rehm Thermal Systems Blaubeuren 170
Cell 25 Decker Berching 50 - Wet Chemistry
26 LOTUS Systems Gutmadingen 90
27 Ramgraber Hofolding b. Brunnthal 45
28 RENA Gütenbach, Berg, Herrenberg 1150
29 Schmid Freudenstadt 550 30 STANGL Semiconductor Equipment Fürstenfeldbrück 170
Cell 31 Applied Materials Alzenau 540 - Anti-reflective 32 centrotherm photovoltaics group Blaubeuren 1500 Coating 33 Roth & Rau Hohenstein-Ernstthal 500
34 Schmid Freudenstadt 550 35 SINGULUS TECHNOLOGIES Kahl 270
36 VON ARDENNE Anlagentechnik Dresden 570 Cell 37 ASYS Automatisierungssysteme Dornstadt 400
- Screen Printers
38 JRT Photovoltaics Malterdingen 80 39 Manz Automation Reutlingen 400
40 THIEME Teningen 350 Module 41 ACI-ecotech Zimmern ob Rottweil 100
- Turnkey 42 ATS Automation Tooling Systems Munich 80 Lines 43 Böhm-Solar Equipment Technology Zella-Mehlis 200
44 Bürkle Freudenstadt, Rietberg 140
45 centrotherm photovoltaics group Blaubeuren 1500
46 JVG Thoma Freystadt 40 47 KUKA Systems Augsburg 1200
48 MAG Göppingen 320 49 Maschinenbau GEROLD Nettetal 50
50 REIS ROBOTICS Obernburg 830 51 Schmid Freudenstadt, Niedereschach 750 52 Teamtechnik Freiberg am Neckar 350 Module 53 Böhm-Solar Equipment Technology Zella-Mehlis 200
- Stringers, 54 Bürkle Freudenstadt, Rietberg 140
Laminators 55 IMA Automation Berlin Berlin 56
56 JVG Thoma Freystadt 40 57 Meier Solar Solutions Bocholt, Roßla 110 58 REIS ROBOTICS Obernburg 830 59 Robust Remscheid 80 60 Schmid Niedereschach 200 61 SOMONT Umkirch 100 62 Spaleck/ SPALECK-STEVENS InnoTech Bocholt 240
63 Teamtechnik Freiberg am Neckar 350 64 USK Karl Utz Sondermaschinen Limbach-Oberfrohna 230
Stuttgart
Munich
Düsseldorf
Berlin
Dresden
Hamburg
Frankfurt
01
03 02
04
04
05
17 30
08
09
10
11
12
13
14 14
15
15
19 33
16 20
24
23
22
25
26 27 28
28
31
32
18
37 38
39
40
41
44
44
47
50
48 34
52
60
36
63
59
58
59
06
21
35
57
61
54
55
29
64
42
43
45
46
53
54
55
56
51
62
Germany
07
49

03.05.2011 | www.gtai.com 25
Proximity to leading PV equipment companies accelerates production ramp-up(II)
The German PV Equipment Industry
1)Total number of employees at respective location 2)SLS shares employees with USK, No. 55
This list is not intended to be exhaustive.
Source: Germany Trade & Invest Information provided by the respective company, August 2010
Equipment No. Companies Selected Locations Empl.1
Thin Film - Turnkey Lines
65 Bürkle Freudenstadt, Rietberg-Mastholte 140 66 centrotherm photovoltaics group Blaubeuren, Dresden 1500
67 LEYBOLD OPTICS Alzenau, Dresden 380
68 Manz Automation Reutlingen 400 69 Roth & Rau Hohenstein-Ernstthal 500
Thin Film - Vacuum Deposition
70 Aixtron Herzogenrath 450
71 Applied Materials Alzenau 540
72 FHR Anlagenbau Ottendorf-Okrilla 170
73 LEYBOLD OPTICS Alzenau, Dresden 380
74 VON ARDENNE Anlagentechnik Dresden 570
Automation 75 ACI-ecotec Zimmern ob Rottweil 100
76 AMB Automation Langweid 50
77 ASYS Automatisierungssysteme Dornstadt 400
78 ATMsse Singen 50
79 ATS Automation Tooling Systems Munich 80
80 Baumann Amberg 210
81 Bürkle Freudenstadt, Rietberg-Mastholte 140
82 Grenzebach Hamlar 1500
83 IMA Automation Berlin Berlin 56
84 Jonas & Redmann Photovoltaics Berlin 650
85 JRT Photovoltaics Malterdingen 80
86 KUKA Systems Augsburg 1200
87 MAG Göppingen 320
88 Manz Automation Reutlingen 400
89 Maschinenbau GEROLD Nettetal 50
90 MiniTec Maschinenbau Waldmohr 170
91 Mondragon Assembly Stockach 20
92 Olbricht Hamminkeln-Brünen 30
93 REIS ROBOTICS Obernburg 800
94 RENA Gütenbach, Gutmadingen, Berg 1150
95 Rommel Ehingen 100
96 Schiller Automation Sonnenbühl-Genkingen 264 97 Schmalz Glatten 420
98 Schmid Niedereschach 200
99 SLS Solar Line Saxony Limbach-Oberfrohna 20² Laser Processing 100 3D-Micromac Chemnitz 70
101 4JET Ahlsdorf 30
102 ASYS Automatisierungssysteme Dornstadt 400
103 InnoLas Krailling 80
104 Jenoptik Automatisierungstechnik Jena 200
105 LPKF SolarQuipment Suhl-Friedberg 50
106 MAG Göppingen 320
107 Manz Automation Reutlingen 400
108 Rofin Starnberg, Hamburg, Günding 1600 109 Schmid Schwetzingen 60
Stuttgart
Munich
Düsseldorf
Berlin
Dresden
Hamburg
Frankfurt
75
76 75
78
79
80
82
83
84
85 83
89
90
91
92
93
94
95
96 98
99 100
103
108
108
107
88
102
84
94
101
100
97
71
65
66
64
67
67
66
69
70
73
73
72 74
101
Germany
65
81
81
68
108
109
102
03.05.2011 | www.gtai.com 26
I. Germany Trade & Invest
II. The German PV Policy & Market
III. The German PV Industry
IV. Advantages of Germany as an Investment Location

03.05.2011 | www.gtai.com 27
PV Manufacturing in Germany
Germany offers unique advantages - especially for module manufacturing
Higher selling prices
”Made in Germany“ premium brand: easier access to private customers (>35% market share and growing)
Direct link to customer (e.g. ”transparent factory“ concept) satisfying more differentiated markets (e.g. BIPV)
Distinction against competitors at home
Shorter time to market
Short reaction time, just-in-time delivery, optimized supply chain - especially in volatile market
Close proximity to other European markets
Optimized costs
Less transportation costs
Reduced long-term transport inventories
Moderate production costs, cash grants of up to 50% available
Lowered risks
Reduced price risks
Eurozone: single currency means no exchange rate risk
Potential trade barriers eliminated
Lobby power
Many partners
Access to large local supplier base for materials (e.g. glass)
Cooperation with utilities, test houses, banks, insurances, system integrators, proj. developers, R&D institutes

03.05.2011 | www.gtai.com 28
Incentives available to investment projects in Germany
German Incentives Overview
Germany offers different incentive packages to reimburse the
expenditures of an investment project
Incentives
Reducing Operating Costs
R&D Incentives Labor-Related
Incentives
Training Support
Recruitment Support
Grants
Silent / Direct Partnership
Loans
Wage Subsidies
State Investment
Grant
Cash Incentives Reduced Interest
Loans Public
Guarantees
KfW Loans (National Level)
Investment Allowance
State Development
Banks
Combined State/ Federal
Reducing Investment Costs
Up to 50 %
03.05.2011 | www.gtai.com 29
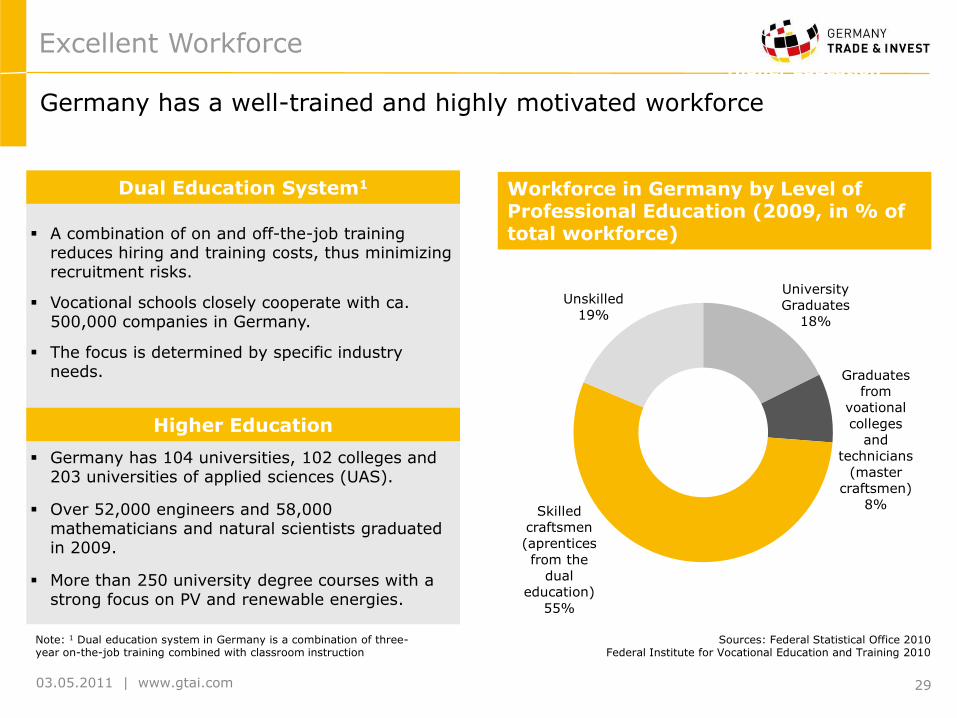
Excellent Workforce
Germany has a well-trained and highly motivated workforce
Higher Education
University
Graduates
18%
Graduates
from
voational
colleges
and
technicians
(master
craftsmen)
8% Skilled
craftsmen
(aprentices
from the
dual
education)
55%
Unskilled
19%
Excellent Workforce
Germany has 104 universities, 102 colleges and 203 universities of applied sciences (UAS).
Over 52,000 engineers and 58,000 mathematicians and natural scientists graduated in 2009.
More than 250 university degree courses with a strong focus on PV and renewable energies.
A combination of on and off-the-job training reduces hiring and training costs, thus minimizing recruitment risks.
Vocational schools closely cooperate with ca. 500,000 companies in Germany.
The focus is determined by specific industry needs.
Higher Education
Dual Education System1
Sources: Federal Statistical Office 2010 Federal Institute for Vocational Education and Training 2010
Workforce in Germany by Level of Professional Education (2009, in % of total workforce)
Note: 1 Dual education system in Germany is a combination of three-year on-the-job training combined with classroom instruction

03.05.2011 | www.gtai.com 30
The labor cost increase in Germany is the lowest in Europe
German Labor Market
Growth of Labor Costs 2001-2009 (yr. average growth | % of total economy)¹
Average gross monthly earnings Western and Eastern Germany2
2,652 2,718
2,806 2,889
2,954 3,009
3,060 3,134
3,213 3,248
1,929 1,982
2,077 2,141
2,191 2,239
2,279 2,344
2,431 2,486
1.500
1.700
1.900
2.100
2.300
2.500
2.700
2.900
3.100
3.300
3.500
2000 2001 2002 2003 2004 2005 2006 2007 2008 2009
Western Germany Eastern Germany
9.1
7.9
7.4
6.9
4.6
4.2
3.5
3.4
3.0
1.9
0 2 4 6 8 10
Hungary
Slovak Republic
Czech Republic
Poland
Spain
UK
Netherlands
EU-27
France
Germany
Note: 1) No data available for USA and Japan 2) In industry and service sector excluding bonuses in €/month Sources: Eurostat 2010, German Federal Statistics Office 2010
03.05.2011 | www.gtai.com 31
German Labor Market
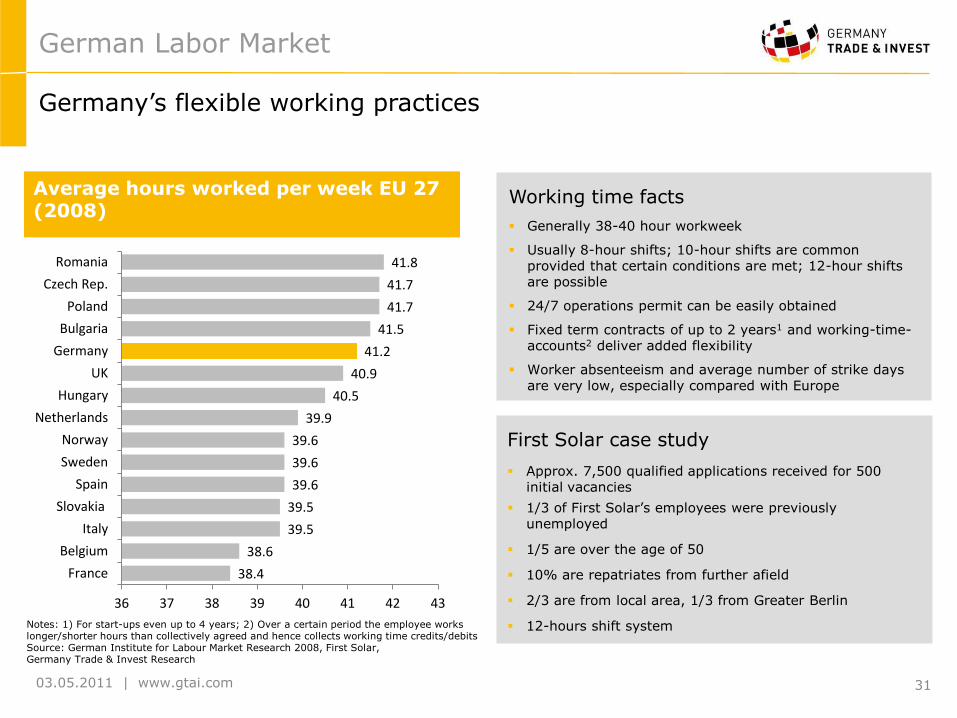
Germany‟s flexible working practices
Notes: 1) For start-ups even up to 4 years; 2) Over a certain period the employee works longer/shorter hours than collectively agreed and hence collects working time credits/debits Source: German Institute for Labour Market Research 2008, First Solar, Germany Trade & Invest Research
Working time facts
Generally 38-40 hour workweek
Usually 8-hour shifts; 10-hour shifts are common provided that certain conditions are met; 12-hour shifts are possible
24/7 operations permit can be easily obtained
Fixed term contracts of up to 2 years1 and working-time-accounts2 deliver added flexibility
Worker absenteeism and average number of strike days are very low, especially compared with Europe
First Solar case study
Approx. 7,500 qualified applications received for 500 initial vacancies
1/3 of First Solar‟s employees were previously unemployed
1/5 are over the age of 50
10% are repatriates from further afield
2/3 are from local area, 1/3 from Greater Berlin
12-hours shift system
Average hours worked per week EU 27 (2008)
38.4
38.6
39.5
39.5
39.6
39.6
39.6
39.9
40.5
40.9
41.2
41.5
41.7
41.7
41.8
36 37 38 39 40 41 42 43
France
Belgium
Italy
Slovakia
Spain
Sweden
Norway
Netherlands
Hungary
UK
Germany
Bulgaria
Poland
Czech Rep.
Romania
03.05.2011 | www.gtai.com 32
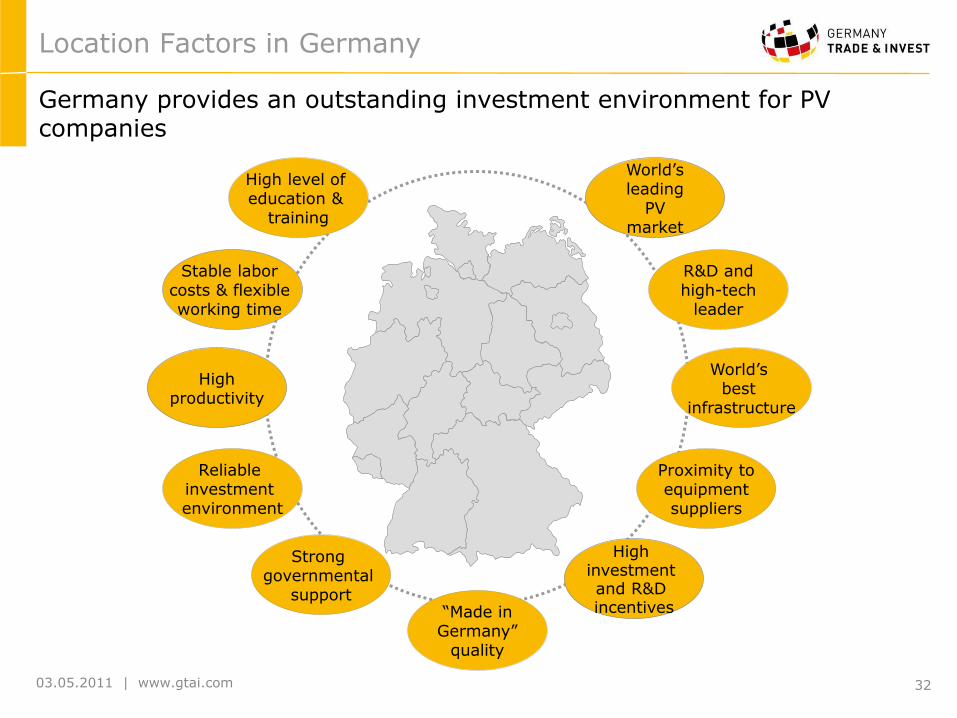
World‟s leading
PV market
High level of education &
training
R&D and high-tech
leader
“Made in Germany”
quality
Reliable investment environment
World‟s best
infrastructure
Stable labor costs & flexible working time
High investment and R&D incentives
High productivity
Proximity to equipment suppliers
Location Factors in Germany
Germany provides an outstanding investment environment for PV companies
Strong governmental
support

03.05.2011 | www.gtai.com 33
Testimonials
Why foreign PV companies invested in Germany:

03.05.2011 | www.gtai.com 34
Germany Trade & Invest
Foreign Trade and Inward Investment Promotion Agency
Germany Trade & Invest
© 2011 Germany Trade & Invest All information provided by Germany Trade & Invest has been put together with the utmost care. However we assume no liability for the accuracy of the information provided.
Contact for PV investments
Germany Trade & Invest Mr. Thomas Grigoleit Director Renewable Energies & Resources Friedrichstraße 60 10117 Berlin Germany
T. +49 30 200 099-224 F. +49 30 200 099-111
Germany Trade & Invest Ms. Anne Bräutigam Manager Photovoltaics Friedrichstraße 60 10117 Berlin Germany T. +49 30 200 099-228 F. +49 30 200 099-111
Germany Trade & Invest Mr. Tobias Homann Senior Manager Photovoltaics Friedrichstraße 60 10117 Berlin Germany T. +49 30 200 099-391 F. +49 30 200 099-111
San Francisco Office Ms. Angelika Geiger Director One Embarcadero Center Suite 1060 San Francisco, 94111, CA USA T.: +1 (415) 248-1246 F.: +1 (415) 627-9169 [email protected]
Tokyo Office Mr. Iwami Asakawa Japan Representative Sanbancho KS Bldg. 5F 2-4 102-0075 Sanbancho, Chiyoda-ku,Tokyo, Japan T.: +81 3 5275 2072 F.: +81 3 5275 2012 [email protected]
New York Office Mr. Claus Habermeier Director 75 Broad Street, 21st Floor New York, 10004, NY USA T.: +1 (212) 584-9715 F.: +1 (212) 262-6449 [email protected]
Beijing Office Mr. Markus Hempel China Representative Unit 0811, Landmark Tower II 8 North Dongsanhuan Road Chaoyang District, Beijing 100004 T. +86 (10) 6539 6725 F. +86 (10) 6590 6167 [email protected]
Germany Trade & Invest Mr. Tobias Rothacher Manager Photovoltaics Friedrichstraße 60 10117 Berlin Germany T. +49 30 200 099-225 F. +49 30 200 099-111