Embed Size (px)
Citation preview
Forward guidance
A. A two-dimensional characterization of monetary shocks (Gürkynak, Sack, and Swanson, 2005)
B. Odyssean versus Delphic foreign guidance (Campbell et al., 2012)
C. A 3-dimensional characterization of monetary shocks (Bauer, 2015)
1
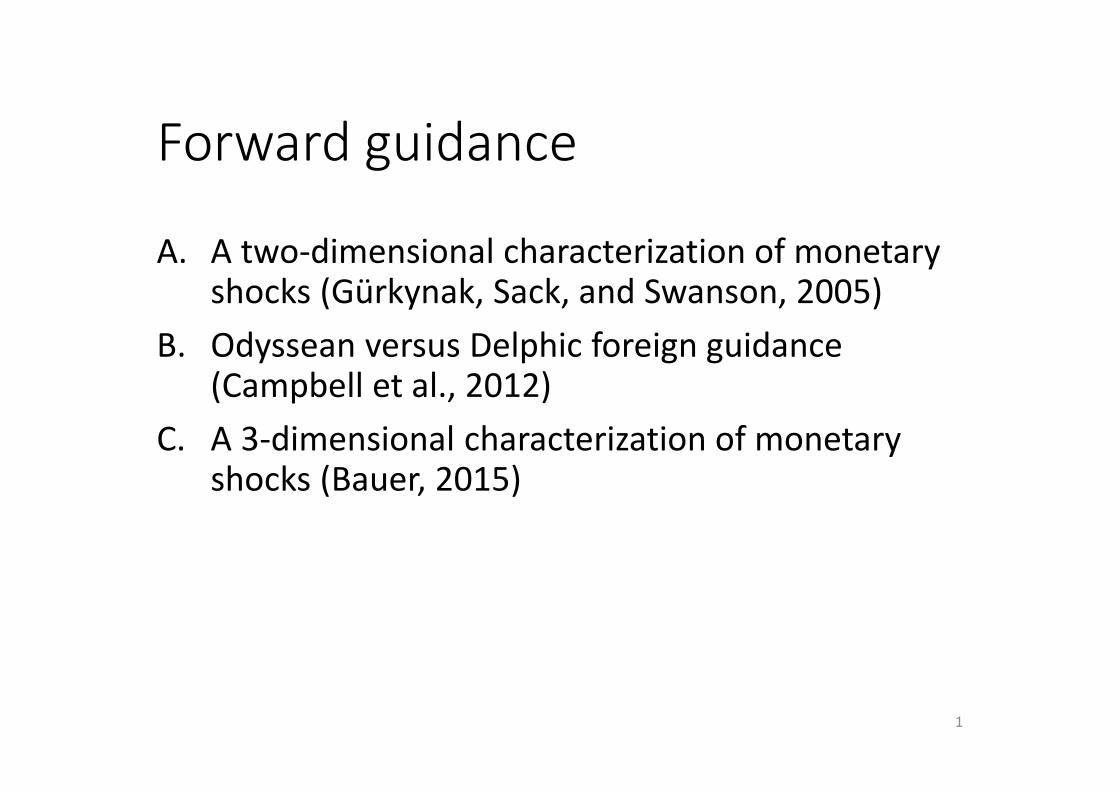
Fed funds target during 2004
2

• FOMC Dec 9, 2003 meeting statement:
• “… However, with inflation quite low and resource use slack, the Committee believes that policy accommodation can be maintained for a considerable
period.”
• FOMC Jan 28, 2004 meeting statement:
• “… With inflation quite low and resource use slack, the Committee believes that it can be patient in removing
its policy accommodation.”
3

4
Jan_27 Jan_28
Jan FF 0.995 0.995
Mar FF 1.005 1.01
Aug FF 1.185 1.27
2y Treasury 1.70 1.87
5 yr Treasury 3.07 3.22

• Gürkaynak, Sack and Swanson (2005) focused on narrow window 10 minutes before to 20 minutes after a major Fed communication
• In recent data communication took the form of a statement issued at the close of FOMC meeting
5

6
June 25, 2003: Fed lowered target from 1.25% to 1.00%
(market anticipated might have gone to 0.75%)

• In earlier data, Fed communicated its plans with an unanticipated open market operation
• E.g., if Fed added reserves when the rate was below its previous target, market correctly inferred that Fed had lowered its target.
7

8

9
Collected observations on j � 1, . . . ,n changes
in the price of n � 11 different assets in
30-minute interval around communication
for t � 1, . . . ,T � 138 different communications.
xt1 � Kuttner-adjusted change in current-month
fed funds futures contract
xt2 � change in 3-month-ahead fed funds futures
Also change in 2-, 3-, and 4-quarter-ahead
Eurodollar futures, 3m, 6m, 2y, 5y, 6y Treasury
yields and S&P 500

10
�n�n���
row i, col j �� ij � T�1 ��xit � x� i ��xjt � x� j�
Factor structure:
�n�n�� �
�n�r��
�r�n�� � �
�n�n�� � ����
� diagonal
�nr�n�1�� � �vec����,vec(diag�������
11
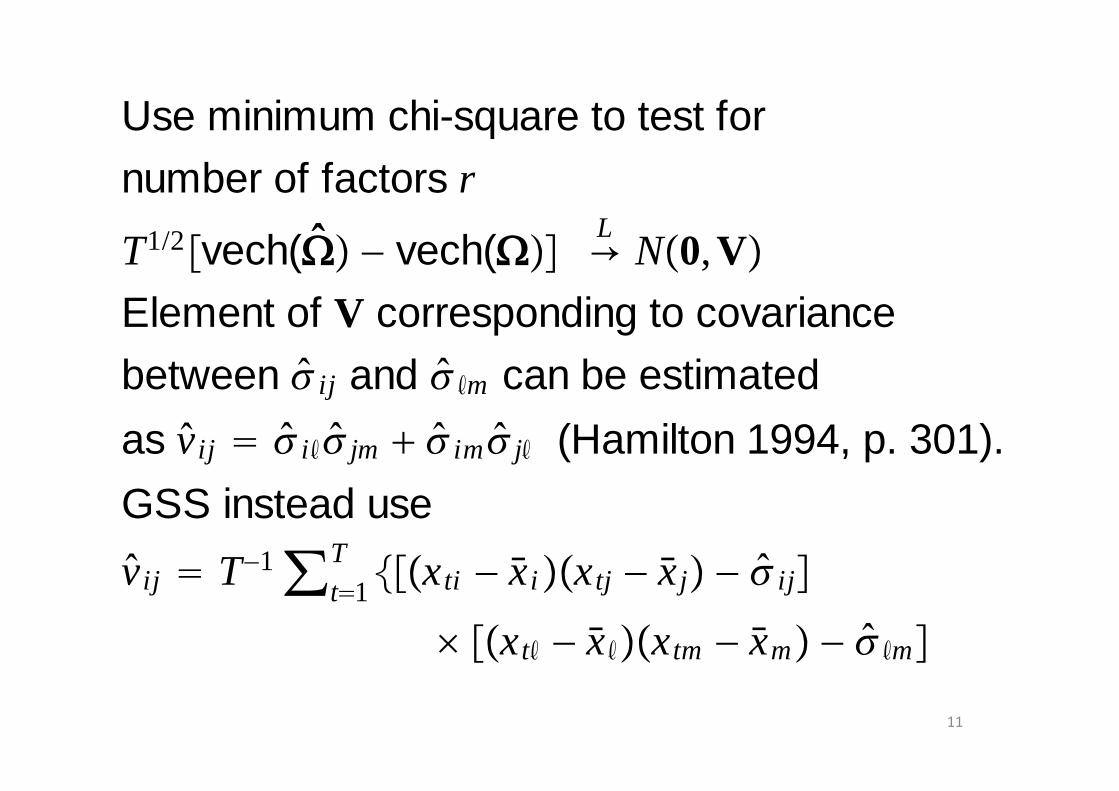
Use minimum chi-square to test for
number of factors r
T1/2�vech(�� � � vech(���L� N�0,V�
Element of V corresponding to covariance
between �� ij and �� �m can be estimated
as v� ij � �� i ��� jm � �� im�� j� (Hamilton 1994, p. 301).
GSS instead use
v� ij � T�1 �t�1T ���xti � x� i ��xtj � x� j� � �� ij �
� ��xt� � x� ���xtm � x�m� � �� �m�
12
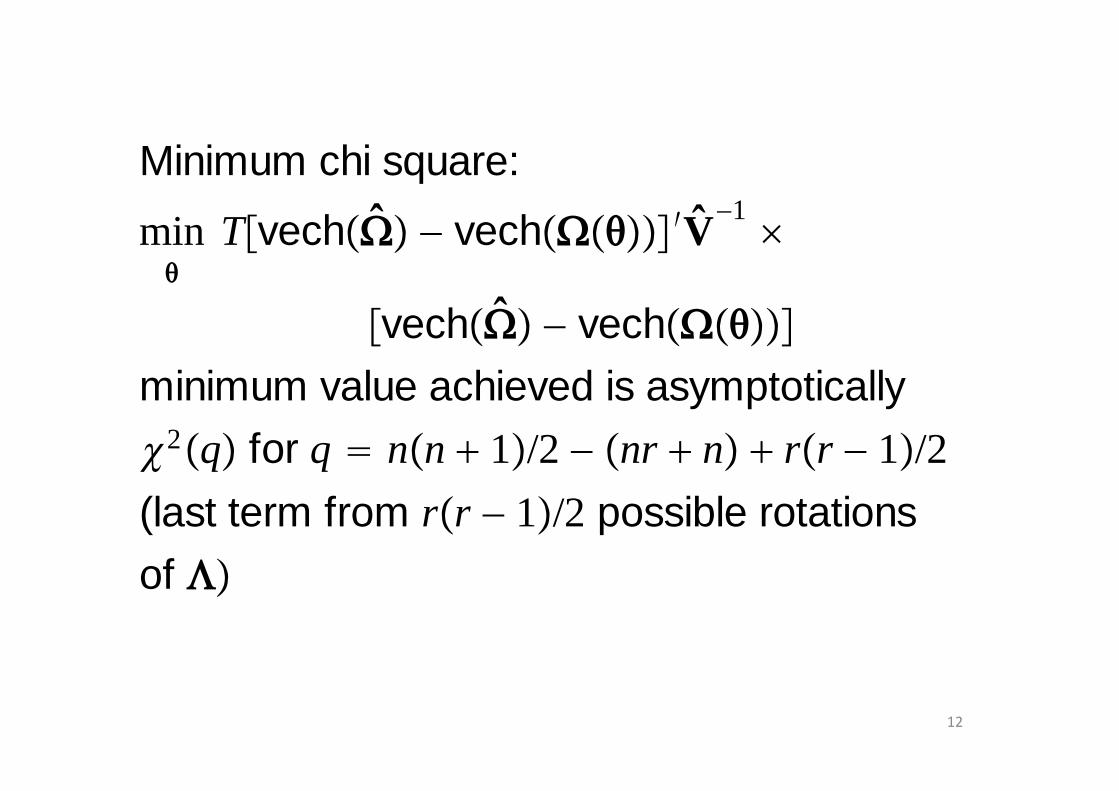
Minimum chi square:
�min T�vech��� � � vech��������V�
�1�
�vech��� � � vech�������
minimum value achieved is asymptotically
�2�q� for q � n�n � 1�/2 � �nr � n� � r�r � 1�/2
(last term from r�r � 1�/2 possible rotations
of ��

13
Result: reject H0 : r � 1
fail to reject H0� : r � 2
Conclusion: monetary policy surprises are
a 2-dimensional object.

14
Can estimate space spanned by monetary
policy surprises by �1t,�2t � first two principal
components of xt
Useful alternative normalization:
� t� � Q� t where �2t
� has no effect on x1t and
�2t� is uncorrelated with �1t
�

15
Usual normalization: T�1 �t�1T � t� t
� � I2
Would also hold for � t� � Q� t
Q �cos� � sin�
sin� cos��QQ �� I2�

16
xt1 � Kuttner-adjusted change in current-month
fed funds futures
� conventional measure of monetary policy
h11 � first element of first eigenvector of ��
� loading of xt1 on � t1
h12 � first element of second eigenvector of ��
� loading of xt1 on � t2

17
loading of xt on � t is�n�2�H
x t � H� t � HQ �Q� t � H�� t�
loading of xt on � t� is
�n�2�H� �
H� � HQ � � Hcos� sin�
� sin� cos�
� t� � Q� t
h12� � h11 sin� � h12 cos�
18
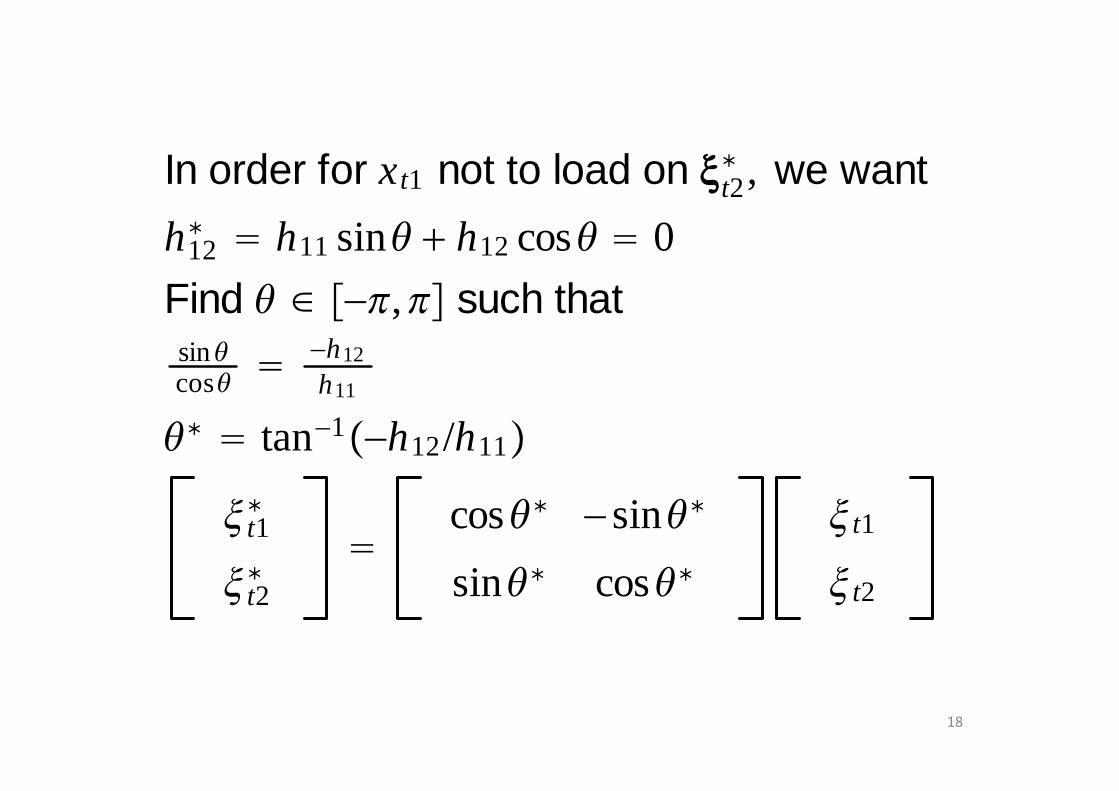
In order for xt1 not to load on � t2� , we want
h12� � h11 sin� � h12 cos� � 0
Find � � ���,�� such thatsin �cos� �
�h12
h11
�� � tan�1��h12/h11�
� t1�
� t2�
�cos�� � sin��
sin�� cos��� t1
� t2

19
Can further normalize so that h11� � 1
�� 1t � ��1t�
(one-unit shock to �� 1t raises fed funds
target by one basis point)
Normalize �� 2t so that 1-year eurodollar
futures increases by 0.55 bp
(� response of 1-year eurodollar to �� 1t�
GSS call �� 1t the "target factor" and
�� 2t the "path factor"

20
Note this makes �� 1t close to x1t but not
identical to x1t
(�� 1t is inference based on full vector x t�

21

22

B. Odyssean versus Delphic foreign guidance (Campbell et al., 2012)
• 2-year rate jumped 17 bp on Jan 28, 2004 when Fed replaced
• “policy accommodation can be maintained for a considerable period”
• with
• “the Committee believes that it can be patient in removing its policy accommodation.”
23
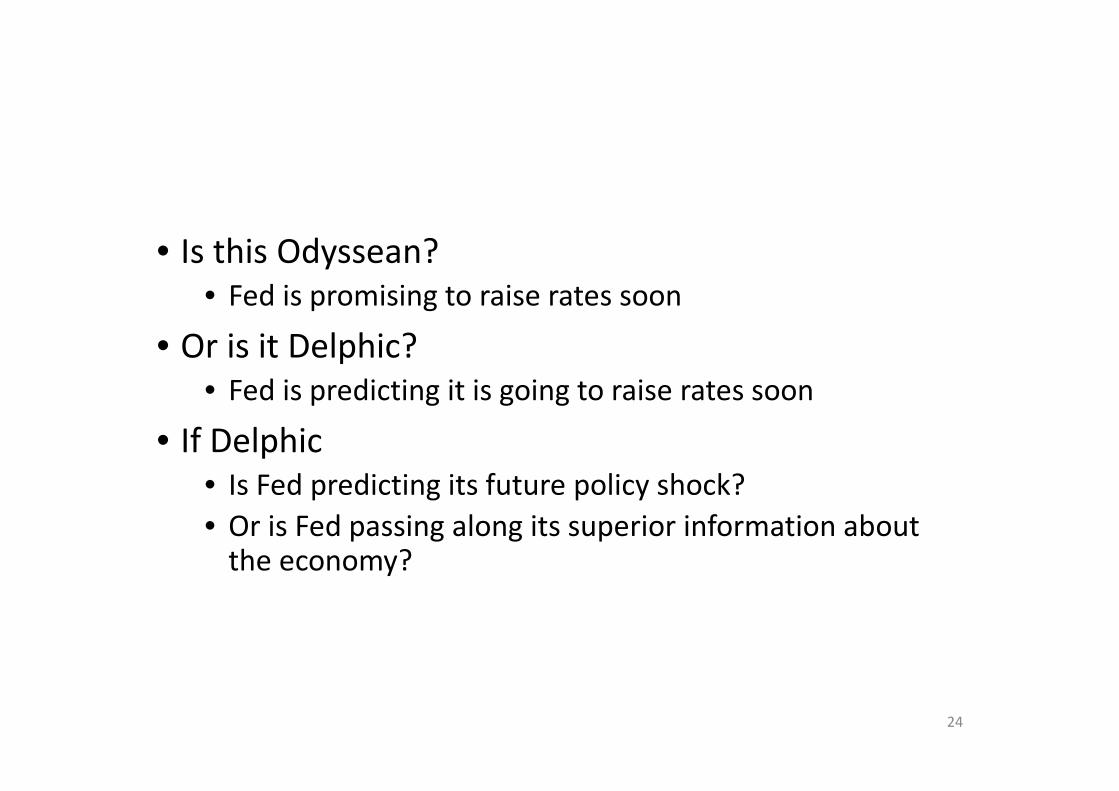
• Is this Odyssean?
• Fed is promising to raise rates soon
• Or is it Delphic?
• Fed is predicting it is going to raise rates soon
• If Delphic
• Is Fed predicting its future policy shock?
• Or is Fed passing along its superior information about the economy?
24
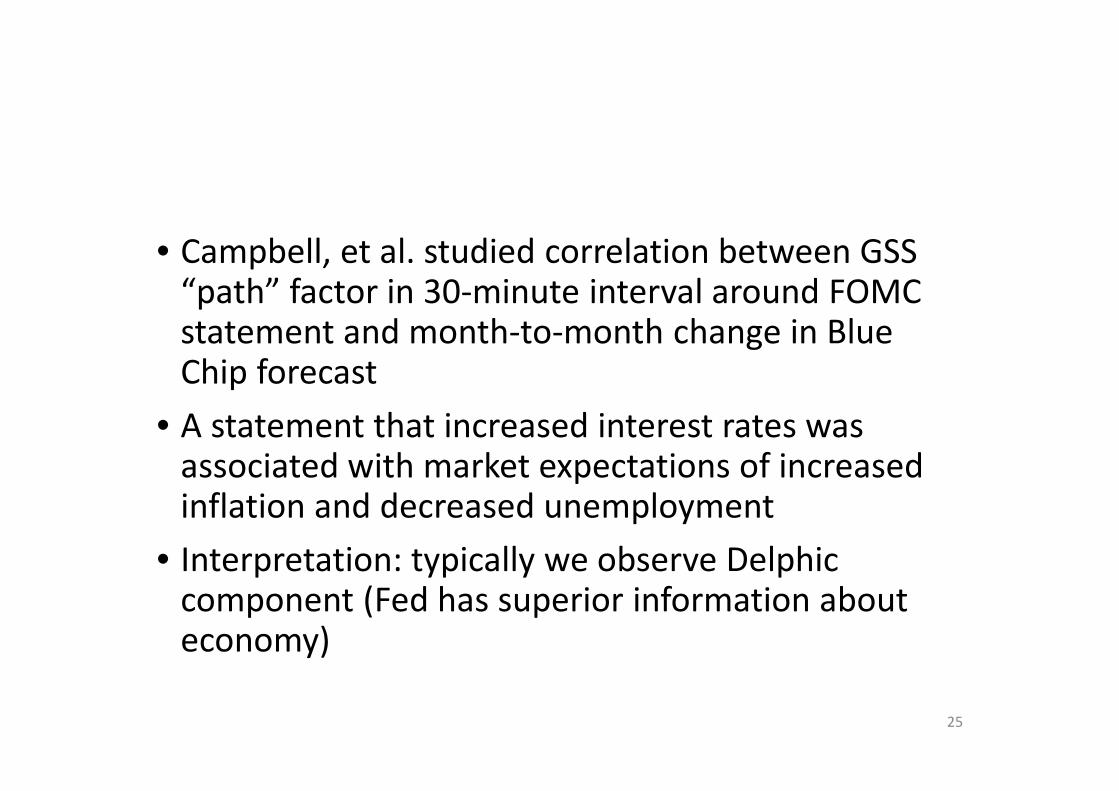
• Campbell, et al. studied correlation between GSS “path” factor in 30-minute interval around FOMC statement and month-to-month change in Blue Chip forecast
• A statement that increased interest rates was associated with market expectations of increased inflation and decreased unemployment
• Interpretation: typically we observe Delphic component (Fed has superior information about economy)
25

26

27
t quarterly
r t � � � 1r t�1 � 2r t�2 � �1 � 1 � 2�����t � ���
� u�ut � ut��� ��
j�0M vt�j,j
vt,0 decided at t
vt�1,1 decided at t � 1
�
vt�M,M decided at t � M
v t � �vt0,vt1, . . . ,vtM�� � new decisions at t
v t serially uncorrelated

28
r t � � � 1r t�1 � 2r t�2 � �1 � 1 � 2�����t � ���
� u�ut � ut��� ��
j�0M vt�j,j
Expectation at t � M
r� t|t�M � � � 1r� t�1|t�M � 2r� t�2|t�M
� �1 � 1 � 2������ t|t�M � ���
� u�ût|t�M � ût|t�M� �� � vt�M,M

29
Expectation at t � M � 1
r� t|t�M�1 � � � 1r� t�1|t�M�1 � 2r� t�2|t�M�1
� �1 � 1 � 2������ t|t�M�1 � ���
� u�ût|t�M�1 � ût|t�M�1� �� � vt�M�1,M�1 � vt�M,M
Difference
r� t|t�M�1 � r� t|t�M � 1�r� t�1|t�M�1 � r� t�1|t�M�
� 2�r� t�2|t�M�1 � r� t�2|t�M�1�
� �1 � 1 � 2������ t|t�M�1 � �� t|t�M�
� u�ût|t�M�1 � ût|t�M � ût|t�M�1� � ût|t�M
� �� � vt�M�1,M�1

30
We observe:
r� t|t�j�1 � r� t|t�j from change in fed funds futures
�� t|t�j�1 � �� t|t�j and ût|t�j�1 � ût|t�j from revision
in Blue Chip forecast
ût|t�j�1� � ût|t�j
� from revision in Blue Chip long-
run forecast
we observe vt�j,j for j � 0,1, . . ,M � 1

Estimate parameters by GMM
31

32
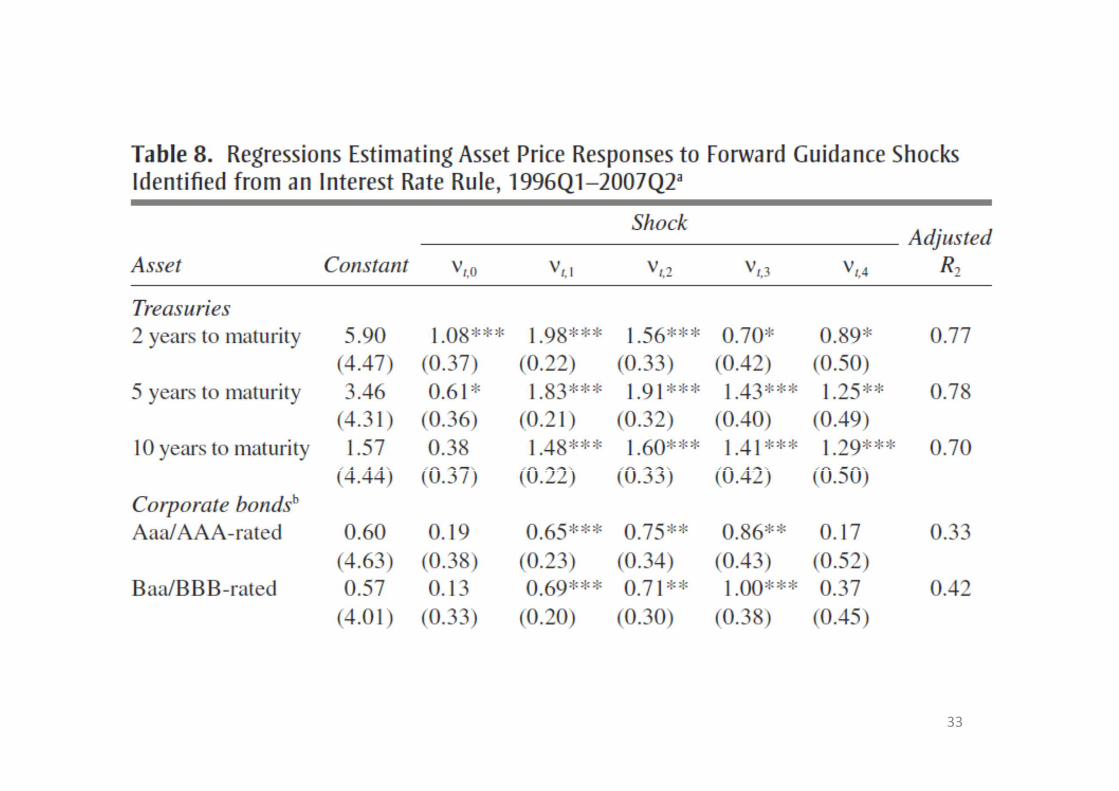
FOMC communicates 40% of variance of shock 1 quarter
ahead and another 40% in 3 quarters before that.
33

C. A 3-dimensional characterization of monetary shocks (Bauer, 2015)
• Estimated Dynamic Nelson-Siegel model using daily data on
• Fed funds futures over each of the next 4 months
• Eurodollar futures contracts for each of the next 14 quarters
• Zero-coupon Treasury yields 6m, 12m, 18m, 2y, 3y, … 10y
• Gives summary of entire yield curve for every day along with term premium and expectations components
34

• Allows for heteroscedasticity by grouping days by kind of news release (e.g., monetary policy release days have different variance matrix from others)
• Allows us to summarize how entire yield curve changes in response to any given day’s news
35
• Example: FOMC statement March 22, 2005
• Fed announced 25 bp increase
• This had been fully anticipated, current futures contract unchanged
• Added hawkish forward guidance
• “pressures on inflation have picked up in recent months”
36

Response of yield curve to FOMC statement Mar 22, 2005 Response of yield curve to FOMC statement Mar 22, 2005 Response of yield curve to FOMC statement Mar 22, 2005 Response of yield curve to FOMC statement Mar 22, 2005 (revision = change in expected future short rates)(revision = change in expected future short rates)(revision = change in expected future short rates)(revision = change in expected future short rates)
37Horizontal axis: quarters for left panel, years for second and third

Response of yield curve to Bernanke announcement Response of yield curve to Bernanke announcement Response of yield curve to Bernanke announcement Response of yield curve to Bernanke announcement Dec 1, 2008 that Fed was “likely to purchase longer termDec 1, 2008 that Fed was “likely to purchase longer termDec 1, 2008 that Fed was “likely to purchase longer termDec 1, 2008 that Fed was “likely to purchase longer termsecurities … in substantial quantities”securities … in substantial quantities”securities … in substantial quantities”securities … in substantial quantities”
38

Model predicted coefficients (solid curve) and RModel predicted coefficients (solid curve) and RModel predicted coefficients (solid curve) and RModel predicted coefficients (solid curve) and R2222 (crosses) (crosses) (crosses) (crosses) from from from from KuttnerKuttnerKuttnerKuttner estimates of effects of monetary policy estimates of effects of monetary policy estimates of effects of monetary policy estimates of effects of monetary policy shocks and direct estimates (circles with confidence bars)shocks and direct estimates (circles with confidence bars)shocks and direct estimates (circles with confidence bars)shocks and direct estimates (circles with confidence bars)
39
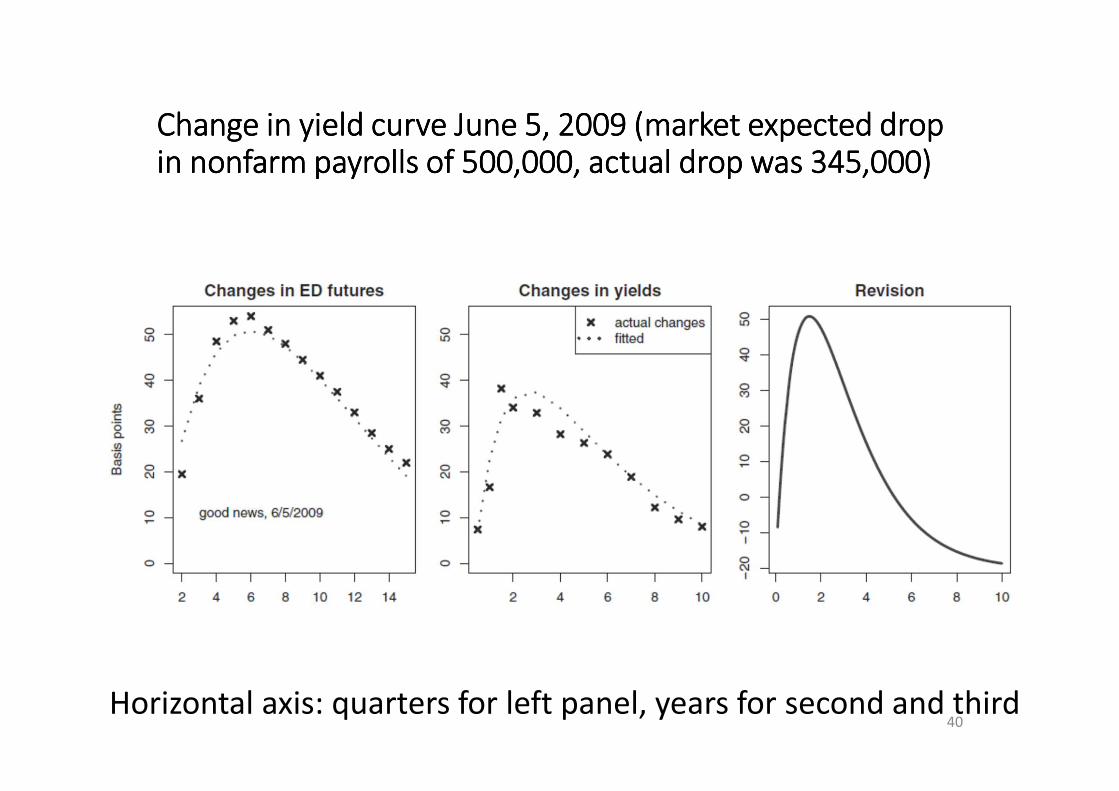
Change in yield curve June 5, 2009 (market expected drop Change in yield curve June 5, 2009 (market expected drop Change in yield curve June 5, 2009 (market expected drop Change in yield curve June 5, 2009 (market expected drop in nonfarm payrolls of 500,000, actual drop was 345,000)in nonfarm payrolls of 500,000, actual drop was 345,000)in nonfarm payrolls of 500,000, actual drop was 345,000)in nonfarm payrolls of 500,000, actual drop was 345,000)
40Horizontal axis: quarters for left panel, years for second and third

Model predicted responses (solid curve) to a oneModel predicted responses (solid curve) to a oneModel predicted responses (solid curve) to a oneModel predicted responses (solid curve) to a one----standard standard standard standard deviation surprise in macro release and direct estimates deviation surprise in macro release and direct estimates deviation surprise in macro release and direct estimates deviation surprise in macro release and direct estimates (circles) (horizontal axis = quarters)(circles) (horizontal axis = quarters)(circles) (horizontal axis = quarters)(circles) (horizontal axis = quarters)
41
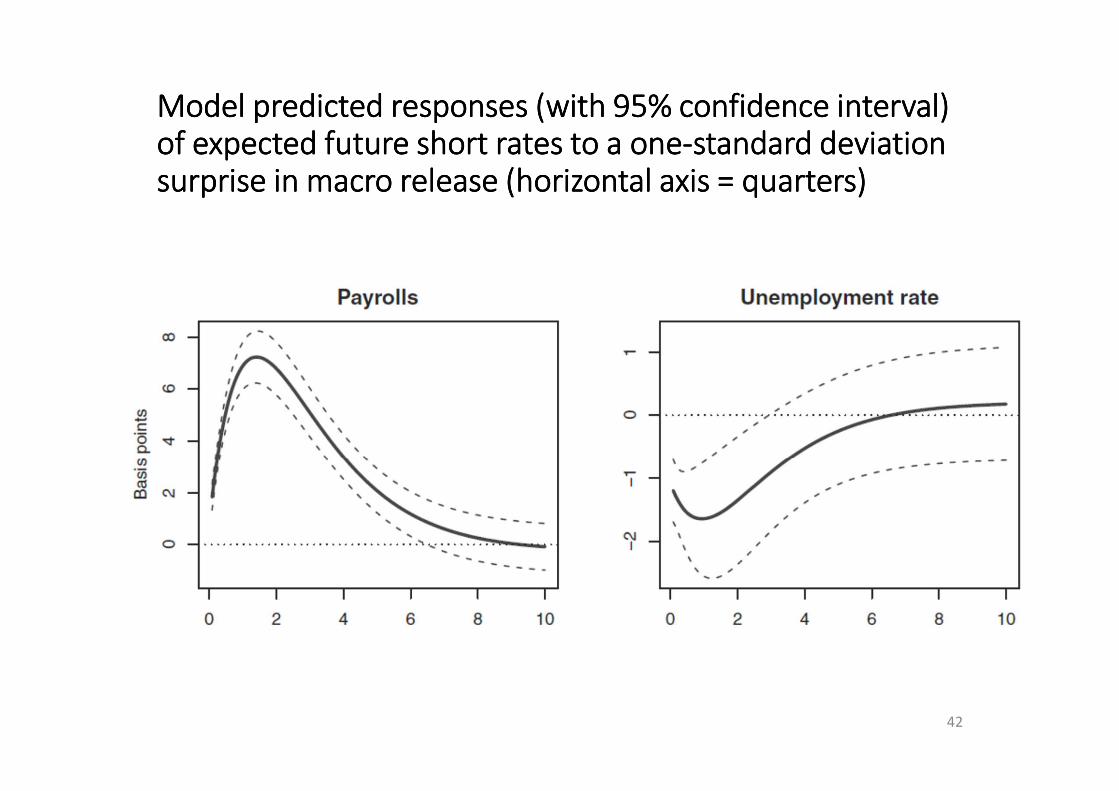
Model predicted responses (with 95% confidence interval) Model predicted responses (with 95% confidence interval) Model predicted responses (with 95% confidence interval) Model predicted responses (with 95% confidence interval) of expected future short rates to a oneof expected future short rates to a oneof expected future short rates to a oneof expected future short rates to a one----standard deviation standard deviation standard deviation standard deviation surprise in macro release (horizontal axis = quarters)surprise in macro release (horizontal axis = quarters)surprise in macro release (horizontal axis = quarters)surprise in macro release (horizontal axis = quarters)
42