Embed Size (px)
Citation preview

No.5-22, Ruei-Shu Valley, Ruei-Ping Tsuen Lin Kou Shiang, Taipei 244 Taiwan, R.O.C. TEL:+886-2-8601-3788 FAX:+886-2-8601-3789 Email:[email protected] http://www.quietek.com
CERTIFICATE
Issued Date: Jan. 04, 2011 Report No. : 10C324R-ITCEP07V06
This is to certify that the following designated product
Product : All in one PC
Trade name : msi
Model Number : MS-AA51, AE2060
Company Name : MICRO-STAR INT’L Co., LTD.
This product, which has been issued the test report listed as above in QuieTek
Laboratory, is based on a single evaluation of one sample and confirmed to
comply with the requirements of the following EMC standard.
EN 55022:2006+A1: 2007 EN 55024: 1998+A1: 2001+A2: 2003
EN 61000-3-2:2006 IEC 61000-4-2: 2008
EN 61000-3-3:2008 IEC 61000-4-3: 2008
IEC 61000-4-4: 2004
IEC 61000-4-5: 2005
IEC 61000-4-6: 2008
IEC 61000-4-8: 2009
IEC 61000-4-11: 2004
TEST LABORATORY
Vincent Lin / Manager

Test Report
Product Name : All in one PC
Model No. : MS-AA51, AE2060
Applicant : MICRO-STAR INT’L Co., LTD.
Address : No. 69, Li-De St., Jung-He City, Taipei Hsien, Taiwan, R.O.C.
Date of Receipt : 2010/12/20
Issued Date : 2011/01/04
Report No. : 10C324R-ITCEP07V06
Report Version : V1.0
The test results relate only to the samples tested.
The test results shown in the test report are traceable to the national/international standard through the calibration of the equipment and evaluated measurement uncertainty herein.
This report must not be used to claim product endorsement by TAF, NVLAP or any agency of the Government.
The test report shall not be reproduced except in full without the written approval of QuieTek Corporation.

Declaration of Conformity We herewith confirm the following designated products to comply with the requirements set out in the Council Directive on the approximation of the laws of the Member States relating to Electromagnetic Compatibility Directive (2004/108/EC) with applicable standards listed below.
Product : All in one PC
Trade name : msi
Model Number : MS-AA51, AE2060
EN 55022: 2006+A1: 2007, Class B
EN 55024: 1998+A1: 2001+A2: 2003
EN 61000-3-2:2006
EN 61000-3-3: 2008
Applicable Harmonized
Standards under Directive
2004/108/EC
:
Company Name :
Company Address :
Telephone : Facsimile :
Person in responsible for marking this declaration:
Name (Full Name) Title/ Department
Date Legal Signature

Quietek Corporation / No.5-22, Ruei-Shu Valley, Ruei-Ping Tsuen Lin Kuo Shiang, Taipei, 244 Taiwan, R.O.C. Tel: 866-2-8601-3788, Fax: +886-2-8601-3789, E-mail: [email protected]
Date: Jan. 04, 2011
QTK No.: 10C324R-ITCEP07V06
Statement o f Conformi ty
This statement is to certify that the designated product below.
Product : All in one PC
Trade name : msi
Model Number : MS-AA51, AE2060
Company Name : MICRO-STAR INT’L Co., LTD.
EN 55022: 2006+A1: 2007, Class B
EN 55024: 1998+A1: 2001+A2: 2003
EN 61000-3-2:2006
EN 61000-3-3:2008
Applicable Standards :
One sample of the designated product has been tested and evaluated in our
laboratory to find in compliance with the applicable standards above. The issued
test report(s) show(s) it in detail.
Report Number : 10C324R-ITCEP07V06
TEST LABORATORY
Vincent Lin / Manager
The verification is based on a single evaluation of one sample of above-mentioned products. It does not imply an assessment of the whole production and does not permit the use of the test lab. Logo.
Accredited by NVLAP, TAF-CNLA, DNV, TUV, Nemko

Report No:10C324R-ITCEP07V06
Page: 2 of 127
Test Report Cert i f icat ion Issued Date : 2011/01/04 Report No. : 10C324R-ITCEP07V06
Product Name : All in one PC
Applicant : MICRO-STAR INT’L Co., LTD.
Address : No. 69, Li-De St., Jung-He City, Taipei Hsien, Taiwan, R.O.C.
Manufacturer : MICRO-STAR INT’L Co., LTD.
Model No. : MS-AA51, AE2060
EUT Rated Voltage : AC 100-240V, 50-60Hz
EUT Test Voltage : AC 230 V / 50 Hz
Trade Name : msi
Applicable Standard : EN 55022: 2006+A1: 2007, Class B
EN 55024: 1998+A1: 2001+A2: 2003
EN 61000-3-2:2006
EN 61000-3-3:2008
Test Result : Complied
Performed Location : Quietek Corporation (Linkou Laboratory)
No.5-22,Ruei-Shu Valley, Ruei-Ping Tsuen Lin Kuo Shiang,
Taipei, 244 Taiwan, R.O.C.
TEL:+866-2-8601-3788 / FAX:+886-2-8601-3789
Documented By :
( Adm. Specialist / Joanne Lin )
Reviewed By :
( Engineer / Harrison Chen )
Approved By :
( Manager / Vincent Lin )

Report No:10C324R-ITCEP07V06
Page: 3 of 127
Laboratory Information We , QuieTek Corporation, are an independent EMC and safety consultancy that was established the whole facility in our laboratories. The test facility has been accredited/accepted (audited or listed) by the following related bodies in compliance with ISO 17025, EN 45001 and specified testing scopes:
The related certificate for our laboratories about the test site and management system can be downloaded from QuieTek Corporation’s Web Site : http://www.quietek.com/tw/ctg/cts/accreditations.htm The address and introduction of QuieTek Corporation’s laboratories can be founded in our Web site : http://www.quietek.com/ If you have any comments, Please don’t hesitate to contact us. Our contact information is as below: HsinChu Testing Laboratory :
No.75-2, 3rd Lin, Wangye Keng, Yonghxing Tsuen, Qionglin Shiang, Hsinchu County 307, Taiwan, R.O.C.TEL:+886-3-592-8858 / FAX:+886-3-592-8859 E-Mail : [email protected]
LinKou Testing Laboratory :
No. 5-22, Ruei-Shu Valley, Ruei-Ping Tsuen, Lin-Kou Shiang, Taipei, Taiwan, R.O.C. TEL : 886-2-8601-3788 / FAX : 886-2-8601-3789 E-Mail : [email protected]
Suzhou (China) Testing Laboratory :
No. 99 Hongye Rd., Suzhou Industrial Park Loufeng Hi-Tech Development Zone., Suzhou,China. TEL : +86-512-6251-5088 / FAX : +86-512-6251-5098 E-Mail : [email protected]
Taiwan R.O.C. : BSMI, NCC, TAF
Germany : TUV Rheinland
Norway : Nemko, DNV
USA : FCC, NVLAP
Japan : VCCI

Report No:10C324R-ITCEP07V06
Page: 4 of 127
TABLE OF CONTENTS Description Page 1. General Information .................................................................................................... 7
1.1. EUT Description ...................................................................................................... 7
1.2. Mode of Operation .................................................................................................. 8
1.3. Tested System Details........................................................................................... 11
1.4. Configuration of Tested System ............................................................................ 12
1.5. EUT Exercise Software ......................................................................................... 13
2. Technical Test ........................................................................................................... 14
2.1. Summary of Test Result ........................................................................................ 14
2.2. List of Test Equipment ........................................................................................... 15
2.3. Measurement Uncertainty ..................................................................................... 18
2.4. Test Environment .................................................................................................. 20
3. Conducted Emission (Main Terminals)...................................................................... 21
3.1. Test Specification .................................................................................................. 21
3.2. Test Setup ............................................................................................................. 21
3.3. Limit....................................................................................................................... 21
3.4. Test Procedure ...................................................................................................... 22
3.5. Deviation from Test Standard ................................................................................ 22
3.6. Test Result ............................................................................................................ 23
3.7. Test Photograph .................................................................................................... 35
4. Conducted Emissions (Telecommunication Ports).................................................... 36
4.1. Test Specification .................................................................................................. 37
4.2. Test Setup ............................................................................................................. 37
4.3. Limit....................................................................................................................... 37
4.4. Test Procedure ...................................................................................................... 38
4.5. Deviation from Test Standard ................................................................................ 38
4.6. Test Result ............................................................................................................ 39
4.7. Test Photograph .................................................................................................... 57
5. Radiated Emission.................................................................................................... 59
5.1. Test Specification .................................................................................................. 59
5.2. Test Setup ............................................................................................................. 59
5.3. Limit....................................................................................................................... 60
5.4. Test Procedure ...................................................................................................... 61
5.5. Deviation from Test Standard ................................................................................ 61
5.6. Test Result ............................................................................................................ 62
5.7. Test Photograph .................................................................................................... 70
6. Harmonic Current Emission ...................................................................................... 73

Report No:10C324R-ITCEP07V06
Page: 5 of 127
6.1. Test Specification .................................................................................................. 73
6.2. Test Setup ............................................................................................................. 73
6.3. Limit....................................................................................................................... 73
6.4. Test Procedure ...................................................................................................... 75
6.5. Deviation from Test Standard ................................................................................ 75
6.6. Test Result ............................................................................................................ 76
6.7. Test Photograph .................................................................................................... 80
7. Voltage Fluctuation and Flicker................................................................................. 81
7.1. Test Specification .................................................................................................. 81
7.2. Test Setup ............................................................................................................. 81
7.3. Limit....................................................................................................................... 81
7.4. Test Procedure ...................................................................................................... 82
7.5. Deviation from Test Standard ................................................................................ 82
7.6. Test Result ............................................................................................................ 83
7.7. Test Photograph .................................................................................................... 83
8. Electrostatic Discharge ............................................................................................. 86
8.1. Test Specification .................................................................................................. 86
8.2. Test Setup ............................................................................................................. 86
8.3. Limit....................................................................................................................... 86
8.4. Test Procedure ...................................................................................................... 87
8.5. Deviation from Test Standard ................................................................................ 87
8.6. Test Result ............................................................................................................ 88
8.7. Test Photograph .................................................................................................... 89
9. Radiated Susceptibility ............................................................................................. 91
9.1. Test Specification .................................................................................................. 91
9.2. Test Setup ............................................................................................................. 91
9.3. Limit....................................................................................................................... 91
9.4. Test Procedure ...................................................................................................... 92
9.5. Deviation from Test Standard ................................................................................ 92
9.6. Test Result ............................................................................................................ 93
9.7. Test Photograph .................................................................................................... 95
10. Electrical Fast Transient/Burst .................................................................................. 96
10.1. Test Specification............................................................................................... 96
10.2. Test Setup.......................................................................................................... 96
10.3. Limit ................................................................................................................... 96
10.4. Test Procedure .................................................................................................. 97
10.5. Deviation from Test Standard............................................................................. 97
10.6. Test Result ......................................................................................................... 98

Report No:10C324R-ITCEP07V06
Page: 6 of 127
10.7. Test Photograph .............................................................................................. 100
11. Surge ...................................................................................................................... 101
11.1. Test Specification............................................................................................. 102
11.2. Test Setup........................................................................................................ 102
11.3. Limit ................................................................................................................. 102
11.4. Test Procedure ................................................................................................ 102
11.5. Deviation from Test Standard........................................................................... 103
11.6. Test Result ....................................................................................................... 104
11.7. Test Photograph .............................................................................................. 106
12. Conducted Susceptibility......................................................................................... 107
12.1. Test Specification............................................................................................. 107
12.2. Test Setup........................................................................................................ 107
12.3. Limit ................................................................................................................. 108
12.4. Test Procedure ................................................................................................ 108
12.5. Deviation from Test Standard........................................................................... 108
12.6. Test Result ....................................................................................................... 109
12.7. Test Photograph ...............................................................................................111
13. Power Frequency Magnetic Field ........................................................................... 112
13.1. Test Specification............................................................................................. 113
13.2. Test Setup........................................................................................................ 113
13.3. Limit ................................................................................................................. 113
13.4. Test Procedure ................................................................................................ 113
13.5. Deviation from Test Standard........................................................................... 113
13.6. Test Result ....................................................................................................... 113
13.7. Test Photograph .............................................................................................. 116
14. Voltage Dips and Interruption.................................................................................. 117
14.1. Test Specification............................................................................................. 117
14.2. Test Setup........................................................................................................ 117
14.3. Limit ................................................................................................................. 117
14.4. Test Procedure ................................................................................................ 118
14.5. Deviation from Test Standard........................................................................... 118
14.6. Test Result ....................................................................................................... 119
14.7. Test Photograph .............................................................................................. 120
15. Attachment.............................................................................................................. 121
EUT Photograph.................................................................................................. 122

Report No:10C324R-ITCEP07V06
Page: 7 of 127
1. General Information
1.1. EUT Description
Product Name All in one PC
Trade Name msi
Model No. MS-AA51, AE2060
Component
Power Adapter (1) MFR: DELTA, M/N: ADP-120ZB BB
Input: AC 100-240V, 50-60Hz, 2.0A
Output: DC 19V, 6.32A
Cable Out: Non-Shielded, 1.8m, with one ferrite core bonded.
Power Cord: Non-Shielded, 1.8m
Power Adapter (2) MFR: DELTA, M/N: ADP-90SB BB
Input: AC 100-240V, 50-60Hz, 1.5A
Output: DC 19V, 4.74A
Cable Out: Non-Shielded, 1.8m, with one ferrite core bonded.
Power Cord: Non-Shielded, 1.8m
Note: The EUT is including two models for different marketing requirement.

Report No:10C324R-ITCEP07V06
Page: 8 of 127
Keyparts List
ITEM Vendor / Model Name Comment
CPU (FCLGA-775 pin) INTEL / E5800 3.2GHz
INTEL / E3400 2.6GHz
SO-DIMM SODIMM, DDR3 SDRAM, 4GB, 667(1333)MHz
3.5" HDD WD / WD3200AAJS 3.5 inch, 320GB, 7200rpm
WD / WD5000AAKS 3.5 inch, 320GB, 7200rpm
WD / WD6400AAKS 3.5 inch, 640GB, 7200rpm
WD / WD10EARS 3.5 inch, 1TB, 5400rpm+
WD / WD15EARS 3.5 inch, 1.5TB, 5400rpm+
WD / WD20EARS 3.5 inch, 2TB, 5400rpm+
ODD HLDS / GT40N --
TSST / TS-L633F --
LCD (20") CMO / M200O1-L02 --
Inverter / Converter MITAC / DA-2A12-MS12L --
Touch panel QUANTA / 21HYECA02J0 --
AC Adapter DELTA / ADP-120ZB BB --
DELTA / ADP-90SB BB --
WiFi Module Atheros / AR5B95 (AW-NE785H) --
TV Tuner (Optional) AverMedia / A336 --
Webcam BISON / BN65M6SA8-020 --
BISON / BN65VHTG3-010 --

Report No:10C324R-ITCEP07V06
Page: 9 of 127
1.2. Mode of Operation QuieTek has verified the construction and function in typical operation. All the test modes were
carried out with the EUT in normal operation, which was shown in this test report and defined as:
Pre-Test Mode Mode 1 Mode 2 Mode 3 Mode 4 Mode 5 Mode 6 Final Test Mode
Emission Mode 1 Mode 2
Immunity Mode 1 Mode 2
ITEM Mode 1
LCD+HDMI 1600*900/ 60Hz
Mode 2
LCD+HDMI 1600*900/ 60Hz
CPU Intel / E5800 3.2GHz Intel / E3400 2.6GHz
3.5" HDD WD / WD20EARS WD / WD15EARS
ODD TSST / TS-L633F HLDS / GT40N
LCD CMO / M200O1-L02 CMO /M200O1-L02
Inverter/ Converter MITAC / DA-2A12-MS12L MITAC / DA-2A12-MS12L
Touch panel QUANTA / 21HYECA02J0 QUANTA / 21HYECA02J0
AC Adapter DELTA / ADP-120ZB BB DELTA / ADP-90SB BB
WiFi Module Atheros / AR5B95 (AW-NE785H) Atheros / AR5B95 (AW-NE785H)
TV Tuner AverMedia / A336 AverMedia / A336
Webcam BISON / BN65VHTG3-010 BISON / BN65M6SA8-020
SO-DIMM SODIMM, DDR3 SDRAM, 4GB,
667(1333)MHz
SODIMM, DDR3 SDRAM, 4GB,
667(1333)MHz

Report No:10C324R-ITCEP07V06
Page: 10 of 127
ITEM Mode 3
LCD+HDMI 1600*900/ 60Hz
Mode 4
LCD+HDMI 1600*900/ 60Hz
CPU Intel / E5800 3.2GHz Intel / E3400 2.6GHz
3.5" HDD WD / WD10EARS WD / WD6400AAKS
ODD TSST / TS-L633F HLDS / GT40N
LCD CMO / M200O1-L02 CMO / M200O1-L02
Inverter/ Converter MITAC / DA-2A12-MS12L MITAC / DA-2A12-MS12L
Touch panel QUANTA / 21HYECA02J0 QUANTA / 21HYECA02J0
AC Adapter DELTA / ADP-120ZB BB DELTA / ADP-90SB BB
WiFi Module Atheros / AR5B95 (AW-NE785H) Atheros / AR5B95 (AW-NE785H)
TV Tuner AverMedia / A336 AverMedia / A336
Webcam BISON / BN65VHTG3-010 BISON / BN65M6SA8-020
SO-DIMM SODIMM, DDR3 SDRAM, 4GB,
667(1333)MHz
SODIMM, DDR3 SDRAM, 4GB,
667(1333)MHz
ITEM Mode 5
LCD+HDMI 1600*900/ 60Hz
Mode 6
LCD+HDMI 1600*900/ 60Hz
CPU Intel / E5800 3.2GHz Intel / E3400 2.6GHz
3.5" HDD WD / WD5000AAKS WD / WD3200AAJS
ODD TSST / TS-L633F HLDS / GT40N
LCD CMO / M200O1-L02 CMO / M200O1-L02
Inverter/ Converter MITAC / DA-2A12-MS12L MITAC / DA-2A12-MS12L
Touch panel QUANTA / 21HYECA02J0 QUANTA / 21HYECA02J0
AC Adapter DELTA / ADP-120ZB BB DELTA / ADP-90SB BB
WiFi Module Atheros / AR5B95 (AW-NE785H) Atheros / AR5B95 (AW-NE785H)
TV Tuner AverMedia / A336 AverMedia / A336
Webcam BISON / BN65M6SA8-020 BISON / BN65VHTG3-010
SO-DIMM SODIMM, DDR3 SDRAM, 4GB,
667(1333)MHz
SODIMM, DDR3 SDRAM, 4GB,
667(1333)MHz

Report No:10C324R-ITCEP07V06
Page: 11 of 127
1.3. Tested System Details The types for all equipments, plus descriptions of all cables used in the tested system (including
inserted cards) are:
Product Manufacturer Model No. Serial No. Power Cord
1 Monitor (EMI) Dell 2408WFPb CN-0G293H-74261-
95M-1H6S
Non-Shielded, 1.8m
Monitor (EMS) LG W2261VT 907YHPB07296 Non-Shielded, 1.8m
2 USB 3.0 BUFFALO HD-H1.0TU3 15476991119601 Shielded, 1.5m
3 USB 3.0 BUFFALO HD-H1.0TU3 15476991119984 Shielded, 1.5m
4 Microphone &
Earphone
Ergotech ET-E201 N/A N/A
5 USB Keyboard (EMI) Dell SK-8175 MY-0W217F-71619-
092-0497-A01
N/A
USB Keyboard (EMS) Logitech Y-UR83 SY848UK N/A
6 USB Mouse Logitech M-UV83 LNA34515276 N/A
7 IPod nano Apple A1236 YM823SUQY0P N/A
8 IPod nano Apple A1236 YM823SWVY0P N/A
9 TS-9980 N/A N/A N/A Non-Shielded, 1.8m
10 Notebook PC DELL PP04X C8YYM1S Non-Shielded, 1.8m

Report No:10C324R-ITCEP07V06
Page: 12 of 127
1.4. Configuration of Tested System
Connection Diagram
Signal Cable Type Signal cable Description
A HDMI Cable Shielded, 1.2m
B USB Cable Shielded, 1m, two PCS.
C Microphone & Earphone Cable Non-Shielded, 1.6m
D USB Keyboard Cable Shielded, 1.8m
E USB Mouse Cable Shielded, 1.8m
F USB Cable Shielded, 1.2m, two PCS.
G Coaxial Cable Shielded, 7m
H LAN Cable Non-Shielded, 7m

Report No:10C324R-ITCEP07V06
Page: 13 of 127
1.5. EUT Exercise Software
1 Setup the EUT and peripheral as shown on Figure
2 Connect the power to EUT and peripherals, then turn on the power of all equipments.
3 Waiting for EUT to enter Windows Operating System, and adjust the display resolution to the test
mode first.
4 Connect LAN and Telecom to Notebook for transmitting data.
5 Activate Wireless interface and Bluetooth function, and perform the wireless data communication
with the other Notebook (write/delete action).
6 Run Windows Media Player program and play a disk with color Bar pattern
7 Run “H" pattern.
8 Begin to test and repeat the above procedure (4)~(7)

Report No:10C324R-ITCEP07V06
Page: 14 of 127
2. Technical Test
2.1. Summary of Test Result
No deviations from the test standards
Deviations from the test standards as below description:
Emission
Performed Item Normative References Test
Performed Deviation
Conducted Emission EN 55022: 2006+A1: 2007 Yes No
Impedance Stabilization
Network
EN 55022: 2006+A1: 2007 Yes No
Radiated Emission EN 55022: 2006+A1: 2007 Yes No
Power Harmonics EN 61000-3-2:2006 Yes No
Voltage Fluctuation and Flicker EN 61000-3-3:2008 Yes No
Immunity
Performed Item Normative References Test
Performed Deviation
Electrostatic Discharge IEC 61000-4-2: 2008 Yes No
Radiated susceptibility IEC 61000-4-3: 2008 Yes No
Electrical fast transient/burst IEC 61000-4-4: 2004 Yes No
Surge IEC 61000-4-5: 2005 Yes No
Conducted susceptibility IEC 61000-4-6: 2008 Yes No
Power frequency magnetic field IEC 61000-4-8: 2009 Yes No
Voltage dips and interruption IEC 61000-4-11: 2004 Yes No

Report No:10C324R-ITCEP07V06
Page: 15 of 127
2.2. List of Test Equipment Conducted Emission / SR8 Instrument Manufacturer Type No. Serial No Cal. Date EMI Test Receiver R&S ESCS 30 838251/001 2010/04/27 LISN R&S ESH3-Z5 836679/020 2010/02/17 LISN R&S ENV216 100097 2010/05/28 Pulse Limiter R&S ESH3-Z2 100324 2010/04/16
Impedance Stabilization Network / SR8 Instrument Manufacturer Type No. Serial No Cal. Date Capacitive Voltage Probe Schaffner CVP2200A 18331 2010/11/16 EMI Test Receiver R&S ESCS 30 838251/001 2010/04/27 LISN R&S ESH3-Z5 836679/020 2010/02/17 LISN R&S ENV216 100097 2010/05/28 Pulse Limiter R&S ESH3-Z2 100324 2010/04/16 RF Current Probe FCC F-65 10KHz~1GHz 198 2010/11/13 BALANCED TELECOM ISN FCC FCC-TLISN-T2-02 20621 2010/08/15 BALANCED TELECOM ISN FCC FCC-TLISN-T4-02 20622 2010/08/15 BALANCED TELECOM ISN FCC FCC-TLISN-T8-02 20623 2010/08/15
Radiated Emission / Site1 Instrument Manufacturer Type No. Serial No Cal. Date Bilog Antenna Schaffner Chase CBL6112B 2918 2010/08/01 Broadband Horn Antenna Schwarzbeck BBHA9170 209 2010/07/25 EMI Test Receiver R&S ESCS 30 100121 2010/11/25 Horn Antenna Schwarzbeck BBHA9120D 305 2010/08/26 Pre-Amplifier QTK N/A N/A 2010/08/01 Spectrum Analyzer Advantest R3162 100803482 2010/11/10
Radiated Emission / 9x6x6_Chamber Instrument Manufacturer Type No. Serial No Cal. Date Spectrum Analyzer (9K-26.5GHz)
Agilent E4408B MY45102743 2010/08/12
Horn Antenna Schwarzbeck 9120D 576 2010/10/21 Pre-Amplifier QuieTek AP-180C CHM/071920 2010/08/01 Power Harmonics / SR3 Instrument Manufacturer Type No. Serial No Cal. Date AC Power Source(Harmonic)
Schaffner NSG 1007 HK54148 2010/08/11
IEC1000-4-X Analyzer(Flicker)
Schaffner CCN 1000-1 X7 1887 2010/08/11
Voltage Fluctuation and Flicker / SR3 Instrument Manufacturer Type No. Serial No Cal. Date AC Power Source(Harmonic)
Schaffner NSG 1007 HK54148 2010/08/11
IEC1000-4-X Analyzer(Flicker)
Schaffner CCN 1000-1 X7 1887 2010/08/11

Report No:10C324R-ITCEP07V06
Page: 16 of 127
Electrostatic Discharge / SR6 Instrument Manufacturer Type No. Serial No Cal. Date ESD Simulator System Noiseken TC-815R ESS0929097 2010/07/06 Horizontal Coupling Plane(HCP)
QuieTek HCP AL50 N/A N/A
Vertical Coupling Plane(VCP)
QuieTek VCP AL50 N/A N/A
Radiated susceptibility / CB5 Instrument Manufacturer Type No. Serial No Cal. Date
AF-BOX R&S AF-BOX ACCUST
100007 N/A
Audio Analyzer R&S UPL 16 100137 2010/04/15 Biconilog Antenna EMCO 3149 00071675 N/A Directional Coupler A&R DC 6180 22735 N/A Dual Microphone Supply B&K 5935 2426784 2010/04/16 Mouth Simulator B&K 4227 2439692 2010/04/16 Power Amplifier A&R 30S1G3 309453 N/A Power Amplifier A&R 100W10000M7 A285000010 N/A Power Amplifier SCHAFFNER CBA9413B 4020 N/A Power Amplifier AR 75A250A 0325371 N/A Power Meter R&S NRVD(P.M) 100219 2010/04/16 Pre-Amplifier A&R 150A220 23067 N/A Probe Microphone B&K 4182 2278070 2010/04/16 Signal Generator R&S SML03 103330 2010/09/08 Electrical fast transient/burst / SR6 Instrument Manufacturer Type No. Serial No Cal. Date EMC immunity system Thermo EMCPRO PLUS 0411225 2010/03/10 Surge / SR6 Instrument Manufacturer Type No. Serial No Cal. Date EMC immunity system Thermo EMCPRO PLUS 0411225 2010/03/10 Conducted susceptibility / SR6 Instrument Manufacturer Type No. Serial No Cal. Date Schaffner NSG 2070 RF-Generator
Schaffner N/A N/A
2010/04/21
Power frequency magnetic field / SR3 Instrument Manufacturer Type No. Serial No Cal. Date Induction Coil Interface Schaffner INA 2141 6002 N/A Magnetic Loop Coil Schaffner INA 702 160 N/A Triaxial ELF Magnetic Field Meter
F.B.BELL 4090 114135 2010/03/27
Voltage dips and interruption / SR6 Instrument Manufacturer Type No. Serial No Cal. Date EMC immunity system Thermo EMCPRO PLUS 0411225 2010/03/10
Report No:10C324R-ITCEP07V06
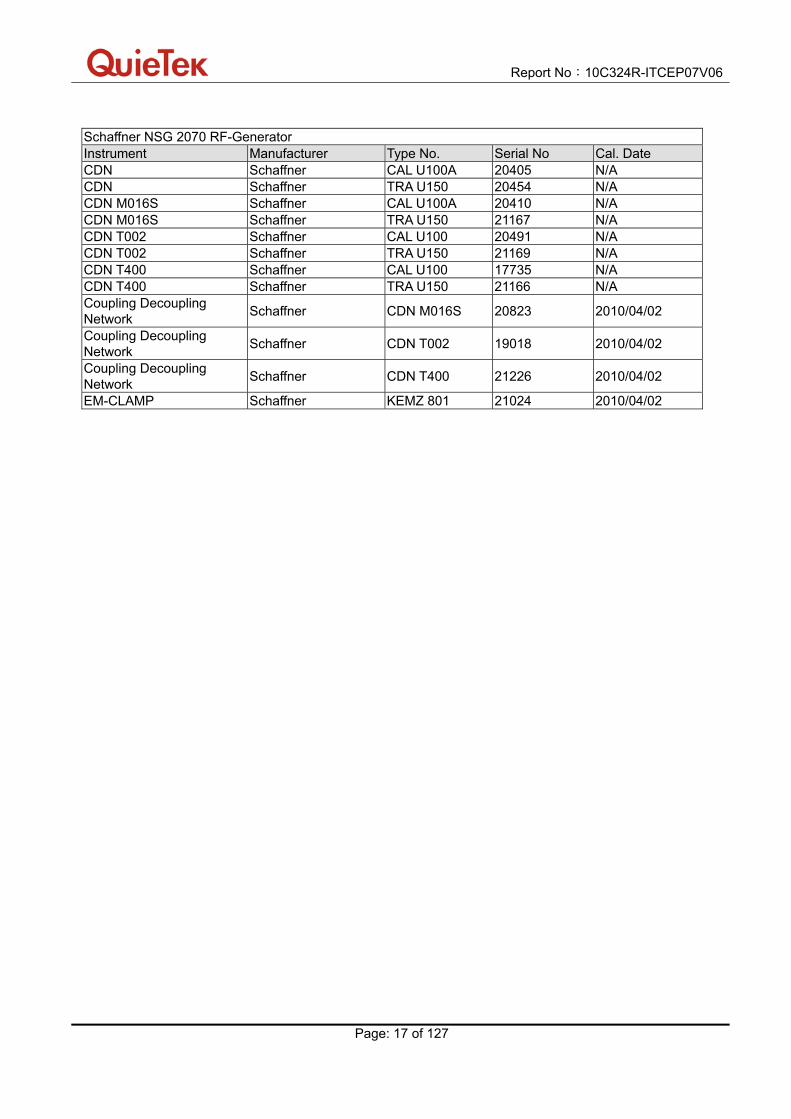
Page: 17 of 127
Schaffner NSG 2070 RF-Generator Instrument Manufacturer Type No. Serial No Cal. Date CDN Schaffner CAL U100A 20405 N/A CDN Schaffner TRA U150 20454 N/A CDN M016S Schaffner CAL U100A 20410 N/A CDN M016S Schaffner TRA U150 21167 N/A CDN T002 Schaffner CAL U100 20491 N/A CDN T002 Schaffner TRA U150 21169 N/A CDN T400 Schaffner CAL U100 17735 N/A CDN T400 Schaffner TRA U150 21166 N/A Coupling Decoupling Network
Schaffner CDN M016S 20823 2010/04/02
Coupling Decoupling Network
Schaffner CDN T002 19018 2010/04/02
Coupling Decoupling Network
Schaffner CDN T400 21226 2010/04/02
EM-CLAMP Schaffner KEMZ 801 21024 2010/04/02
Report No:10C324R-ITCEP07V06
Page: 18 of 127
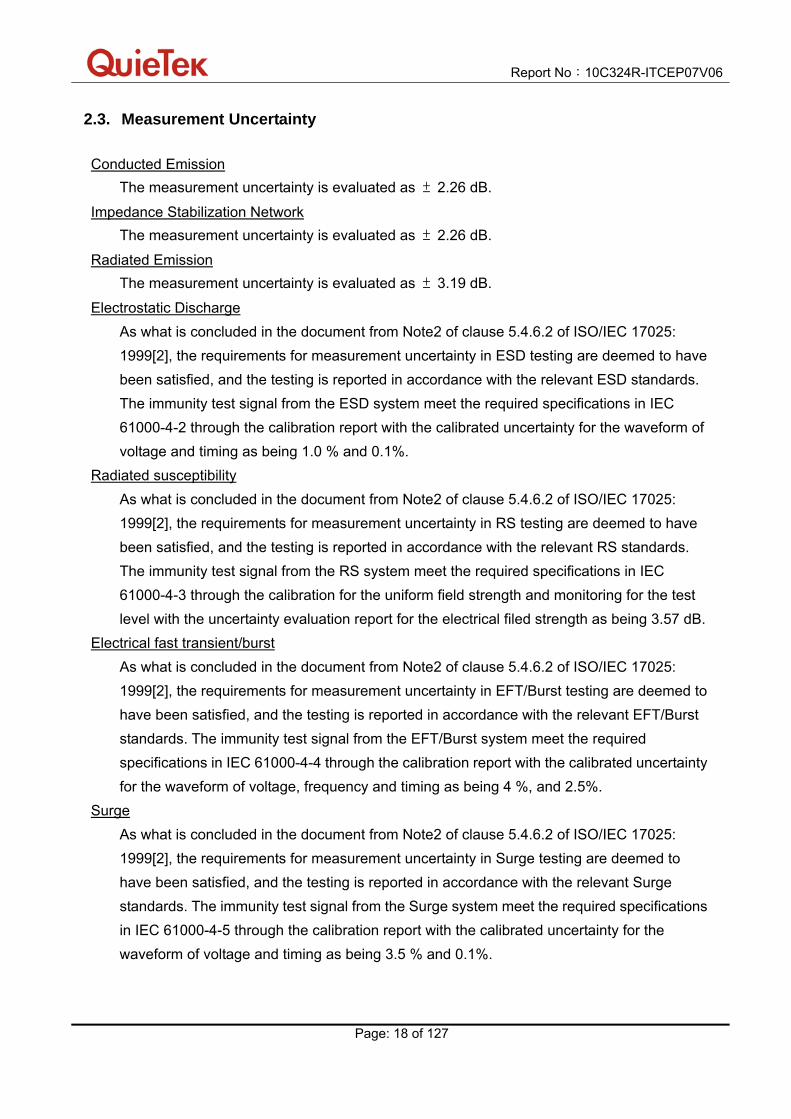
2.3. Measurement Uncertainty
Conducted Emission
The measurement uncertainty is evaluated as ± 2.26 dB.
Impedance Stabilization Network
The measurement uncertainty is evaluated as ± 2.26 dB.
Radiated Emission
The measurement uncertainty is evaluated as ± 3.19 dB.
Electrostatic Discharge
As what is concluded in the document from Note2 of clause 5.4.6.2 of ISO/IEC 17025:
1999[2], the requirements for measurement uncertainty in ESD testing are deemed to have
been satisfied, and the testing is reported in accordance with the relevant ESD standards.
The immunity test signal from the ESD system meet the required specifications in IEC
61000-4-2 through the calibration report with the calibrated uncertainty for the waveform of
voltage and timing as being 1.0 % and 0.1%.
Radiated susceptibility
As what is concluded in the document from Note2 of clause 5.4.6.2 of ISO/IEC 17025:
1999[2], the requirements for measurement uncertainty in RS testing are deemed to have
been satisfied, and the testing is reported in accordance with the relevant RS standards.
The immunity test signal from the RS system meet the required specifications in IEC
61000-4-3 through the calibration for the uniform field strength and monitoring for the test
level with the uncertainty evaluation report for the electrical filed strength as being 3.57 dB.
Electrical fast transient/burst
As what is concluded in the document from Note2 of clause 5.4.6.2 of ISO/IEC 17025:
1999[2], the requirements for measurement uncertainty in EFT/Burst testing are deemed to
have been satisfied, and the testing is reported in accordance with the relevant EFT/Burst
standards. The immunity test signal from the EFT/Burst system meet the required
specifications in IEC 61000-4-4 through the calibration report with the calibrated uncertainty
for the waveform of voltage, frequency and timing as being 4 %, and 2.5%.
Surge
As what is concluded in the document from Note2 of clause 5.4.6.2 of ISO/IEC 17025:
1999[2], the requirements for measurement uncertainty in Surge testing are deemed to
have been satisfied, and the testing is reported in accordance with the relevant Surge
standards. The immunity test signal from the Surge system meet the required specifications
in IEC 61000-4-5 through the calibration report with the calibrated uncertainty for the
waveform of voltage and timing as being 3.5 % and 0.1%.
Report No:10C324R-ITCEP07V06
Page: 19 of 127
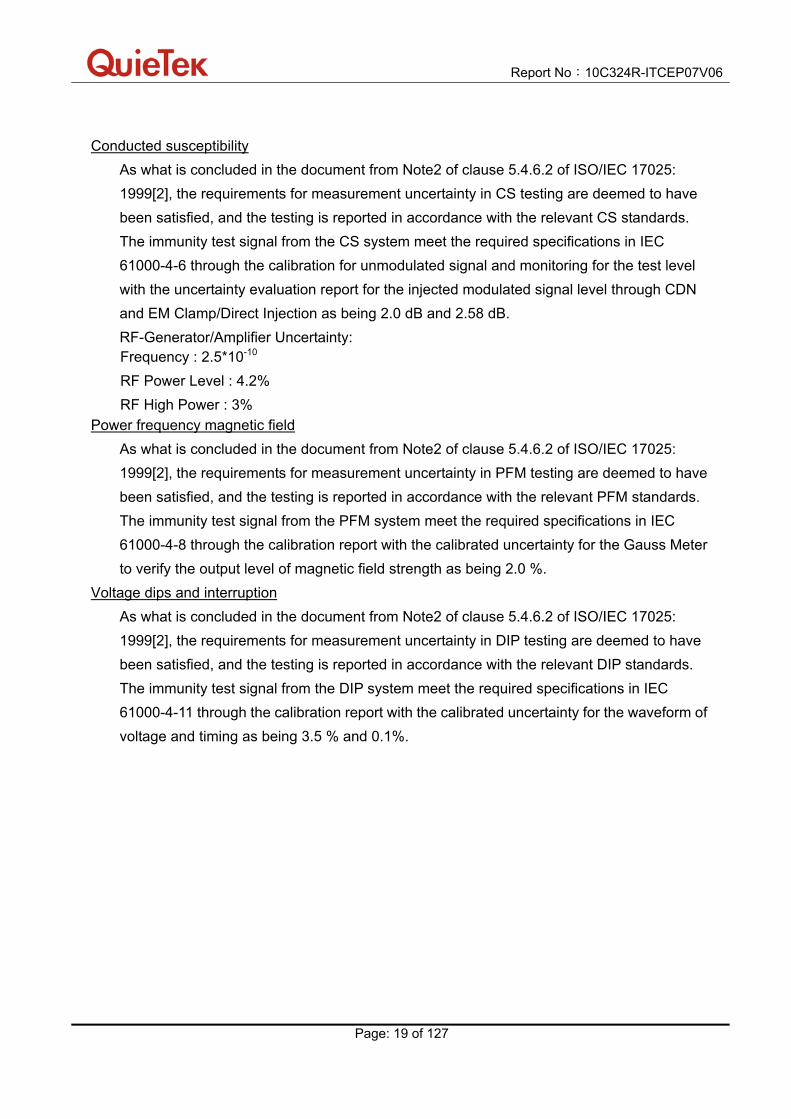
Conducted susceptibility
As what is concluded in the document from Note2 of clause 5.4.6.2 of ISO/IEC 17025:
1999[2], the requirements for measurement uncertainty in CS testing are deemed to have
been satisfied, and the testing is reported in accordance with the relevant CS standards.
The immunity test signal from the CS system meet the required specifications in IEC
61000-4-6 through the calibration for unmodulated signal and monitoring for the test level
with the uncertainty evaluation report for the injected modulated signal level through CDN
and EM Clamp/Direct Injection as being 2.0 dB and 2.58 dB.
RF-Generator/Amplifier Uncertainty: Frequency : 2.5*10-10
RF Power Level : 4.2%
RF High Power : 3% Power frequency magnetic field
As what is concluded in the document from Note2 of clause 5.4.6.2 of ISO/IEC 17025:
1999[2], the requirements for measurement uncertainty in PFM testing are deemed to have
been satisfied, and the testing is reported in accordance with the relevant PFM standards.
The immunity test signal from the PFM system meet the required specifications in IEC
61000-4-8 through the calibration report with the calibrated uncertainty for the Gauss Meter
to verify the output level of magnetic field strength as being 2.0 %.
Voltage dips and interruption
As what is concluded in the document from Note2 of clause 5.4.6.2 of ISO/IEC 17025:
1999[2], the requirements for measurement uncertainty in DIP testing are deemed to have
been satisfied, and the testing is reported in accordance with the relevant DIP standards.
The immunity test signal from the DIP system meet the required specifications in IEC
61000-4-11 through the calibration report with the calibrated uncertainty for the waveform of
voltage and timing as being 3.5 % and 0.1%.

Report No:10C324R-ITCEP07V06
Page: 20 of 127
2.4. Test Environment
Performed Item Items Required Actual
Temperature (C) 15-35 25
Conducted Emission Humidity (%RH) 25-75 50
Barometric pressure (mbar) 860-1060 950-1000
Temperature (C) 15-35 25
Impedance Stabilization
Network Humidity (%RH) 25-75 50
Barometric pressure (mbar) 860-1060 950-1000
Temperature (C) 15-35 25
Radiated Emission Humidity (%RH) 25-75 50
Barometric pressure (mbar) 860-1060 950-1000
Temperature (C) 15-35 21
Electrostatic Discharge Humidity (%RH) 30-60 51
Barometric pressure (mbar) 860-1060 950-1000
Temperature (C) 15-35 21
Radiated susceptibility Humidity (%RH) 25-75 51
Barometric pressure (mbar) 860-1060 950-1000
Temperature (C) 15-35 21
Electrical fast transient/burst Humidity (%RH) 25-75 51
Barometric pressure (mbar) 860-1060 950-1000
Temperature (C) 15-35 21
Surge Humidity (%RH) 10-75 51
Barometric pressure (mbar) 860-1060 950-1000
Temperature (C) 15-35 21
Conducted susceptibility Humidity (%RH) 25-75 51
Barometric pressure (mbar) 860-1060 950-1000
Temperature (C) 15-35 21
Power frequency magnetic
field Humidity (%RH) 25-75 51
Barometric pressure (mbar) 860-1060 950-1000
Temperature (C) 15-35 21
Voltage dips and interruption Humidity (%RH) 25-75 51
Barometric pressure (mbar) 860-1060 950-1000

Report No:10C324R-ITCEP07V06
Page: 21 of 127
3. Conducted Emission (Main Terminals)
3.1. Test Specification
According to EMC Standard : EN 55022
3.2. Test Setup
3.3. Limit
Limits
Frequency (MHz)
QP (dBuV)
AV (dBuV)
0.15 - 0.50 66 - 56 56 – 46
0.50-5.0 56 46
5.0 - 30 60 50
Remarks: In the above table, the tighter limit applies at the band edges.

Report No:10C324R-ITCEP07V06
Page: 22 of 127
3.4. Test Procedure
The EUT and simulators are connected to the main power through a line impedance
stabilization network (L.I.S.N.). This provides a 50 ohm /50uH coupling impedance for the
measuring equipment. The peripheral devices are also connected to the main power through
a LISN that provides a 50ohm/50uH coupling impedance with 50ohm termination.
(Please refers to the block diagram of the test setup and photographs.)
Both sides of A.C. line are checked for maximum conducted interference. In order to find the
maximum emission, the relative positions of equipment and all of the interface cables must
be changed on conducted measurement.
Conducted emissions were invested over the frequency range from 0.15MHz to 30MHz using
a receiver bandwidth of 9kHz.
3.5. Deviation from Test Standard
No deviation.

Report No:10C324R-ITCEP07V06
Page: 23 of 127
3.6. Test Result
Site : SR-8 Time : 2010/12/24 - 11:58
Limit : CISPR_B_00M_QP Margin : 10
Probe : ENV216-L1 - Line1 Power : AC 230V/50Hz
EUT : All in one PC Note : Mode 1
Report No:10C324R-ITCEP07V06
Page: 24 of 127
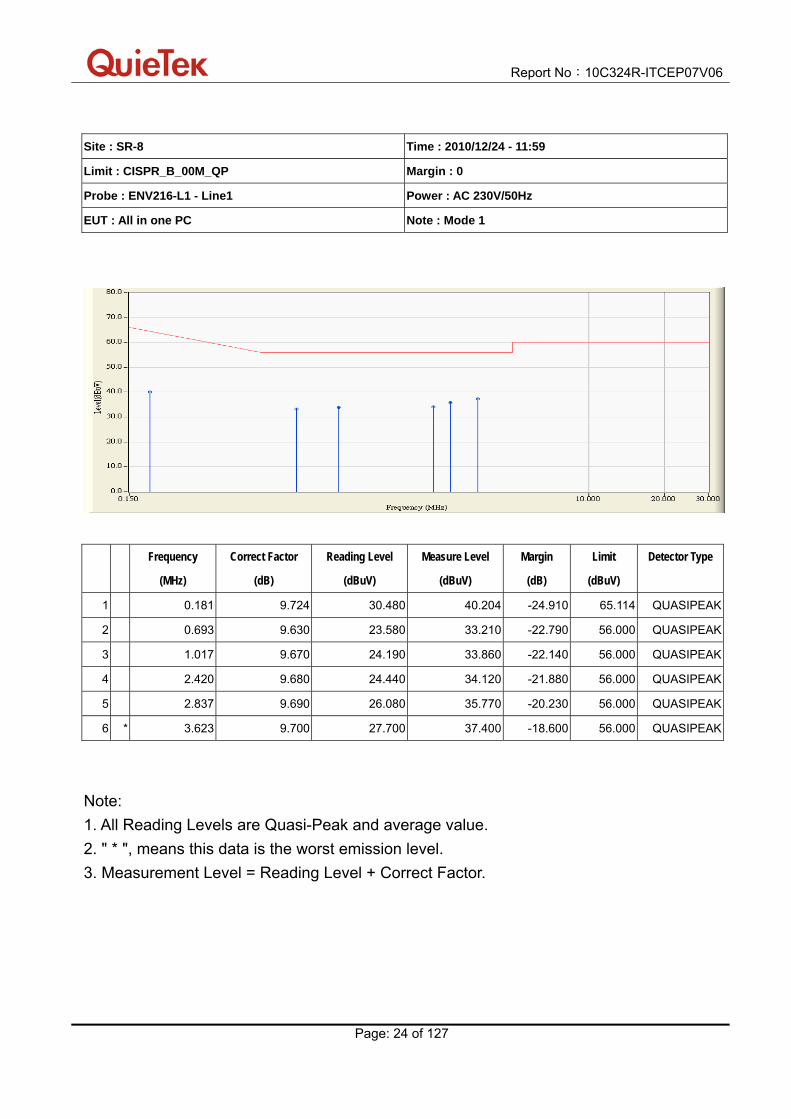
Site : SR-8 Time : 2010/12/24 - 11:59
Limit : CISPR_B_00M_QP Margin : 0
Probe : ENV216-L1 - Line1 Power : AC 230V/50Hz
EUT : All in one PC Note : Mode 1
Frequency
(MHz)
Correct Factor
(dB)
Reading Level
(dBuV)
Measure Level
(dBuV)
Margin
(dB)
Limit
(dBuV)
Detector Type
1 0.181 9.724 30.480 40.204 -24.910 65.114 QUASIPEAK
2 0.693 9.630 23.580 33.210 -22.790 56.000 QUASIPEAK
3 1.017 9.670 24.190 33.860 -22.140 56.000 QUASIPEAK
4 2.420 9.680 24.440 34.120 -21.880 56.000 QUASIPEAK
5 2.837 9.690 26.080 35.770 -20.230 56.000 QUASIPEAK
6 * 3.623 9.700 27.700 37.400 -18.600 56.000 QUASIPEAK
Note:
1. All Reading Levels are Quasi-Peak and average value.
2. " * ", means this data is the worst emission level.
3. Measurement Level = Reading Level + Correct Factor.

Report No:10C324R-ITCEP07V06
Page: 25 of 127
Site : SR-8 Time : 2010/12/24 - 11:59
Limit : CISPR_B_00M_AV Margin : 0
Probe : ENV216-L1 - Line1 Power : AC 230V/50Hz
EUT : All in one PC Note : Mode 1
Frequency
(MHz)
Correct Factor
(dB)
Reading Level
(dBuV)
Measure Level
(dBuV)
Margin
(dB)
Limit
(dBuV)
Detector Type
1 0.181 9.724 19.210 28.934 -26.180 55.114 AVERAGE
2 0.693 9.630 15.760 25.390 -20.610 46.000 AVERAGE
3 1.017 9.670 14.460 24.130 -21.870 46.000 AVERAGE
4 2.420 9.680 17.780 27.460 -18.540 46.000 AVERAGE
5 2.837 9.690 19.220 28.910 -17.090 46.000 AVERAGE
6 * 3.623 9.700 21.710 31.410 -14.590 46.000 AVERAGE
Note:
1. All Reading Levels are Quasi-Peak and average value.
2. " * ", means this data is the worst emission level.
3. Measurement Level = Reading Level + Correct Factor.
Report No:10C324R-ITCEP07V06
Page: 26 of 127
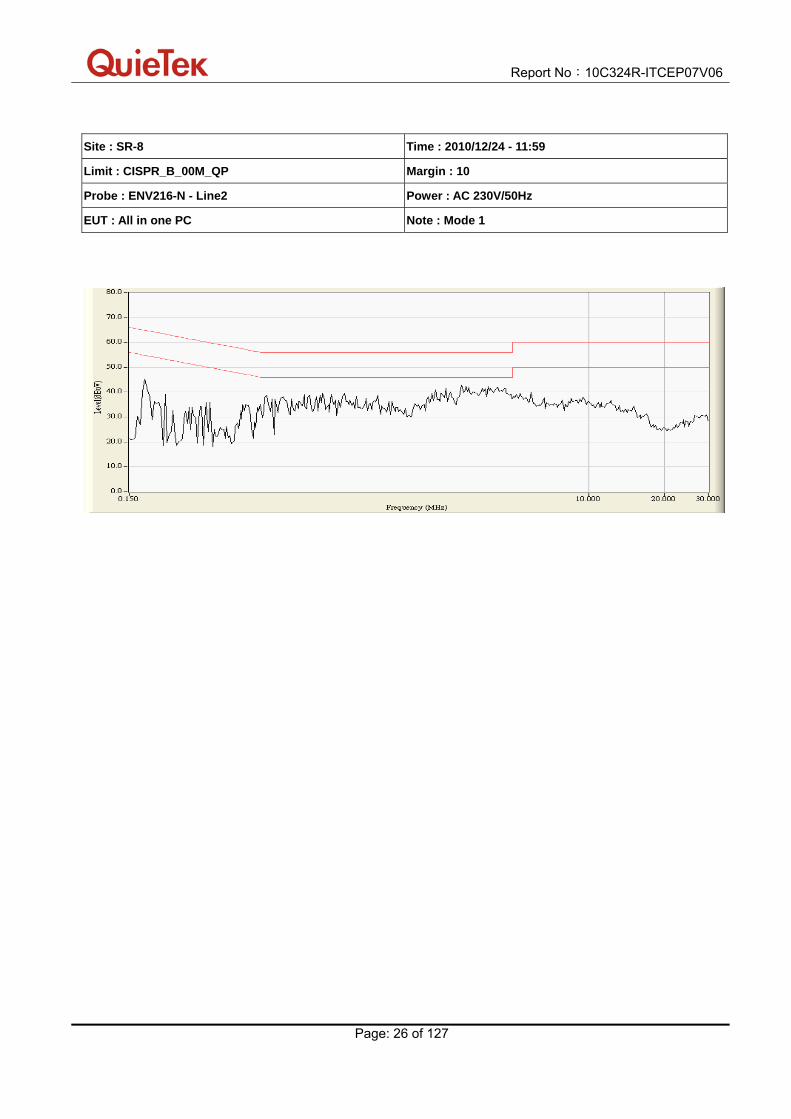
Site : SR-8 Time : 2010/12/24 - 11:59
Limit : CISPR_B_00M_QP Margin : 10
Probe : ENV216-N - Line2 Power : AC 230V/50Hz
EUT : All in one PC Note : Mode 1

Report No:10C324R-ITCEP07V06
Page: 27 of 127
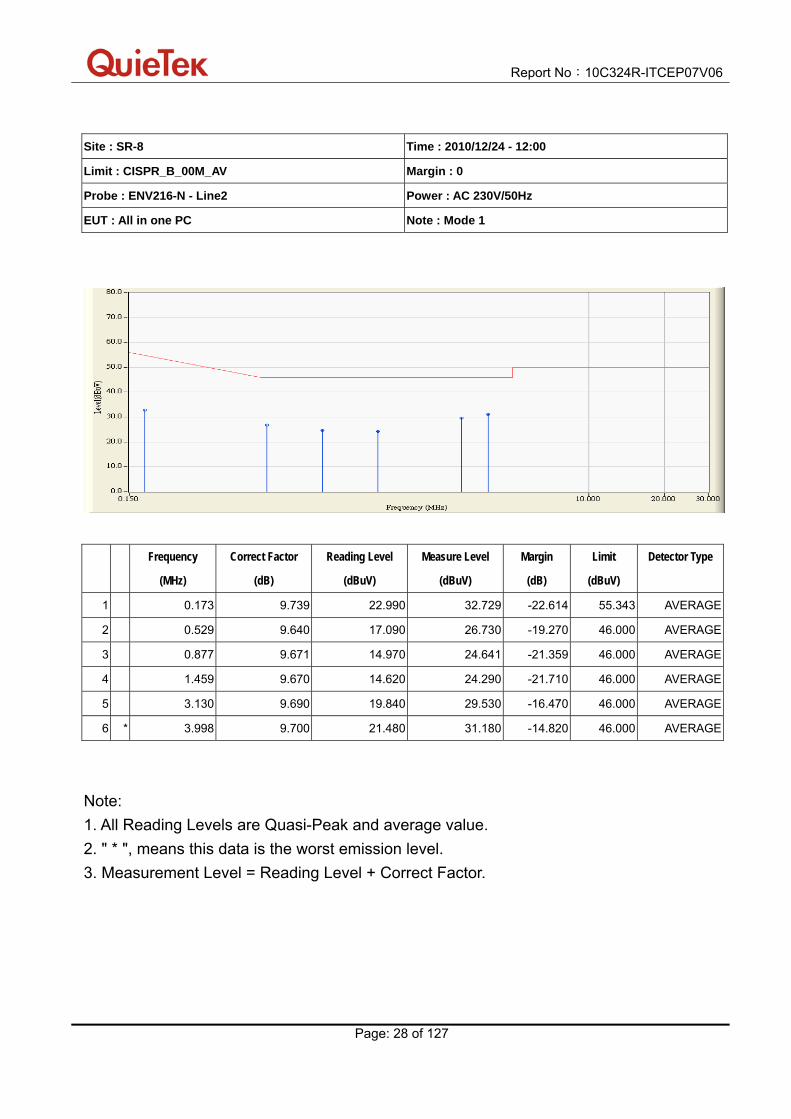
Site : SR-8 Time : 2010/12/24 - 12:00
Limit : CISPR_B_00M_QP Margin : 0
Probe : ENV216-N - Line2 Power : AC 230V/50Hz
EUT : All in one PC Note : Mode 1
Frequency
(MHz)
Correct Factor
(dB)
Reading Level
(dBuV)
Measure Level
(dBuV)
Margin
(dB)
Limit
(dBuV)
Detector Type
1 0.173 9.739 31.620 41.359 -23.984 65.343 QUASIPEAK
2 0.529 9.640 26.330 35.970 -20.030 56.000 QUASIPEAK
3 0.877 9.671 24.870 34.541 -21.459 56.000 QUASIPEAK
4 1.459 9.670 22.800 32.470 -23.530 56.000 QUASIPEAK
5 3.130 9.690 26.100 35.790 -20.210 56.000 QUASIPEAK
6 * 3.998 9.700 27.210 36.910 -19.090 56.000 QUASIPEAK
Note:
1. All Reading Levels are Quasi-Peak and average value.
2. " * ", means this data is the worst emission level.
3. Measurement Level = Reading Level + Correct Factor.
Report No:10C324R-ITCEP07V06
Page: 28 of 127
Site : SR-8 Time : 2010/12/24 - 12:00
Limit : CISPR_B_00M_AV Margin : 0
Probe : ENV216-N - Line2 Power : AC 230V/50Hz
EUT : All in one PC Note : Mode 1
Frequency
(MHz)
Correct Factor
(dB)
Reading Level
(dBuV)
Measure Level
(dBuV)
Margin
(dB)
Limit
(dBuV)
Detector Type
1 0.173 9.739 22.990 32.729 -22.614 55.343 AVERAGE
2 0.529 9.640 17.090 26.730 -19.270 46.000 AVERAGE
3 0.877 9.671 14.970 24.641 -21.359 46.000 AVERAGE
4 1.459 9.670 14.620 24.290 -21.710 46.000 AVERAGE
5 3.130 9.690 19.840 29.530 -16.470 46.000 AVERAGE
6 * 3.998 9.700 21.480 31.180 -14.820 46.000 AVERAGE
Note:
1. All Reading Levels are Quasi-Peak and average value.
2. " * ", means this data is the worst emission level.
3. Measurement Level = Reading Level + Correct Factor.
Report No:10C324R-ITCEP07V06
Page: 29 of 127
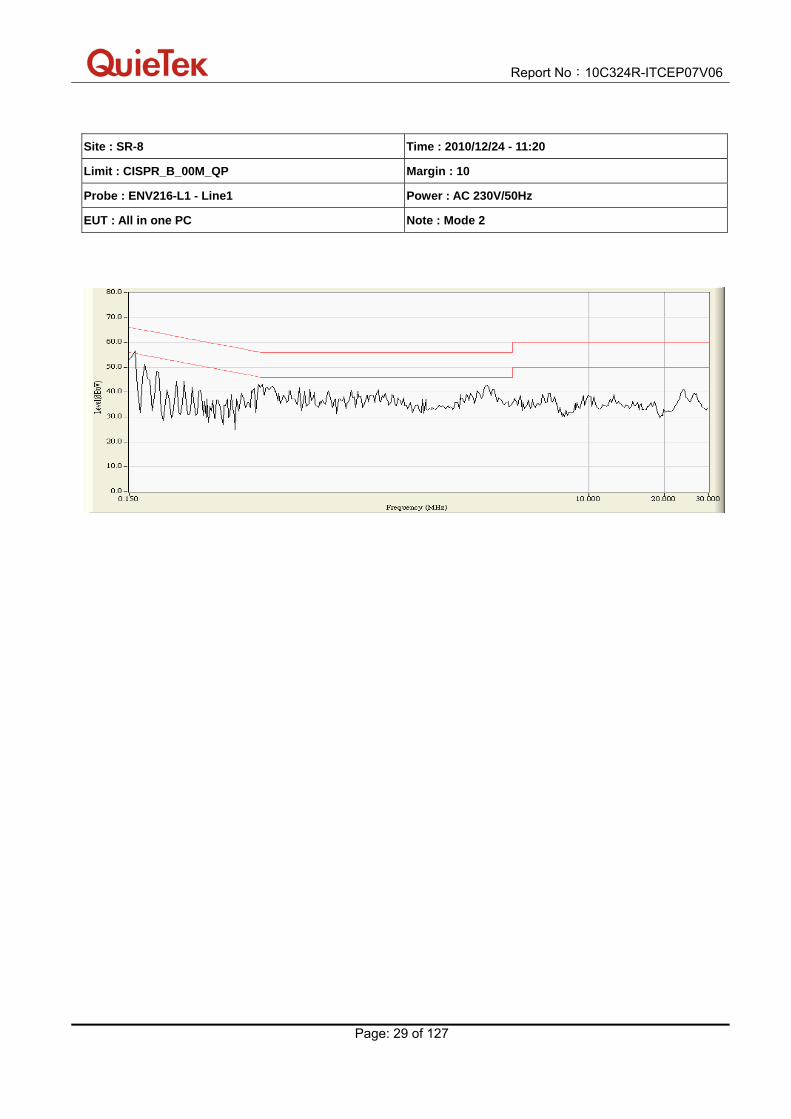
Site : SR-8 Time : 2010/12/24 - 11:20
Limit : CISPR_B_00M_QP Margin : 10
Probe : ENV216-L1 - Line1 Power : AC 230V/50Hz
EUT : All in one PC Note : Mode 2
Report No:10C324R-ITCEP07V06
Page: 30 of 127
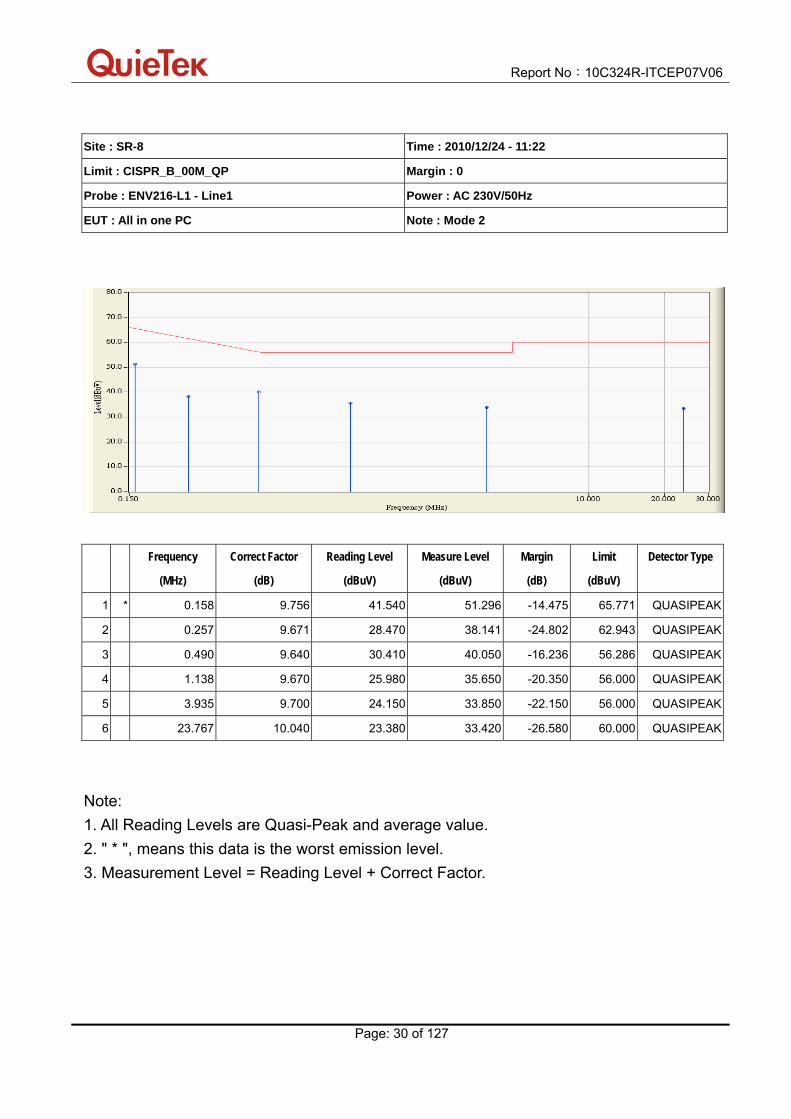
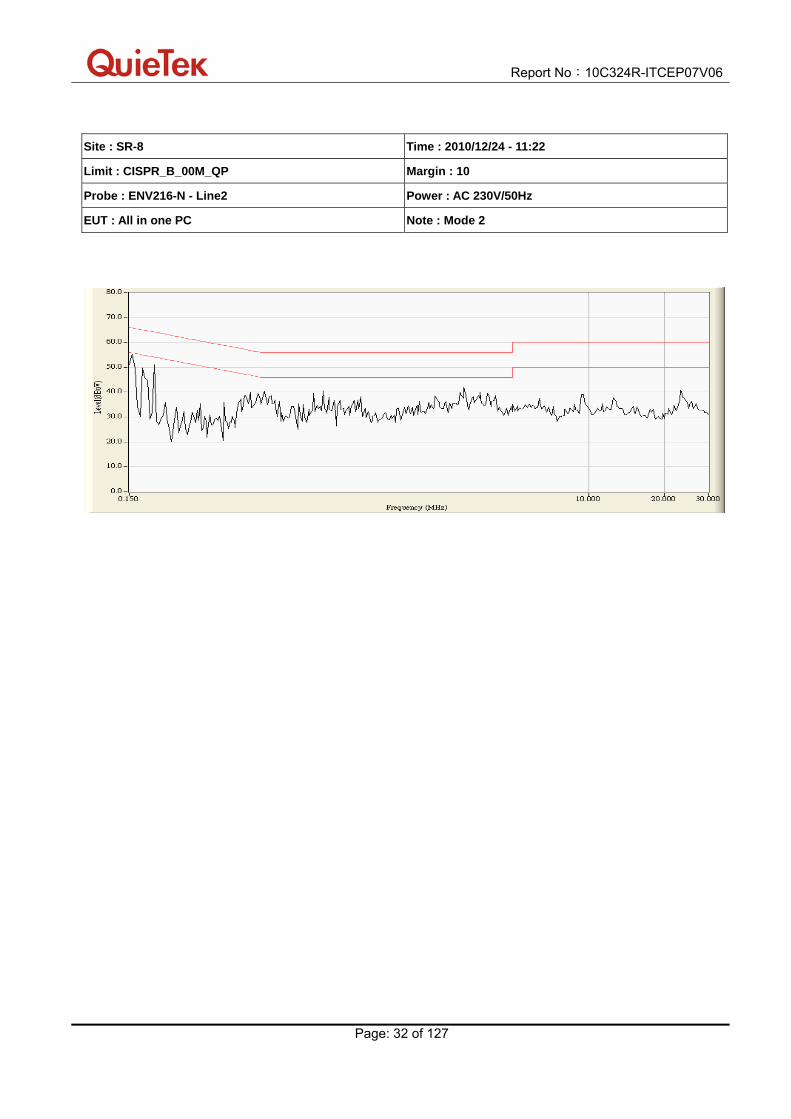
Site : SR-8 Time : 2010/12/24 - 11:22
Limit : CISPR_B_00M_QP Margin : 0
Probe : ENV216-L1 - Line1 Power : AC 230V/50Hz
EUT : All in one PC Note : Mode 2
Frequency
(MHz)
Correct Factor
(dB)
Reading Level
(dBuV)
Measure Level
(dBuV)
Margin
(dB)
Limit
(dBuV)
Detector Type
1 * 0.158 9.756 41.540 51.296 -14.475 65.771 QUASIPEAK
2 0.257 9.671 28.470 38.141 -24.802 62.943 QUASIPEAK
3 0.490 9.640 30.410 40.050 -16.236 56.286 QUASIPEAK
4 1.138 9.670 25.980 35.650 -20.350 56.000 QUASIPEAK
5 3.935 9.700 24.150 33.850 -22.150 56.000 QUASIPEAK
6 23.767 10.040 23.380 33.420 -26.580 60.000 QUASIPEAK
Note:
1. All Reading Levels are Quasi-Peak and average value.
2. " * ", means this data is the worst emission level.
3. Measurement Level = Reading Level + Correct Factor.

Report No:10C324R-ITCEP07V06
Page: 31 of 127
Site : SR-8 Time : 2010/12/24 - 11:22
Limit : CISPR_B_00M_AV Margin : 0
Probe : ENV216-L1 - Line1 Power : AC 230V/50Hz
EUT : All in one PC Note : Mode 2
Frequency
(MHz)
Correct Factor
(dB)
Reading Level
(dBuV)
Measure Level
(dBuV)
Margin
(dB)
Limit
(dBuV)
Detector Type
1 0.158 9.756 23.370 33.126 -22.645 55.771 AVERAGE
2 0.257 9.671 13.560 23.231 -29.712 52.943 AVERAGE
3 * 0.490 9.640 20.260 29.900 -16.386 46.286 AVERAGE
4 1.138 9.670 15.390 25.060 -20.940 46.000 AVERAGE
5 3.935 9.700 16.590 26.290 -19.710 46.000 AVERAGE
6 23.767 10.040 16.450 26.490 -23.510 50.000 AVERAGE
Note:
1. All Reading Levels are Quasi-Peak and average value.
2. " * ", means this data is the worst emission level.
3. Measurement Level = Reading Level + Correct Factor.
Report No:10C324R-ITCEP07V06
Page: 32 of 127
Site : SR-8 Time : 2010/12/24 - 11:22
Limit : CISPR_B_00M_QP Margin : 10
Probe : ENV216-N - Line2 Power : AC 230V/50Hz
EUT : All in one PC Note : Mode 2

Report No:10C324R-ITCEP07V06
Page: 33 of 127
Site : SR-8 Time : 2010/12/24 - 11:24
Limit : CISPR_B_00M_QP Margin : 0
Probe : ENV216-N - Line2 Power : AC 230V/50Hz
EUT : All in one PC Note : Mode 2
Frequency
(MHz)
Correct Factor
(dB)
Reading Level
(dBuV)
Measure Level
(dBuV)
Margin
(dB)
Limit
(dBuV)
Detector Type
1 * 0.154 9.760 40.280 50.041 -15.845 65.886 QUASIPEAK
2 0.192 9.722 36.080 45.802 -18.998 64.800 QUASIPEAK
3 0.517 9.640 27.780 37.420 -18.580 56.000 QUASIPEAK
4 0.880 9.670 23.100 32.770 -23.230 56.000 QUASIPEAK
5 1.244 9.670 21.400 31.070 -24.930 56.000 QUASIPEAK
6 3.205 9.690 23.980 33.670 -22.330 56.000 QUASIPEAK
Note:
1. All Reading Levels are Quasi-Peak and average value.
2. " * ", means this data is the worst emission level.
3. Measurement Level = Reading Level + Correct Factor.

Report No:10C324R-ITCEP07V06
Page: 34 of 127
Site : SR-8 Time : 2010/12/24 - 11:24
Limit : CISPR_B_00M_AV Margin : 0
Probe : ENV216-N - Line2 Power : AC 230V/50Hz
EUT : All in one PC Note : Mode 2
Frequency
(MHz)
Correct Factor
(dB)
Reading Level
(dBuV)
Measure Level
(dBuV)
Margin
(dB)
Limit
(dBuV)
Detector Type
1 0.154 9.760 22.250 32.011 -23.875 55.886 AVERAGE
2 0.192 9.722 17.870 27.592 -27.208 54.800 AVERAGE
3 * 0.517 9.640 19.070 28.710 -17.290 46.000 AVERAGE
4 0.880 9.670 12.540 22.210 -23.790 46.000 AVERAGE
5 1.244 9.670 11.720 21.390 -24.610 46.000 AVERAGE
6 3.205 9.690 17.020 26.710 -19.290 46.000 AVERAGE
Note:
1. All Reading Levels are Quasi-Peak and average value.
2. " * ", means this data is the worst emission level.
3. Measurement Level = Reading Level + Correct Factor.

Report No:10C324R-ITCEP07V06
Page: 35 of 127
3.7. Test Photograph Test Mode : Mode 1
Description : Front View of Conducted Test
Test Mode : Mode 1
Description : Back View of Conducted Test

Report No:10C324R-ITCEP07V06
Page: 36 of 127
Test Mode : Mode 2
Description : Front View of Conducted Test
Test Mode : Mode 2
Description : Back View of Conducted Test
Report No:10C324R-ITCEP07V06
Page: 37 of 127
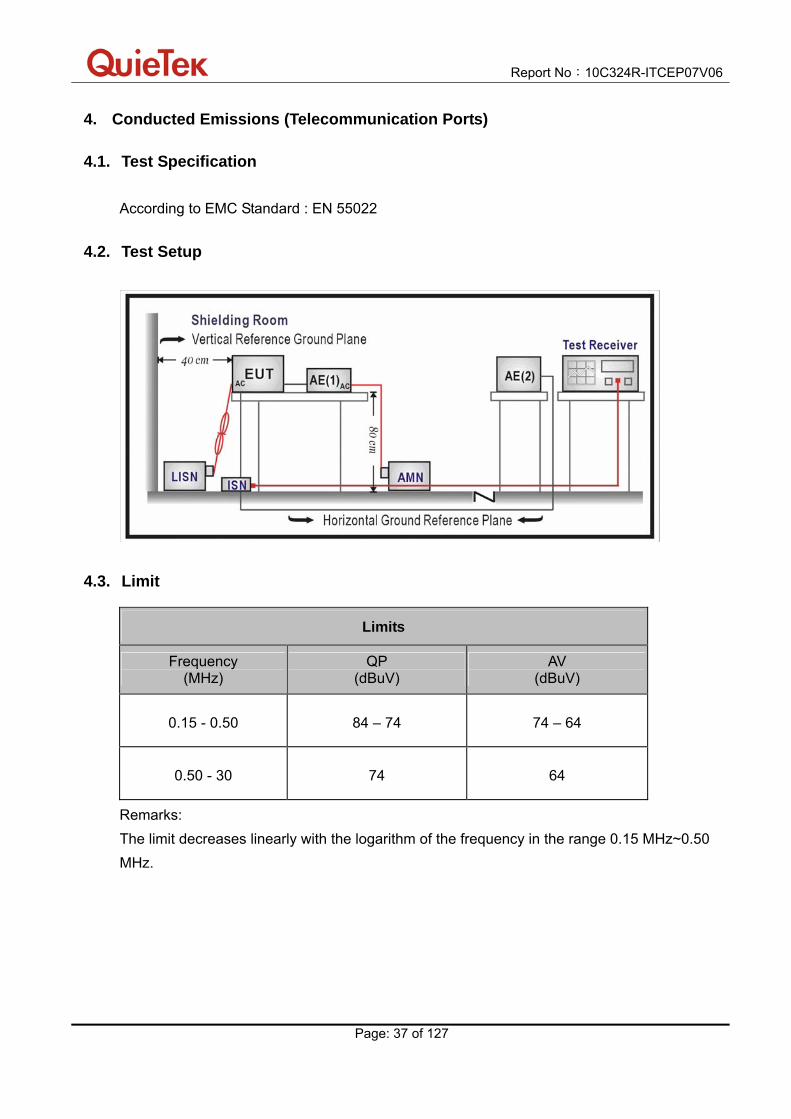
4. Conducted Emissions (Telecommunication Ports)
4.1. Test Specification
According to EMC Standard : EN 55022
4.2. Test Setup
4.3. Limit
Limits
Frequency (MHz)
QP (dBuV)
AV (dBuV)
0.15 - 0.50 84 – 74 74 – 64
0.50 - 30 74 64
Remarks:
The limit decreases linearly with the logarithm of the frequency in the range 0.15 MHz~0.50
MHz.

Report No:10C324R-ITCEP07V06
Page: 38 of 127
4.4. Test Procedure
Telecommunication Port:
The mains voltage shall be supplied to the EUT via the LISN when the measurement of
telecommunication port is performed. The common mode disturbances at the
telecommunication port shall be connected to the ISN, which is 150 ohm impedance.
Both alternative cables are tested related to the LCL requested. The measurement range is
from 150kHz to 30MHz. The bandwidth of measurement is set to 9kHz.
The 75dB LCL ISN is used for cat. 6 cable, the 65dB LCL ISN is used for cat. 5 cable, 55dB
LCL ISN is used for cat. 3.
4.5. Deviation from Test Standard
No deviation.

Report No:10C324R-ITCEP07V06
Page: 39 of 127
4.6. Test Result
Site : SR-8 Time : 2010/12/24 - 12:18
Limit : ISN_Voltage_B_00M_QP Margin : 10
Probe : TESEQ_T8 - Line1 Power : AC 230V/50Hz
EUT : All in one PC Note : Mode 1, ISN 10Mbps

Report No:10C324R-ITCEP07V06
Page: 40 of 127
Site : SR-8 Time : 2010/12/24 - 12:19
Limit : ISN_Voltage_B_00M_QP Margin : 0
Probe : TESEQ_T8 - Line1 Power : AC 230V/50Hz
EUT : All in one PC Note : Mode 1, ISN 10Mbps
Frequency
(MHz)
Correct Factor
(dB)
Reading Level
(dBuV)
Measure Level
(dBuV)
Margin
(dB)
Limit
(dBuV)
Detector Type
1 0.763 10.025 40.020 50.045 -23.955 74.000 QUASIPEAK
2 * 2.502 10.040 45.190 55.230 -18.770 74.000 QUASIPEAK
3 5.365 10.037 40.510 50.547 -23.453 74.000 QUASIPEAK
4 6.412 10.050 43.160 53.210 -20.790 74.000 QUASIPEAK
5 7.662 10.070 42.210 52.280 -21.720 74.000 QUASIPEAK
6 9.076 10.090 41.770 51.860 -22.140 74.000 QUASIPEAK
Note:
1. All Reading Levels are Quasi-Peak and average value.
2. " * ", means this data is the worst emission level.
3. Measurement Level = Reading Level + Correct Factor.

Report No:10C324R-ITCEP07V06
Page: 41 of 127
Site : SR-8 Time : 2010/12/24 - 12:19
Limit : ISN_Voltage_B_00M_AV Margin : 0
Probe : TESEQ_T8 - Line1 Power : AC 230V/50Hz
EUT : All in one PC Note : Mode 1, ISN 10Mbps
Frequency
(MHz)
Correct Factor
(dB)
Reading Level
(dBuV)
Measure Level
(dBuV)
Margin
(dB)
Limit
(dBuV)
Detector Type
1 0.763 10.025 32.070 42.095 -21.905 64.000 AVERAGE
2 * 2.502 10.040 39.780 49.820 -14.180 64.000 AVERAGE
3 5.365 10.037 34.840 44.877 -19.123 64.000 AVERAGE
4 6.412 10.050 36.970 47.020 -16.980 64.000 AVERAGE
5 7.662 10.070 35.480 45.550 -18.450 64.000 AVERAGE
6 9.076 10.090 34.830 44.920 -19.080 64.000 AVERAGE
Note:
1. All Reading Levels are Quasi-Peak and average value.
2. " * ", means this data is the worst emission level.
3. Measurement Level = Reading Level + Correct Factor.

Report No:10C324R-ITCEP07V06
Page: 42 of 127
Site : SR-8 Time : 2010/12/24 - 12:20
Limit : ISN_Voltage_B_00M_QP Margin : 10
Probe : TESEQ_T8 - Line1 Power : AC 230V/50Hz
EUT : All in one PC Note : Mode 1, ISN 100Mbps

Report No:10C324R-ITCEP07V06
Page: 43 of 127
Site : SR-8 Time : 2010/12/24 - 12:21
Limit : ISN_Voltage_B_00M_QP Margin : 0
Probe : TESEQ_T8 - Line1 Power : AC 230V/50Hz
EUT : All in one PC Note : Mode 1, ISN 100Mbps
Frequency
(MHz)
Correct Factor
(dB)
Reading Level
(dBuV)
Measure Level
(dBuV)
Margin
(dB)
Limit
(dBuV)
Detector Type
1 1.845 10.040 40.780 50.820 -23.180 74.000 QUASIPEAK
2 3.111 10.040 40.290 50.330 -23.670 74.000 QUASIPEAK
3 4.568 10.030 41.640 51.670 -22.330 74.000 QUASIPEAK
4 18.244 10.180 45.190 55.370 -18.630 74.000 QUASIPEAK
5 * 23.130 10.230 48.060 58.290 -15.710 74.000 QUASIPEAK
6 26.486 10.263 46.610 56.873 -17.127 74.000 QUASIPEAK
Note:
1. All Reading Levels are Quasi-Peak and average value.
2. " * ", means this data is the worst emission level.
3. Measurement Level = Reading Level + Correct Factor.

Report No:10C324R-ITCEP07V06
Page: 44 of 127
Site : SR-8 Time : 2010/12/24 - 12:21
Limit : ISN_Voltage_B_00M_AV Margin : 0
Probe : TESEQ_T8 - Line1 Power : AC 230V/50Hz
EUT : All in one PC Note : Mode 1, ISN 100Mbps
Frequency
(MHz)
Correct Factor
(dB)
Reading Level
(dBuV)
Measure Level
(dBuV)
Margin
(dB)
Limit
(dBuV)
Detector Type
1 1.845 10.040 37.180 47.220 -16.780 64.000 AVERAGE
2 3.111 10.040 33.590 43.630 -20.370 64.000 AVERAGE
3 4.568 10.030 36.320 46.350 -17.650 64.000 AVERAGE
4 18.244 10.180 42.830 53.010 -10.990 64.000 AVERAGE
5 * 23.130 10.230 45.090 55.320 -8.680 64.000 AVERAGE
6 26.486 10.263 43.550 53.813 -10.187 64.000 AVERAGE
Note:
1. All Reading Levels are Quasi-Peak and average value.
2. " * ", means this data is the worst emission level.
3. Measurement Level = Reading Level + Correct Factor.

Report No:10C324R-ITCEP07V06
Page: 45 of 127
Site : SR-8 Time : 2010/12/24 - 12:22
Limit : ISN_Voltage_B_00M_QP Margin : 10
Probe : TESEQ_T8 - Line1 Power : AC 230V/50Hz
EUT : All in one PC Note : Mode 1, ISN 1G

Report No:10C324R-ITCEP07V06
Page: 46 of 127
Site : SR-8 Time : 2010/12/24 - 12:23
Limit : ISN_Voltage_B_00M_QP Margin : 0
Probe : TESEQ_T8 - Line1 Power : AC 230V/50Hz
EUT : All in one PC Note : Mode 1, ISN 1G
Frequency
(MHz)
Correct Factor
(dB)
Reading Level
(dBuV)
Measure Level
(dBuV)
Margin
(dB)
Limit
(dBuV)
Detector Type
1 0.736 10.016 38.440 48.456 -25.544 74.000 QUASIPEAK
2 1.845 10.040 41.600 51.640 -22.360 74.000 QUASIPEAK
3 3.087 10.040 41.050 51.090 -22.910 74.000 QUASIPEAK
4 * 4.509 10.030 41.910 51.940 -22.060 74.000 QUASIPEAK
5 5.463 10.040 40.560 50.600 -23.400 74.000 QUASIPEAK
6 12.252 10.120 41.760 51.880 -22.120 74.000 QUASIPEAK
Note:
1. All Reading Levels are Quasi-Peak and average value.
2. " * ", means this data is the worst emission level.
3. Measurement Level = Reading Level + Correct Factor.

Report No:10C324R-ITCEP07V06
Page: 47 of 127
Site : SR-8 Time : 2010/12/24 - 12:23
Limit : ISN_Voltage_B_00M_AV Margin : 0
Probe : TESEQ_T8 - Line1 Power : AC 230V/50Hz
EUT : All in one PC Note : Mode 1, ISN 1G
Frequency
(MHz)
Correct Factor
(dB)
Reading Level
(dBuV)
Measure Level
(dBuV)
Margin
(dB)
Limit
(dBuV)
Detector Type
1 0.736 10.016 30.940 40.956 -23.044 64.000 AVERAGE
2 1.845 10.040 37.800 47.840 -16.160 64.000 AVERAGE
3 3.087 10.040 34.620 44.660 -19.340 64.000 AVERAGE
4 4.509 10.030 36.210 46.240 -17.760 64.000 AVERAGE
5 5.463 10.040 35.040 45.080 -18.920 64.000 AVERAGE
6 * 12.252 10.120 39.620 49.740 -14.260 64.000 AVERAGE
Note:
1. All Reading Levels are Quasi-Peak and average value.
2. " * ", means this data is the worst emission level.
3. Measurement Level = Reading Level + Correct Factor.

Report No:10C324R-ITCEP07V06
Page: 48 of 127
Site : SR-8 Time : 2010/12/24 - 11:26
Limit : ISN_Voltage_B_00M_QP Margin : 10
Probe : TESEQ_T8 - Line1 Power : AC 230V/50Hz
EUT : All in one PC Note : Mode 2, ISN 10Mbps

Report No:10C324R-ITCEP07V06
Page: 49 of 127
Site : SR-8 Time : 2010/12/24 - 11:28
Limit : ISN_Voltage_B_00M_QP Margin : 0
Probe : TESEQ_T8 - Line1 Power : AC 230V/50Hz
EUT : All in one PC Note : Mode 2, ISN 10Mbps
Frequency
(MHz)
Correct Factor
(dB)
Reading Level
(dBuV)
Measure Level
(dBuV)
Margin
(dB)
Limit
(dBuV)
Detector Type
1 1.795 10.040 39.920 49.960 -24.040 74.000 QUASIPEAK
2 2.607 10.040 42.000 52.040 -21.960 74.000 QUASIPEAK
3 3.052 10.040 44.500 54.540 -19.460 74.000 QUASIPEAK
4 5.279 10.030 44.400 54.430 -19.570 74.000 QUASIPEAK
5 7.502 10.063 51.330 61.393 -12.607 74.000 QUASIPEAK
6 * 8.748 10.080 46.940 57.020 -16.980 74.000 QUASIPEAK
Note:
1. All Reading Levels are Quasi-Peak and average value.
2. " * ", means this data is the worst emission level.
3. Measurement Level = Reading Level + Correct Factor.

Report No:10C324R-ITCEP07V06
Page: 50 of 127
Site : SR-8 Time : 2010/12/24 - 11:28
Limit : ISN_Voltage_B_00M_AV Margin : 0
Probe : TESEQ_T8 - Line1 Power : AC 230V/50Hz
EUT : All in one PC Note : Mode 2, ISN 10Mbps
Frequency
(MHz)
Correct Factor
(dB)
Reading Level
(dBuV)
Measure Level
(dBuV)
Margin
(dB)
Limit
(dBuV)
Detector Type
1 1.795 10.040 35.900 45.940 -18.060 64.000 AVERAGE
2 2.607 10.040 35.370 45.410 -18.590 64.000 AVERAGE
3 3.052 10.040 39.780 49.820 -14.180 64.000 AVERAGE
4 5.279 10.030 38.040 48.070 -15.930 64.000 AVERAGE
5 * 7.502 10.063 43.170 53.233 -10.767 64.000 AVERAGE
6 8.748 10.080 39.860 49.940 -14.060 64.000 AVERAGE
Note:
1. All Reading Levels are Quasi-Peak and average value.
2. " * ", means this data is the worst emission level.
3. Measurement Level = Reading Level + Correct Factor.
Report No:10C324R-ITCEP07V06
Page: 51 of 127
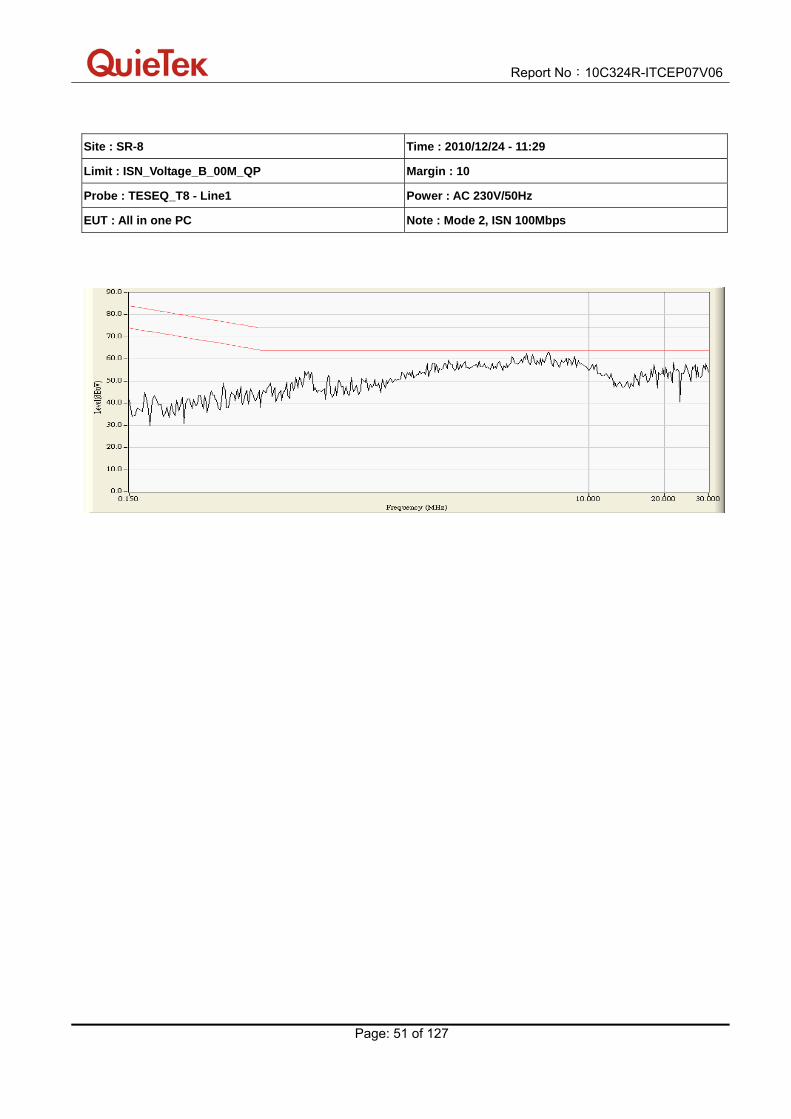
Site : SR-8 Time : 2010/12/24 - 11:29
Limit : ISN_Voltage_B_00M_QP Margin : 10
Probe : TESEQ_T8 - Line1 Power : AC 230V/50Hz
EUT : All in one PC Note : Mode 2, ISN 100Mbps

Report No:10C324R-ITCEP07V06
Page: 52 of 127
Site : SR-8 Time : 2010/12/24 - 11:30
Limit : ISN_Voltage_B_00M_QP Margin : 0
Probe : TESEQ_T8 - Line1 Power : AC 230V/50Hz
EUT : All in one PC Note : Mode 2, ISN 100Mbps
Frequency
(MHz)
Correct Factor
(dB)
Reading Level
(dBuV)
Measure Level
(dBuV)
Margin
(dB)
Limit
(dBuV)
Detector Type
1 2.767 10.040 43.240 53.280 -20.720 74.000 QUASIPEAK
2 4.966 10.030 43.860 53.890 -20.110 74.000 QUASIPEAK
3 5.689 10.040 44.930 54.970 -19.030 74.000 QUASIPEAK
4 6.966 10.060 43.830 53.890 -20.110 74.000 QUASIPEAK
5 * 21.662 10.220 46.530 56.750 -17.250 74.000 QUASIPEAK
6 24.349 10.240 45.500 55.740 -18.260 74.000 QUASIPEAK
Note:
1. All Reading Levels are Quasi-Peak and average value.
2. " * ", means this data is the worst emission level.
3. Measurement Level = Reading Level + Correct Factor.

Report No:10C324R-ITCEP07V06
Page: 53 of 127
Site : SR-8 Time : 2010/12/24 - 11:30
Limit : ISN_Voltage_B_00M_AV Margin : 0
Probe : TESEQ_T8 - Line1 Power : AC 230V/50Hz
EUT : All in one PC Note : Mode 2, ISN 100Mbps
Frequency
(MHz)
Correct Factor
(dB)
Reading Level
(dBuV)
Measure Level
(dBuV)
Margin
(dB)
Limit
(dBuV)
Detector Type
1 2.767 10.040 36.610 46.650 -17.350 64.000 AVERAGE
2 4.966 10.030 37.390 47.420 -16.580 64.000 AVERAGE
3 5.689 10.040 38.560 48.600 -15.400 64.000 AVERAGE
4 6.966 10.060 37.590 47.650 -16.350 64.000 AVERAGE
5 * 21.662 10.220 43.600 53.820 -10.180 64.000 AVERAGE
6 24.349 10.240 42.420 52.660 -11.340 64.000 AVERAGE
Note:
1. All Reading Levels are Quasi-Peak and average value.
2. " * ", means this data is the worst emission level.
3. Measurement Level = Reading Level + Correct Factor.

Report No:10C324R-ITCEP07V06
Page: 54 of 127
Site : SR-8 Time : 2010/12/24 - 11:31
Limit : ISN_Voltage_B_00M_QP Margin : 10
Probe : TESEQ_T8 - Line1 Power : AC 230V/50Hz
EUT : All in one PC Note : Mode 2, ISN 1G

Report No:10C324R-ITCEP07V06
Page: 55 of 127
Site : SR-8 Time : 2010/12/24 - 11:32
Limit : ISN_Voltage_B_00M_QP Margin : 0
Probe : TESEQ_T8 - Line1 Power : AC 230V/50Hz
EUT : All in one PC Note : Mode 2, ISN 1G
Frequency
(MHz)
Correct Factor
(dB)
Reading Level
(dBuV)
Measure Level
(dBuV)
Margin
(dB)
Limit
(dBuV)
Detector Type
1 2.595 10.040 42.320 52.360 -21.640 74.000 QUASIPEAK
2 3.396 10.040 42.580 52.620 -21.380 74.000 QUASIPEAK
3 5.361 10.036 44.350 54.386 -19.614 74.000 QUASIPEAK
4 * 6.220 10.050 44.500 54.550 -19.450 74.000 QUASIPEAK
5 7.283 10.060 43.300 53.360 -20.640 74.000 QUASIPEAK
6 8.920 10.080 42.460 52.540 -21.460 74.000 QUASIPEAK
Note:
1. All Reading Levels are Quasi-Peak and average value.
2. " * ", means this data is the worst emission level.
3. Measurement Level = Reading Level + Correct Factor.

Report No:10C324R-ITCEP07V06
Page: 56 of 127
Site : SR-8 Time : 2010/12/24 - 11:32
Limit : ISN_Voltage_B_00M_AV Margin : 0
Probe : TESEQ_T8 - Line1 Power : AC 230V/50Hz
EUT : All in one PC Note : Mode 2, ISN 1G
Frequency
(MHz)
Correct Factor
(dB)
Reading Level
(dBuV)
Measure Level
(dBuV)
Margin
(dB)
Limit
(dBuV)
Detector Type
1 2.595 10.040 35.420 45.460 -18.540 64.000 AVERAGE
2 3.396 10.040 35.540 45.580 -18.420 64.000 AVERAGE
3 5.361 10.036 38.290 48.326 -15.674 64.000 AVERAGE
4 * 6.220 10.050 38.330 48.380 -15.620 64.000 AVERAGE
5 7.283 10.060 37.830 47.890 -16.110 64.000 AVERAGE
6 8.920 10.080 36.510 46.590 -17.410 64.000 AVERAGE
Note:
1. All Reading Levels are Quasi-Peak and average value.
2. " * ", means this data is the worst emission level.
3. Measurement Level = Reading Level + Correct Factor.

Report No:10C324R-ITCEP07V06
Page: 57 of 127
4.7. Test Photograph Test Mode : Mode 1
Description : Front View of ISN Test
Test Mode : Mode 1
Description : Back View of ISN Test

Report No:10C324R-ITCEP07V06
Page: 58 of 127
Test Mode : Mode 2
Description : Front View of ISN Test
Test Mode : Mode 2
Description : Back View of ISN Test

Report No:10C324R-ITCEP07V06
Page: 59 of 127
5. Radiated Emission
5.1. Test Specification
According to EMC Standard : EN 55022
5.2. Test Setup
Under 1GHz Test Setup:
Above 1GHz Test Setup:

Report No:10C324R-ITCEP07V06
Page: 60 of 127
5.3. Limit
Limits
Frequency
(MHz) Distance (m) dBuV/m
30 – 230 10 30
230 – 1000 10 37
Limits
Frequency
(GHz)
Distance
(m)
Peak
(dBuV/m)
Average
(dBuV/m)
1 – 3 3 70 50
3 – 6 3 74 54
Remark:
1. The tighter limit shall apply at the edge between two frequency bands.
2. Distance refers to the distance in meters between the measuring instrument
antenna and the closed point of any part of the device or system.
Highest frequency generated or used
in the device or on which the device
operates or tunes (MHz)
Upper frequency of measurement
range (MHz)
Below 108 1000
108 – 500 2000
500 – 1000 5000
Above 1000 5th harmonic of the highest frequency
or 6 GHz, whichever is lower

Report No:10C324R-ITCEP07V06
Page: 61 of 127
5.4. Test Procedure
The EUT and its simulators are placed on a turn table which is 0.8 meter above ground. The
turn table can rotate 360 degrees to determine the position of the maximum emission level.
The EUT was positioned such that the distance from antenna to the EUT was 3/10 meters.
The antenna can move up and down between 1 meter and 4 meters to find out the maximum
emission level.
Both horizontal and vertical polarization of the antenna are set on measurement. In order to
find the maximum emission, all of the interface cables must be manipulated on radiated
measurement.
Radiated emissions were invested over the frequency range from 30MHz to1GHz using a
receiver bandwidth of 120kHz and above 1GHz using a receiver bandwidth of 1MHz.
30MHz to1GHz Radiated was performed at an antenna to EUT distance of 10 meters.
Above1GHz Radiated was performed at an antenna to EUT distance of 3 meters.
It is placed with absorb on the ground between EUT and Antenna.
5.5. Deviation from Test Standard
No deviation.

Report No:10C324R-ITCEP07V06
Page: 62 of 127
5.6. Test Result
Site : OATS-1 Time : 2010/12/17 - 16:58
Limit : CISPR_B_10M_QP Margin : 6
EUT : All in one PC Probe : Site1_CBL6112_10M_0811 - HORIZONTAL
Power : AC 230V/50Hz Note : Mode 1
Frequency
(MHz)
Correct Factor
(dB)
Reading Level
(dBuV)
Measure Level
(dBuV/m)
Margin
(dB)
Limit
(dBuV/m)
Detector Type
1 148.510 12.116 11.200 23.316 -6.684 30.000 QUASIPEAK
2 200.160 10.910 8.500 19.410 -10.590 30.000 QUASIPEAK
3 240.000 13.300 12.100 25.400 -11.600 37.000 QUASIPEAK
4 360.000 17.841 13.400 31.241 -5.759 37.000 QUASIPEAK
5 480.000 20.693 9.700 30.393 -6.607 37.000 QUASIPEAK
6 * 540.000 22.197 10.600 32.797 -4.203 37.000 QUASIPEAK
7 760.000 24.397 5.100 29.497 -7.503 37.000 QUASIPEAK
Note:
1. All Readings below 1GHz are Quasi-Peak, above are performed with peak and/or
average measurements as necessary.
2. " * ", means this data is the worst emission level.
3. Measurement Level = Reading Level + Correct Factor

Report No:10C324R-ITCEP07V06
Page: 63 of 127
Site : OATS-1 Time : 2010/12/17 - 17:07
Limit : CISPR_B_10M_QP Margin : 6
EUT : All in one PC Probe : Site1_CBL6112_10M_0811 - VERTICAL
Power : AC 230V/50Hz Note : Mode 1
Frequency
(MHz)
Correct Factor
(dB)
Reading Level
(dBuV)
Measure Level
(dBuV/m)
Margin
(dB)
Limit
(dBuV/m)
Detector Type
1 149.140 12.068 9.900 21.968 -8.032 30.000 QUASIPEAK
2 177.720 10.754 13.700 24.454 -5.546 30.000 QUASIPEAK
3 240.000 13.300 11.400 24.700 -12.300 37.000 QUASIPEAK
4 359.990 17.840 10.800 28.640 -8.360 37.000 QUASIPEAK
5 480.000 20.693 5.900 26.593 -10.407 37.000 QUASIPEAK
6 * 742.540 24.476 8.900 33.376 -3.624 37.000 QUASIPEAK
7 999.980 26.297 4.200 30.496 -6.504 37.000 QUASIPEAK
Note:
1. All Readings below 1GHz are Quasi-Peak, above are performed with peak and/or
average measurements as necessary.
2. " * ", means this data is the worst emission level.
3. Measurement Level = Reading Level + Correct Factor

Report No:10C324R-ITCEP07V06
Page: 64 of 127
Site : OATS-1 Time : 2010/12/17 - 16:43
Limit : CISPR_B_10M_QP Margin : 6
EUT : All in one PC Probe : Site1_CBL6112_10M_0811 - HORIZONTAL
Power : AC 230V/50Hz Note : Mode 2
Frequency
(MHz)
Correct Factor
(dB)
Reading Level
(dBuV)
Measure Level
(dBuV/m)
Margin
(dB)
Limit
(dBuV/m)
Detector Type
1 * 141.750 12.767 13.700 26.468 -3.532 30.000 QUASIPEAK
2 178.100 10.753 12.400 23.153 -6.847 30.000 QUASIPEAK
3 240.000 13.300 18.200 31.500 -5.500 37.000 QUASIPEAK
4 250.000 14.388 13.600 27.988 -9.012 37.000 QUASIPEAK
5 359.990 17.840 13.000 30.840 -6.160 37.000 QUASIPEAK
6 533.200 21.827 6.800 28.627 -8.373 37.000 QUASIPEAK
7 750.000 24.405 9.000 33.405 -3.595 37.000 QUASIPEAK
8 891.000 25.441 4.000 29.441 -7.559 37.000 QUASIPEAK
Note:
1. All Readings below 1GHz are Quasi-Peak, above are performed with peak and/or
average measurements as necessary.
2. " * ", means this data is the worst emission level.
3. Measurement Level = Reading Level + Correct Factor

Report No:10C324R-ITCEP07V06
Page: 65 of 127
Site : OATS-1 Time : 2010/12/17 - 15:36
Limit : CISPR_B_10M_QP Margin : 6
EUT : All in one PC Probe : Site1_CBL6112_10M_0811 - VERTICAL
Power : AC 230V/50Hz Note : Mode 2
Frequency
(MHz)
Correct Factor
(dB)
Reading Level
(dBuV)
Measure Level
(dBuV/m)
Margin
(dB)
Limit
(dBuV/m)
Detector Type
1 * 141.370 12.773 14.200 26.973 -3.027 30.000 QUASIPEAK
2 148.500 12.117 13.600 25.717 -4.283 30.000 QUASIPEAK
3 240.000 13.300 17.700 31.000 -6.000 37.000 QUASIPEAK
4 250.000 14.388 11.600 25.988 -11.012 37.000 QUASIPEAK
5 359.990 17.840 10.800 28.640 -8.360 37.000 QUASIPEAK
6 520.000 21.402 8.200 29.602 -7.398 37.000 QUASIPEAK
7 750.000 24.405 7.300 31.705 -5.295 37.000 QUASIPEAK
Note:
1. All Readings below 1GHz are Quasi-Peak, above are performed with peak and/or
average measurements as necessary.
2. " * ", means this data is the worst emission level.
3. Measurement Level = Reading Level + Correct Factor

Report No:10C324R-ITCEP07V06
Page: 66 of 127
Site: 9x6x6_Chamber Time: 2010/12/24 - 03:30
Limit: EN55022_B_(Above_1G) Margin: 0
Probe: 9120D_1-18G_Horn Polarity: Horizontal
EUT: All in one PC Power: AC 230V/50Hz
Note: Mode 1
Frequency
(MHz)
Measure Level
(dBuV/m)
Reading Level
(dBuV)
Over Limit
(dB)
Limit
(dBuV/m)
Factor Type
1 1040.000 59.925 66.380 -10.075 70.000 -6.455 PK
2 1040.000 43.565 50.020 -6.435 50.000 -6.455 AV
3 1813.000 59.164 63.250 -10.836 70.000 -4.086 PK
4 1813.000 40.734 44.820 -9.266 50.000 -4.086 AV
5 2540.000 58.399 59.810 -11.601 70.000 -1.410 PK
6 * 2540.000 44.969 46.380 -5.031 50.000 -1.410 AV
Note:
1. All Readings below 1GHz are Quasi-Peak, above are performed with peak and/or
average measurements as necessary.
2. " * ", means this data is the worst emission level.
3. Measurement Level = Reading Level + Factor(Probe+Cable-Amp).

Report No:10C324R-ITCEP07V06
Page: 67 of 127
Site: 9x6x6_Chamber Time: 2010/12/24 - 03:31
Limit: EN55022_B_(Above_1G) Margin: 0
Probe: 9120D_1-18G_Horn Polarity: Vertical
EUT: All in one PC Power: AC 230V/50Hz
Note: Mode 1
Frequency
(MHz)
Measure Level
(dBuV/m)
Reading Level
(dBuV)
Over Limit
(dB)
Limit
(dBuV/m)
Factor Type
1 1040.000 62.055 68.510 -7.945 70.000 -6.455 PK
2 1040.000 38.155 44.610 -11.845 50.000 -6.455 AV
3 2015.000 56.997 60.720 -13.003 70.000 -3.724 PK
4 * 2015.000 45.907 49.630 -4.093 50.000 -3.724 AV
5 2485.000 63.544 65.150 -6.456 70.000 -1.606 PK
6 2485.000 43.604 45.210 -6.396 50.000 -1.606 AV
Note:
1. All Readings below 1GHz are Quasi-Peak, above are performed with peak and/or
average measurements as necessary.
2. " * ", means this data is the worst emission level.
3. Measurement Level = Reading Level + Factor(Probe+Cable-Amp).

Report No:10C324R-ITCEP07V06
Page: 68 of 127
Site: 9x6x6_Chamber Time: 2010/12/24 - 03:47
Limit: EN55022_B_(Above_1G) Margin: 0
Probe: 9120D_1-18G_Horn Polarity: Horizontal
EUT: All in one PC Power: AC 230V/50Hz
Note: Mode 2
Frequency
(MHz)
Measure Level
(dBuV/m)
Reading Level
(dBuV)
Over Limit
(dB)
Limit
(dBuV/m)
Factor Type
1 1027.000 59.876 66.380 -10.124 70.000 -6.503 PK
2 1027.000 43.326 49.830 -6.674 50.000 -6.503 AV
3 1809.000 59.147 63.240 -10.853 70.000 -4.093 PK
4 1809.000 40.757 44.850 -9.243 50.000 -4.093 AV
5 2540.000 58.669 60.080 -11.331 70.000 -1.410 PK
6 * 2540.000 44.939 46.350 -5.061 50.000 -1.410 AV
Note:
1. All Readings below 1GHz are Quasi-Peak, above are performed with peak and/or
average measurements as necessary.
2. " * ", means this data is the worst emission level.
3. Measurement Level = Reading Level + Factor(Probe+Cable-Amp).

Report No:10C324R-ITCEP07V06
Page: 69 of 127
Site: 9x6x6_Chamber Time: 2010/12/24 - 03:48
Limit: EN55022_B_(Above_1G) Margin: 0
Probe: 9120D_1-18G_Horn Polarity: Vertical
EUT: All in one PC Power: AC 230V/50Hz
Note: Mode 2
Frequency
(MHz)
Measure Level
(dBuV/m)
Reading Level
(dBuV)
Over Limit
(dB)
Limit
(dBuV/m)
Factor Type
1 1028.000 62.330 68.830 -7.670 70.000 -6.500 PK
2 1028.000 44.630 51.130 -5.370 50.000 -6.500 AV
3 2002.000 56.761 60.530 -13.239 70.000 -3.769 PK
4 * 2002.000 45.761 49.530 -4.239 50.000 -3.769 AV
5 2498.000 62.100 63.650 -7.900 70.000 -1.549 PK
6 2498.000 42.470 44.020 -7.530 50.000 -1.549 AV
Note:
1. All Readings below 1GHz are Quasi-Peak, above are performed with peak and/or
average measurements as necessary.
2. " * ", means this data is the worst emission level.
3. Measurement Level = Reading Level + Factor(Probe+Cable-Amp).

Report No:10C324R-ITCEP07V06
Page: 70 of 127
5.7. Test Photograph Test Mode : Mode 1
Description : Front View of Radiated Test
Test Mode : Mode 1
Description : Back View of Radiated Test

Report No:10C324R-ITCEP07V06
Page: 71 of 127
Test Mode : Mode 1
Description : Front View of High Frequency Radiated Test
Test Mode : Mode 2
Description : Front View of Radiated Test

Report No:10C324R-ITCEP07V06
Page: 72 of 127
Test Mode : Mode 2
Description : Back View of Radiated Test
Test Mode : Mode 2
Description : Front View of High Frequency Radiated Test

Report No:10C324R-ITCEP07V06
Page: 73 of 127
6. Harmonic Current Emission
6.1. Test Specification
According to EMC Standard : EN 61000-3-2
6.2. Test Setup
6.3. Limit
(a) Limits of Class A Harmonics Currents
Harmonics
Order
n
Maximum Permissible
harmonic current
A
Harmonics
Order
n
Maximum Permissible
harmonic current
A
Odd harmonics Even harmonics
3 2.30 2 1.08
5 1.14 4 0.43
7 0.77 6 0.30
9 0.40 8 n 40 0.23 * 8/n
11 0.33
13 0.21
15 n 39 0.15 * 15/n
Report No:10C324R-ITCEP07V06
Page: 74 of 127
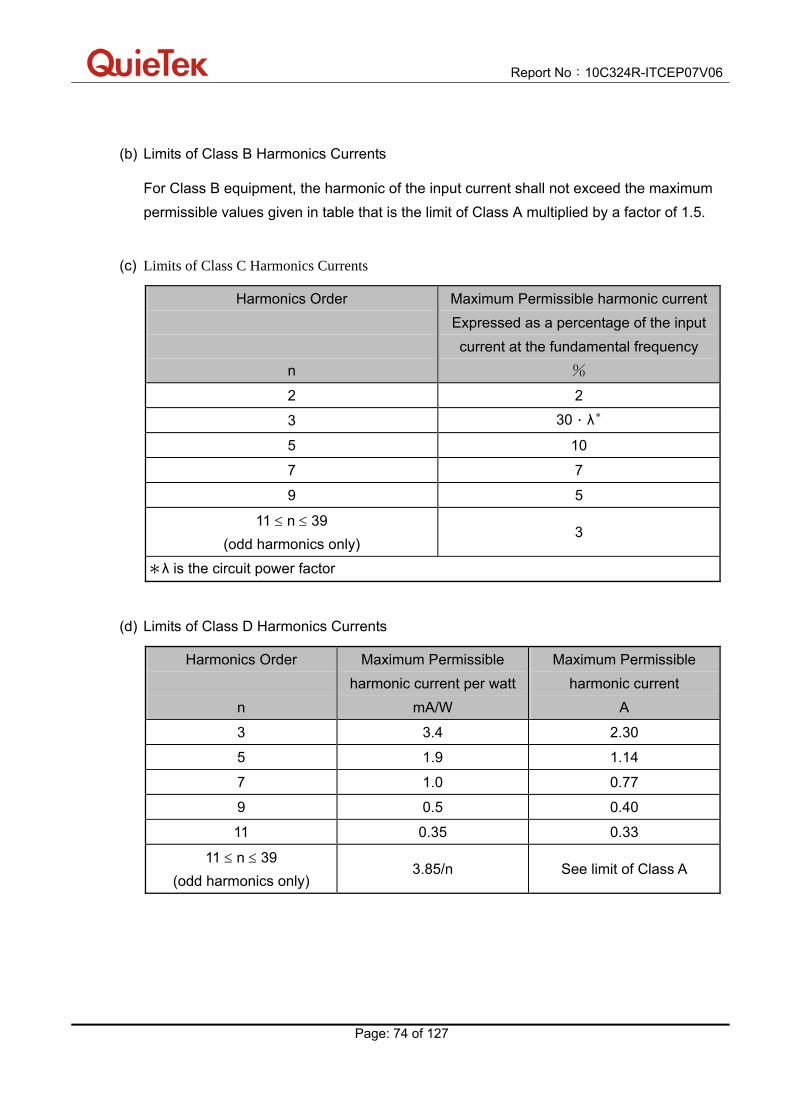
(b) Limits of Class B Harmonics Currents
For Class B equipment, the harmonic of the input current shall not exceed the maximum
permissible values given in table that is the limit of Class A multiplied by a factor of 1.5.
(c) Limits of Class C Harmonics Currents
Harmonics Order
n
Maximum Permissible harmonic current
Expressed as a percentage of the input
current at the fundamental frequency
%
2 2
3 30.λ*
5 10
7 7
9 5
11 n 39
(odd harmonics only) 3
*λ is the circuit power factor
(d) Limits of Class D Harmonics Currents
Harmonics Order
n
Maximum Permissible
harmonic current per watt
mA/W
Maximum Permissible
harmonic current
A
3 3.4 2.30
5 1.9 1.14
7 1.0 0.77
9 0.5 0.40
11 0.35 0.33
11 n 39
(odd harmonics only) 3.85/n See limit of Class A

Report No:10C324R-ITCEP07V06
Page: 75 of 127
6.4. Test Procedure
The EUT is supplied in series with power analyzer from a power source having the same
normal voltage and frequency as the rated supply voltage and the equipment under test.
And the rated voltage at the supply voltage of EUT of 0.94 times and 1.06 times shall be
performed.
6.5. Deviation from Test Standard
No deviation.

Report No:10C324R-ITCEP07V06
Page: 76 of 127
6.6. Test Result Product All in one PC
Test Item Power Harmonics
Test Mode Mode 1
Date of Test 2011/01/01 Test Site No.3 Shielded Room
Test Result: Pass Source qualification: Normal
Current & voltage waveforms
-1.5
-1.0
-0.5
0.0
0.5
1.0
1.5
-300
-200
-100
0
100
200
300
Cu
rre
nt (A
mp
s)
Vo
ltag
e (V
olts)
Harmonics and Class D limit line European Limits
0.000.050.100.150.200.250.300.350.400.45
Cu
rre
nt R
MS
(Am
ps)
Harmonic #4 8 12 16 20 24 28 32 36 40
Test result: Pass Worst harmonic was #27 with 68.28% of the limit.

Report No:10C324R-ITCEP07V06
Page: 77 of 127
Test Result: Pass Source qualification: Normal
THC(A): 0.16 I-THD(%): 38.31 POHC(A): 0.016 POHC Limit(A): 0.041 Highest parameter values during test:
V_RMS (Volts): 229.56 Frequency(Hz): 50.00 I_Peak (Amps): 0.950 I_RMS (Amps): 0.466 I_Fund (Amps): 0.417 Crest Factor: 2.226 Power (Watts): 95.1 Power Factor: 0.889
Harm# Harms(avg) 100%Limit %of Limit Harms(max) 150%Limit %of Limit Status 2 0.000 3 0.148 0.323 45.7 0.148 0.464 31.92 Pass 4 0.000 5 0.036 0.181 20.1 0.037 0.259 14.28 Pass 6 0.000 7 0.015 0.095 15.7 0.017 0.142 11.84 Pass 8 0.000 9 0.011 0.048 23.4 0.012 0.071 17.12 Pass 10 0.000 11 0.007 0.033 22.5 0.008 0.050 16.91 Pass 12 0.000 13 0.009 0.029 32.4 0.010 0.042 23.78 Pass 14 0.000 15 0.008 0.025 31.1 0.008 0.035 23.35 Pass 16 0.000 17 0.003 0.022 14.0 0.005 0.032 14.67 Pass 18 0.000 19 0.011 0.019 55.2 0.011 0.028 41.24 Pass 20 0.000 21 0.005 0.017 27.0 0.006 0.026 23.50 Pass 22 0.000 23 0.007 0.016 43.0 0.008 0.024 34.16 Pass 24 0.000 25 0.004 0.015 27.1 0.005 0.022 22.12 Pass 26 0.000 27 0.009 0.014 62.6 0.010 0.019 50.86 Pass 28 0.000 29 0.003 0.013 26.4 0.004 0.018 21.30 Pass 30 0.000 31 0.005 0.012 39.5 0.005 0.018 31.33 Pass 32 0.000 33 0.003 0.011 29.1 0.004 0.016 25.42 Pass 34 0.000 35 0.006 0.010 59.3 0.008 0.015 50.30 Pass 36 0.000 37 0.003 0.010 30.5 0.004 0.015 25.15 Pass 38 0.000 39 0.003 0.009 26.7 0.003 0.014 19.85 Pass 40 0.000
1.Dynamic limits were applied for this test. The highest harmonics values in the above table may not occur at the
same window as the maximum harmonics/limit ratio.
2:According to EN61000-3-2 paragraph 7 the note 1 and 2 are valid for all applications having an active input power
>75W. Others the result should be pass.

Report No:10C324R-ITCEP07V06
Page: 78 of 127
Product All in one PC
Test Item Power Harmonics
Test Mode Mode 2
Date of Test 2011/01/01 Test Site No.3 Shielded Room
Test Result: Pass Source qualification: Normal
Current & voltage waveforms
-1.5
-1.0
-0.5
0.0
0.5
1.0
1.5
-300
-200
-100
0
100
200
300
Cu
rre
nt (A
mp
s)
Vo
ltag
e (V
olts)
Harmonics and Class D limit line European Limits
0.000.050.100.150.200.250.300.350.400.45
Cu
rre
nt R
MS
(Am
ps)
Harmonic #4 8 12 16 20 24 28 32 36 40
Test result: Pass Worst harmonic was #3 with 60.86% of the limit.

Report No:10C324R-ITCEP07V06
Page: 79 of 127
Test Result: Pass Source qualification: Normal
THC(A): 0.19 I-THD(%): 48.32 POHC(A): 0.003 POHC Limit(A): 0.039 Highest parameter values during test:
V_RMS (Volts): 229.57 Frequency(Hz): 50.00 I_Peak (Amps): 1.274 I_RMS (Amps): 0.469 I_Fund (Amps): 0.400 Crest Factor: 2.783 Power (Watts): 90.3 Power Factor: 0.851
Harm# Harms(avg) 100%Limit %of Limit Harms(max) 150%Limit %of Limit Status 2 0.000 3 0.187 0.307 60.9 0.189 0.450 42.08 Pass 4 0.000 5 0.021 0.171 12.1 0.024 0.251 9.76 Pass 6 0.000 7 0.016 0.090 17.6 0.019 0.132 14.66 Pass 8 0.000 9 0.007 0.045 15.7 0.012 0.066 17.78 Pass 10 0.000 11 0.004 0.032 13.4 0.008 0.046 16.48 Pass 12 0.000 13 0.004 0.027 13.1 0.006 0.039 14.87 Pass 14 0.000 15 0.002 0.023 8.6 0.003 0.034 9.09 Pass 16 0.000 17 0.002 0.021 9.6 0.002 0.030 8.29 Pass 18 0.000 19 0.002 0.018 8.3 0.002 0.027 7.30 Pass 20 0.000 21 0.001 0.017 4.3 0.001 0.024 5.87 Pass 22 0.000 23 0.001 0.015 8.1 0.002 0.022 8.09 Pass 24 0.000 25 0.001 0.014 7.2 0.002 0.020 7.68 Pass 26 0.000 27 0.001 0.013 5.7 0.001 0.019 5.91 Pass 28 0.000 29 0.001 0.012 7.7 0.001 0.018 7.45 Pass 30 0.000 31 0.001 0.011 6.7 0.001 0.016 6.70 Pass 32 0.000 33 0.001 0.010 7.4 0.001 0.015 8.91 Pass 34 0.000 35 0.001 0.010 8.8 0.001 0.015 9.24 Pass 36 0.000 37 0.001 0.009 7.4 0.001 0.014 9.82 Pass 38 0.000 39 0.001 0.009 9.4 0.001 0.013 11.16 Pass 40 0.000
1.Dynamic limits were applied for this test. The highest harmonics values in the above table may not occur at the
same window as the maximum harmonics/limit ratio.
2:According to EN61000-3-2 paragraph 7 the note 1 and 2 are valid for all applications having an active input power
>75W. Others the result should be pass.

Report No:10C324R-ITCEP07V06
Page: 80 of 127
6.7. Test Photograph Test Mode : Mode 1
Description : Power Harmonics Test Setup
Test Mode : Mode 2
Description : Power Harmonics Test Setup

Report No:10C324R-ITCEP07V06
Page: 81 of 127
7. Voltage Fluctuation and Flicker
7.1. Test Specification
According to EMC Standard : EN 61000-3-3
7.2. Test Setup
7.3. Limit
The following limits apply:
- the value of Pst shall not be greater than 1.0;
- the value of Plt shall not be greater than 0.65;
- the value of d(t) during a voltage change shall not exceed 3.3 % for more than 500
ms;
- the relative steady-state voltage change, dc, shall not exceed 3.3 %;
- the maximum relative voltage change, dmax, shall not exceed;
a) 4 % without additional conditions;
b) 6 % for equipment which is:
- switched manually, or
- switched automatically more frequently than twice per day, and also has either a
delayed restart (the delay being not less than a few tens of seconds), or manual restart,
after a power supply interruption.
NOTE The cycling frequency will be further limited by the Pst and P1t limit.
For example: a dmax of 6%producing a rectangular voltage change characteristic twice per
hour will give a P1t of about 0.65.

Report No:10C324R-ITCEP07V06
Page: 82 of 127
c) 7 % for equipment which is:
- attended whilst in use (for example: hair dryers, vacuum cleaners, kitchen equipment
such as mixers, garden equipment such as lawn mowers, portable tools such as
electric drills), or
- switched on automatically, or is intended to be switched on manually, no more than
twice per day, and also has either a delayed restart (the delay being not less than a
few tens of seconds) or manual restart, after a power supply interruption.
Pst and P1t requirements shall not be applied to voltage changes caused by manual switching.
7.4. Test Procedure
The EUT is supplied in series with power analyzer from a power source having the same
normal voltage and frequency as the rated supply voltage and the equipment under test.
And the rated voltage at the supply voltage of EUT of 0.94 times and 1.06 times shall be
performed.
7.5. Deviation from Test Standard
No deviation.

Report No:10C324R-ITCEP07V06
Page: 83 of 127
7.6. Test Result Product All in one PC
Test Item Voltage Fluctuation and Flicker
Test Mode Mode 1
Date of Test 2011/01/01 Test Site No.3 Shielded Room Test Result: Pass Status: Test Completed Psti and limit line European Limits
0.25
0.50
0.75
1.00
Pst
4:0
6:3
7
Plt and limit line
0.00
0.25
0.50
Plt
4:0
6:3
7
Parameter values recorded during the test: Vrms at the end of test (Volt): 229.42 Highest dt (%): 0.00 Test limit (%): 3.30 Pass Time(mS) > dt: 0.0 Test limit (mS): 500.0 Pass Highest dc (%): 0.00 Test limit (%): 3.30 Pass Highest dmax (%): 0.00 Test limit (%): 4.00 Pass Highest Pst (10 min. period): 0.064 Test limit: 1.000 Pass Highest Plt (2 hr. period): 0.028 Test limit: 0.650 Pass

Report No:10C324R-ITCEP07V06
Page: 84 of 127
Product All in one PC
Test Item Voltage Fluctuation and Flicker
Test Mode Mode 2
Date of Test 2011/01/01 Test Site No.3 Shielded Room Test Result: Pass Status: Test Completed Psti and limit line European Limits
0.25
0.50
0.75
1.00
Pst
3:4
8:0
8
Plt and limit line
0.00
0.25
0.50
Plt
3:4
8:0
8
Parameter values recorded during the test: Vrms at the end of test (Volt): 229.38 Highest dt (%): 0.00 Test limit (%): 3.30 Pass Time(mS) > dt: 0.0 Test limit (mS): 500.0 Pass Highest dc (%): 0.00 Test limit (%): 3.30 Pass Highest dmax (%): 0.00 Test limit (%): 4.00 Pass Highest Pst (10 min. period): 0.064 Test limit: 1.000 Pass Highest Plt (2 hr. period): 0.028 Test limit: 0.650 Pass

Report No:10C324R-ITCEP07V06
Page: 85 of 127
7.7. Test Photograph Test Mode : Mode 1
Description : Flicker Test Setup
Test Mode : Mode 2
Description : Flicker Test Setup

Report No:10C324R-ITCEP07V06
Page: 86 of 127
8. Electrostatic Discharge
8.1. Test Specification
According to Standard : IEC 61000-4-2
8.2. Test Setup
8.3. Limit
Item Environmental
Phenomena
Units Test Specification Performance
Criteria
Enclosure Port
Electrostatic Discharge kV(Charge Voltage) ±8 Air Discharge
±4 Contact Discharge B

Report No:10C324R-ITCEP07V06
Page: 87 of 127
8.4. Test Procedure
Direct application of discharges to the EUT:
Contact discharge was applied only to conductive surfaces of the EUT.
Air discharges were applied only to non-conductive surfaces of the EUT.
During the test, it was performed with single discharges. For the single discharge
time between successive single discharges will be keep longer 1 second. It was at
least ten single discharges with positive and negative at the same selected point.
The selected point, which was performed with electrostatic discharge, was marked
on the red label of the EUT.
Indirect application of discharges to the EUT:
Vertical Coupling Plane (VCP):
The coupling plane, of dimensions 0.5m x 0.5m, is placed parallel to, and positioned
at a distance 0.1m from, the EUT, with the Discharge Electrode touching the
coupling plane.
The four faces of the EUT will be performed with electrostatic discharge. It was at
least ten single discharges with positive and negative at the same selected point.
Horizontal Coupling Plane (HCP):
The coupling plane is placed under to the EUT. The generator shall be positioned
vertically at a distance of 0.1m from the EUT, with the Discharge Electrode touching
the coupling plane.
The four faces of the EUT will be performed with electrostatic discharge. It was at
least ten single discharges with positive and negative at the same selected point.
8.5. Deviation from Test Standard
No deviation.

Report No:10C324R-ITCEP07V06
Page: 88 of 127
8.6. Test Result Product All in one PC
Test Item Electrostatic Discharge
Test Mode Mode 1
Date of Test 2010/12/31 Test Site No.6 Shielded Room
Item Amount of
Discharge Voltage
Required
Criteria
Complied To
Criteria
(A,B,C)
Results
Air Discharge 10
10
+8kV
-8kV
B
B
A
A
Pass
Pass
Contact Discharge 25
25
+4kV
-4kV
B
B
A
A
Pass
Pass
Indirect Discharge
(HCP)
25
25
+4kV
-4kV
B
B
A
A
Pass
Pass
Indirect Discharge
(VCP Front)
25
25
+4kV
-4kV
B
B
A
A
Pass
Pass
Indirect Discharge
(VCP Left)
25
25
+4kV
-4kV
B
B
A
A
Pass
Pass
Indirect Discharge
(VCP Back)
25
25
+4kV
-4kV
B
B
A
A
Pass
Pass
Indirect Discharge
(VCP Right)
25
25
+4kV
-4kV
B
B
A
A
Pass
Pass
Note:
The testing performed is from lowest level up to the highest level as required by standard, but only
highest level is shown on the report.
NR: No Requirement Meet criteria A: Operate as intended during and after the test Meet criteria B: Operate as intended after the test Meet criteria C: Loss/Error of function Additional Information
EUT stopped operation and could / could not be reset by operator at kV. No false alarms or other malfunctions were observed during or after the test.
Remark:
The Contact discharges were applied at least total 200 discharges at a minimum of four test points.

Report No:10C324R-ITCEP07V06
Page: 89 of 127
Product All in one PC
Test Item Electrostatic Discharge
Test Mode Mode 2
Date of Test 2010/12/31 Test Site No.6 Shielded Room
Item Amount of
Discharge Voltage
Required
Criteria
Complied To
Criteria
(A,B,C)
Results
Air Discharge 10
10
+8kV
-8kV
B
B
A
A
Pass
Pass
Contact Discharge 25
25
+4kV
-4kV
B
B
A
A
Pass
Pass
Indirect Discharge
(HCP)
25
25
+4kV
-4kV
B
B
A
A
Pass
Pass
Indirect Discharge
(VCP Front)
25
25
+4kV
-4kV
B
B
A
A
Pass
Pass
Indirect Discharge
(VCP Left)
25
25
+4kV
-4kV
B
B
A
A
Pass
Pass
Indirect Discharge
(VCP Back)
25
25
+4kV
-4kV
B
B
A
A
Pass
Pass
Indirect Discharge
(VCP Right)
25
25
+4kV
-4kV
B
B
A
A
Pass
Pass
Note:
The testing performed is from lowest level up to the highest level as required by standard, but only
highest level is shown on the report.
NR: No Requirement Meet criteria A: Operate as intended during and after the test Meet criteria B: Operate as intended after the test Meet criteria C: Loss/Error of function Additional Information
EUT stopped operation and could / could not be reset by operator at kV. No false alarms or other malfunctions were observed during or after the test.
Remark:
The Contact discharges were applied at least total 200 discharges at a minimum of four test points.

Report No:10C324R-ITCEP07V06
Page: 90 of 127
8.7. Test Photograph Test Mode : Mode 1
Description : ESD Test Setup
Test Mode : Mode 2
Description : ESD Test Setup
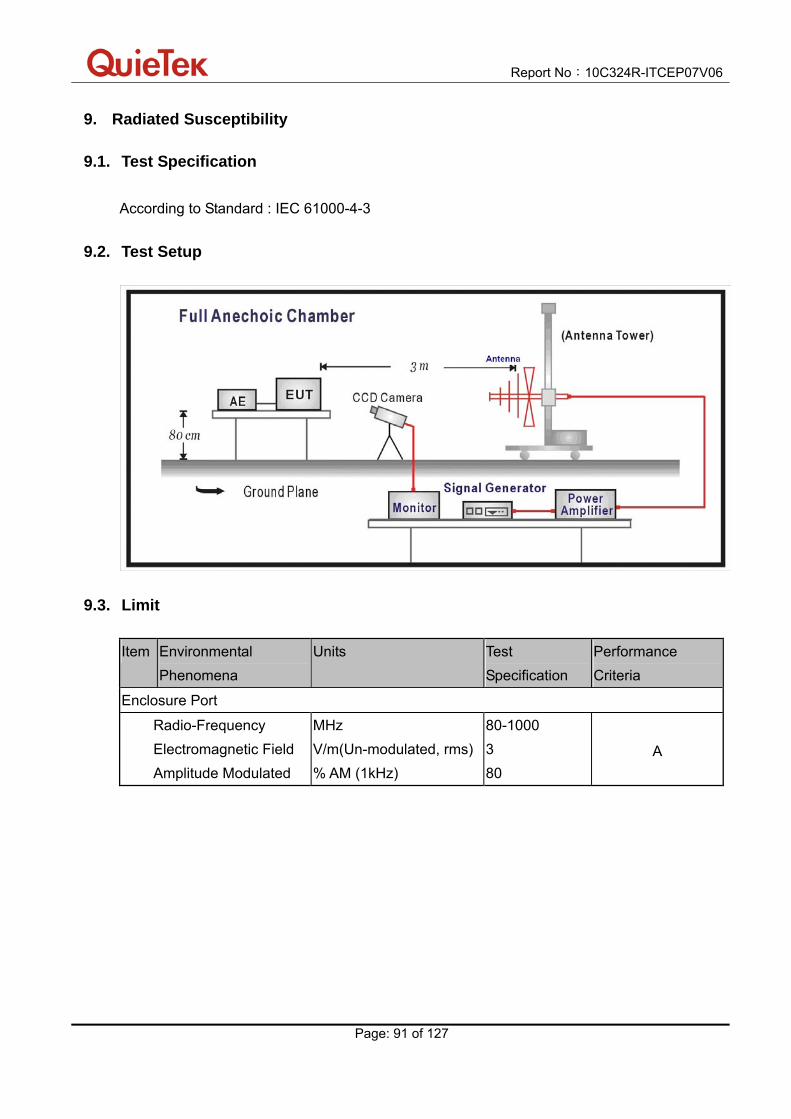
Report No:10C324R-ITCEP07V06
Page: 91 of 127
9. Radiated Susceptibility
9.1. Test Specification
According to Standard : IEC 61000-4-3
9.2. Test Setup
9.3. Limit
Item Environmental
Phenomena
Units Test
Specification
Performance
Criteria
Enclosure Port
Radio-Frequency
Electromagnetic Field
Amplitude Modulated
MHz
V/m(Un-modulated, rms)
% AM (1kHz)
80-1000
3
80
A

Report No:10C324R-ITCEP07V06
Page: 92 of 127
9.4. Test Procedure
The EUT and load, which are placed on a table that is 0.8 meter above ground, are
placed with one coincident with the calibration plane such that the distance from
antenna to the EUT was 3 meters.
Both horizontal and vertical polarization of the antenna and four sides of the EUT are set
on measurement.
In order to judge the EUT performance, a CCD camera is used to monitor EUT screen.
All the scanning conditions are as follows:
Condition of Test Remarks
1. Field Strength 3 V/m Level 2
2. Radiated Signal AM 80% Modulated with 1kHz
3. Scanning Frequency 80MHz - 1000MHz
4 Dwell Time 3 Seconds
5. Frequency step size f : 1%
6. The rate of Swept of Frequency 1.5 x 10⁻³ decades/s
9.5. Deviation from Test Standard
No deviation.

Report No:10C324R-ITCEP07V06
Page: 93 of 127
9.6. Test Result Product All in one PC
Test Item Radiated susceptibility
Test Mode Mode 1
Date of Test 2010/12/31 Test Site Chamber5
Frequency
(MHz)
Position
(Angle) Polarity
(H or V)
Field
Strength
(V/m)
Required
Criteria
Complied To
Criteria
(A,B,C)
Results
80-1000 FRONT H 3 A A PASS
80-1000 FRONT V 3 A A PASS
80-1000 BACK H 3 A A PASS
80-1000 BACK V 3 A A PASS
80-1000 RIGHT H 3 A A PASS
80-1000 RIGHT V 3 A A PASS
80-1000 LEFT H 3 A A PASS
80-1000 LEFT V 3 A A PASS
80-1000 UP H 3 A A PASS
80-1000 UP V 3 A A PASS
80-1000 DOWN H 3 A A PASS
80-1000 DOWN V 3 A A PASS
Note:
The testing performed is from lowest level up to the highest level as required by standard, but
only highest level is shown on the report.
Meet criteria A: Operate as intended during and after the test Meet criteria B: Operate as intended after the test Meet criteria C: Loss/Error of function Additional Information
There was no observable degradation in performance. EUT stopped operation and could / could not be reset by operator at V/m
at frequency MHz.
No false alarms or other malfunctions were observed during or after the test.

Report No:10C324R-ITCEP07V06
Page: 94 of 127
Product All in one PC
Test Item Radiated susceptibility
Test Mode Mode 2
Date of Test 2010/12/31 Test Site Chamber5
Frequency
(MHz)
Position
(Angle) Polarity
(H or V)
Field
Strength
(V/m)
Required
Criteria
Complied To
Criteria
(A,B,C)
Results
80-1000 FRONT H 3 A A PASS
80-1000 FRONT V 3 A A PASS
80-1000 BACK H 3 A A PASS
80-1000 BACK V 3 A A PASS
80-1000 RIGHT H 3 A A PASS
80-1000 RIGHT V 3 A A PASS
80-1000 LEFT H 3 A A PASS
80-1000 LEFT V 3 A A PASS
80-1000 UP H 3 A A PASS
80-1000 UP V 3 A A PASS
80-1000 DOWN H 3 A A PASS
80-1000 DOWN V 3 A A PASS
Note:
The testing performed is from lowest level up to the highest level as required by standard, but
only highest level is shown on the report.
Meet criteria A: Operate as intended during and after the test Meet criteria B: Operate as intended after the test Meet criteria C: Loss/Error of function Additional Information
There was no observable degradation in performance. EUT stopped operation and could / could not be reset by operator at V/m
at frequency MHz.
No false alarms or other malfunctions were observed during or after the test.
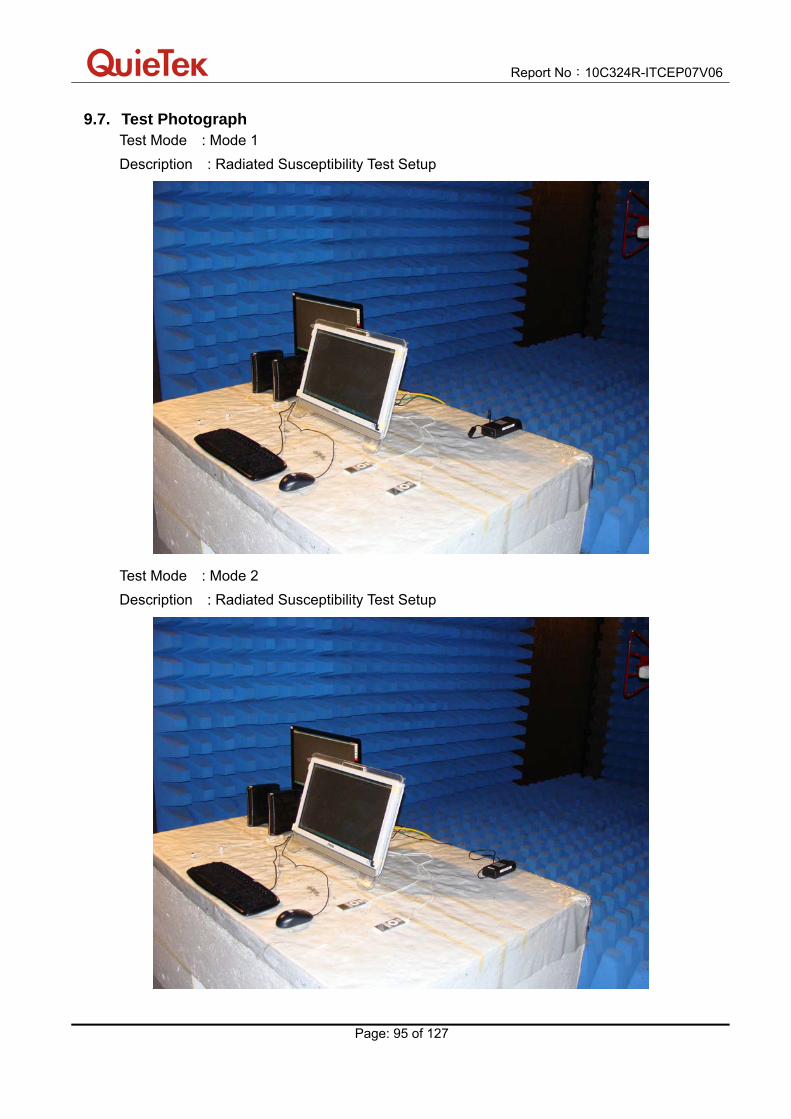
Report No:10C324R-ITCEP07V06
Page: 95 of 127
9.7. Test Photograph Test Mode : Mode 1
Description : Radiated Susceptibility Test Setup
Test Mode : Mode 2
Description : Radiated Susceptibility Test Setup

Report No:10C324R-ITCEP07V06
Page: 96 of 127
10. Electrical Fast Transient/Burst
10.1. Test Specification
According to Standard : IEC 61000-4-4
10.2. Test Setup
10.3. Limit
Item Environmental Phenomena
Units Test Specification Performance Criteria
I/O and communication ports Fast Transients Common Mode
kV (Peak) Tr/Th ns Rep. Frequency kHz
+0.5 5/50 5
B
Input DC Power Ports Fast Transients Common Mode
kV (Peak) Tr/Th ns Rep. Frequency kHz
+0.5 5/50 5
B
Input AC Power Ports Fast Transients Common Mode
kV (Peak) Tr/Th ns Rep. Frequency kHz
+1 5/50 5
B

Report No:10C324R-ITCEP07V06
Page: 97 of 127
10.4. Test Procedure
The EUT is placed on a table that is 0.8 meter height. A ground reference plane is placed on
the table, and uses a 0.1m insulation between the EUT and ground reference plane.
The minimum area of the ground reference plane is 1m*1m, and 0.65mm thick min, and
projected beyond the EUT by at least 0.1m on all sides.
Test on I/O and communication ports:
The EFT interference signal is through a coupling clamp device couples to the signal and
control lines of the EUT with burst noise for 1minute.
Test on power supply ports:
The EUT is connected to the power mains through a coupling device that directly couples the
EFT/B interference signal.
Each of the Line and Neutral conductors is impressed with burst noise for 1 minute.
The length of the signal and power lines between the coupling device and the EUT is 0.5m.
10.5. Deviation from Test Standard
No deviation.
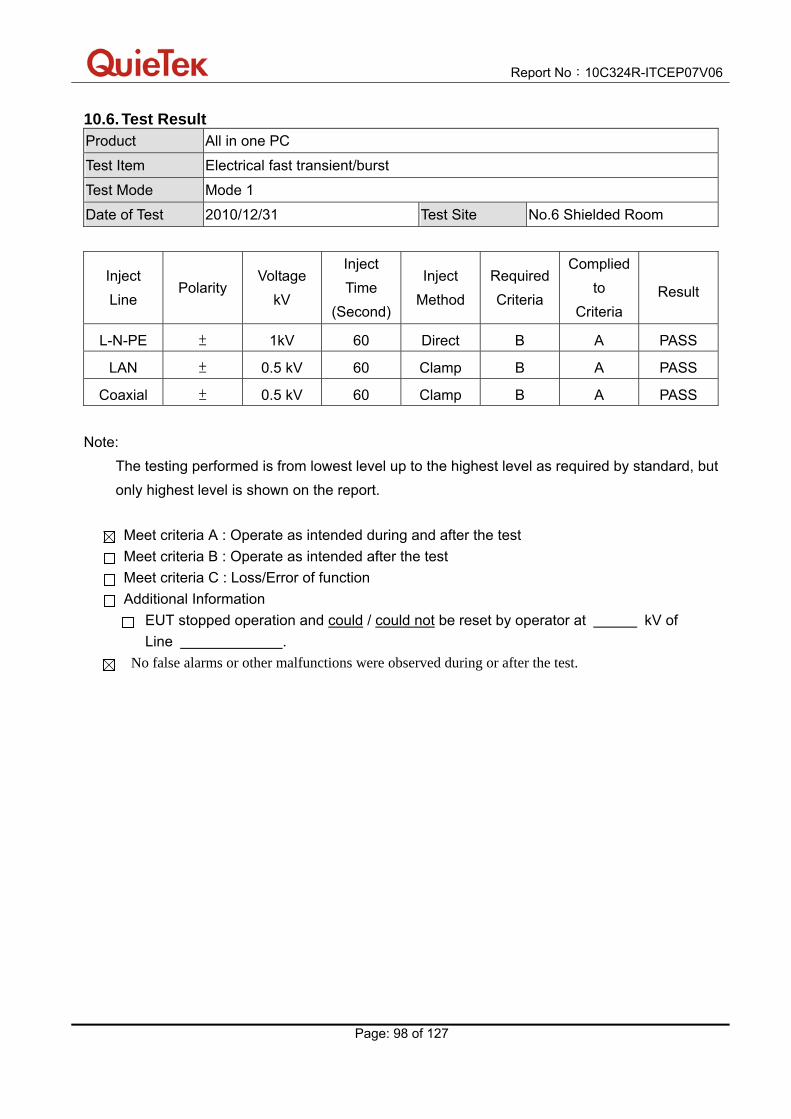
Report No:10C324R-ITCEP07V06
Page: 98 of 127
10.6. Test Result Product All in one PC
Test Item Electrical fast transient/burst
Test Mode Mode 1
Date of Test 2010/12/31 Test Site No.6 Shielded Room
Inject
Line Polarity
Voltage
kV
Inject
Time
(Second)
Inject
Method
Required
Criteria
Complied
to
Criteria Result
L-N-PE ± 1kV 60 Direct B A PASS
LAN ± 0.5 kV 60 Clamp B A PASS
Coaxial ± 0.5 kV 60 Clamp B A PASS
Note:
The testing performed is from lowest level up to the highest level as required by standard, but
only highest level is shown on the report.
Meet criteria A : Operate as intended during and after the test
Meet criteria B : Operate as intended after the test
Meet criteria C : Loss/Error of function
Additional Information
EUT stopped operation and could / could not be reset by operator at kV of
Line .
No false alarms or other malfunctions were observed during or after the test.

Report No:10C324R-ITCEP07V06
Page: 99 of 127
Product All in one PC
Test Item Electrical fast transient/burst
Test Mode Mode 2
Date of Test 2010/12/31 Test Site No.6 Shielded Room
Inject
Line Polarity
Voltage
kV
Inject
Time
(Second)
Inject
Method
Required
Criteria
Complied
to
Criteria Result
L-N-PE ± 1kV 60 Direct B A PASS
LAN ± 0.5 kV 60 Clamp B A PASS
Coaxial ± 0.5 kV 60 Clamp B A PASS
Note:
The testing performed is from lowest level up to the highest level as required by standard, but
only highest level is shown on the report.
Meet criteria A : Operate as intended during and after the test
Meet criteria B : Operate as intended after the test
Meet criteria C : Loss/Error of function
Additional Information
EUT stopped operation and could / could not be reset by operator at kV of
Line .
No false alarms or other malfunctions were observed during or after the test.

Report No:10C324R-ITCEP07V06
Page: 100 of 127
10.7. Test Photograph Test Mode : Mode 1
Description : EFT/B Test Setup
Test Mode : Mode 1
Description : EFT/B Test Setup - Clamp

Report No:10C324R-ITCEP07V06
Page: 101 of 127
Test Mode : Mode 2
Description : EFT/B Test Setup
Test Mode : Mode 2
Description : EFT/B Test Setup - Clamp

Report No:10C324R-ITCEP07V06
Page: 102 of 127
11. Surge
11.1. Test Specification
According to Standard : IEC 61000-4-5
11.2. Test Setup
11.3. Limit
Item Environmental Phenomena Units Test Specification Performance Criteria
Signal Ports and Telecommunication Ports(See 1) and 2) ) Surges Line to Ground
Tr/Th us kV
1.2/50 (8/20) 1
B
Input DC Power Ports Surges Line to Ground
Tr/Th us kV
1.2/50 (8/20) 0.5
B
AC Input and AC Output Power Ports Surges Line to Line Line to Ground
Tr/Th us kV kV
1.2/50 (8/20) 1 2
B
Notes:
1) Applicable only to ports which according to the manufacturer’s may directly to outdoor
cables.
2) Where normal functioning cannot be achieved because of the impact of the CDN on the
EUT, no immunity test shall be required.

Report No:10C324R-ITCEP07V06
Page: 103 of 127
11.4. Test Procedure
The EUT and its load are placed on a table that is 0.8 meter above a metal ground plane
measured 1m*1m min. and 0.65mm thick min. And projected beyond the EUT by at least
0.1m on all sides. The length of power cord between the coupling device and the EUT shall
be 2m or less.
For Input and Output AC Power or DC Input and DC Output Power Ports:
The EUT is connected to the power mains through a coupling device that directly couples the
Surge interference signal.
The surge noise shall be applied synchronized to the voltage phase at 00, 900, 1800, 2700 and
the peak value of the a.c. voltage wave. (Positive and negative)
Each of Line-Earth and Line-Line is impressed with a sequence of five surge voltages with
interval of 1 min.
11.5. Deviation from Test Standard
No deviation.

Report No:10C324R-ITCEP07V06
Page: 104 of 127
11.6. Test Result Product All in one PC
Test Item Surge
Test Mode Mode 1
Date of Test 2010/12/31 Test Site No.6 Shielded Room
Inject
Line Polarity Angle
Voltage
kV
Time
Interval
(Second)
Inject
Method
Required
Criteria
Complied
to
Criteria Result
L-N ± 0 1kV 60 Direct B A PASS
L-N ± 90 1kV 60 Direct B A PASS
L-N ± 180 1kV 60 Direct B A PASS
L-N ± 270 1kV 60 Direct B A PASS
L-PE ± 0 2kV 60 Direct B A PASS
L-PE ± 90 2kV 60 Direct B A PASS
L-PE ± 180 2kV 60 Direct B A PASS
L-PE ± 270 2kV 60 Direct B A PASS
N-PE ± 0 2kV 60 Direct B A PASS
N-PE ± 90 2kV 60 Direct B A PASS
N-PE ± 180 2kV 60 Direct B A PASS
N-PE ± 270 2kV 60 Direct B A PASS
Note:
The testing performed is from lowest level up to the highest level as required by standard, but
only highest level is shown on the report.
Meet criteria A : Operate as intended during and after the test Meet criteria B : Operate as intended after the test Meet criteria C : Loss/Error of function Additional Information
EUT stopped operation and could / could not be reset by operator at kV of Line .
No false alarms or other malfunctions were observed during or after the test.

Report No:10C324R-ITCEP07V06
Page: 105 of 127
Product All in one PC
Test Item Surge
Test Mode Mode 2
Date of Test 2010/12/31 Test Site No.6 Shielded Room
Inject
Line Polarity Angle
Voltage
kV
Time
Interval
(Second)
Inject
Method
Required
Criteria
Complied
to
Criteria Result
L-N ± 0 1kV 60 Direct B A PASS
L-N ± 90 1kV 60 Direct B A PASS
L-N ± 180 1kV 60 Direct B A PASS
L-N ± 270 1kV 60 Direct B A PASS
L-PE ± 0 2kV 60 Direct B A PASS
L-PE ± 90 2kV 60 Direct B A PASS
L-PE ± 180 2kV 60 Direct B A PASS
L-PE ± 270 2kV 60 Direct B A PASS
N-PE ± 0 2kV 60 Direct B A PASS
N-PE ± 90 2kV 60 Direct B A PASS
N-PE ± 180 2kV 60 Direct B A PASS
N-PE ± 270 2kV 60 Direct B A PASS
Note:
The testing performed is from lowest level up to the highest level as required by standard, but
only highest level is shown on the report.
Meet criteria A : Operate as intended during and after the test Meet criteria B : Operate as intended after the test Meet criteria C : Loss/Error of function Additional Information
EUT stopped operation and could / could not be reset by operator at kV of Line .
No false alarms or other malfunctions were observed during or after the test.

Report No:10C324R-ITCEP07V06
Page: 106 of 127
11.7. Test Photograph Test Mode : Mode 1
Description : SURGE Test Setup
Test Mode : Mode 2
Description : SURGE Test Setup

Report No:10C324R-ITCEP07V06
Page: 107 of 127
12. Conducted Susceptibility
12.1. Test Specification
According to Standard : IEC 61000-4-6
12.2. Test Setup
CDN Test Mode
EM Clamp Test Mode

Report No:10C324R-ITCEP07V06
Page: 108 of 127
12.3. Limit
Item Environmental Phenomena Units Test Specification
Performance Criteria
Signal Ports and Telecommunication Ports Radio-Frequency Continuous Conducted
MHz V (rms, Un-modulated) % AM (1kHz)
0.15-80 3 80
A
Input DC Power Ports Radio-Frequency Continuous Conducted
MHz V (rms, Un-modulated) % AM (1kHz)
0.15-80 3 80
A
Input AC Power Ports Radio-Frequency Continuous Conducted
MHz V (rms, Un-modulated) % AM (1kHz)
0.15-80 3 80
A
12.4. Test Procedure
The EUT are placed on a table that is 0.8 meter height, and a Ground reference plane on the table, EUT are placed upon table and use a 10cm insulation between the EUT and Ground reference plane. For Signal Ports and Telecommunication Ports The disturbance signal is through a coupling and decoupling networks (CDN) or EM-clamp device couples to the signal and Telecommunication lines of the EUT. For Input DC and AC Power Ports The EUT is connected to the power mains through a coupling and decoupling networks for power supply lines. And directly couples the disturbances signal into EUT. Used CDN-M2 for two wires or CDN-M3 for three wires. All the scanning conditions are as follows: Condition of Test Remarks 1. Field Strength 130dBuV(3V) Level 2 2. Radiated Signal AM 80% Modulated with 1kHz 3. Scanning Frequency 0.15MHz – 80MHz 4 Dwell Time 3 Seconds 5. Frequency step size f : 1% 6. The rate of Swept of Frequency 1.5 x 10⁻³ decades/s
12.5. Deviation from Test Standard
No deviation.

Report No:10C324R-ITCEP07V06
Page: 109 of 127
12.6. Test Result Product All in one PC
Test Item Conducted susceptibility
Test Mode Mode 1
Date of Test 2010/12/31 Test Site No.6 Shielded Room
Frequency
Range
(MHz)
Voltage
Applied
dBuV(V)
Inject
Method
Tested Port
of
EUT
Required
Criteria
Performance
Criteria
Complied To
Result
0.15~80 130 (3V) CDN AC IN A A PASS
0.15~80 130 (3V) CDN LAN A A PASS
0.15~80 130 (3V) Clamp Coaxial A A PASS
Note:
The testing performed is from lowest level up to the highest level as required by standard, but
only highest level is shown on the report.
Meet criteria A : Operate as intended during and after the test
Meet criteria B : Operate as intended after the test
Meet criteria C : Loss/Error of function
Additional Information
EUT stopped operation and could / could not be reset by operator at dBuV(V) at
frequency MHz.
No false alarms or other malfunctions were observed during or after the test. The
acceptance criteria were met, and the EUT passed the test.

Report No:10C324R-ITCEP07V06
Page: 110 of 127
Product All in one PC
Test Item Conducted susceptibility
Test Mode Mode 2
Date of Test 2010/12/31 Test Site No.6 Shielded Room
Frequency
Range
(MHz)
Voltage
Applied
dBuV(V)
Inject
Method
Tested Port
of
EUT
Required
Criteria
Performance
Criteria
Complied To
Result
0.15~80 130 (3V) CDN AC IN A A PASS
0.15~80 130 (3V) CDN LAN A A PASS
0.15~80 130 (3V) Clamp Coaxial A A PASS
Note:
The testing performed is from lowest level up to the highest level as required by standard, but
only highest level is shown on the report.
Meet criteria A : Operate as intended during and after the test
Meet criteria B : Operate as intended after the test
Meet criteria C : Loss/Error of function
Additional Information
EUT stopped operation and could / could not be reset by operator at dBuV(V) at
frequency MHz.
No false alarms or other malfunctions were observed during or after the test. The
acceptance criteria were met, and the EUT passed the test.
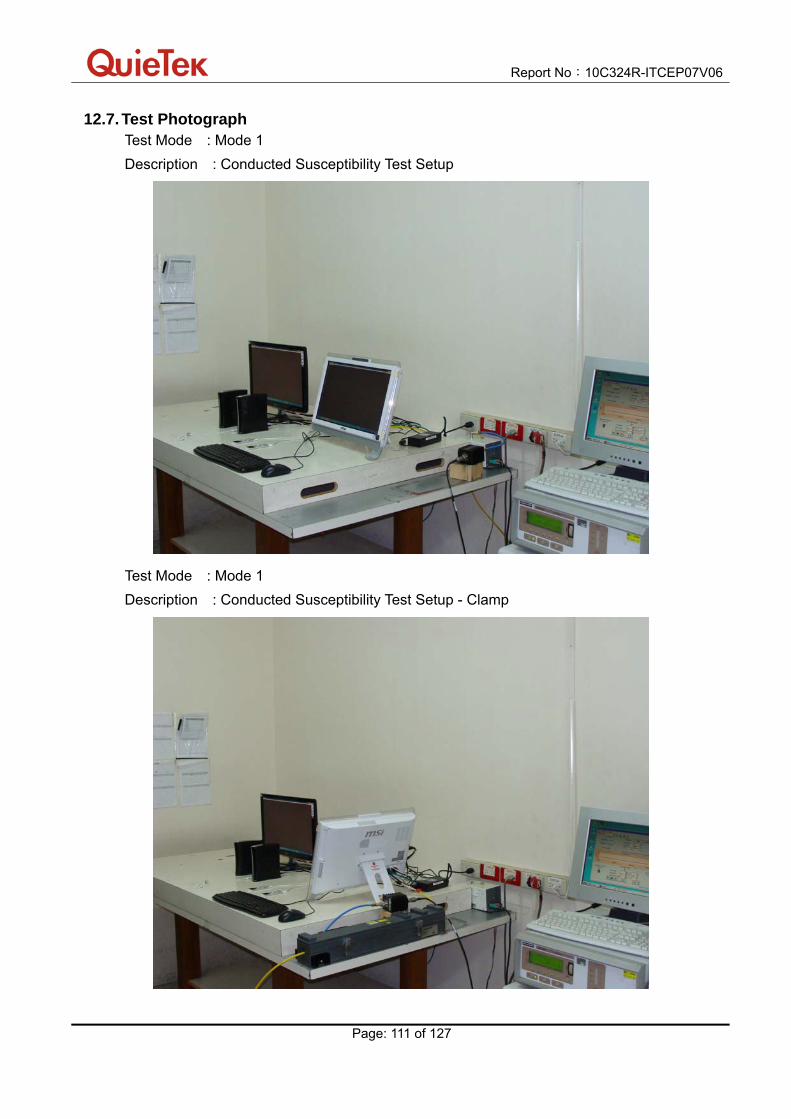
Report No:10C324R-ITCEP07V06
Page: 111 of 127
12.7. Test Photograph Test Mode : Mode 1
Description : Conducted Susceptibility Test Setup
Test Mode : Mode 1
Description : Conducted Susceptibility Test Setup - Clamp

Report No:10C324R-ITCEP07V06
Page: 112 of 127
Test Mode : Mode 2
Description : Conducted Susceptibility Test Setup
Test Mode : Mode 2
Description : Conducted Susceptibility Test Setup - Clamp

Report No:10C324R-ITCEP07V06
Page: 113 of 127
13. Power Frequency Magnetic Field
13.1. Test Specification
According to Standard : IEC 61000-4-8
13.2. Test Setup
13.3. Limit Item Environmental
Phenomena Units Test Specification Performance
Criteria Enclosure Port Power-Frequency
Magnetic Field Hz A/m (r.m.s.)
50 1
A
13.4. Test Procedure
The EUT and its load are placed on a table which is 0.8 meter above a metal ground
plane measured at least 1m*1m min. The test magnetic field shall be placed at central
of the induction coil.
The test magnetic Field shall be applied 10 minutes by the immersion method to the EUT.
And the induction coil shall be rotated by 90 in order to expose the EUT to the test field
with different orientation (X, Y, Z Orientations).
13.5. Deviation from Test Standard No deviation.

Report No:10C324R-ITCEP07V06
Page: 114 of 127
13.6. Test Result Product All in one PC
Test Item Power frequency magnetic field
Test Mode Mode 1
Date of Test 2010/12/31 Test Site No.3 Shielded Room
Polarization Frequency
(Hz)
Magnetic
Strength
(A/m)
Required
Performance
Criteria
Performance
Criteria
Complied To
Test Result
X Orientation 50 1 A A PASS
Y Orientation 50 1 A A PASS
Z Orientation 50 1 A A PASS
Meet criteria A: Operate as intended during and after the test
Meet criteria B: Operate as intended after the test
Meet criteria C: Loss/Error of function
Additional Information
EUT stopped operation and could / could not be reset by operator at kV
of Line .
No false alarms or other malfunctions were observed during or after the test. The acceptance
criteria were met, and the EUT passed the test.
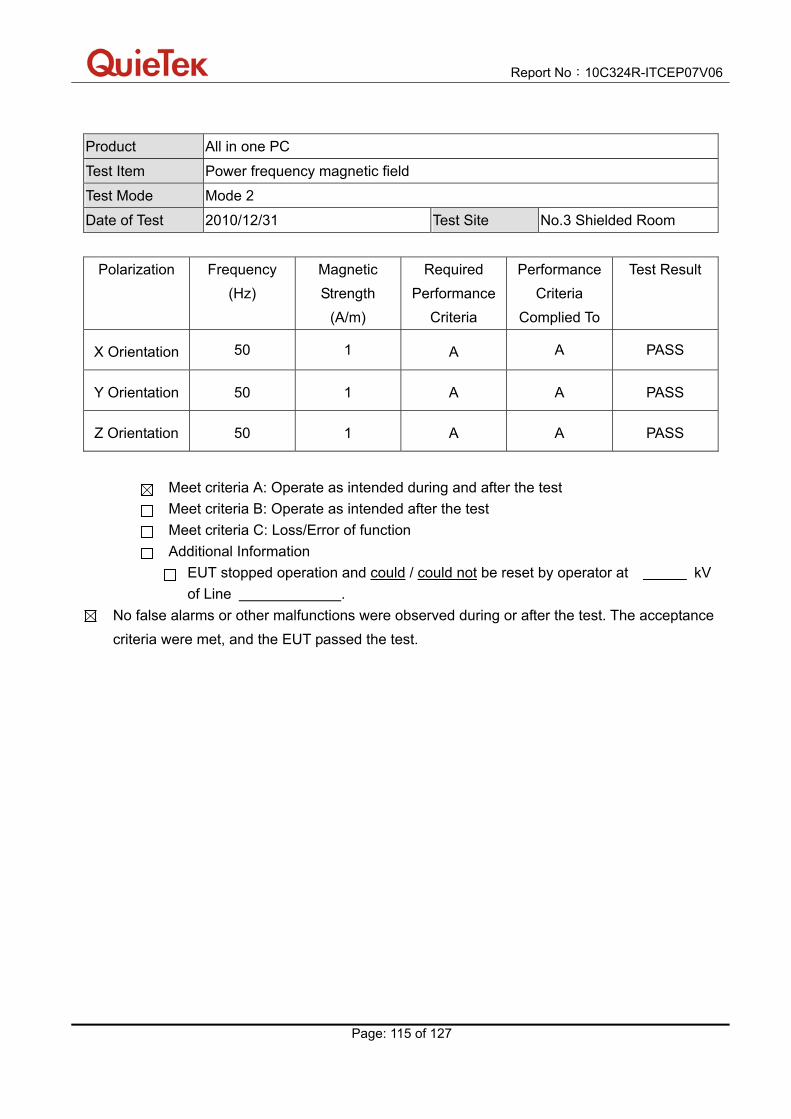
Report No:10C324R-ITCEP07V06
Page: 115 of 127
Product All in one PC
Test Item Power frequency magnetic field
Test Mode Mode 2
Date of Test 2010/12/31 Test Site No.3 Shielded Room
Polarization Frequency
(Hz)
Magnetic
Strength
(A/m)
Required
Performance
Criteria
Performance
Criteria
Complied To
Test Result
X Orientation 50 1 A A PASS
Y Orientation 50 1 A A PASS
Z Orientation 50 1 A A PASS
Meet criteria A: Operate as intended during and after the test
Meet criteria B: Operate as intended after the test
Meet criteria C: Loss/Error of function
Additional Information
EUT stopped operation and could / could not be reset by operator at kV
of Line .
No false alarms or other malfunctions were observed during or after the test. The acceptance
criteria were met, and the EUT passed the test.
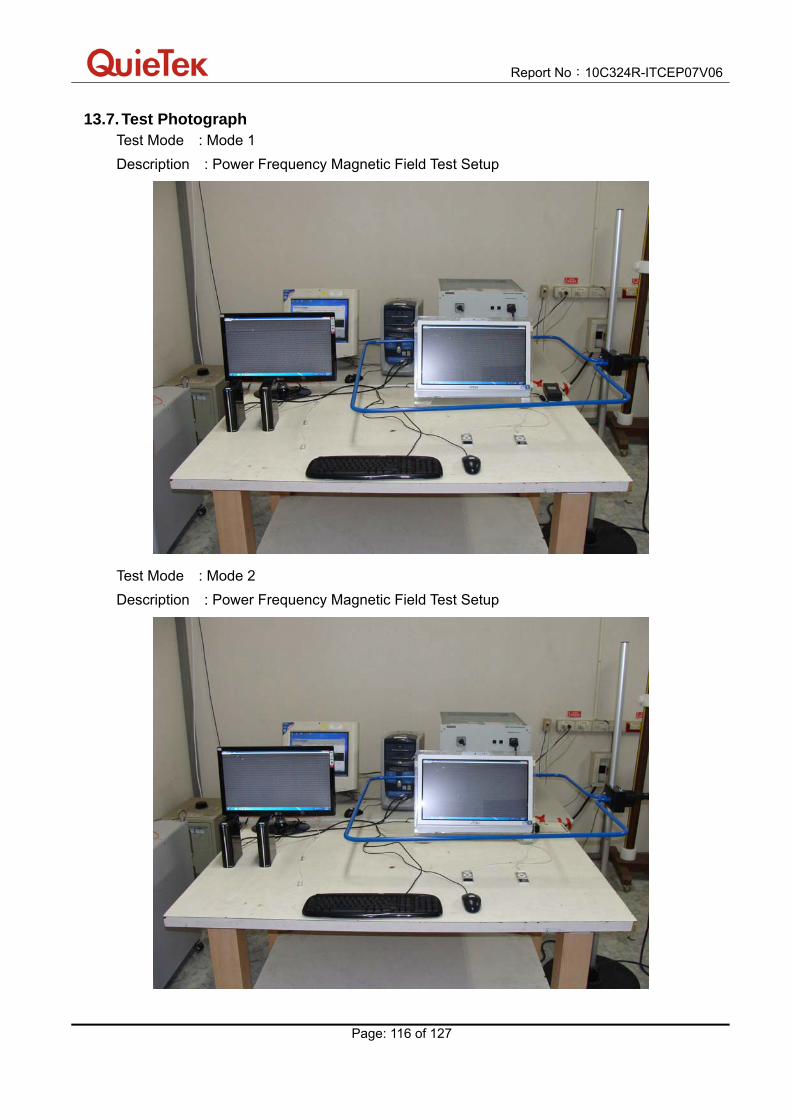
Report No:10C324R-ITCEP07V06
Page: 116 of 127
13.7. Test Photograph Test Mode : Mode 1
Description : Power Frequency Magnetic Field Test Setup
Test Mode : Mode 2
Description : Power Frequency Magnetic Field Test Setup

Report No:10C324R-ITCEP07V06
Page: 117 of 127
14. Voltage Dips and Interruption
14.1. Test Specification
According to Standard : IEC 61000-4-11
14.2. Test Setup
14.3. Limit
Item Environmental
Phenomena
Units Test Specification Performance
Criteria
Input AC Power Ports
% Reduction
Period
30
25 C
Voltage Dips
% Reduction
Period
>95
0.5 B
Voltage Interruptions % Reduction
Period
> 95
250 C

Report No:10C324R-ITCEP07V06
Page: 118 of 127
14.4. Test Procedure
The EUT and its load are placed on a table which is 0.8 meter above a metal ground plane
measured 1m*1m min. And 0.65mm thick min. And projected beyond the EUT by at least
0.1m on all sides. The power cord shall be used the shortest power cord as specified by the
manufacturer.
For Voltage Dips/ Interruptions test:
The selection of test voltage is based on the rated power range. If the operation range is
large than 20% of lower power range, both end of specified voltage shall be tested.
Otherwise, the typical voltage specification is selected as test voltage.
The EUT is connected to the power mains through a coupling device that directly couples to
the Voltage Dips and Interruption Generator.
The EUT shall be tested for 30% voltage dip of supplied voltage and duration 25 Periods,
for 95% voltage dip of supplied voltage and duration 0.5 Periods with a sequence of three
voltage dips with intervals of 10 seconds, and for 95% voltage interruption of supplied
voltage and duration 250 Periods with a sequence of three voltage interruptions with
intervals of 10 seconds.
Voltage phase shifting are shall occur at 00, 450, 900 ,1350 ,1800 ,2250, 2700 ,3150 of the
voltage.
14.5. Deviation from Test Standard
No deviation.

Report No:10C324R-ITCEP07V06
Page: 119 of 127
14.6. Test Result Product All in one PC
Test Item Voltage dips and interruption
Test Mode Mode 1
Date of Test 2010/12/31 Test Site No.6 Shielded Room
Voltage Dips and
Interruption
Reduction(%)
Angle Test Duration
(Periods)
Required
Performance
Criteria
Performance
Criteria
Complied To
Test Result
30 0 25 C A PASS
30 45 25 C A PASS
30 90 25 C A PASS
30 135 25 C A PASS
30 180 25 C A PASS
30 225 25 C A PASS
30 270 25 C A PASS
30 315 25 C A PASS
>95 0 0.5 B A PASS
>95 45 0.5 B A PASS
>95 90 0.5 B A PASS
>95 135 0.5 B A PASS
>95 180 0.5 B A PASS
>95 225 0.5 B A PASS
>95 270 0.5 B A PASS
>95 315 0.5 B A PASS
>95 0 250 C C PASS
>95 45 250 C C PASS
>95 90 250 C C PASS
>95 135 250 C C PASS
>95 180 250 C C PASS
>95 225 250 C C PASS
>95 270 250 C C PASS
>95 315 250 C C PASS
Meet criteria A: Operate as intended during and after the test Meet criteria B: Operate as intended after the test Meet criteria C: Loss/Error of function Additional Information
The nominal voltage of EUT is 230V. EUT stopped operation and could / could not be reset by operator at kV
of Line .
No false alarms or other malfunctions were observed during or after the test. The acceptance
criteria were met, and the EUT passed the test.

Report No:10C324R-ITCEP07V06
Page: 120 of 127
Product All in one PC
Test Item Voltage dips and interruption
Test Mode Mode 2
Date of Test 2010/12/31 Test Site No.6 Shielded Room
Voltage Dips and
Interruption
Reduction(%)
Angle Test Duration
(Periods)
Required
Performance
Criteria
Performance
Criteria
Complied To
Test Result
30 0 25 C A PASS
30 45 25 C A PASS
30 90 25 C A PASS
30 135 25 C A PASS
30 180 25 C A PASS
30 225 25 C A PASS
30 270 25 C A PASS
30 315 25 C A PASS
>95 0 0.5 B A PASS
>95 45 0.5 B A PASS
>95 90 0.5 B A PASS
>95 135 0.5 B A PASS
>95 180 0.5 B A PASS
>95 225 0.5 B A PASS
>95 270 0.5 B A PASS
>95 315 0.5 B A PASS
>95 0 250 C C PASS
>95 45 250 C C PASS
>95 90 250 C C PASS
>95 135 250 C C PASS
>95 180 250 C C PASS
>95 225 250 C C PASS
>95 270 250 C C PASS
>95 315 250 C C PASS
Meet criteria A: Operate as intended during and after the test Meet criteria B: Operate as intended after the test Meet criteria C: Loss/Error of function Additional Information
The nominal voltage of EUT is 230V. EUT stopped operation and could / could not be reset by operator at kV
of Line .
No false alarms or other malfunctions were observed during or after the test. The acceptance
criteria were met, and the EUT passed the test.
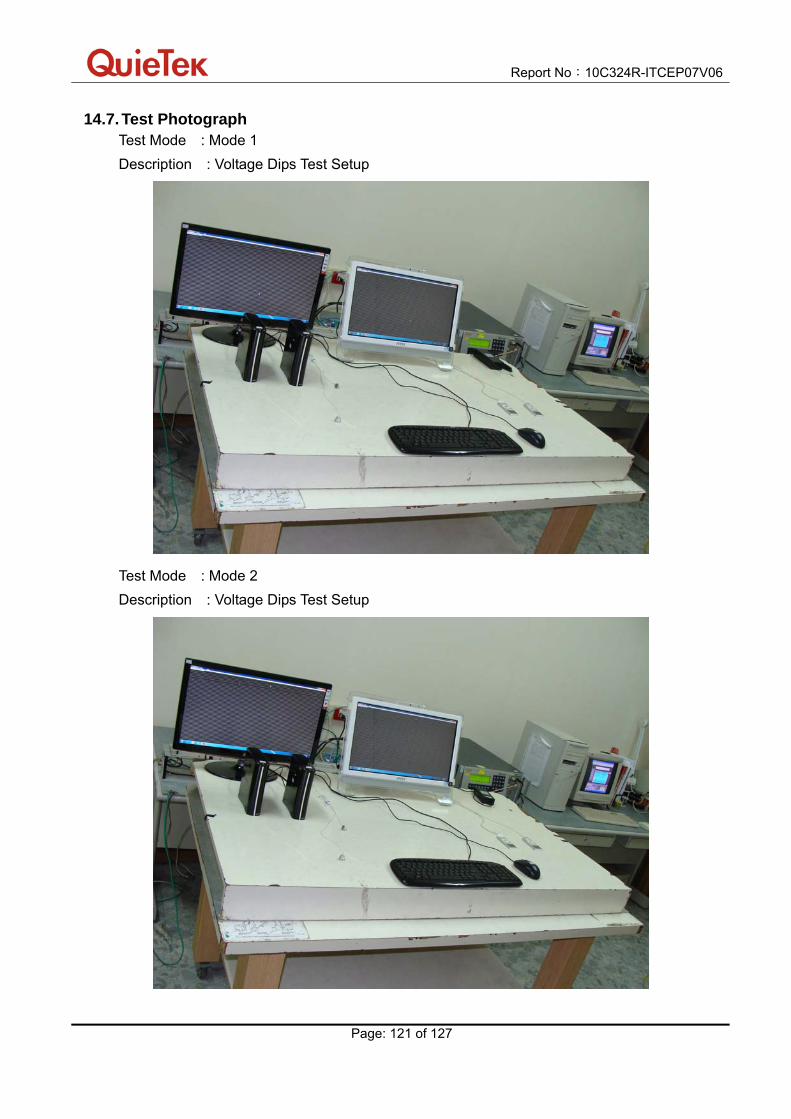
Report No:10C324R-ITCEP07V06
Page: 121 of 127
14.7. Test Photograph Test Mode : Mode 1
Description : Voltage Dips Test Setup
Test Mode : Mode 2
Description : Voltage Dips Test Setup

Report No:10C324R-ITCEP07V06
Page: 122 of 127
15. Attachment EUT Photograph
(1) EUT Photo
(2) EUT Photo

Report No:10C324R-ITCEP07V06
Page: 123 of 127
(3) EUT Photo
(4) EUT Photo

Report No:10C324R-ITCEP07V06
Page: 124 of 127
(5) EUT Photo
(6) EUT Photo

Report No:10C324R-ITCEP07V06
Page: 125 of 127
(7) EUT Photo
(8) EUT Photo

Report No:10C324R-ITCEP07V06
Page: 126 of 127
(9) EUT Photo
(10) EUT Photo

Report No:10C324R-ITCEP07V06
Page: 127 of 127
(11) EUT Photo
(12) EUT Photo


![Arbitration Agreements NPRM - Class Defense Blog...1 BILLING CODE: 4810-AM-P BUREAU OF CONSUMER FINANCIAL PROTECTION 12 CFR Part 1040 [Docket No. CFPB-2016-0020] RIN 3170-AA51 Arbitration](https://img.pdfslide.us/doc/110x75/5fe43be27d3fbf29787233aa/arbitration-agreements-nprm-class-defense-blog-1-billing-code-4810-am-p-bureau.jpg)


![INDIAN INSTITUTE OF TECHNOLOGY BOMBAY Aerospace Engineering (AE) [Department of Aerospace Engineering] Specialization : Aerodynamics (AE1) Dynamics and Control (AE2)](https://img.pdfslide.us/doc/110x75/5afd3acb7f8b9a944d8d24af/indian-institute-of-technology-bombay-aerospace-engineering-ae-department-of.jpg)