Embed Size (px)
Citation preview
106
EFFECT OF WALL BASE ROTATION ON BEHAVIOUR OF REINFORCED CONCRETE F R A M E - W A L L BUILDING
Daisuke Kato* Shunsuke Otani** Hideo Katsumata* and Hiroyuki Aoyama***
Presented at the Third South Pacific Regional Conference on
Earthquake Engineering, Wellington, May 1983.
SYNOPSIS
This paper reports the tests of multistorey frames including a base rotating wall under lateral load reversals. The wall base rotation limited the input forces and prevented damage in the wall. The beams, however, were forced to deform much during the wall rotation. The inelastic behaviour of frame members and the uplifting rotation of a structural wall at its base were idealised, and the effect of wall base rotation on frame behaviour was studied through inelastic earthquake response analysis. The base rotating shear walls performed better than or as good as flexural yielding walls.
INTRODUCTION
Recent earthquake-resistant design concept places explicit emphases on the inelastic deformation and energy dissipation capacities in addition to long-time accepted earthquake load resisting capacity. Regarding to the behaviour of the structural wall in a low-rise reinforced concrete building, three basic modes of failure have been identified: (a) shear failure; (b) flexural failure; and (c) base rotation. Of these three modes, the first two have been studied extensively in the past. In recent years some researchers reported on the base rotating shear walls (1, 2, 3, 4, 5 ) . However, the effect of base rotation of a structural wall on the behaviour of a reinforced concrete frame building is not clearly understood although a low-rise wall tends to uplift at its base rather than fail in shear or flexure, especially when the wall is supported on footing foundations.
The main objectives of this paper are to examine the effect of wall base rotation on the behaviour of frames through static load reversal tests and inelastic earthquake response analyses, paying special attention to the effect of connecting beams and the wall support conditions.
EXPERIMENT OF FRAMES
Test Programme
In order to understand the effect of the base rotation of a structural wall on the behaviour of a reinforced concrete frame building, a series of tests was carried out at the University of Tokyo. The base rotation is expected to occur in a low-rise shear wall. Consequently, an arbitrary three-storey reinforced concrete building with a structural wall in one bay standing on footing foundation was chosen to be a prototype structure, the elevation of which is shown in Figure 1(a). In case
-Graduate student, Department of Architecture, University of Tokyo
**Associate Professor, Department of Architecture, University of Tokyo
^--Chairman, Professor, Department of Architecture , University of Tokyo
B U L L E T I N OF THE NEW Z E A L A N D N A T I O N A L S O C I E T Y FOR
of the first mode of vibration, which normally controls the overturning effect at the base, the resultant of the earthquake forces may be reasonably assumed to act at the second floor level. The beams directly connected to a wall may be most significantly affected by the uplifting base rotation of the wall. Hence, the two-storey three-bay portion of the frame was isolated from the prototype structure (Figure 1(b)) . The gravity loads were assumed to be carried by the columns.
Three-fifth scale specimens were constructed. The wall was designed to fail by base rotation in all specimens. Variables in the three specimens were the failure modes (flexure or shear) of connecting beams and the support conditions (rigid or flexible) under the column footings. Specimen FR (flexural beams on rigid foundation) and specimen SR (shear beams on rigid foundation) were supported on rigid steel base. Specimen FD (flexural beams on deformable foundation) was supported on 100 mm thick hard rubber pads.
Dimensions and reinforcement of the specimens are shown in Figure 2. The amount of the beam top longitudinal reinforcement was deliberately increased to take into account the effect of slab reinforcement. River sand and gravel (maximum size 10 mm) were used as fine and coarse aggregates of the concrete. The average compressive strength of the concrete was 27.5 MPa. The average yield stresses of the deformed and plain bars were 367 and 235 MPa, respectively. The elastic modulus of hard rubber under uniaxial compression was approximately 28.1 MPa.
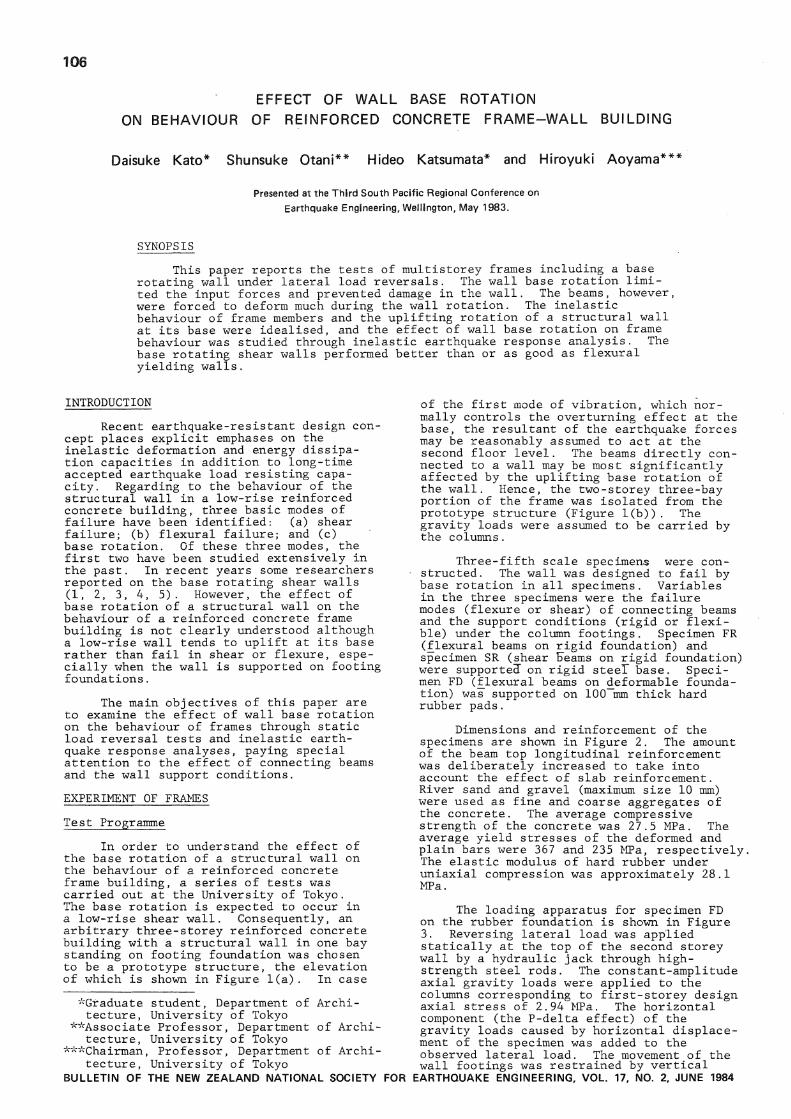
The loading apparatus for specimen FD on the rubber foundation is shown in Figure 3. Reversing lateral load was applied statically at the top of the second storey wall by a hydraulic jack through high-strength steel rods. The constant-amplitude axial gravity loads were applied to the columns corresponding to first-storey design axial stress of 2.94 MPa. The horizontal component (the P-delta effect) of the gravity loads caused by horizontal displacement of the specimen was added to the observed lateral load. The movement of the wall footings was restrained by vertical
E A R T H Q U A K E E N G I N E E R I N G , VOL . 17, NO. 2, JUNE 1984
107
t5=c5- -C5-(a) Proto-Type Structures (b) Idealized Test Structures
Fig. 1 Proto-Type and Test Structures
Specimens FR and FD BF
Specimen SR BS _ i _
GF > 2-1 (Pc-0,0070)
• 2-44-aSO (Pw-0.0071) ^ 2 - D 6 (PT-0.0070)
GS 2-D10 2 - 2 . 6 4 - 3 7 5 (Pw=O.C020)
^ 2 - D 1 0
(Pc=0.0l57) (Pw=0.C020) (PT-O.0157)
BF
m. BS
ffl
, 2 - D 1 0 (Pc-0.0157) ' 2-4+-35Q (Pw-0.0071) ! 2 - D 6 ( P T - 0 . 0 0 7 0 )
2-2.6*^375 <Pw*O .0020>
^ 2 - D 1 0 X P T - 0 . 0 1 5 7 )
CI
• 2 - D 1 Q CPc-0.0085) 2 - ^ - 3 3 0
C2 r , i a n ,
2 - D 1 0 ; ( P T = S . 0 0 8 5 )
38 3-D10 (Pc-O.0127> 2-44-330 (Pw=O.OQ6<0
^ 3-D10 (PT-0.0127)
WALL ^-350
^ 1 P H - 0 . 0 0 6 5
P T H J . O O M
Unit
Fig.2 Dimensions and Reinforcement of Test Structures
108
rollers so that the wall footings were free to uplift when the gravity load was overcome by the overturning effect. The movement of the column footings was restrained by friction between the footings and the base due to the vertical loads.
Except for specimen SR, lateral load was reversed at top deflection angles R equal to approximately 1/200, 1/100, 1/50 and 1/30. The deflection angle, the top displacement divided by overall height, was used to describe the deflection of the test structures in this paper. Test SR was terminated after reversal loading at a deflection angle of 1/60 because the connecting beams were severely damaged in shear.
Horizontal storey displacements of specimens, vertical displacements of footings, shear and flexural deformation of walls, and flexural rotation at beam end were measured by strain gauge-type displacement transducers. Strains in longitudinal reinforcing bars were measured at selected locations in beams, columns and walls by strain gauges.
Test Results
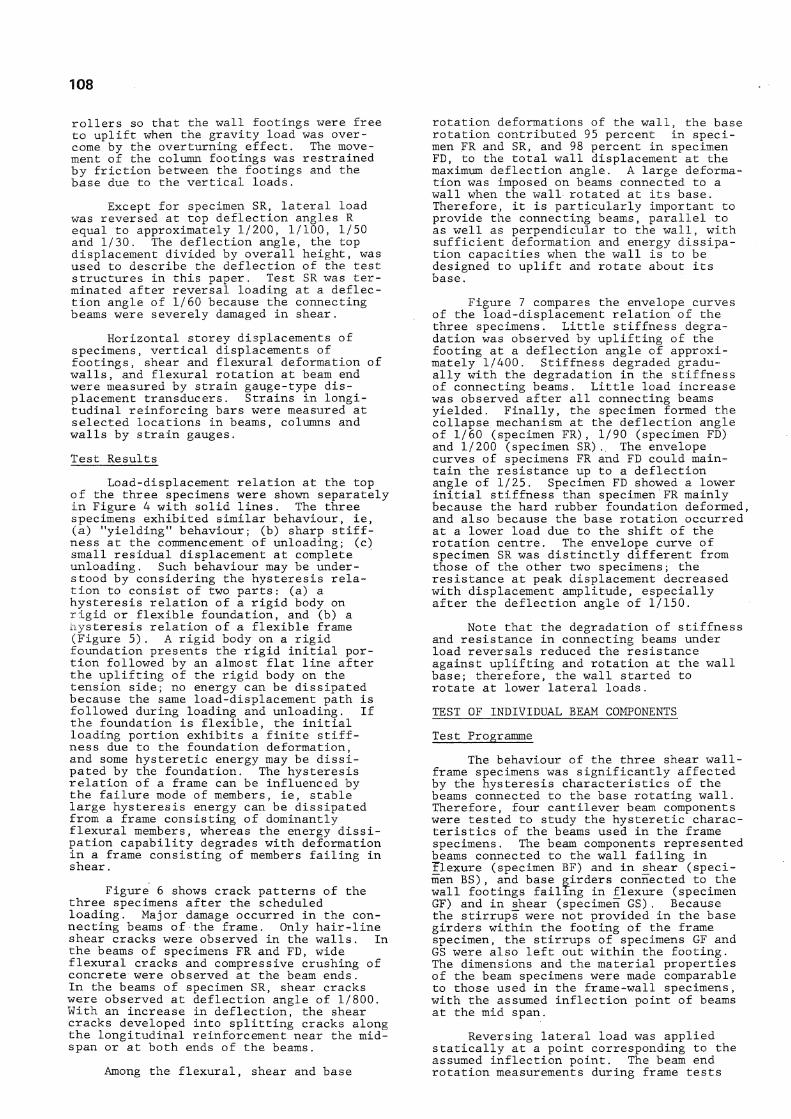
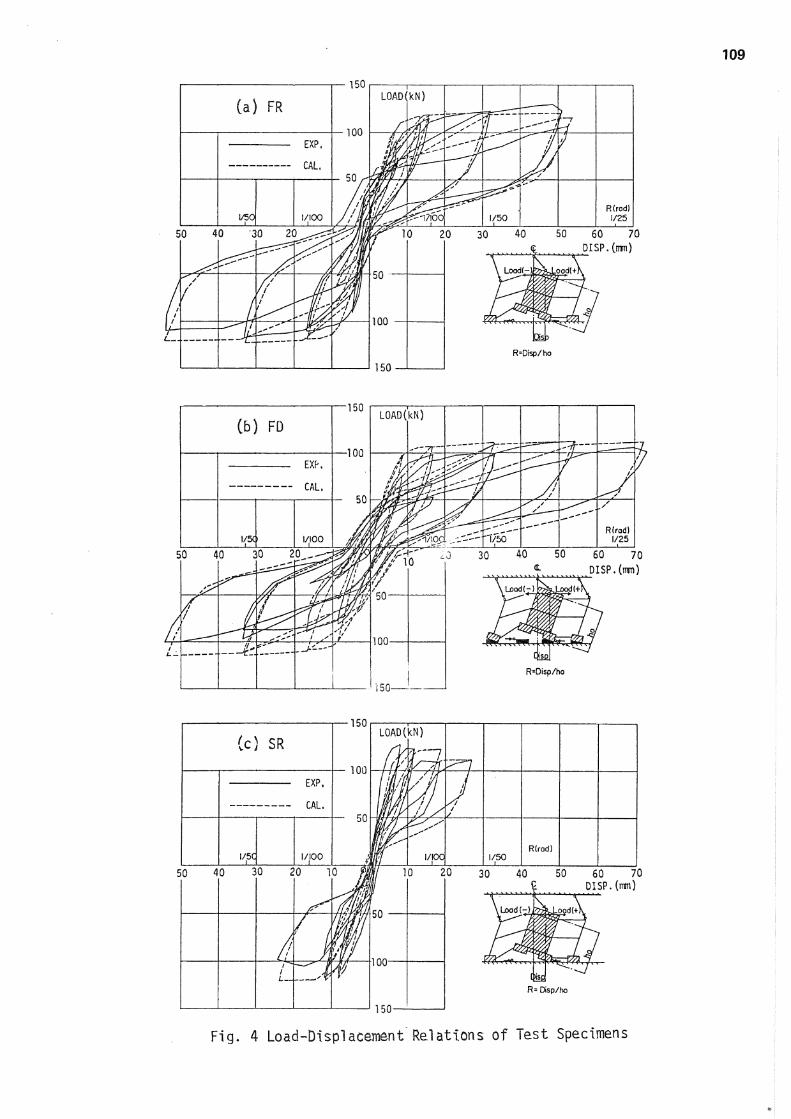
Load-displacement relation at the top of the three specimens were shown separately in Figure 4 with solid lines. The three specimens exhibited similar behaviour, ie, (a) "yielding" behaviour; (b) sharp stiffness at the commencement of unloading; (c) small residual displacement at complete unloading. Such behaviour may be understood by considering the hysteresis relation to consist of two parts: (a) a hysteresis relation of a rigid body on rigid or flexible foundation, and (b) a Hysteresis relation of a flexible frame (Figure 5 ) . A rigid body on a rigid foundation presents the rigid initial portion followed by an almost flat line after the uplifting of the rigid body on the tension side; no energy can be dissipated because the same load-displacement path is followed during loading and unloading. If the foundation is flexible, the initial loading portion exhibits a finite stiffness due to the foundation deformation, and some hysteretic energy may be dissipated by the foundation. The hysteresis relation of a frame can be influenced by the failure mode of members, ie, stable large hysteresis energy can be dissipated from a frame consisting of dominantly flexural members, whereas the energy dissipation capability degrades with deformation in a frame consisting of members failing in shear.
Figure 6 shows crack patterns of the three specimens after the scheduled loading. Major damage occurred in the connecting beams of the frame. Only hair-line shear cracks were observed in the walls. In the beams of specimens FR and FD, wide flexural cracks and compressive crushing of concrete were observed at the beam ends. In the beams of specimen SR, shear cracks were observed at deflection angle of 1/800. With an increase in deflection, the shear cracks developed into splitting cracks along the longitudinal reinforcement near the mid-span or at both ends of the beams.
Among the flexural, shear and base
rotation deformations of the wall, the base rotation contributed 95 percent in specimen FR and SR, and 98 percent in specimen FD, to the total wall displacement at the maximum deflection angle. A large deformation was imposed on beams connected to a wall when the wall rotated at its base. Therefore, it is particularly important to provide the connecting beams, parallel to as well as perpendicular to the wall, with sufficient deformation and energy dissipation capacities when the wall is to be designed to uplift and rotate about its base.
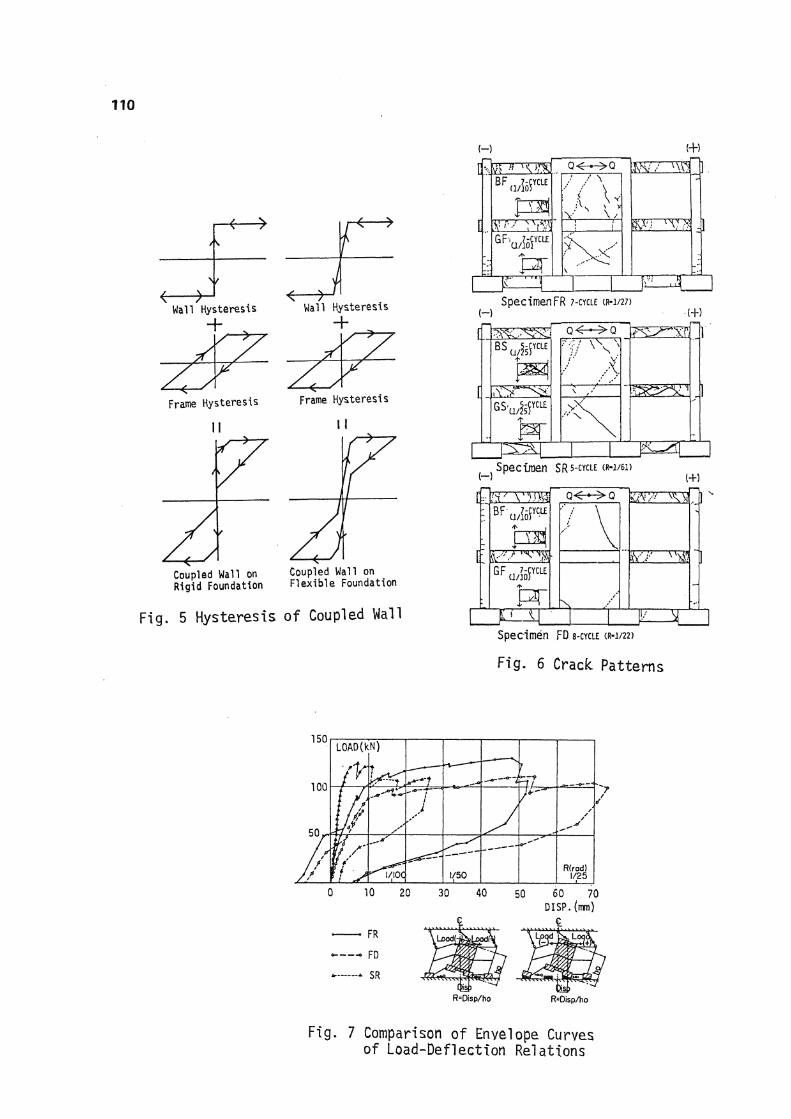
Figure 7 compares the envelope curves of the load-displacement relation of the three specimens. Little stiffness degradation was observed by uplifting of the footing at a deflection angle of approximately 1/400. Stiffness degraded gradually with the degradation in the stiffness of connecting beams. Little load increase was observed after all connecting beams yielded. Finally, the specimen formed the collapse mechanism at the deflection angle of 1/60 (specimen FR), 1/90 (specimen FD) and 1/200 (specimen SR). The envelope curves of specimens FR and FD could maintain the resistance up to a deflection angle of 1/25. Specimen FD showed a lower initial stiffness than specimen FR mainly because the hard rubber foundation deformed, and also because the base rotation occurred at a lower load due to the shift of the rotation centre. The envelope curve of specimen SR was distinctly different from those of the other two specimens; the resistance at peak displacement decreased with displacement amplitude, especially after the deflection angle of 1/150.
Note that the degradation of stiffness and resistance in connecting beams under load reversals reduced the resistance against uplifting and rotation at the wall base; therefore, the wall started to rotate at lower lateral loads.
TEST OF INDIVIDUAL BEAM COMPONENTS
Test Programme
The behaviour of the three shear wall-frame specimens was significantly affected by the hysteresis characteristics of the beams connected to the base rotating wall. Therefore, four cantilever beam components were tested to study the hysteretic characteristics of the beams used in the frame specimens. The beam components represented beams connected to the wall failing in Flexure (specimen BF) and in shear (specimen B S ) , and base girders connected to the wall footings failing in flexure (specimen GF) and in shear (specimen GS). Because the stirrups were not provided in the base girders within the footing of the frame specimen, the stirrups of specimens GF and GS were also left out within the footing. The dimensions and the material properties of the beam specimens were made comparable to those used in the frame-wall specimens, with the assumed inflection point of beams at the mid span.
Reversing lateral load was applied statically at a point corresponding to the assumed inflection point. The beam end rotation measurements during frame tests
109
110
<c >-
-< > •< ->
Wall Hysteresis Wall Hysteresis
Frame Hysteresis Frame Hysteresis
I I
Coupled Wall on Rigid Foundation
Coupled Wall on Flexible Foundation
Fig. 5 Hysteres is of Coupled Wall
(+)
1 U
(-)
L
Spec{menFR 7-CYCLE CR-I/27>
B S a / & Y C L E
J
(-)
4
Specimen SR S-CYCLE CR-I/6I>
B F ' a , M Y C l i
G F u / I o S Y C L E
1+)
4 . Specimen FD S-CYCLE CR-I/22)
Fig. 6 Crack. Patterns
150
50,
L0AD(k N) *
t 7
W y J
/ /
If -y 1/50 R(rad)
1/25
0 10 20 30 40 50 60 70 DlSP.(mm)
FR — , - FD
SR
R=Disp/ho R=Disp/ho
Fig* 7 Comparison of Envelope Curves of Load-Deflection Relations
111
showed that the maximum beam end rotation reached an angle of 1/10. Therefore, lateral load was reversed at member deflection angles of 1/200, 1/100, 1/50, 1/200, 1/25, 1/100 and 1/10. The lateral displacement and flexural rotation at the beam end were measured using strain gauge type displacement transducers. Strains in the longitudinal reinforcing bars were measured using strain gauges. The deformed bars used in the beam specimens were the same ones as used in the frame specimen. The average compressive strength of the concrete was 22.6 MPa.
Test Results
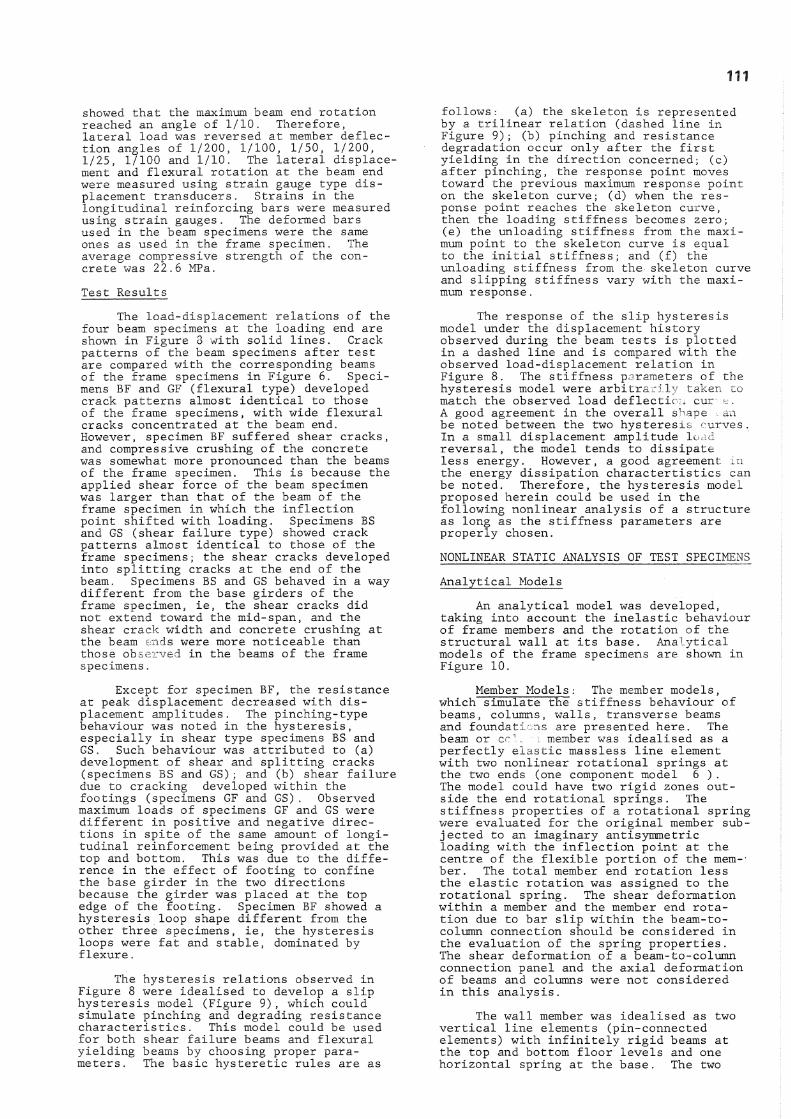
The load-displacement relations of the four beam specimens at the loading end are shown in Figure 8 with solid lines. Crack patterns of the beam specimens after test are compared with the corresponding beams of the frame specimens in Figure 6. Specimens BF and GF (flexural type) developed crack patterns almost identical to those of the frame specimens, with wide flexural cracks concentrated at the beam end. However, specimen BF suffered shear cracks, and compressive crushing of the concrete was somewhat more pronounced than the beams of the frame specimen. This is because the applied shear force of the beam specimen was larger than that of the beam of the frame specimen in which the inflection point shifted with loading. Specimens BS and GS (shear failure type) showed crack patterns almost identical to those of the frame specimens; the shear cracks developed into splitting cracks at the end of the beam. Specimens BS and GS behaved in a way different from the base girders of the frame specimen, ie, the shear cracks did not extend toward the mid-span, and the shear crack width and concrete crushing at the beam ends were more noticeable than those observed in the beams of the frame specimens.
Except for specimen BF, the resistance at peak displacement decreased with displacement amplitudes. The pinching-type behaviour was noted in the hysteresis, especially in shear type specimens BS and GS. Such behaviour was attributed to (a) development of shear and splitting cracks (specimens BS and GS); and (b) shear failure due to cracking developed within the footings (specimens GF and GS). Observed maximum loads of specimens GF and GS were different in positive and negative directions in spite of the same amount of longitudinal reinforcement being provided at the top and bottom. This was due to the difference in the effect of footing to confine the base girder in the two directions because the girder was placed at the top edge of the footing. Specimen BF showed a hysteresis loop shape different from the other three specimens, ie, the hysteresis loops were fat and stable, dominated by flexure.
The hysteresis relations observed in Figure 8 were idealised to develop a slip hysteresis model (Figure 9 ) , which could simulate pinching and degrading resistance characteristics. This model could be used for both shear failure beams and flexural yielding beams by choosing proper parameters . The basic hysteretic rules are as
follows: (a) the skeleton is represented by a trilinear relation (dashed line in Figure 9 ) ; (b) pinching and resistance degradation occur only after the first yielding in the direction concerned; (c) after pinching, the response point moves toward the previous maximum response point on the skeleton curve; (d) when the response point reaches the skeleton curve, then the loading stiffness becomes zero; (e) the unloading stiffness from the maximum point to the skeleton curve is equal to the initial stiffness; and (f) the unloading stiffness from the skeleton curve and slipping stiffness vary with the maximum response.
The response of the slip hysteresis model under the displacement history observed during the beam tests is plotted in a dashed line and is compared with the observed load-displacement relation in Figure 8. The stiffness parameters of the hysteresis model were arbitrarily taken to match the observed load deflection cur t. A good agreement in the overall shape .an be noted between the two hysteresis curves. In a small displacement amplitude load reversal, the model tends to dissipate less energy. However, a good agreement in the energy dissipation charactertistics can be noted. Therefore, the hysteresis model proposed herein could be used in the following nonlinear analysis of a structure as long as the stiffness parameters are properly chosen.
NONLINEAR STATIC ANALYSIS OF TEST SPECIMENS
Analytical Models
An analytical model was developed, taking into account the inelastic behaviour of frame members and the rotation of the structural wall at its base. Analytical models of the frame specimens are shown in Figure 10.
Member Models: The member models, which simulate the stiffness behaviour of beams, columns, walls, transverse beams and foundations are presented here. The beam or cel.„ i member was idealised as a perfectly elastic massless line element with two nonlinear rotational springs at the two ends (one component model 6 ) . The model could have two rigid zones outside the end rotational springs. The stiffness properties of a rotational spring were evaluated for the original member subjected to an imaginary antisymmetric loading with the inflection point at the centre of the flexible portion of the mem-' ber. The total member end rotation less the elastic rotation was assigned to the rotational spring. The shear deformation within a member and the member end rotation due to bar slip within the beam-to-column connection should be considered in the evaluation of the spring properties. The shear deformation of a beam-to-column connection panel and the axial deformation of beams and columns were not considered in this analysis.
The wall member was idealised as two vertical line elements (pin-connected elements) with infinitely rigid beams at the top and bottom floor levels and one horizontal spring at the base. The two
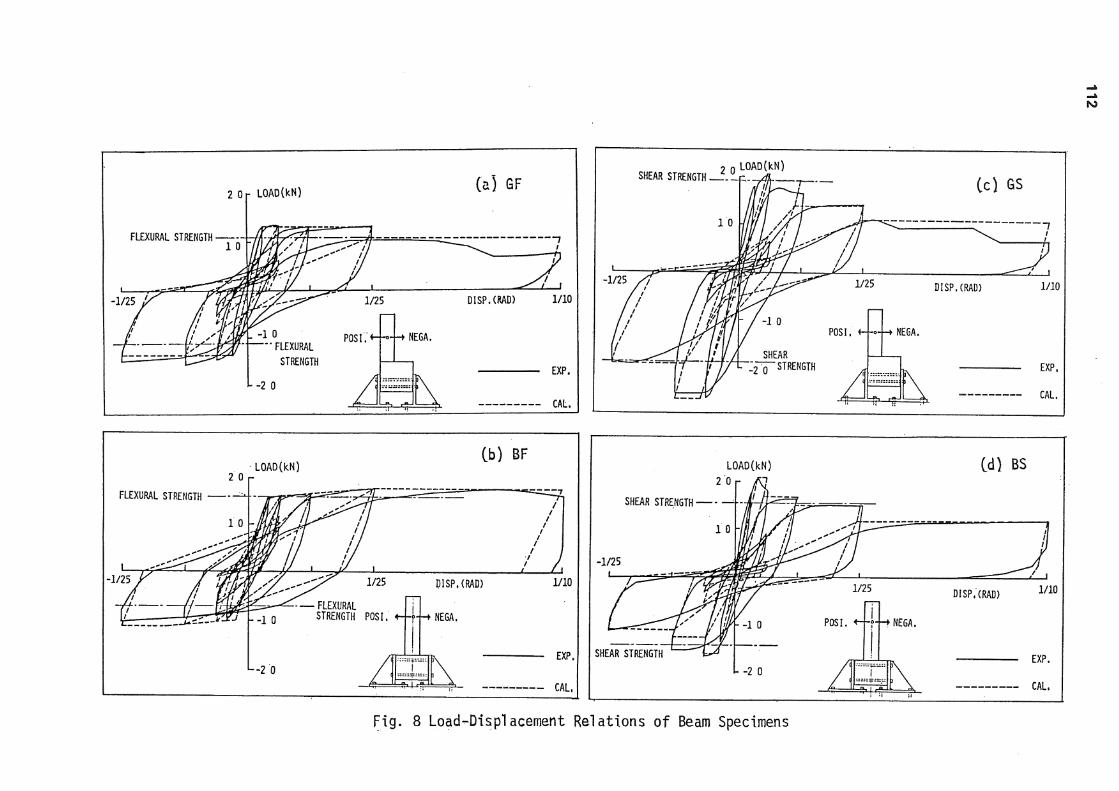
Fig. 8 Load-Displacement Relat ions of Beam Specimens
113
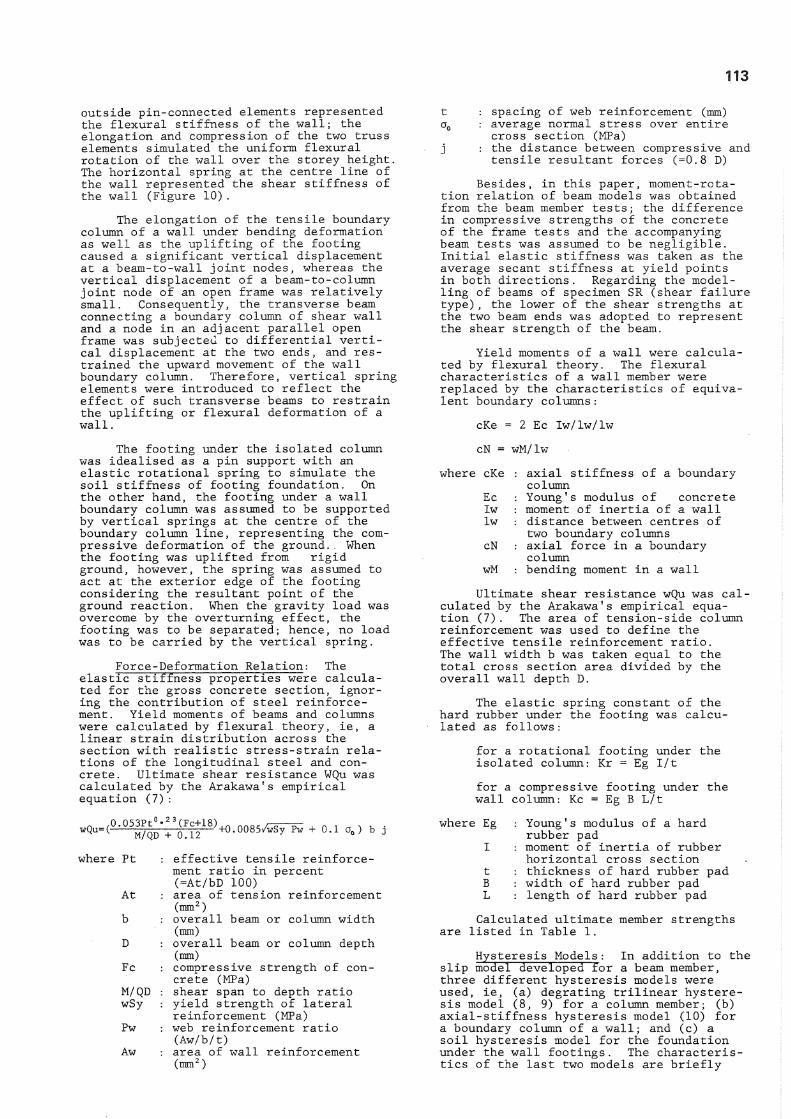
outside pin-connected elements represented the flexural stiffness of the wall; the elongation and compression of the two truss elements simulated the uniform flexural rotation of the wall over the storey height. The horizontal spring at the centre line of the wall represented the shear stiffness of the wall (Figure 10) .
The elongation of the tensile boundary column of a wall under bending deformation as well as the uplifting of the footing caused a significant vertical displacement at a beam-to-wall joint nodes, whereas the vertical displacement of a beam-to-column joint node of an open frame was relatively small. Consequently, the transverse beam connecting a boundary column of shear wall and a node in an adj acent parallel open frame was subjected to differential vertical displacement at the two ends, and restrained the upward movement of the wall boundary column. Therefore, vertical spring elements were introduced to reflect the effect of such transverse beams to restrain the uplifting or flexural deformation of a wall.
t : spacing of web reinforcement (mm) cr 0 : average normal stress over entire
cross section (MPa) j : the distance between compressive and
tensile resultant forces (=0.8 D)
Besides, in this paper, moment-rotation relation of beam models was obtained from the beam member tests; the difference in compressive strengths of the concrete of the frame tests and the accompanying beam tests was assumed to be negligible. Initial elastic stiffness was taken as the average secant stiffness at yield points in both directions. Regarding the modelling of beams of specimen SR (shear failure type), the lower of the shear strengths at the two beam ends was adopted to represent the shear strength of the beam.
Yield moments of a wall were calculated by flexural theory. The flexural characteristics of a wall member were replaced by the characteristics of equivalent boundary columns:
cKe = 2 Ec Iw/lw/lw
The footing under the isolated column was idealised as a pin support with an elastic rotational spring to simulate the soil stiffness of footing foundation. On the other hand, the footing under a wall boundary column was assumed to be supported by vertical springs at the centre of the boundary column line, representing the compressive deformation of the ground.. When the footing was uplifted from rigid ground, however, the spring was assumed to act at the exterior edge of the footing considering the resultant point of the ground reaction. When the gravity load was overcome by the overturning effect, the footing was to be separated; hence, no load was to be carried by the vertical spring.
Force-Deformation Relation: The elastic stiffness properties were calculated for the gross concrete section, ignoring the contribution of steel reinforcement . Yield moments of beams and columns were calculated by flexural theory, ie, a linear strain distribution across the section with realistic stress-strain relations of the longitudinal steel and concrete. Ultimate shear resistance WQu was calculated by the Arakawa's empirical equation (7):
cN = wM/lw
where cKe
Ec Iw lw
cN
wM
axial stiffness of a boundary column Young Ts modulus of concrete moment of inertia of a wall distance between centres of two boundary columns axial force in a boundary column bending moment in a wall
Ultimate shear resistance wQu was calculated by the Arakawa 1s empirical equation (7). The area of tension-side column reinforcement was used to define the effective tensile reinforcement ratio. The wall width b was taken equal to the total cross section area divided by the overall wall depth D.
The elastic spring constant of the hard rubber under the footing was calculated as follows:
for a rotational footing under the isolated column: Kr = Eg I/t
for a compressive footing under the wall column: Kc = Eg B L/t
wQu= (• 0.053Pt° 3(Fc+18)
M/QD +0.12 -K).0085/wSy Pw + 0.1 a 0 ) b j
where Pt
At
Fc
M/QD wSy
Pw
Aw
effective tensile reinforcement ratio in percent (-At/bD 100) area of tension reinforcement (mm 2) overall beam or column width (mm) overall beam or column depth (mm) compressive strength of concrete (MPa) shear span to depth ratio yield strength of lateral reinforcement (MPa) web reinforcement ratio (Aw/b/t) area of wall reinforcement (mm 2)
where Eg : Young's modulus of a hard rubber pad
I : moment of inertia of rubber horizontal cross section
t : thickness of hard rubber pad B : width of hard rubber pad L : length of hard rubber pad
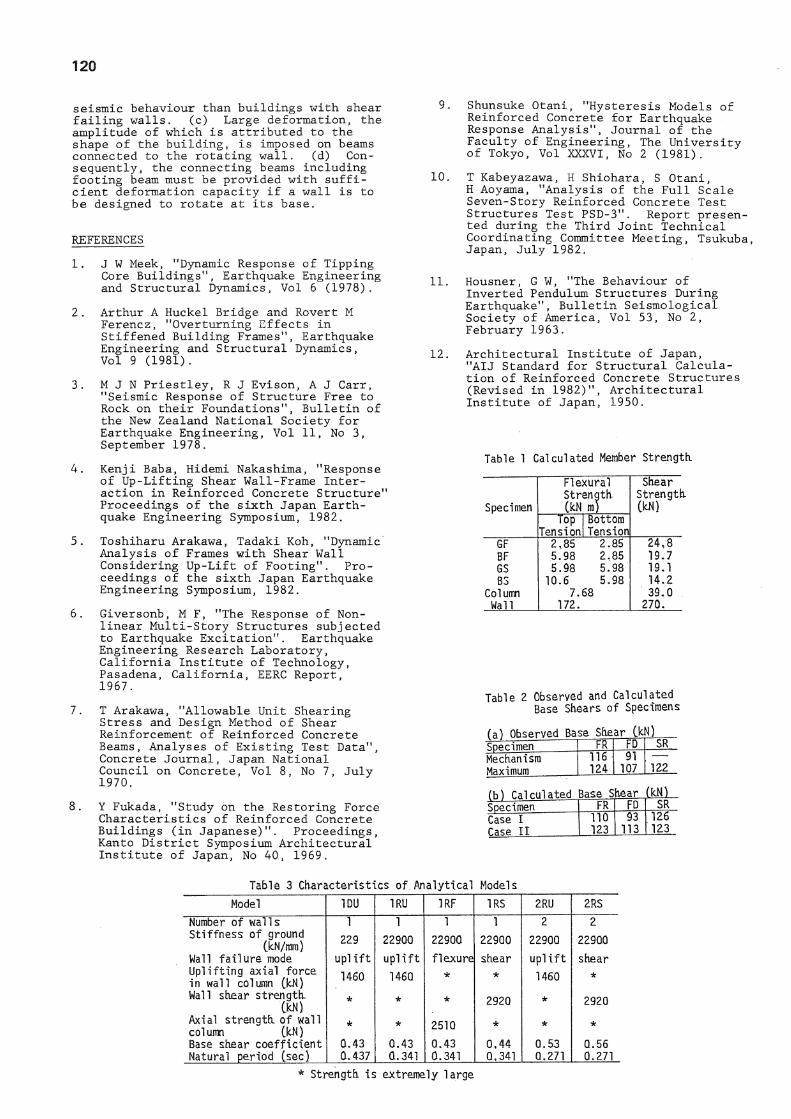
Calculated ultimate member strengths are listed in Table 1.
Hysteresis Models: In addition to the slip model developed for a beam member, three different hysteresis models were used, ie, (a) degrating trilinear hysteresis model (8, 9) for a column member; (b) axial-stiffness hysteresis model (10) for a boundary column of a wall; and (c) a soil hysteresis model for the foundation under the wall footings. The characteristics of the last two models are briefly
114
S l i p Zone S l i p Zone
SI1p Zone
Fig. 9 Hysteresis Model of Beams
0
M Y — ~ ~ ~~
/ / A "
Fig. 10 Analyt ica l Model (Specimen FD)
Fig. 11 A x i a l - S t i f f n e s s Hysteres is Model
i 4000i
^1 3000-
C o to a .
2000-
Dis
si
IOOO-
>>
CU UJ
1 4000
3000-O
"T T _ f 1 r
1 2 3 ^ 5 6 Q/200) (1/100) (1/100) Q/50) (1/200) (1/30) (1/30)
Load Cycle (Deflection Angle)
1 2 . 3 1 5 6 7 8 (1/200) (1/100) Q/50) (1/200) (1/50) (1/30) (1/100)(1/20)
Load Cycle (Deflection Angle)
1000
500-
>> cn
Fig.
1 2 3 4 5 (1/200) (1/200) Q/150) (1/100) a/60)
Load Cycle (Deflection Angle)
14 Energy D iss ipat ion of Frame Specimens and Models
(a) Experiment
f ^
(b) Hysteres is Model
Fig. 12 Character i s t i c s of Hard Rubber and Modell ing
CAL. (a) FR
Fig. 13 Collapse Mechanism
115
described in this section.
The axial-stiffness hysteresis model was used at the location of a wall boundary column to represent the flexural rotation of a wall. Referring to Figure 11, a point Y' is defined on the elastic compressive slope at a force level equal to the tensile yield strength Fy. The response point follows the regular bilinear hysteresis rules between the two points Y and Y'. Once tensile yielding occurs, then response point moves following the regular bilinear hysteresis rules between point Y 1 and previous maximum tensile response point M.
The behaviour of hard rubber under axial load reversals is not clearly under-stood. The following hysteresis model was developed on the basis of the result of compression test of hard rubber pieces, shown in Figure 12(a), and was used for the axial-deformation relation of a hard rubber (Figure 12 (b)). The basic hysteresis rules of the model are as follows, ie, (a) when initially loaded iri compression, the response point moves on the skeleton slope; (b) when unloaded, the stiffness changes when the response point crosses the dashed lines in Figure 12(b); (c) during reloading the response point moves toward the previous maximum response point. The stiffnesses during the loading and unloading were chosen from the compression test of the rubber.
Analytical Simulation of the Test
A nonlinear static analysis was performed to simulate the inelastic behaviour of the frame specimens. The same displacement history was imposed on the analytical model and the test specimen at the top floor.
The calculated load-displacement relations were compared with the test results, separately, for the three specimens in Figure 4. The collapse processes computed for the flexural yielding type specimens (FR, FD) were compared with those observed in Figure 13.
The analytical model of specimen FR developed the collapse mechanism when the yielding hinge was formed at the end of the top floor beam, whereas the test specimen FR by yielding at the bottom of the right column. This is due to the enhancement of flexural strength of the right column with the additional axial force attributed to the overturning effect. The calculated load-displacement relation of specimen FR agreed well with that of the test. The base shears at the commencement of the uplifting of the wall in each cycle, at the formation of the collapse mechanism, and at the maximum displacement of each cycle were approximately estimated by the analysis. Both in the analysis and experiment, the specimen FD developed the collapse mechanism when the yielding hinge was formed at the end of the top floor beam. However, the calculated load-displacement relation of specimen FD was somewhat larger than the observed base shear in a small displacement range. The results were sensitive to the modelling of vertical springs under the footing, ie, the stiffness of the rubber and the position of the spring. Regarding specimen SR, the envelope curve of the
calculated relation roughly agreed with that of the test although the beams of specimen SR failed in shear.
The energy dissipated in each cycle of hysteresis loops of the analytical model and the frame specimen is compared in Figure 14. Calculated energy dissipation of specimen FR under lateral load reversals showed a good agreement with that of the test specimen. A larger energy was dissipated by the analytical model because the base shear at peak displacement was overestimated by the model (Figure 14(b)). Specimen SR dissipated energy much less than the other two specimens, but calculated energy dissipation of specimen SR under lateral load reversals showed a reasonable agreement with observed behaviour.
Measured and calculated maximum base shears are compared in Table 2. Base shear of case I was calculated using the values shown in Table 1 while the base shear of case II using the values obtained from accompanying cantilever beam tests.
Calculated base shear of case I agreed well with the observed base shear at the formation of collapse mechanism. The calculated maximum base shear was lower than the maximum observed base shear probably because strain hardening of reinforcement was not considered in the analysis. The case II analysis gave base shears in a good agreement with the observed maximum base shears.
EARTHQUAKE RESPONSE ANALYSIS
Method of Analysis
Earthquake response analysis was conducted to study the behaviour of frame structures with base-rotating shear wall (Figure 15(a)) during an earthquake.
The number of degrees of freedom in an instantaneous stiffness matrix [Kr]i was reduced to the number of storey 4- 2 by static condensation, assuming zero rotational mass at each node and no external moment applied at the nodes. The governing dynamic equation for an i-th time step is expressed as follows:
[M]A{u}i + [c]iA{u}i + [Kr]iA[u}± = - { p}i - [>l]{e}Ax
where A{u} A{u} A{ii} Ax {e}
{p}
incremental displacement vector incremental velocity vector incremental acceleration vector incremental input acceleration influence coefficient vector (=1 for a row which input motion is considered) unbalanced force by overshooting
Mass matrix is expressed as follows:
[M] = mb 4- mg mb 4- mg
ml
moment of inertia about the edge of the wall
6 Q
V 9 I 1
jrawn
I mw2
jmwl
I=mb B+rmwk(-rlc) k n
(a) Model for Dynamic Analysts (b) I so lated Wall (c) Mass D i s t r ibu t ion
Fig. 15 Model for Dynamic Ana lys i s
Y i n = = = = n = = = n
Y 3 Q
\===Q===Ctt Q==Q — I ~ o
0 = 0
Q — o o LO
in a — 1
a — c _ j — l _ j C 3 [ 7000 | 7000 | 7000 | 7000 [ 7000 [ | 5500 [ 5500 [ 5500 J \ 5500 } 5500 | 5500 [ X0 XI X2 X3 X4 X5 Unit : mm X0X1X2X4X5 ^3
Fig. 16 Floor Plan and Sections of Bui lding
C-9000r
55 6000
3000
4 X Q X 1 X 2 X 4 X 5
Fig. 17 Ana l y t i ca l Model of Bui lding
370
R=1< H50 0 50 100 150
Displacement of the top floor (mn) Fig. 19 Calculated Load-
Displacement Relation of 1DU Model
3470 400 / 280
/ 7 '350
/ 410 430 350 340
/ / 510
-̂ 290 570
^370 480
410 A / "420 1280
"510 890
510 ^890 K2SO
390
540
640
3470 7
/_ 4250 3470
4250
A 5330
v 5330 v
^ 3 6 0 0
3600
3910
4640
3910
4640
9930 9930
(a) Frame X3 (b) Transverse Beam (c) Reduced Frame
F ig . 18 Ultimate Moments of Beams and Columns (Unit ; kN-m-)
117
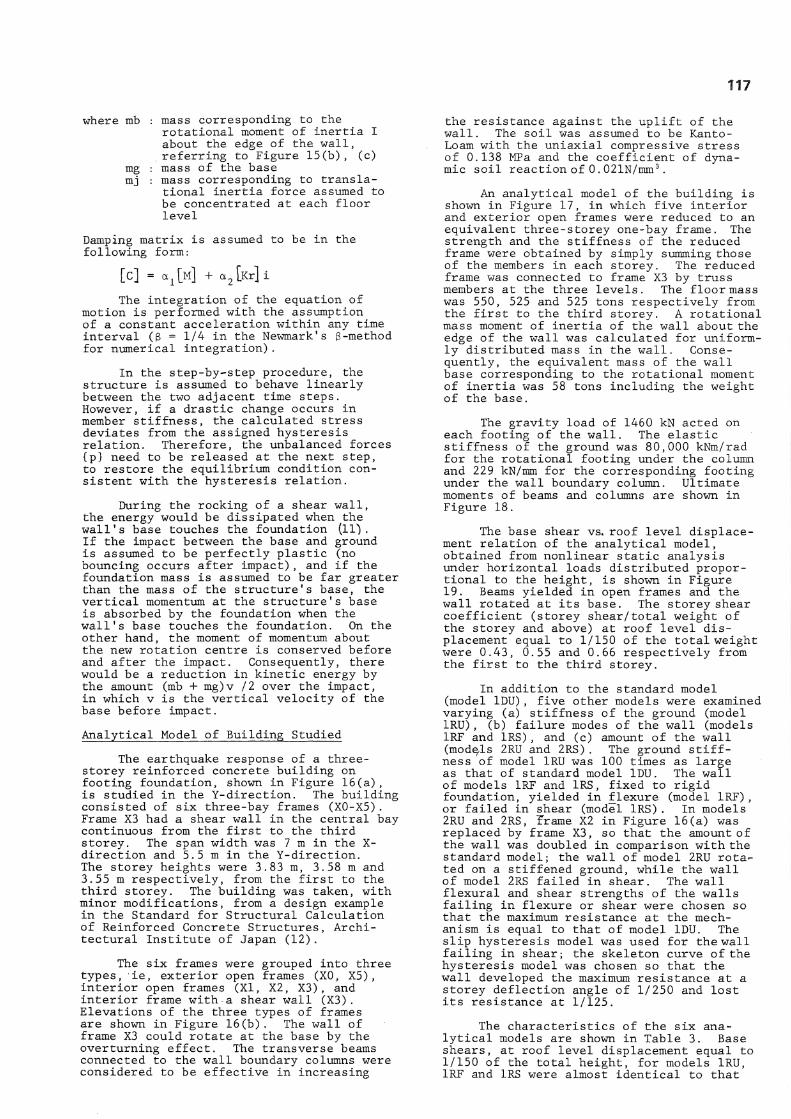
where mb : mass corresponding to the rotational moment of inertia I about the edge of the wall, referring to Figure 15(b), (c)
mg : mass of the base mj : mass corresponding to transla-
tional inertia force assumed to be concentrated at each floor level
Damping matrix is assumed to be in the following form:
[C] = a x[M] + a 2[Kr]i
The integration of the equation of motion is performed with the assumption of a constant acceleration within any time interval ($ = 1/4 in the Newmark 1s 3-method for numerical integration).
In the step-by-step procedure, the structure is assumed to behave linearly between the two adjacent time steps. However, if a drastic change occurs in member stiffness, the calculated stress deviates from the assigned hysteresis relation. Therefore, the unbalanced forces {p} need to be released at the next step, to restore the equilibrium condition consistent with the hysteresis relation.
During the rocking of a shear wall, the energy would be dissipated when the wall's base touches the foundation (11). If the impact between the base and ground is assumed to be perfectly plastic (no bouncing occurs after impact), and if the foundation mass is assumed to be far greater than the mass of the structure's base, the vertical momentum at the structure's base is absorbed by the foundation when the wall's base touches the foundation. On the other hand, the moment of momentum about the new rotation centre is conserved before and after the impact. Consequently, there would be a reduction in kinetic energy by the amount (mb + mg)v /2 over the impact, in which v is the vertical velocity of the base before impact.
Analytical Model of Building Studied
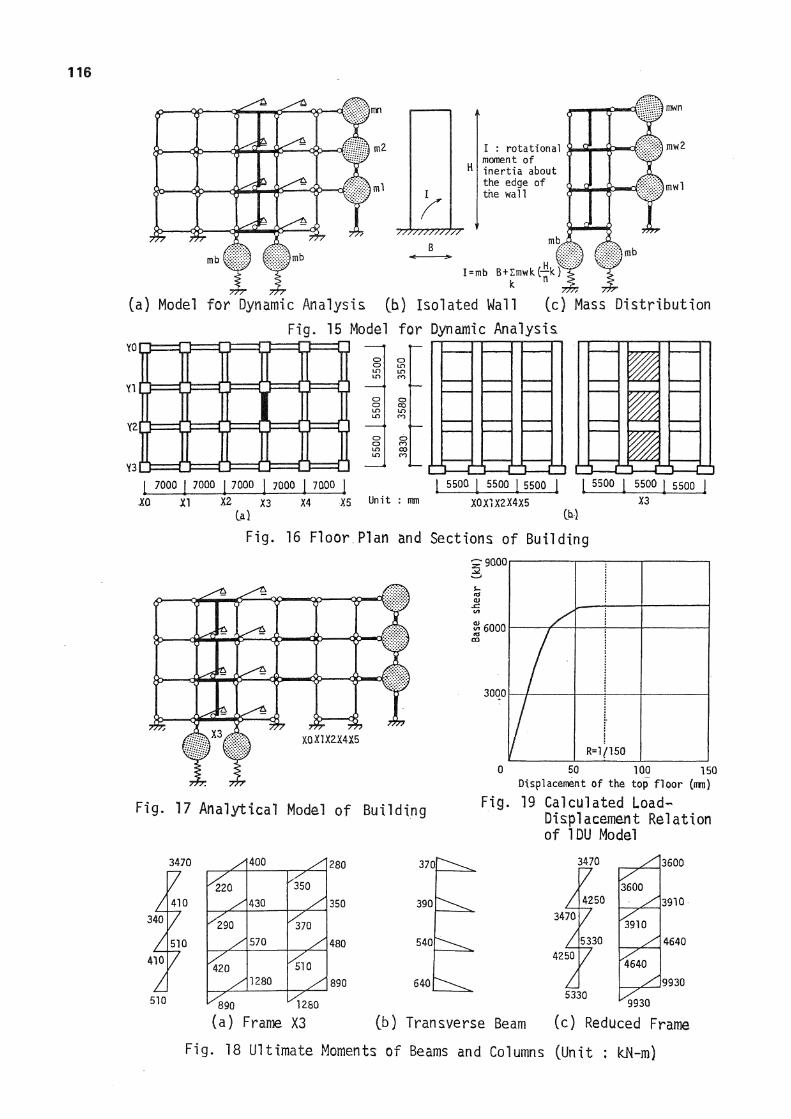
The earthquake response of a three-storey reinforced concrete building on footing foundation, shown in Figure 16(a), is studied in the Y-direction. The building consisted of six three-bay frames (X0-X5). Frame X3 had a shear wall in the central bay continuous from the first to the third storey. The span width was 7 m in the X-direction and 5.5 m in the Y-direction. The storey heights were 3.83 m, 3.58 m and 3.55 m respectively, from the first to the third storey. The building was taken, with minor modifications, from a design example in the Standard for Structural Calculation of Reinforced Concrete Structures, Architectural Institute of Japan (12).
The six frames were grouped into three types, ie, exterior open frames (XO, X5), interior open frames (XI, X2, X 3 ) , and interior frame with a shear wall (X3) . Elevations of the three types of frames are shown in Figure 16(b). The wall of frame X3 could rotate at the base by the overturning effect. The transverse beams connected to the wall boundary columns were considered to be effective in increasing
the resistance against the uplift of the wall. The soil was assumed to be Kanto-Loam with the uniaxial compressive stress of 0.138 MPa and the coefficient of dynamic soil reaction of 0.02lN/mm 3.
An analytical model of the building is shown in Figure 17, in which five interior and exterior open frames were reduced to an equivalent three-storey one-bay frame. The strength and the stiffness of the reduced frame were obtained by simply summing those of the members in each storey. The reduced frame was connected to frame X3 by truss members at the three levels. The floor mass was 550, 525 and 525 tons respectively from the first to the third storey. A rotational mass moment of inertia of the wall about the edge of the wall was calculated for uniformly distributed mass in the wall. Consequently, the equivalent mass of the wall base corresponding to the rotational moment of inertia was 58 tons including the weight of the base.
The gravity load of 1460 kN acted on each footing of the wall. The elastic stiffness of the ground was 80,000 kNm/rad for the rotational footing under the column and 229 kN/mm for the corresponding footing under the wall boundary column. Ultimate moments of beams and columns are shown in Figure 18.
The base shear vs. roof level displacement relation of the analytical model, obtained from nonlinear static analysis under horizontal loads distributed proportional to the height, is shown in Figure 19. Beams yielded in open frames and the wall rotated at its base. The storey shear coefficient (storey shear/total weight of the storey and above) at roof level displacement equal to 1/150 of the total weight were 0.43, 0.55 and 0.66 respectively from the first to the third storey.
In addition to the standard model (model 1DU), five other models were examined varying (a) stiffness of the ground (model 1RU), (b) failure modes of the wall (models 1RF and IRS) , and (c) amount of the wall (models 2RU and 2RS) . The ground stiffness of model 1RU was 100 times as large as that of standard model 1DU. The wall of models 1RF and IRS, fixed to rigid foundation, yielded in flexure (model 1RF), or failed in shear (model IRS). In models 2RU and 2RS, frame X2 in Figure 16(a) was replaced by frame X3, so that the amount of the wall was doubled in comparison with the standard model; the wall of model 2RU rotated on a stiffened ground, while the wall of model 2RS failed in shear. The wall flexural and shear strengths of the walls failing in flexure or shear were chosen so that the maximum resistance at the mechanism is equal to that of model 1DU. The slip hysteresis model was used for the wall failing in shear; the skeleton curve of the hysteresis model was chosen so that the wall developed the maximum resistance at a storey deflection angle of 1/250 and lost its resistance at 1/125.
The characteristics of the six analytical models are shown in Table 3. Base shears, at roof level displacement equal to 1/150 of the total height, for models 1RU, 1RF and IRS were almost identical to that
118
of model 1DU. The base shear of model 2RS was slightly larger than that of model 2RU due to the difference in the collapse mechanism, ie, yielding hinges were formed at the top of the column in the second storey in model 2RS.
Response of Analytical Models
The analytical models were subjected to the EW component of the Tokachi-Oki earthquake (1968) motion recorded at Hachinohe, the maximum acceleration of which was 183 gal. The intensity of the base motion was varied in three levels, ie, 225 gal, 450 gal (approximately equal to the base shear coefficients of the analytical models) and 675 gal. In any case, only the first ten seconds of the record was used in the analysis. A viscous damping factor of 5 percent was arbitarily used for the first mode in the elastic stage.
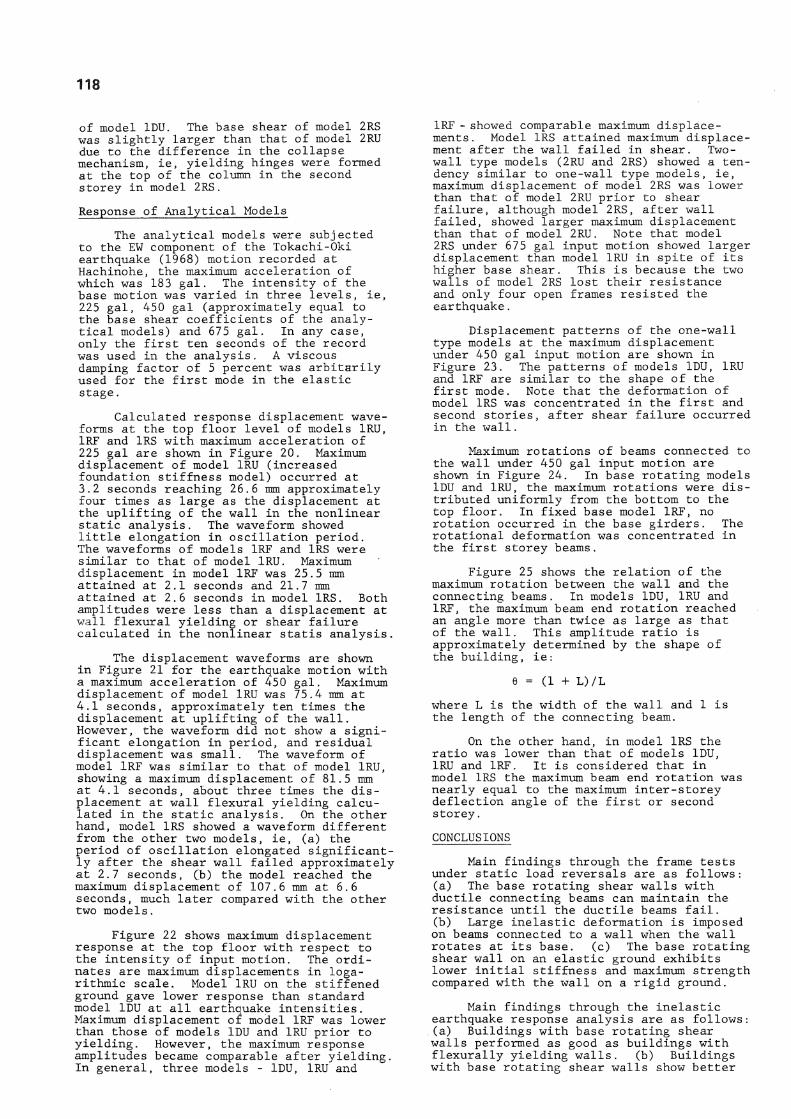
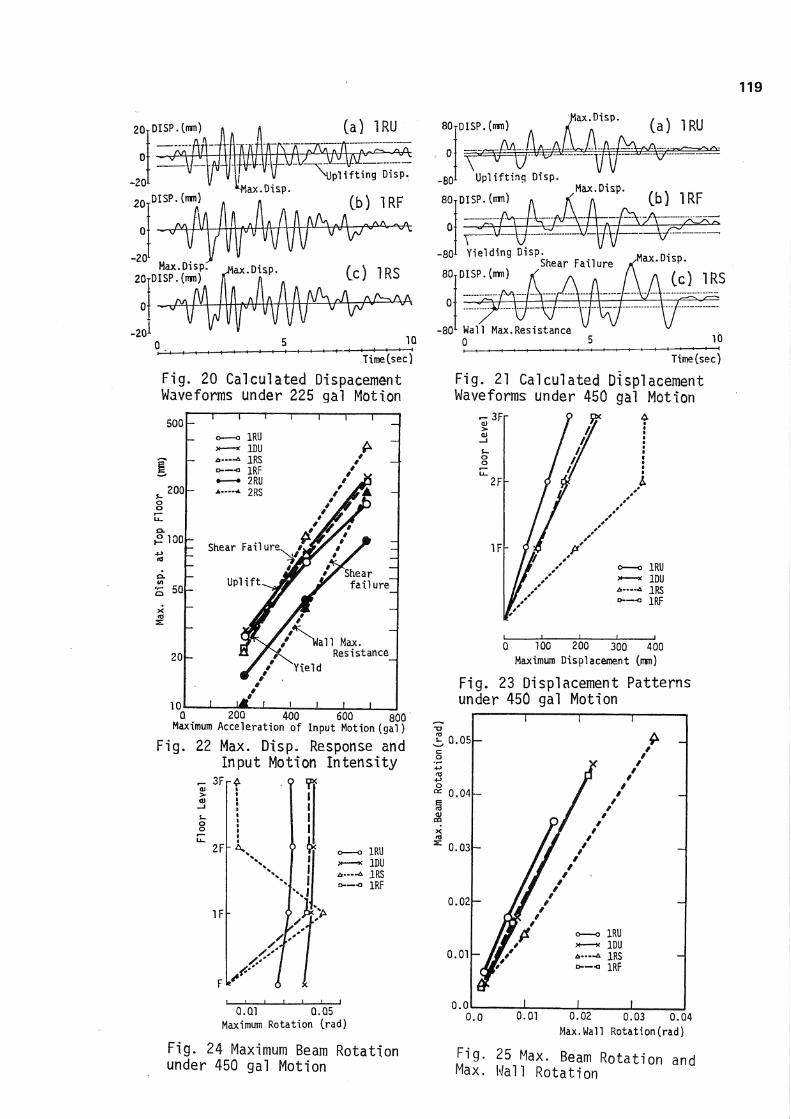
Calculated response displacement waveforms at the top floor level of models 1RU, 1RF and IRS with maximum acceleration of 225 gal are shown in Figure 20. Maximum displacement of model 1RU (increased foundation stiffness model) occurred at 3.2 seconds reaching 26.6 mm approximately four times as large as the displacement at the uplifting of the wall In the nonlinear static analysis. The waveform showed little elongation in oscillation period. The waveforms of models 1RF and IRS were similar to that of model 1RU. Maximum displacement in model 1RF was 25.5 mm attained at 2.1 seconds and 21.7 mm attained at 2.6 seconds in model IRS. Both amplitudes were less than a displacement at wall flexural yielding or shear failure calculated in the nonlinear statis analysis.
The displacement waveforms are shown in Figure 21 for the earthquake motion with a maximum acceleration of 450 gal. Maximum displacement of model 1RU was 75.4 mm at 4.1 seconds, approximately ten times the displacement at uplifting of the wall. However, the waveform did not show a significant elongation in period, and residual displacement was small. The waveform of model 1RF was similar to that of model 1RU, showing a maximum displacement of 81.5 mm at 4.1 seconds, about three times the displacement at wall flexural yielding calculated in the static analysis. On the other hand, model IRS showed a waveform different from the other two models, ie, (a) the period of oscillation elongated significantly after the shear wall failed approximately at 2.7 seconds, (b) the model reached the maximum displacement of 107.6 mm at 6.6 seconds, much later compared with the other two models.
Figure 22 shows maximum displacement response at the top floor with respect to the intensity of input motion. The ordi-nates are maximum displacements in logarithmic scale. Model 1RU on the stiffened ground gave lower response than standard model 1DU at all earthquake intensities. Maximum displacement of model 1RF was lower than those of models 1DU and 1RU prior to yielding. However, the maximum response amplitudes became comparable after yielding. In general, three models - 1DU, 1RU and
1RF - showed comparable maximum displacements. Model IRS attained maximum displacement after the wall failed in shear. Two-wall type models (2RU and 2RS) showed a tendency similar to one-wall type models, ie, maximum displacement of model 2RS was lower than that of model 2RU prior to shear failure, although model 2RS, after wall failed, showed larger maximum displacement than that of model 2RU. Note that model 2RS under 675 gal input motion showed larger displacement than model 1RU in spite of its higher base shear. This is because the two walls of model 2RS lost their resistance and only four open frames resisted the earthquake.
Displacement patterns of the one-wall type models at the maximum displacement under 450 gal input motion are shown in Figure 23. The patterns of models 1DU, 1RU and 1RF are similar to the shape of the first mode. Note that the deformation of model IRS was concentrated in the first and second stories, after shear failure occurred in the wall.
Maximum rotations of beams connected to the wall under 450 gal input motion are shown in Figure 24. In base rotating models 1DU and 1RU, the maximum rotations were distributed uniformly from the bottom to the top floor. In fixed base model 1RF, no rotation occurred in the base girders. The rotational deformation was concentrated in the first storey beams.
Figure 25 shows the relation of the maximum rotation between the wall and the connecting beams. In models 1DU, 1RU and 1RF, the maximum beam end rotation reached an angle more than twice as large as that of the wall. This amplitude ratio is approximately determined by the shape of the building, ie:
0 = (1 + L)/L
where L is the width of the wall and 1 is the length of the connecting beam.
On the other hand, in model IRS the ratio was lower than that of models 1DU, 1RU and 1RF. It is considered that in model IRS the maximum beam end rotation was nearly equal to the maximum inter-storey deflection angle of the first or second storey.
CONCLUSIONS
Main findings through the frame tests under static load reversals are as follows: (a) The base rotating shear walls with ductile connecting beams can maintain the resistance until the ductile beams fail. (b) Large inelastic deformation is imposed on beams connected to a wall when the wall rotates at its base. (c) The base rotating shear wall on an elastic ground exhibits lower initial stiffness and maximum strength compared with the wall on a rigid ground.
Main findings through the inelastic earthquake response analysis are as follows: .(a) Buildings with base rotating shear walls performed as good as buildings with flexurally yielding walls. (b) Buildings with base rotating shear walls show better
119
DlSP.(rrm) 20
-20 2 0 DISP.(mm)
(a) 1RU 80TDISP.(mm) (a) 1RU
^ax.Disp
-201 ^ Max.Disp. 20TDISP.(nm)
0
-20
pi ifting Disp
(b) 1RF
Max.Disp. C c ) IRS
Time(sec) Fig. 20 Calculated Dispacement Waveforms under 225 gal Motion
500
200
j§" 100
S 50 >< CO
20
10
Shear failure
1 Max. Resistance
Q 200 400 600 800 Maximum Acceleration of Input Motion (gal}
Fig. 22 Max. Disp. Response and Input Motion Intens i ty
Q.Ql 0.Q5 Maximum Rotation trad)
Fig. 24 Maximum Beam Rotation under 450 gal Motion
Shear Failure / « - D « P -80TDISP.(imi) / a „ A A ( c ) IRS
-801 Wall Max.Resistance 0 5
Time(sec)
Fig. 21 Calculated Displacement Waveforms under 450 gal Motion
Q 100 200 300 400 Maximum Displacement Onm)
Fig. 23 Displacement Patterns under 450 gal Motion
a.05
0.04
0.03
0.02
0.01
0.0
£ -
1RU 1DU IRS
d — - a 1RF
0.0 0.01 0.02 0.03 0.Q4 Max.Wall Rotation(rad)
F ig . 25 Max. Beam Rotation and Max. Wall Rotation
120
seismic behaviour than buildings with shear failing walls. (c) Large deformation, the amplitude of which is attributed to the shape of the building, is imposed on beams connected to the rotating wall. (d) Consequently, the connecting beams including footing beam must be provided with sufficient deformation capacity if a wall is to be designed to rotate at its base.
REFERENCES
1. J W Meek, "Dynamic Response of Tipping Core Buildings", Earthquake Engineering and Structural Dynamics, Vol 6 (1978).
2. Arthur A Huckel Bridge and Rovert M Ferencz, "Overturning Effects in Stiffened Building Frames", Earthquake Engineering and Structural Dynamics, Vol 9 (1981).
3. M J N Priestley, R J Evison, A J Carr, "Seismic Response of Structure Free to Rock on their Foundations", Bulletin of the New Zealand National Society for Earthquake Engineering, Vol 11, No 3, September 1978.
4. Kenji Baba, Hidemi Nakashima, "Response of Up-Lifting Shear Wall-Frame Interaction in Reinforced Concrete Structure" Proceedings of the sixth Japan Earthquake Engineering Symposium, 1982.
5. Toshiharu Arakawa, Tadaki Koh, "Dynamic Analysis of Frames with Shear Wall Considering Up-Lift of Footing". Proceedings of the sixth Japan Earthquake Engineering Symposium, 1982.
6. Giversonb, M F, "The Response of Nonlinear Multi-Story Structures subj ected to Earthquake Excitation". Earthquake Engineering Research Laboratory, California Institute of Technology, Pasadena, California, EERC Report, 1967.
7. T Arakawa, "Allowable Unit Shearing Stress and Design Method of Shear Reinforcement of Reinforced Concrete Beams, Analyses of Existing Test Data", Concrete Journal, Japan National Council on Concrete, Vol 8, No 7, July 1970.
8. Y Fukada, "Study on the Restoring Force Characteristics of Reinforced Concrete Buildings (in Japanese)". Proceedings, Kanto District Symposium Architectural Institute of Japan, No 40, 1969.
9. Shunsuke Otani, "Hysteresis Models of Reinforced Concrete for Earthquake Response Analysis", Journal of the Faculty of Engineering, The University of Tokyo, Vol XXXVI, No 2 (1981).
10. T Kabeyazawa, H Shiohara, S Otani, H Aoyama, "Analysis of the Full Scale Seven-Story Reinforced Concrete Test Structures Test PSD-3". Report presen ted during the Third Joint Technical Coordinating Committee Meeting, Tsukub Japan, July 1982.
11. Housner, G W, "The Behaviour of Inverted Pendulum Structures During Earthquake", Bulletin Seismological Society of America, Vol 53, No 2, February 1963.
12. Architectural Institute of Japan, "AIJ Standard for Structural Calculation of Reinforced Concrete Structures (Revised in 1982)", Architectural Institute of Japan, 1950.
Table 1 Calculated Member Strength.
Specimen
Flexural Strength CkN m)
Shear Strength (WO" Specimen
Top Tension
Bottom Tension
Shear Strength (WO"
GF BF GS BS
Column Wall
2.85 2.85 5.98 2.85 5.98 5.98 10.6 5.98
7.68 172.
24.8 19.7 19.1 14.2 39.0
270.
Table 2 Observed and Calculated Base Shears of Specimens
(a) Observed Base Shear QcN) Specimen FR FD SR Mechanism 116 91 — Maximum 124 107 122
(b) Calculated Base Shear Specimen FR FD SR Case I n o 93 126 Case II 123 113 123
Table 3 Characteristics of Analytical Models Model 1DU 1RU 1RF IRS 2RU 2RS
1 1 1 1 2 2 229 22900 229QO 22900 2290Q 22900 uplift uplift flexure shear uplift shear 1460 1460 * * 1460 *
* * 292Q * 2920
* 2510 * * * 0.43 0.43 0.43 0,44 0.53 0.56 0.437 0.341 0.341 0,341 0.271 0.271
Number of walls Stiffness of ground
(kN/ram) Wall failure mode Uplifting axial force in wall column (kN) Wall shear strength
im Axial strength of wall column (JcN) Base shear coefficient Natural period (sec)
* Strength is extremely 1arge