Embed Size (px)
Citation preview
10.20.2009
Webinar:PV Financial AnalysisMatt HelingProgram ManagerSolar & Customer GenerationPacific Gas & Electric Co.
Garen GrigoryanBusiness AnalystSolar & Customer GenerationPacific Gas & Electric Co.
PG&E Webinar: PV Financial Analysis 2
Webinar Goal
Review concepts and resources needed to understand and/or perform an analysis of PV system cost-effectiveness.
PG&E Webinar: PV Financial Analysis 3
Agenda• PV system costs
• PV systems benefits (financial)
• Methods of financial analysis
PG&E Webinar: PV Financial Analysis 4
Energy Efficiency
PG&E Webinar: PV Financial Analysis 5
Energy Efficiency
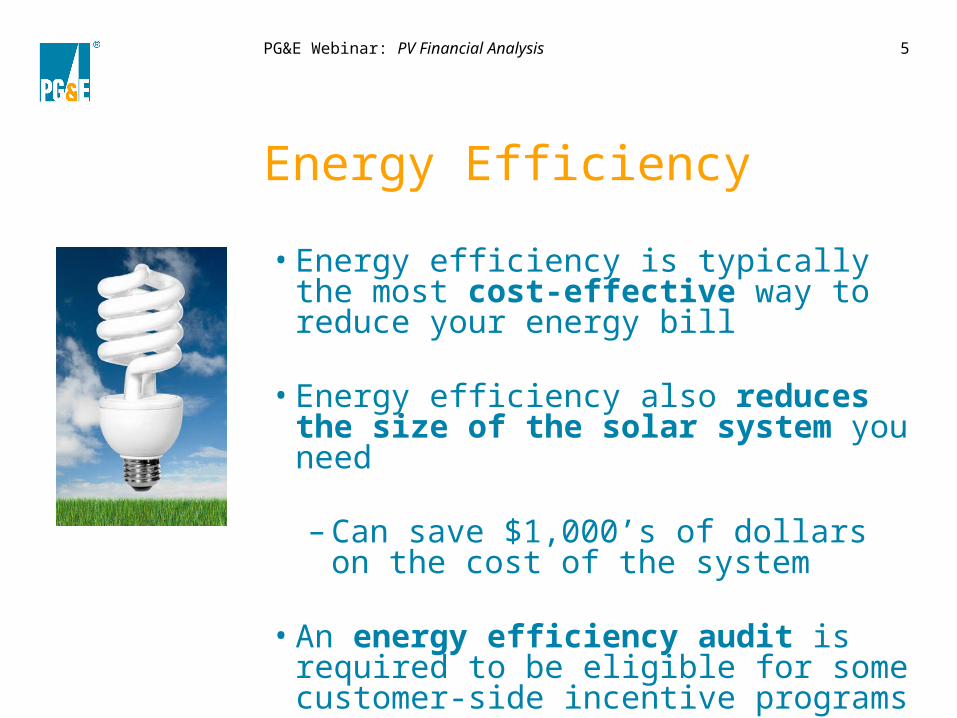
• Energy efficiency is typically the most cost-effective way to reduce your energy bill
• Energy efficiency also reduces the size of the solar system you need
– Can save $1,000’s of dollars on the cost of the system
• An energy efficiency audit is required to be eligible for some customer-side incentive programs
PG&E Webinar: PV Financial Analysis 6
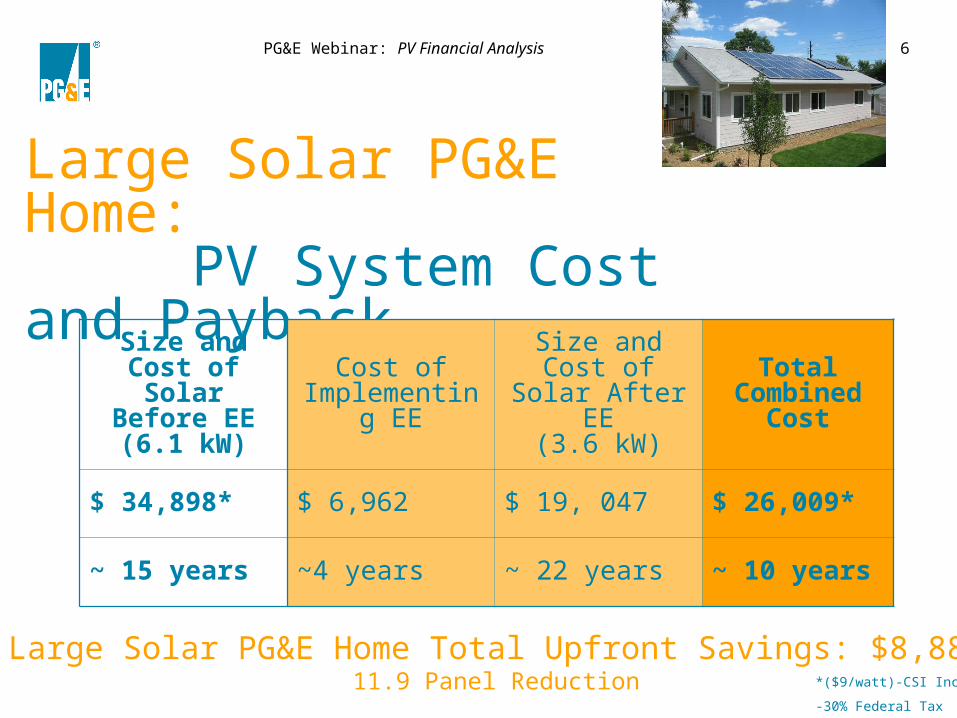
Large Solar PG&E Home: PV System Cost and Payback
Large Solar PG&E Home Total Upfront Savings: $8,88911.9 Panel Reduction
Size and Cost of
Solar Before EE
(6.1 kW)
Cost of Implementing
EE
Size and Cost of Solar After
EE(3.6 kW)
Total Combined
Cost
$ 34,898* $ 6,962 $ 19, 047 $ 26,009*
~ 15 years ~4 years ~ 22 years ~ 10 years
*($9/watt)-CSI Incentive
-30% Federal Tax
PG&E Webinar: PV Financial Analysis 7
Site Screening Criteria
PG&E Webinar: PV Financial Analysis 8
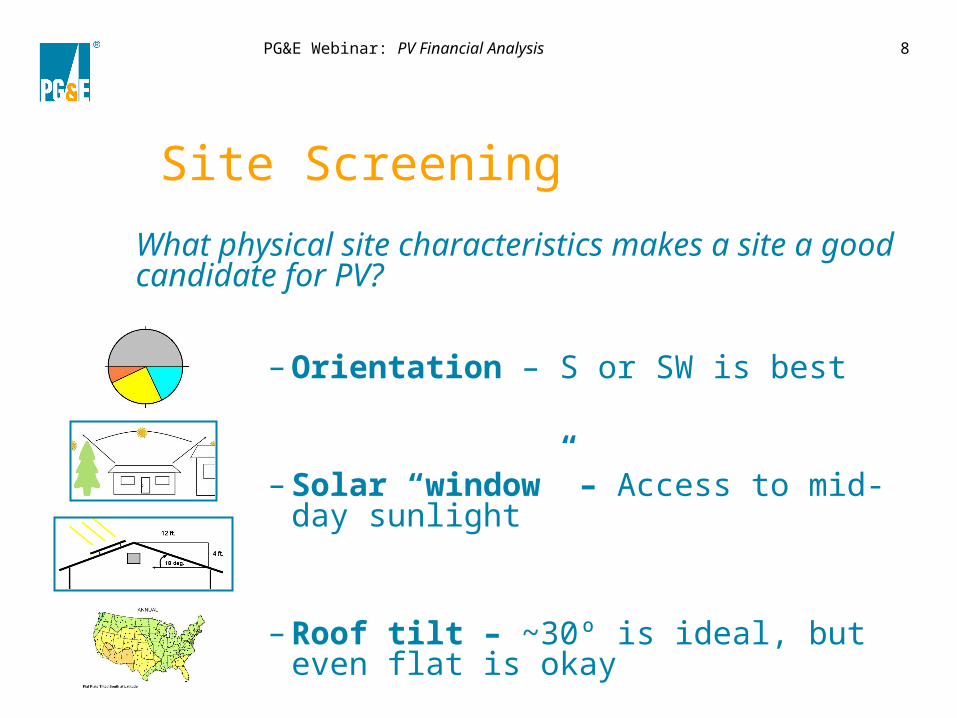
Site Screening
What physical site characteristics makes a site a good candidate for PV?
– Orientation – S or SW is best
– Solar “window” – Access to mid-day sunlight
– Roof tilt – ~30º is ideal, but even flat is okay
– Weather – Typically good in CA
PG&E Webinar: PV Financial Analysis 9
System Performance
PG&E Webinar: PV Financial Analysis 10
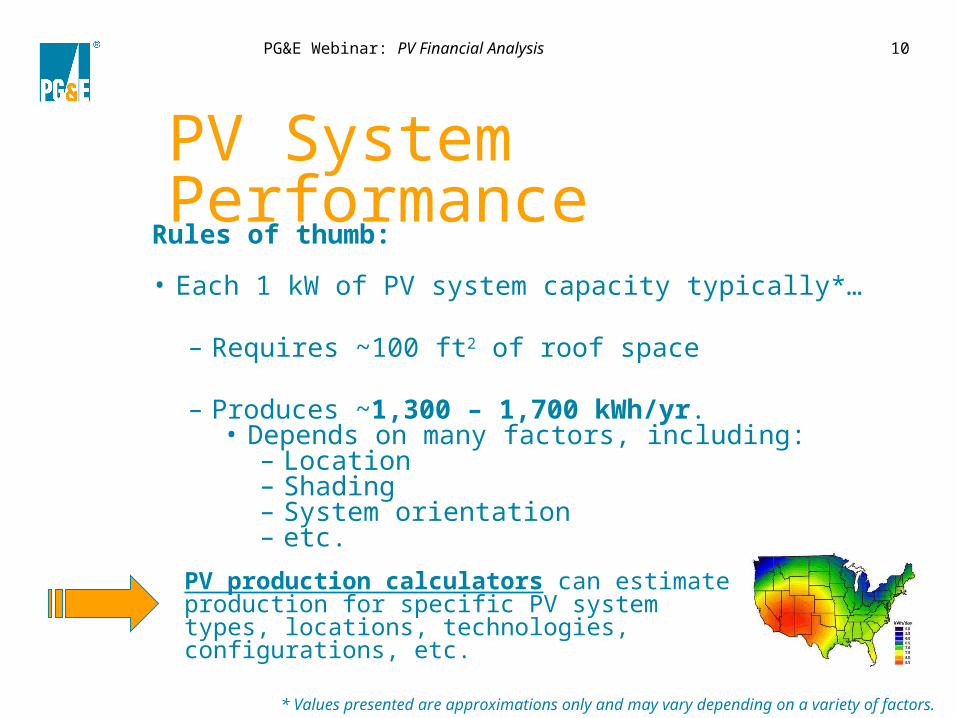
PV System Performance
Rules of thumb:
• Each 1 kW of PV system capacity typically*…
– Requires ~100 ft2 of roof space
– Produces ~1,300 – 1,700 kWh/yr.• Depends on many factors, including:
– Location– Shading– System orientation– etc.
* Values presented are approximations only and may vary depending on a variety of factors.
PV production calculators can estimate production for specific PV system types, locations, technologies, configurations, etc.
PG&E Webinar: PV Financial Analysis 11
System Costs
PG&E Webinar: PV Financial Analysis 12
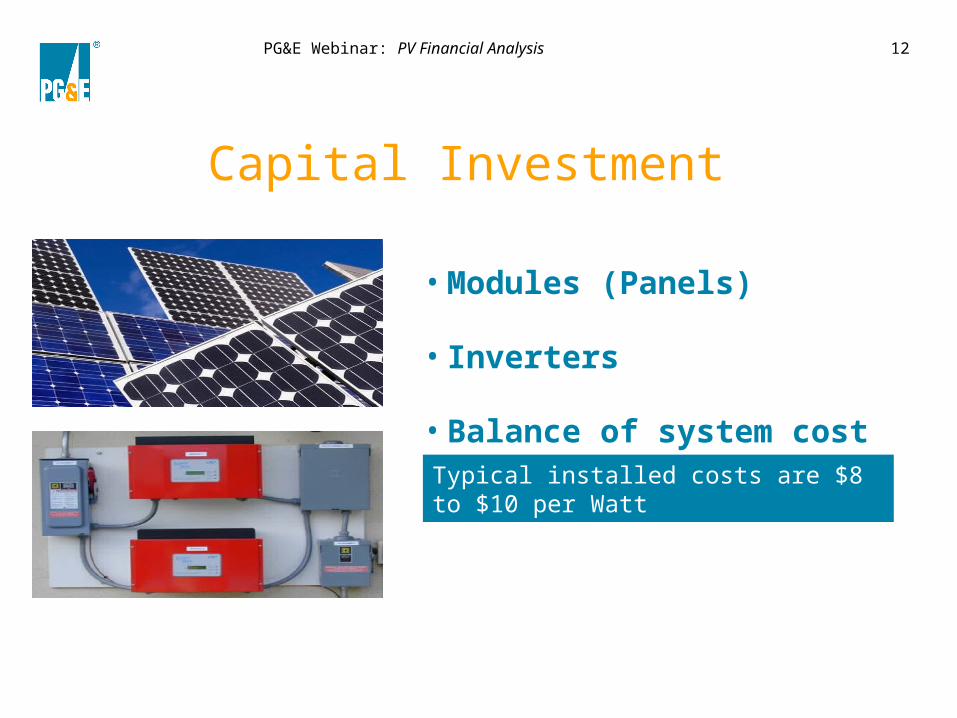
Capital Investment
•Modules (Panels)
• Inverters
•Balance of system cost
Typical installed costs are $8 to $10 per Watt
PG&E Webinar: PV Financial Analysis 13
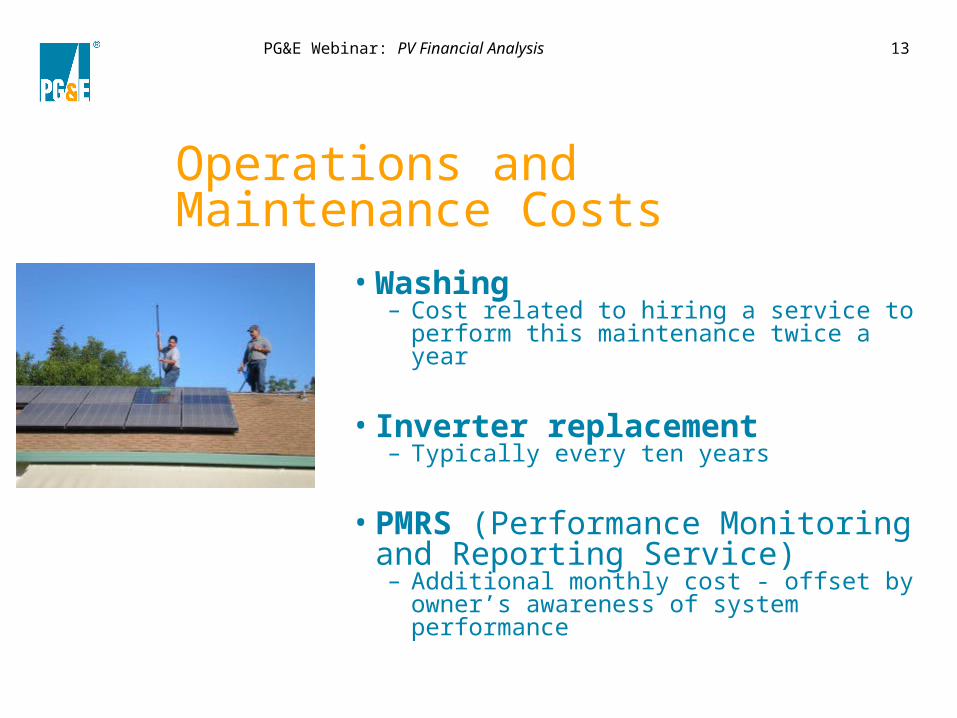
Operations and Maintenance Costs
•Washing– Cost related to hiring a service to perform
this maintenance twice a year
• Inverter replacement– Typically every ten years
•PMRS (Performance Monitoring and Reporting Service) – Additional monthly cost - offset by
owner’s awareness of system performance
PG&E Webinar: PV Financial Analysis 14
Incentives
PG&E Webinar: PV Financial Analysis 15
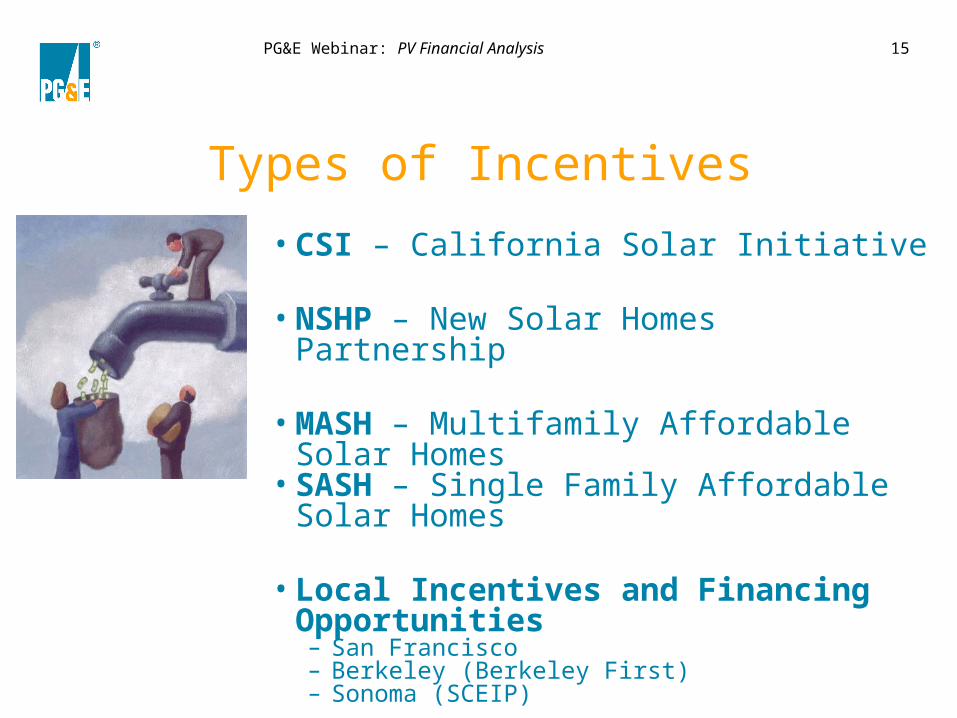
Types of Incentives
•CSI – California Solar Initiative
•NSHP – New Solar Homes Partnership
•MASH – Multifamily Affordable Solar Homes
•SASH – Single Family Affordable Solar Homes
•Local Incentives and Financing Opportunities– San Francisco – Berkeley (Berkeley First) – Sonoma (SCEIP)
•Federal ITC / Depreciation
PG&E Webinar: PV Financial Analysis 16
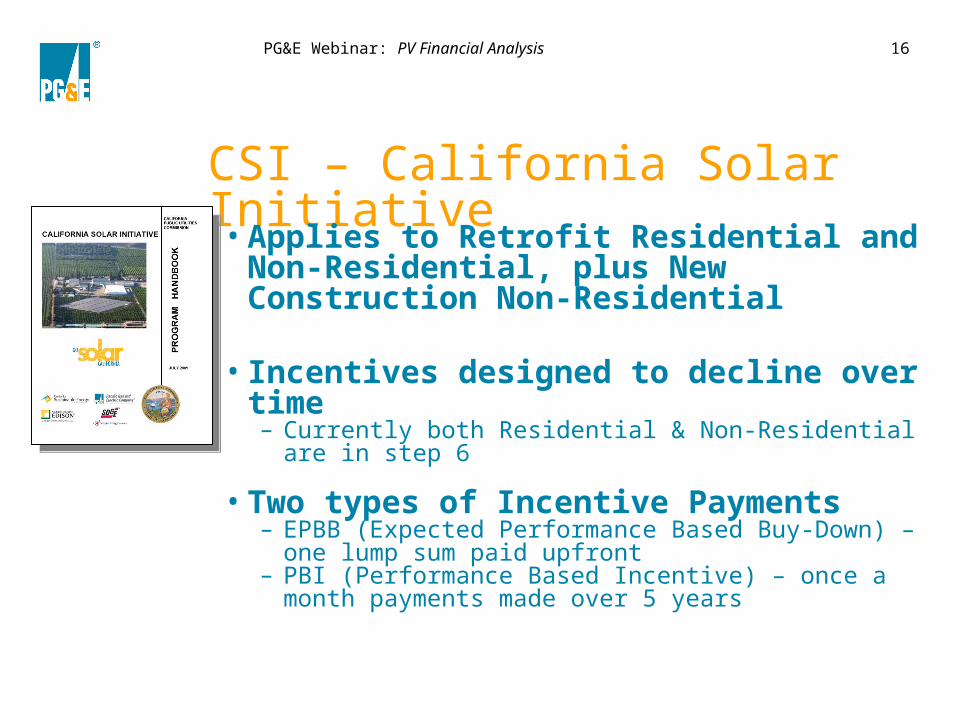
CSI – California Solar Initiative•Applies to Retrofit Residential and
Non-Residential, plus New Construction Non-Residential
• Incentives designed to decline over time– Currently both Residential & Non-Residential are in
step 6
•Two types of Incentive Payments– EPBB (Expected Performance Based Buy-Down) – one
lump sum paid upfront– PBI (Performance Based Incentive) – once a month
payments made over 5 years
PG&E Webinar: PV Financial Analysis 17
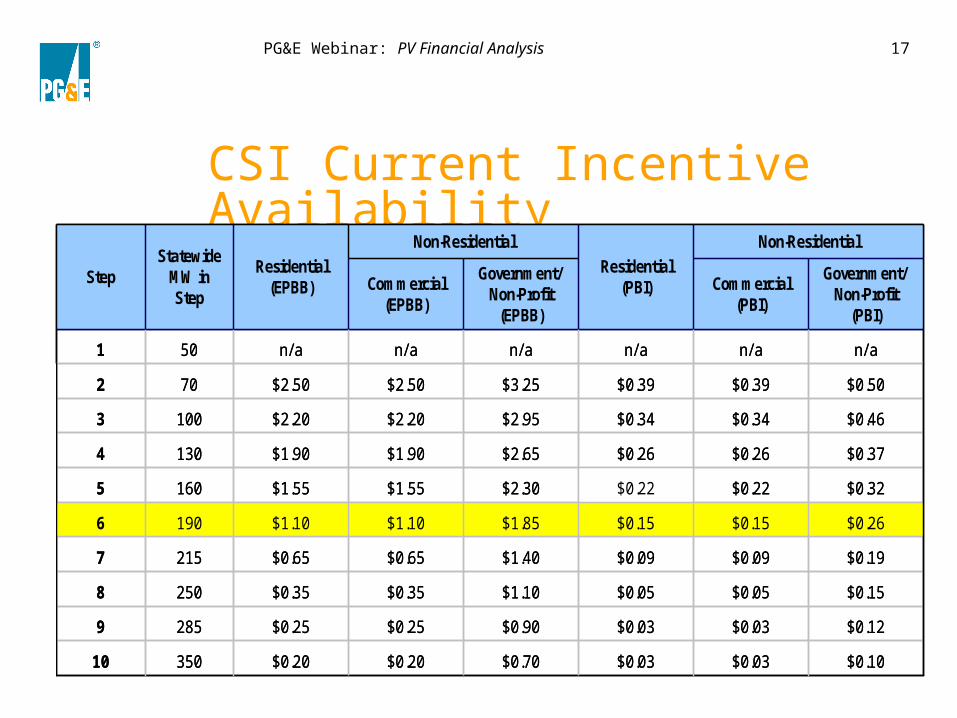
CSI Current Incentive Availability
$0.20
$0.25
$0.35
$0.65
$1.10
$1.55
$1.90
$2.20
$2.50
n/a
Residential (EPBB)
Government/Non-Profit (EPBB)
Commercial (EPBB)
$0.20
$0.25
$0.35
$0.65
$1.10
$1.55
$1.90
$2.20
$2.50
n/a
Non-Residential
$0.70
$0.90
$1.10
$1.40
$1.85
$2.30
$2.65
$2.95
$3.25
n/a
$0.10 $0.03$0.0335010
$0.12$0.03$0.032859
$0.15$0.05$0.052508
$0.19$0.09$0.092157
$0.26$0.15$0.151906
$0.32$0.22$0.221605
$0.37$0.26$0.261304
$0.46$0.34$0.341003
$0.50$0.39$0.39702
n/an/an/a501
Government/Non-Profit
(PBI)
Commercial (PBI)
Non-ResidentialResidential
(PBI)
StatewideMW in Step
Step
$0.20
$0.25
$0.35
$0.65
$1.10
$1.55
$1.90
$2.20
$2.50
n/a
Residential (EPBB)
Government/Non-Profit (EPBB)
Commercial (EPBB)
$0.20
$0.25
$0.35
$0.65
$1.10
$1.55
$1.90
$2.20
$2.50
n/a
Non-Residential
$0.70
$0.90
$1.10
$1.40
$1.85
$2.30
$2.65
$2.95
$3.25
n/a
$0.10 $0.03$0.0335010
$0.12$0.03$0.032859
$0.15$0.05$0.052508
$0.19$0.09$0.092157
$0.26$0.15$0.151906
$0.32$0.22$0.221605
$0.37$0.26$0.261304
$0.46$0.34$0.341003
$0.50$0.39$0.39702
n/an/an/a501
Government/Non-Profit
(PBI)
Commercial (PBI)
Non-ResidentialResidential
(PBI)
StatewideMW in Step
Step
PG&E Webinar: PV Financial Analysis 18
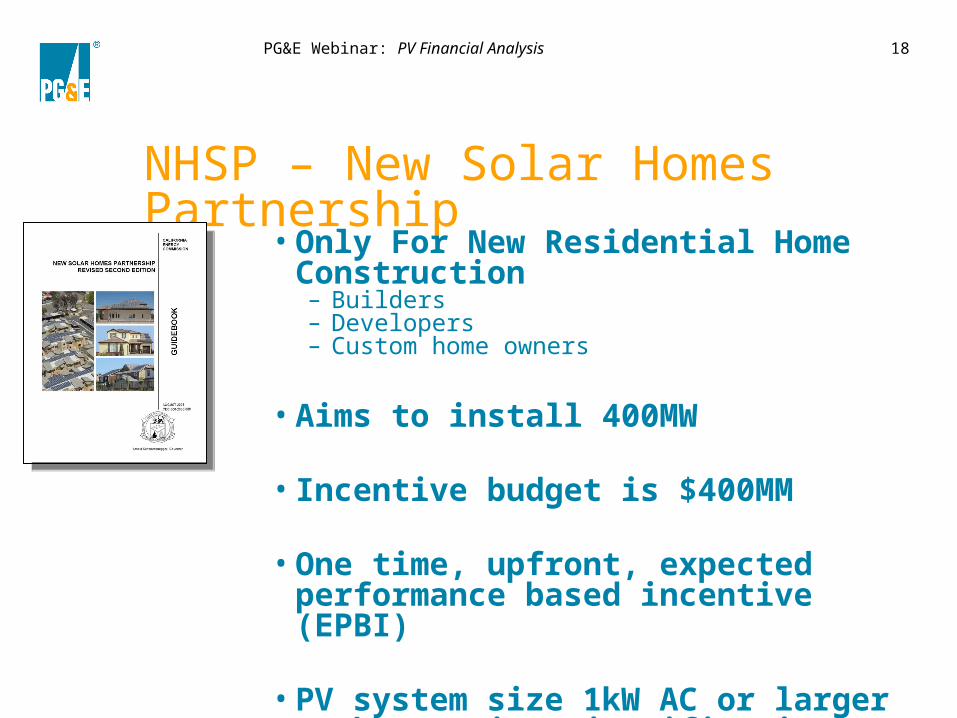
NHSP – New Solar Homes Partnership
•Only For New Residential Home Construction– Builders– Developers– Custom home owners
•Aims to install 400MW
• Incentive budget is $400MM
•One time, upfront, expected performance based incentive (EPBI)
•PV system size 1kW AC or larger (>5kW requires justification)
PG&E Webinar: PV Financial Analysis 19
MASH and SASH•Designed to encourage solar
adoption for low income housing residents
•MASH – Administered by PG&E– $108MM available for incentives– Track 1a: $3.30/Watt for systems that offset
common load– Track 1b: $4.00/Watt for systems that offset
tenant load
•SASH – Administered by Grid Alternatives– $108MM available for incentives– Very low income customers may receive a 1kW
fully subsidized (up to $10,000) system
PG&E Webinar: PV Financial Analysis 20
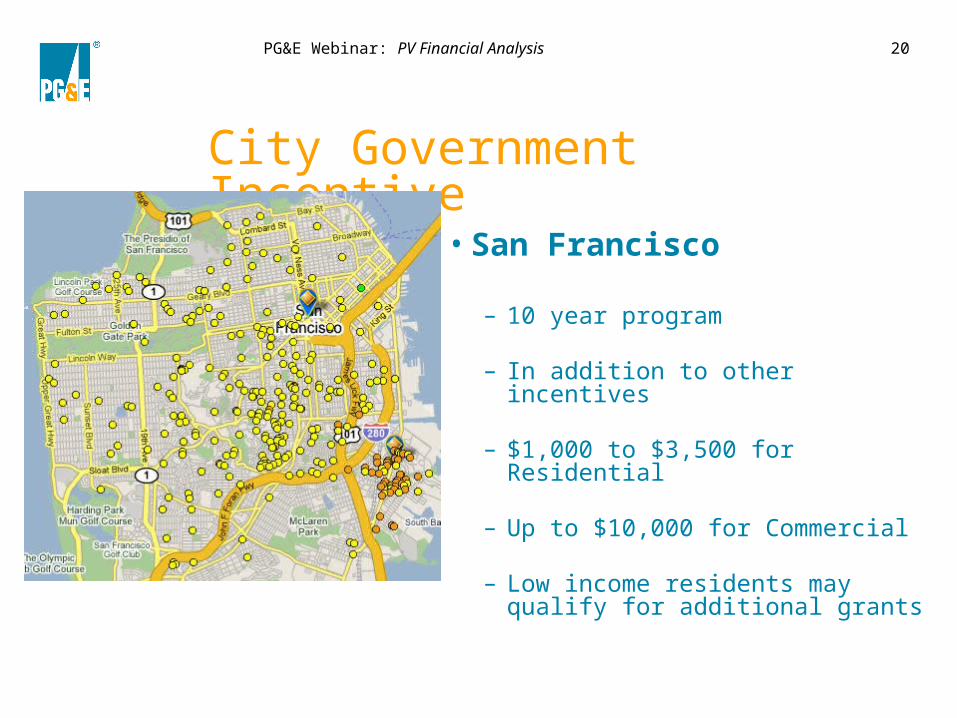
City Government Incentive
•San Francisco
– 10 year program
– In addition to other incentives
– $1,000 to $3,500 for Residential
– Up to $10,000 for Commercial
– Low income residents may qualify for additional grants
PG&E Webinar: PV Financial Analysis 21
Federal ITC
•Solar Investment Tax Credit*
– Went into effect January 1st 2009
– Available for next 8 years (through 2016)
– 30% of net solar system cost
– No monetary cap
– Applies to residential & commercial
*All tax related statement are designed to inform and not to be construed as taxadvise. Please consult a tax attorney before making any purchasing decisions.
PG&E Webinar: PV Financial Analysis 22
Bonus Depreciation
•Applies to commercial system owners Only
– Benefits extended for systems installed in 2009
• 50% of cost of capital investment
• Up to $250,000 with phase-out threshold of $800,000
– Benefits will continue for systems installed 2010 with reduced depreciation allowances
• Allowed write-off up to $125,000 of capital expenditure
• Subject to phase-out once capital expenditure exceeds $500,000*All tax related statement are designed to inform and not to be construed as tax
advise. Please consult a tax attorney before making any purchasing decisions.
PG&E Webinar: PV Financial Analysis 23
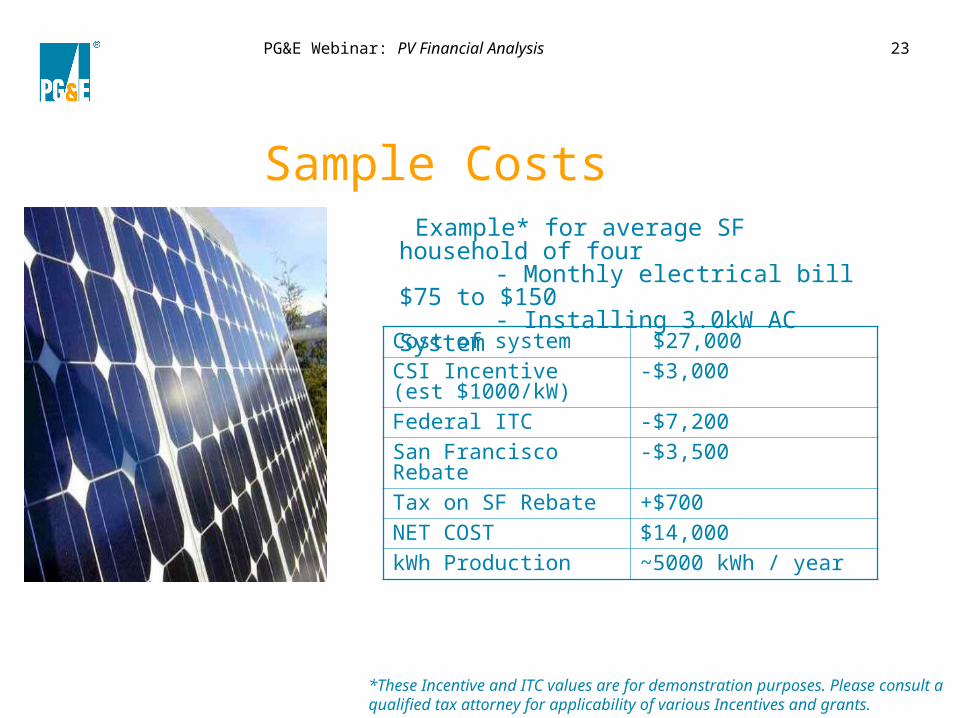
Sample Costs Example* for average SF household of four
- Monthly electrical bill $75 to $150
- Installing 3.0kW AC SystemCost of system $27,000CSI Incentive (est $1000/kW)
-$3,000
Federal ITC -$7,200San Francisco Rebate
-$3,500
Tax on SF Rebate +$700NET COST $14,000kWh Production ~5000 kWh / year
*These Incentive and ITC values are for demonstration purposes. Please consult a qualified tax attorney for applicability of various Incentives and grants.
PG&E Webinar: PV Financial Analysis 24
Electricity Costs and Net Energy Metering
PG&E Webinar: PV Financial Analysis 25
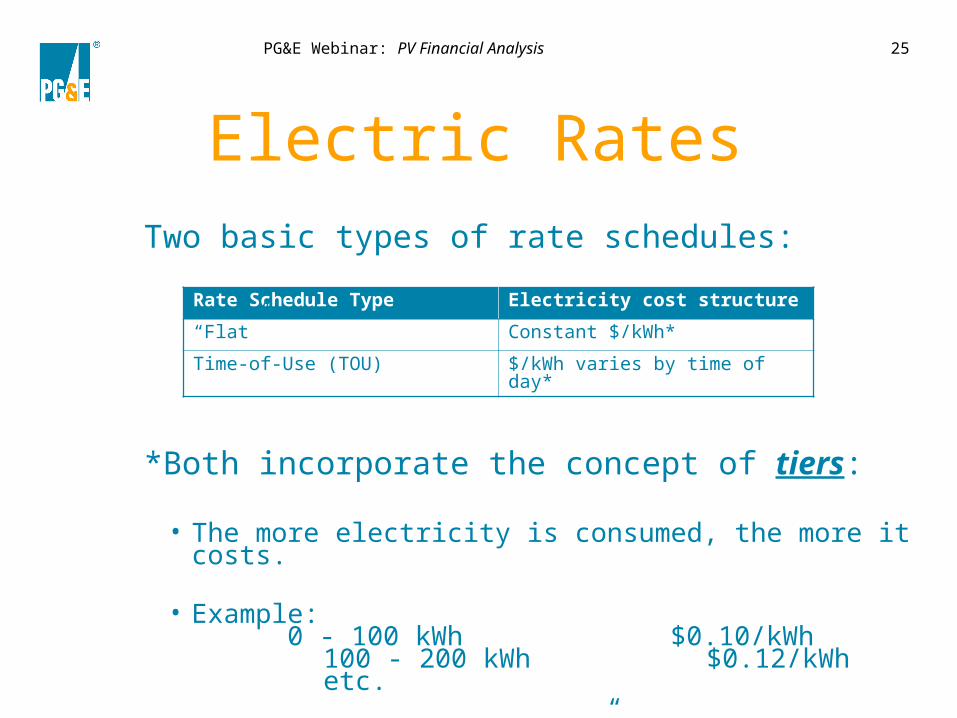
Electric RatesTwo basic types of rate schedules:
*Both incorporate the concept of tiers:
• The more electricity is consumed, the more it costs.
• Example:0 - 100 kWh $0.10/kWh
100 - 200 kWh $0.12/kWhetc.
• Tiers apply to both “flat” rates and TOU rates
Rate Schedule Type Electricity cost structure
“Flat” Constant $/kWh*
Time-of-Use (TOU) $/kWh varies by time of day*
PG&E Webinar: PV Financial Analysis 26
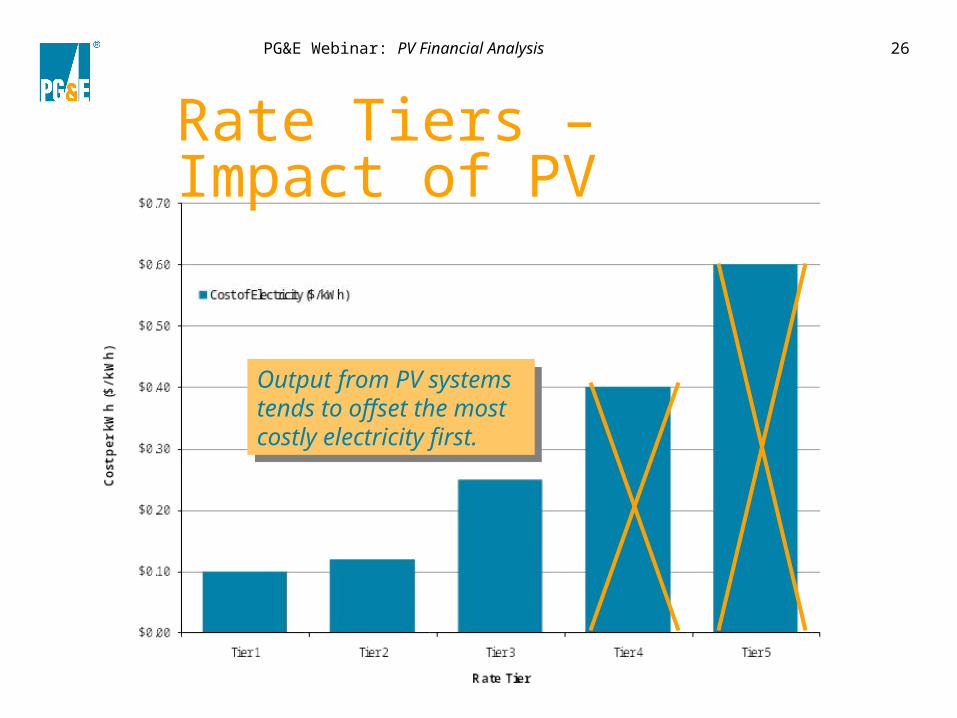
Rate Tiers – Impact of PV
Output from PV systems tends to offset the most costly electricity first.
Output from PV systems tends to offset the most costly electricity first.
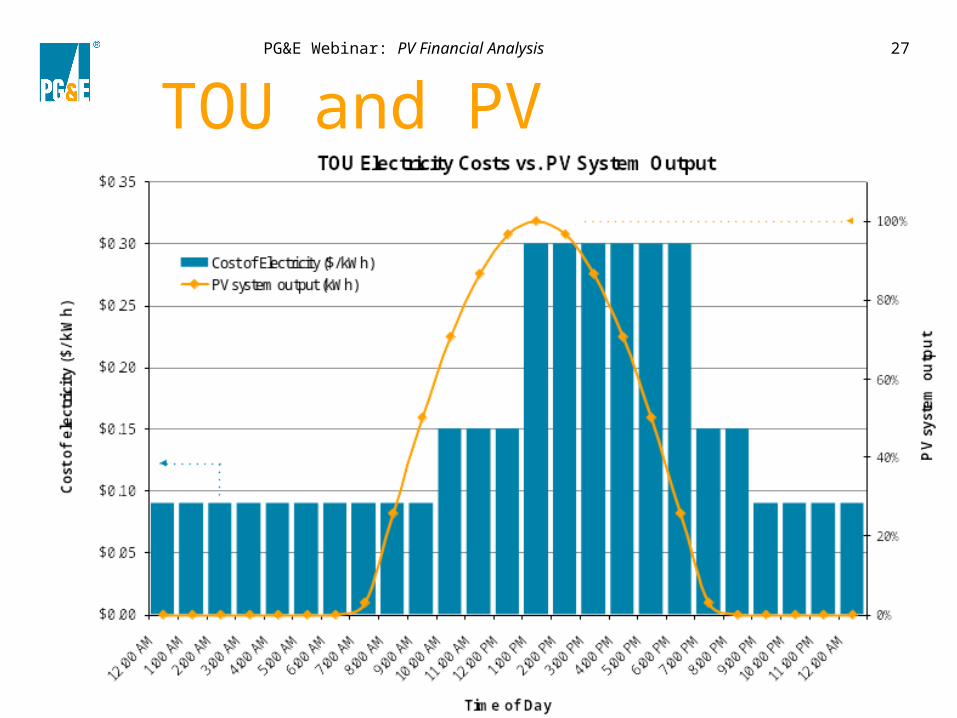
PG&E Webinar: PV Financial Analysis 27
TOU and PV
PG&E Webinar: PV Financial Analysis 28
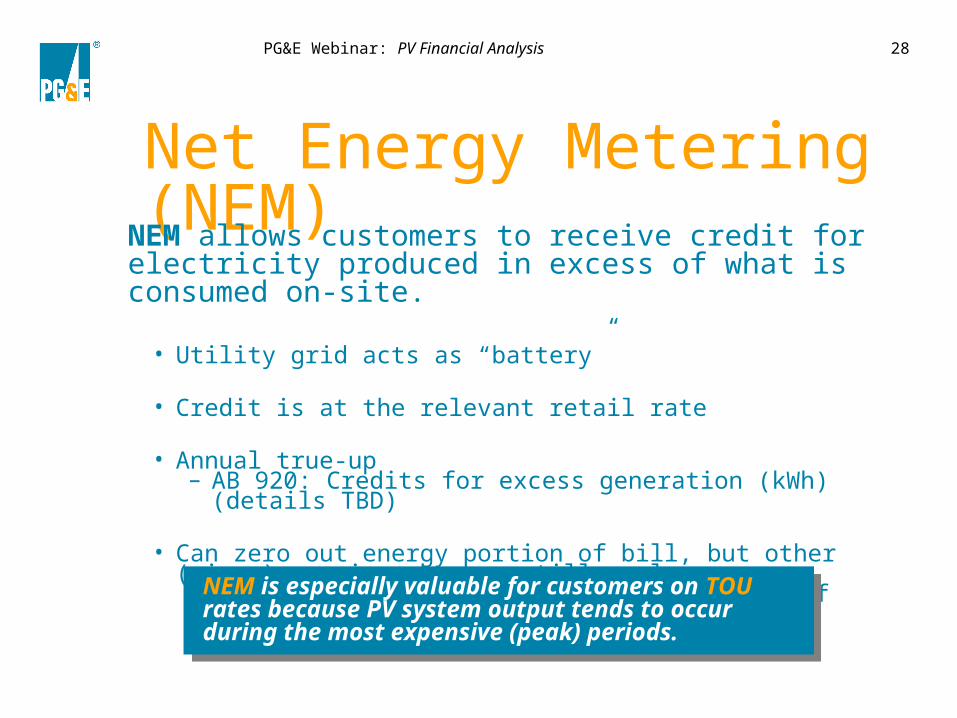
Net Energy Metering (NEM)NEM allows customers to receive credit for
electricity produced in excess of what is consumed on-site.
• Utility grid acts as “battery”
• Credit is at the relevant retail rate
• Annual true-up– AB 920: Credits for excess generation (kWh) (details
TBD)
• Can zero out energy portion of bill, but other (minor) service charges still apply– Typical customer sizes PV system to ~80% of annual
energy (kWh) consumptionNEM is especially valuable for customers on TOU rates because PV system output tends to occur during the most expensive (peak) periods.
NEM is especially valuable for customers on TOU rates because PV system output tends to occur during the most expensive (peak) periods.
PG&E Webinar: PV Financial Analysis 29
Financing Options
PG&E Webinar: PV Financial Analysis 30
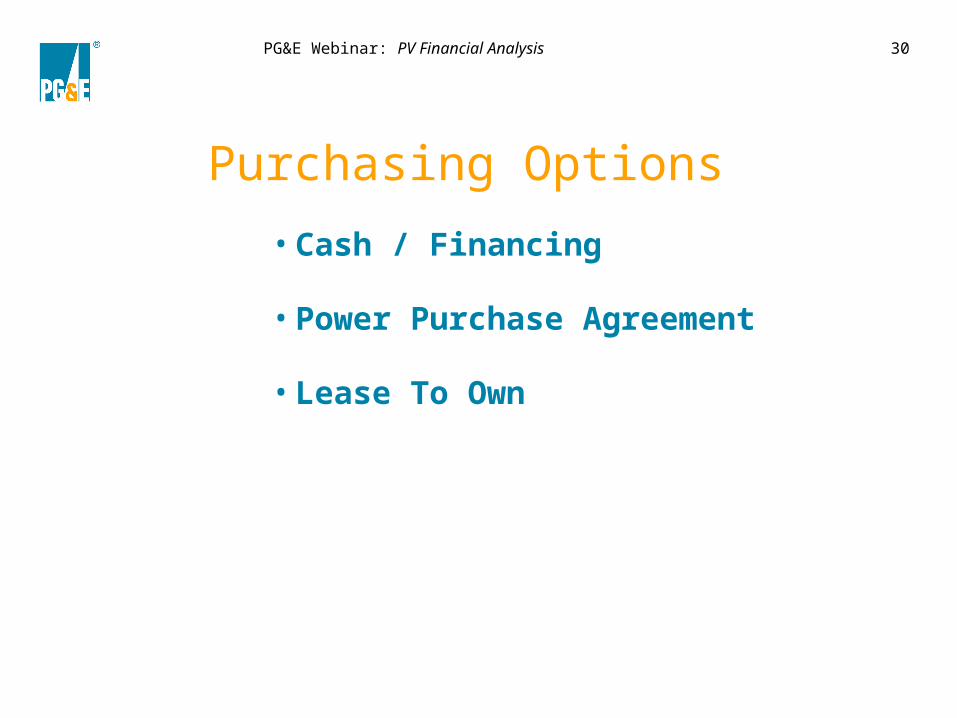
Purchasing Options
•Cash / Financing
•Power Purchase Agreement
•Lease To Own
PG&E Webinar: PV Financial Analysis 31
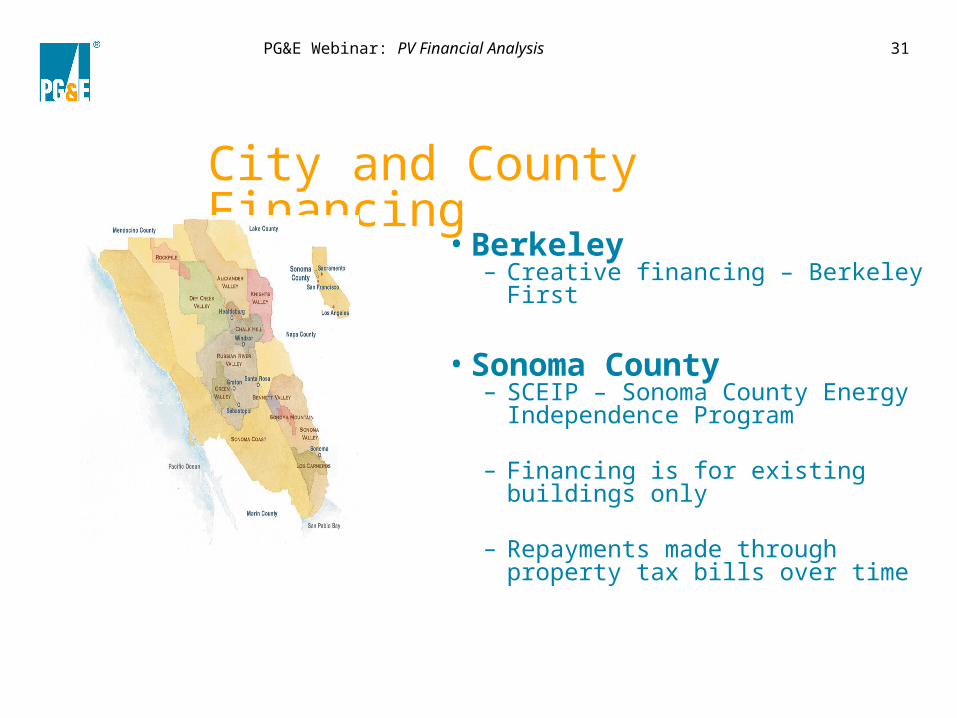
City and County Financing
•Berkeley – Creative financing – Berkeley First
•Sonoma County– SCEIP – Sonoma County Energy
Independence Program
– Financing is for existing buildings only
– Repayments made through property tax bills over time
PG&E Webinar: PV Financial Analysis 32
PPA Structure
• Third Party owns system and is responsible for financing, designing, installing, monitoring and maintaining for the customer
• No upfront fee required
• Customer purchases electricity (kWh) the system generates at contracted rates
• Customer may purchase system after contract expires
• Contracts are typically 20 to 25 years
• RECs (Renewable Energy Credits) are claimed by third party
PG&E Webinar: PV Financial Analysis 33
Lease To Own• Third Party owns system and is
responsible for financing, designing, installing, monitoring and maintaining for the customer
• Customer typically pays a small upfront fee
• Customer enters into a lease agreement
• Significant reduction in electricity bill
• Contracts are typically ~10 years
• Leases may have annual built-in increases – typically not exceeding increases of electricity rates
PG&E Webinar: PV Financial Analysis 34
Renewable Energy Credits
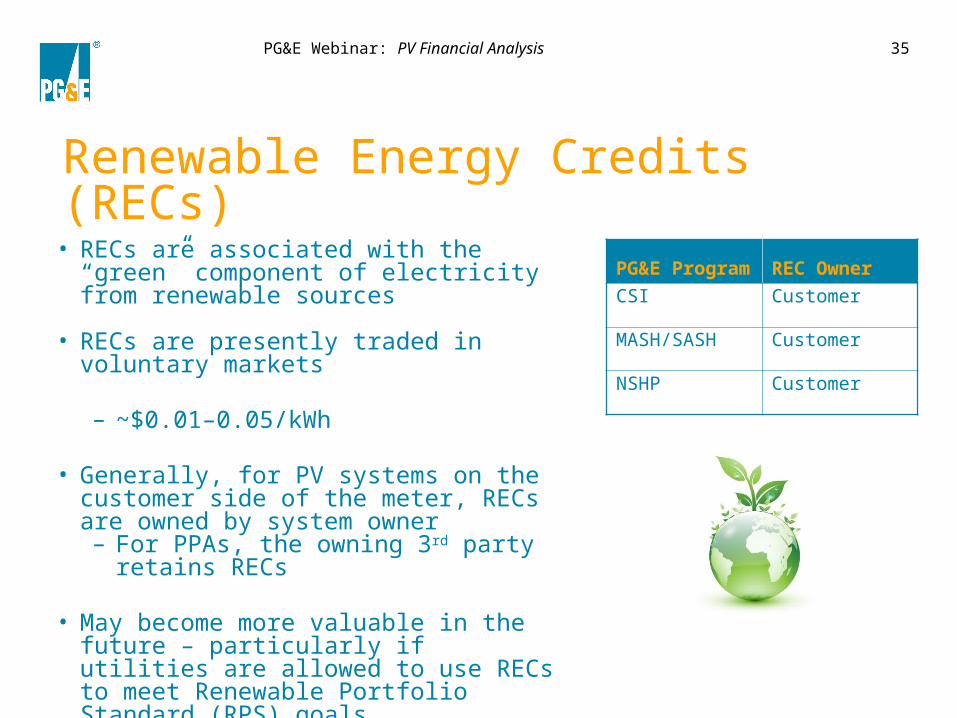
PG&E Webinar: PV Financial Analysis 35
Renewable Energy Credits (RECs)• RECs are associated with the “green”
component of electricity from renewable sources
• RECs are presently traded in voluntary markets
– ~$0.01–0.05/kWh
• Generally, for PV systems on the customer side of the meter, RECs are owned by system owner– For PPAs, the owning 3rd party
retains RECs
• May become more valuable in the future – particularly if utilities are allowed to use RECs to meet Renewable Portfolio Standard (RPS) goals
PG&E Program REC Owner
CSI Customer
MASH/SASH Customer
NSHP Customer
PG&E Webinar: PV Financial Analysis 36
Methods of Financial Analysis
PG&E Webinar: PV Financial Analysis 37
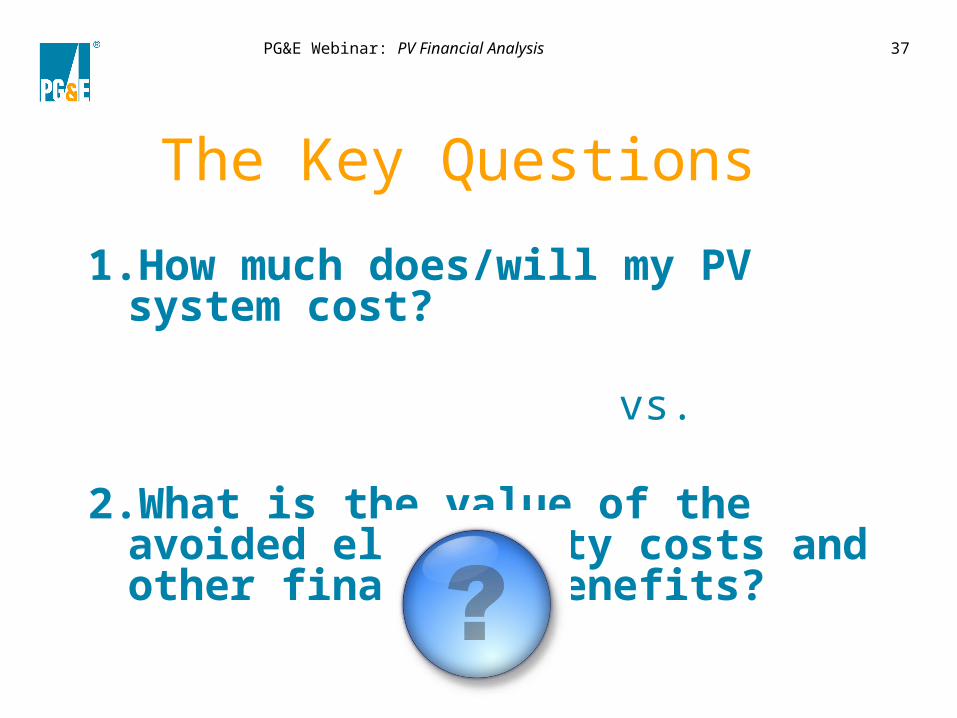
The Key Questions
1.How much does/will my PV system cost?
vs.
2.What is the value of the avoided electricity costs and other financial benefits?
PG&E Webinar: PV Financial Analysis 38
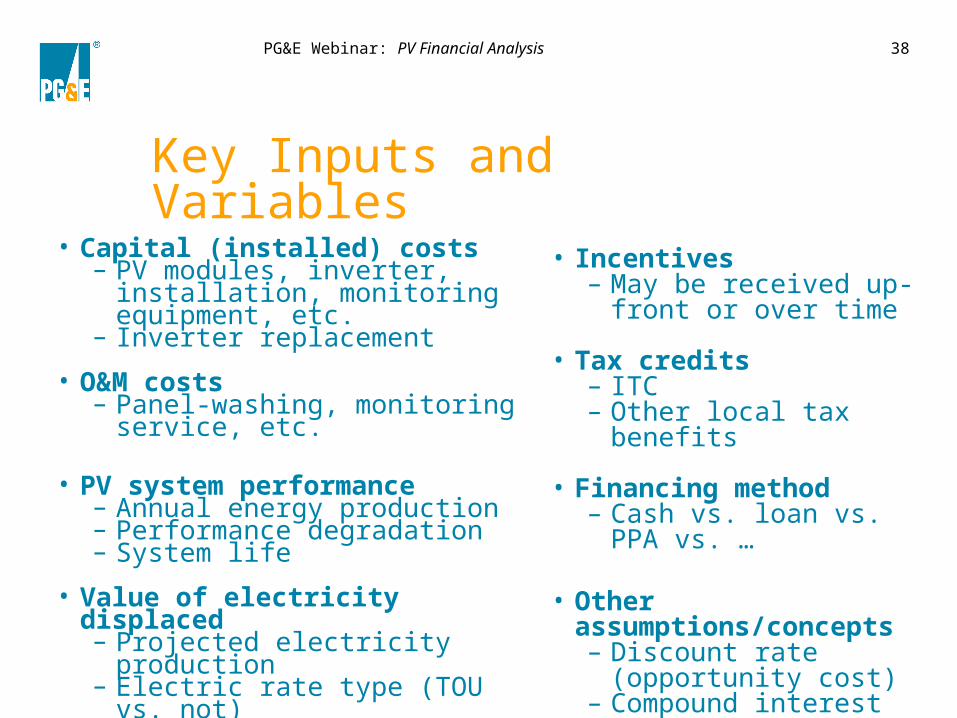
Key Inputs and Variables
• Capital (installed) costs– PV modules, inverter,
installation, monitoring equipment, etc.
– Inverter replacement
• O&M costs– Panel-washing, monitoring
service, etc.
• PV system performance– Annual energy production– Performance degradation– System life
• Value of electricity displaced– Projected electricity production– Electric rate type (TOU vs. not)– Projected future electricity rate
increases
• Incentives– May be received up-
front or over time
• Tax credits– ITC– Other local tax benefits
• Financing method– Cash vs. loan vs. PPA
vs. …
• Other assumptions/concepts– Discount rate
(opportunity cost)– Compound interest
PG&E Webinar: PV Financial Analysis 39
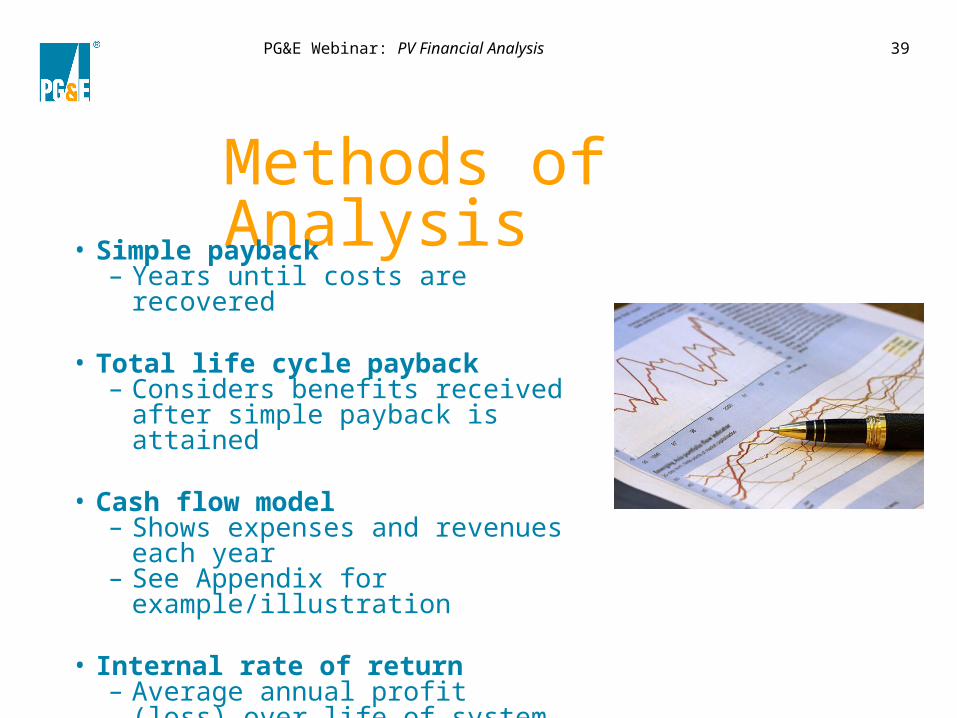
Methods of Analysis• Simple payback
– Years until costs are recovered
• Total life cycle payback– Considers benefits received
after simple payback is attained
• Cash flow model– Shows expenses and revenues
each year– See Appendix for
example/illustration
• Internal rate of return– Average annual profit (loss) over
life of system
PG&E Webinar: PV Financial Analysis 40
Information Resources
PG&E Webinar: PV Financial Analysis 41
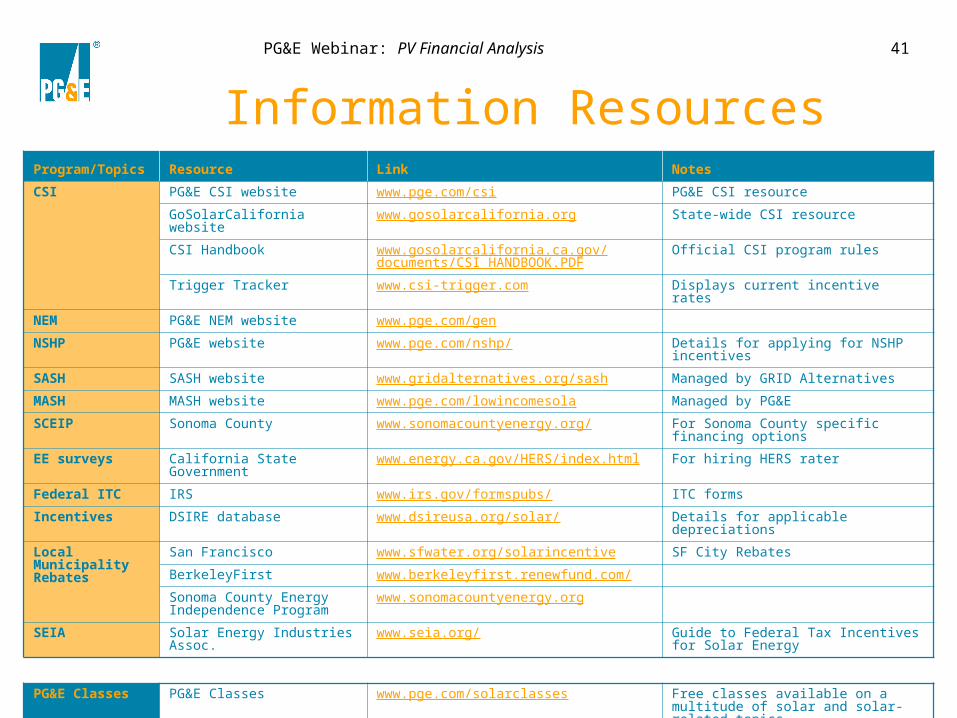
Information ResourcesProgram/Topics Resource Link Notes
CSI PG&E CSI website www.pge.com/csi PG&E CSI resource
GoSolarCalifornia website www.gosolarcalifornia.org State-wide CSI resource
CSI Handbook www.gosolarcalifornia.ca.gov/documents/CSI_HANDBOOK.PDF
Official CSI program rules
Trigger Tracker www.csi-trigger.com Displays current incentive rates
NEM PG&E NEM website www.pge.com/gen
NSHP PG&E website www.pge.com/nshp/ Details for applying for NSHP incentives
SASH SASH website www.gridalternatives.org/sash Managed by GRID Alternatives
MASH MASH website www.pge.com/lowincomesola Managed by PG&E
SCEIP Sonoma County www.sonomacountyenergy.org/ For Sonoma County specific financing options
EE surveys California State Government
www.energy.ca.gov/HERS/index.html For hiring HERS rater
Federal ITC IRS www.irs.gov/formspubs/ ITC forms
Incentives DSIRE database www.dsireusa.org/solar/ Details for applicable depreciations
Local Municipality Rebates
San Francisco www.sfwater.org/solarincentive SF City Rebates
BerkeleyFirst www.berkeleyfirst.renewfund.com/
Sonoma County Energy Independence Program
www.sonomacountyenergy.org
SEIA Solar Energy Industries Assoc.
www.seia.org/ Guide to Federal Tax Incentives for Solar Energy
PG&E Classes PG&E Classes www.pge.com/solarclasses Free classes available on a multitude of solar and solar-related topics
PG&E Webinar: PV Financial Analysis 42
Thank you!Your thoughts?
• Suggestions for future content?
• Opinions on content and delivery?
• Topics to emphasize or de-emphasize?
• How can we provide a better service?
Feedback is welcomed!
Feedback is welcomed!
PG&E Webinar: PV Financial Analysis 43
Appendix
PG&E Webinar: PV Financial Analysis 44
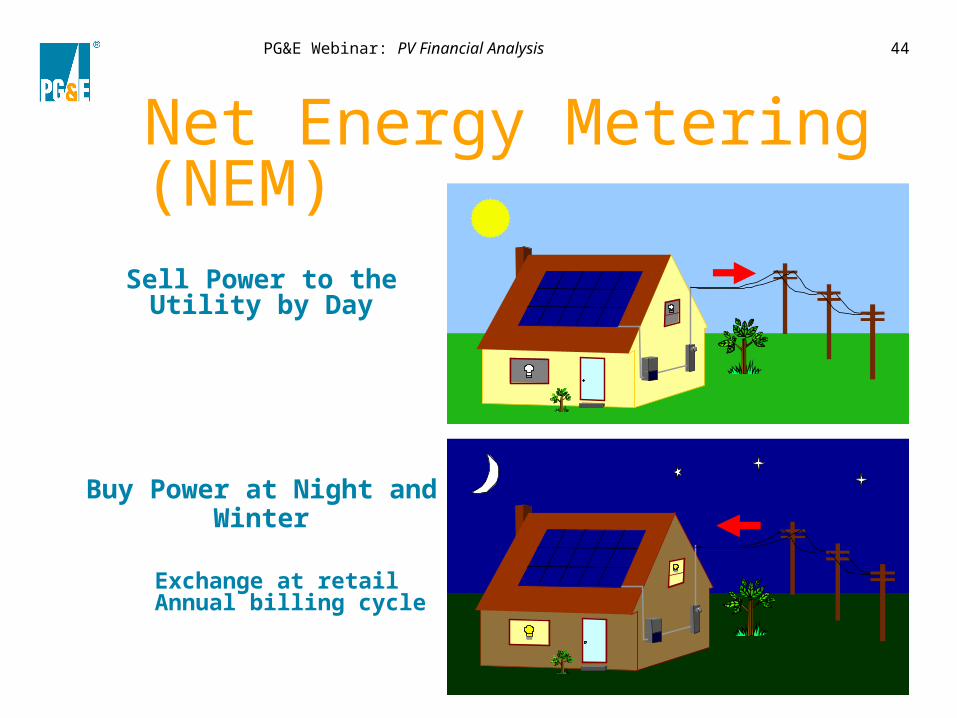
Net Energy Metering (NEM)
Sell Power to the Utility by Day
.
Buy Power at Night and Winter
Exchange at retail Annual billing cycle
PG&E Webinar: PV Financial Analysis 45
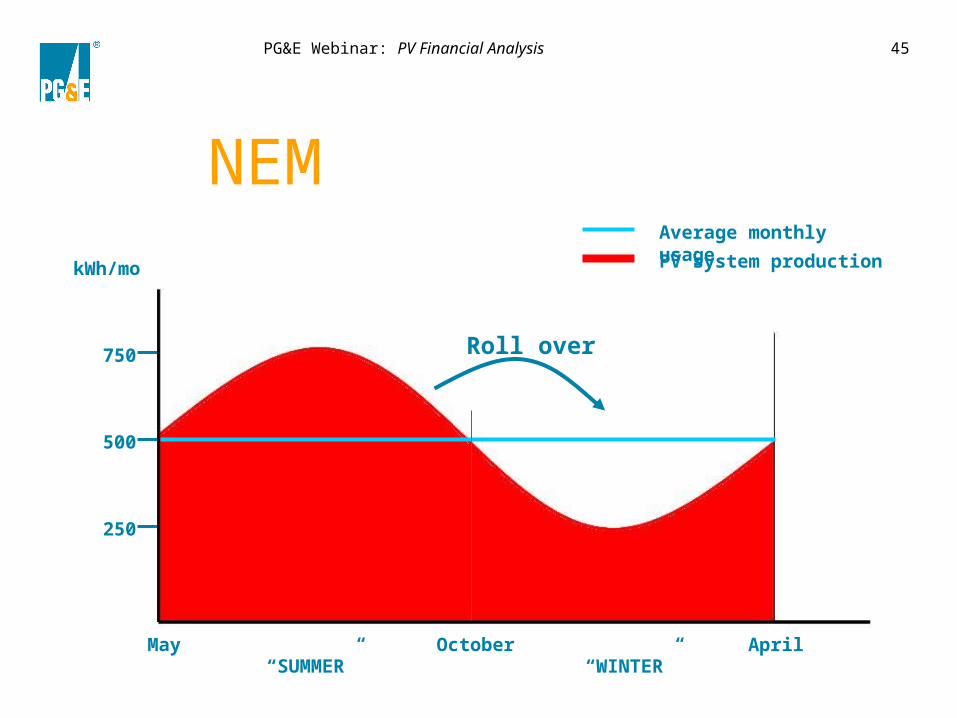
NEM
OctoberMay April“SUMMER” “WINTER”
250
500
750
kWh/mo
Roll over
Average monthly usage
PV system production
PG&E Webinar: PV Financial Analysis 46
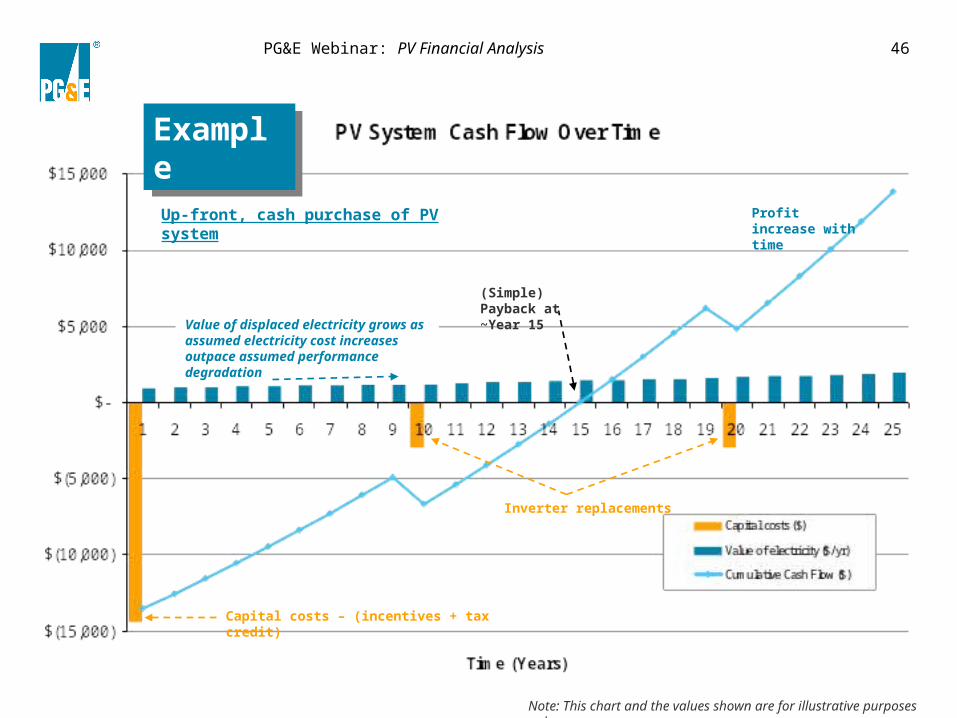
Value of displaced electricity grows as assumed electricity cost increases outpace assumed performance degradation
Inverter replacements
(Simple) Payback at ~Year 15
Profit increase with time
Note: This chart and the values shown are for illustrative purposes only.
Capital costs – (incentives + tax credit)
ExampleExampleUp-front, cash purchase of PV system


![October 3, 2019 Garen Fedeles, Esq. Santicola, Steele ......From: Garen Fedeles To: DC, OpenRecords Cc: midland water authority borough of midland Subject: [External] Advisory Opinion](https://img.pdfslide.us/doc/110x75/5fe447d43616553e0750a15f/october-3-2019-garen-fedeles-esq-santicola-steele-from-garen-fedeles.jpg)