Embed Size (px)
Citation preview

Spatial Econometric Model of Healthcare Spending
Garen Evans
MISSISSIPPI STATE UNIVERSITY
LOCAL!

Background
Health Care spending as Percentage of GSP

Health Care Spending
HospitalsProfessional ServicesLong Term Care home health care, nursing homes
Personal Medical Supplies durables, drugs, supplies
Other
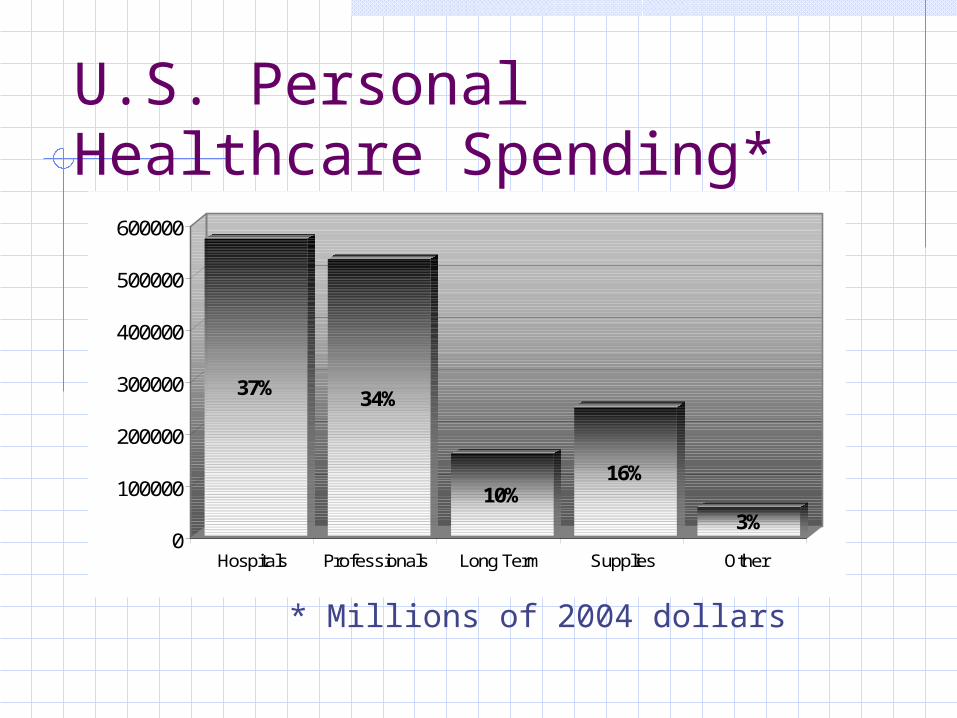
U.S. Personal Healthcare Spending*
37% 34%
10%16%
3%0
100000
200000
300000
400000
500000
600000
Hospitals Professionals Long Term Supplies Other
* Millions of 2004 dollars
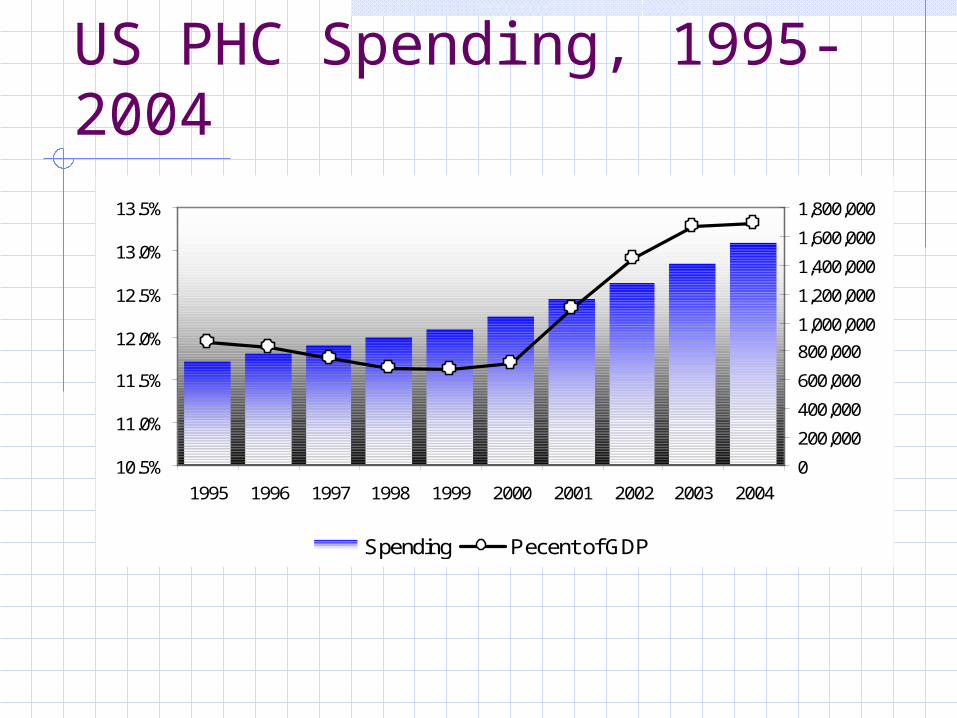
US PHC Spending, 1995-2004
10.5%
11.0%
11.5%
12.0%
12.5%
13.0%
13.5%
1995 1996 1997 1998 1999 2000 2001 2002 2003 2004
0
200,000
400,000
600,000
800,000
1,000,000
1,200,000
1,400,000
1,600,000
1,800,000
Spending Pecent of GDP
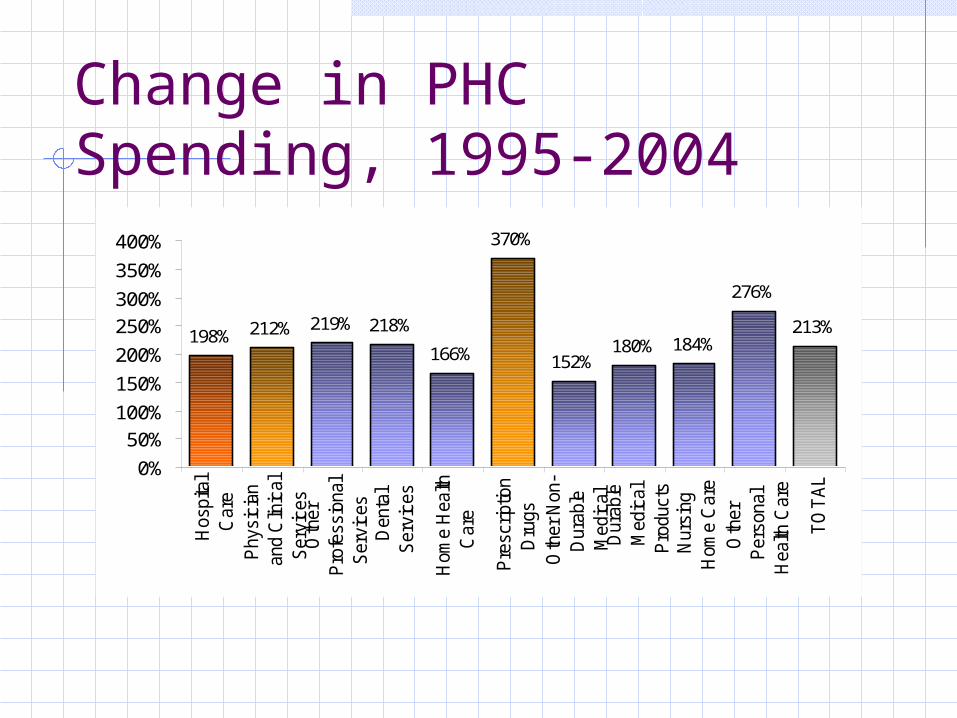
Change in PHC Spending, 1995-2004
198% 212% 219% 218%
166%
370%
152%180% 184%
276%
213%
0%
50%
100%
150%
200%
250%
300%
350%
400%
Hos
pita
lC
are
Phy
sici
anan
d C
linic
alS
ervi
ces
Oth
erP
rofe
ssio
nal
Ser
vice
s D
enta
lS
ervi
ces
Hom
e H
ealth
Car
e
Pre
scrip
tion
Dru
gs
Oth
er N
on-
Dur
able
Med
ical
Dur
able
Med
ical
Pro
duct
s N
ursi
ngH
ome
Car
e
Oth
erP
erso
nal
Hea
lth C
are
TO
TA
L
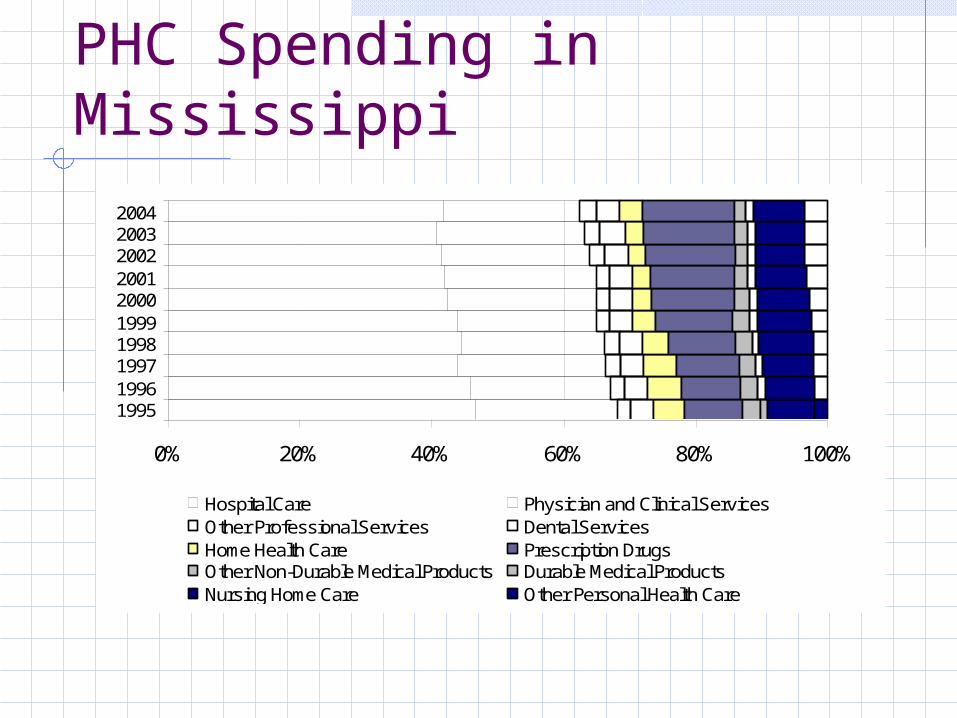
PHC Spending in Mississippi
0% 20% 40% 60% 80% 100%
1995199619971998199920002001200220032004
Hospital Care Physician and Clinical Services Other Professional Services Dental Services Home Health Care Prescription Drugs Other Non-Durable Medical Products Durable Medical Products Nursing Home Care Other Personal Health Care
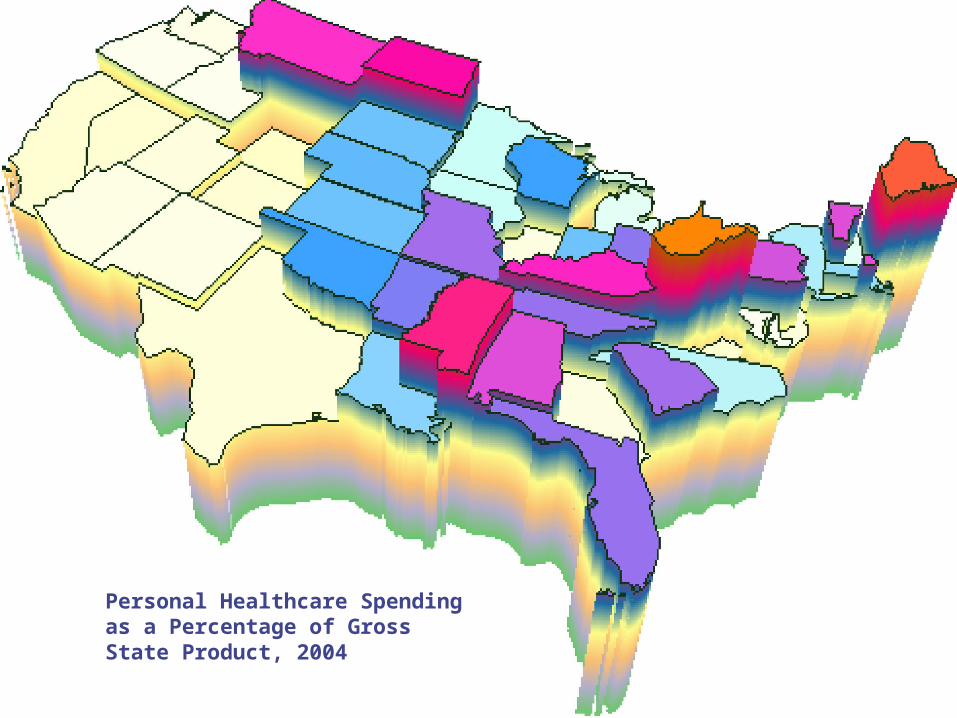
Personal Healthcare Spending as a Percentage of Gross State Product, 2004
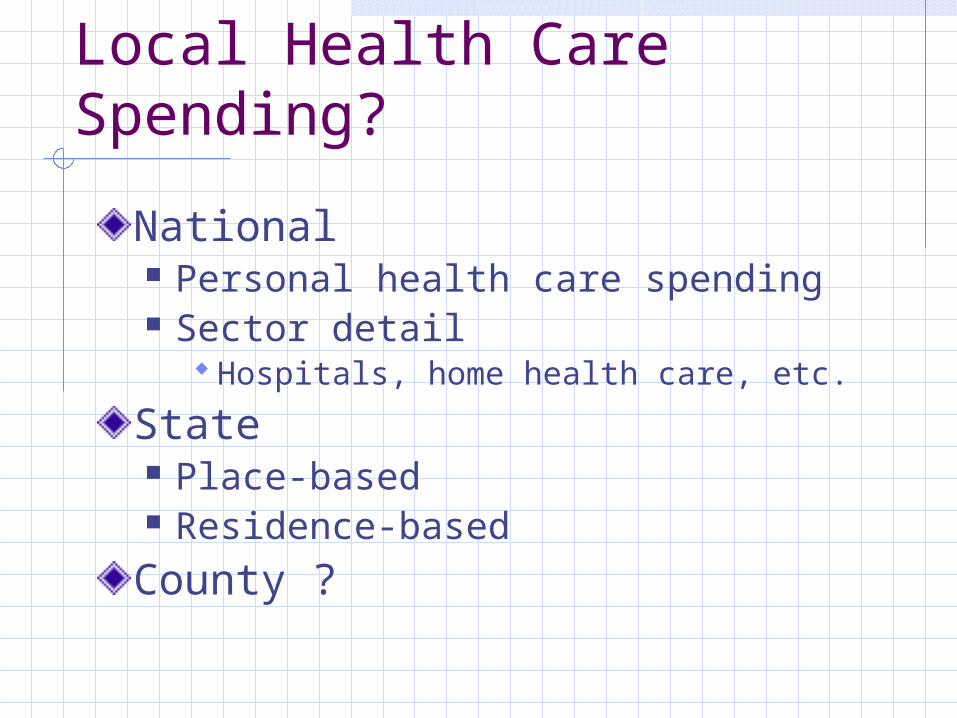
Local Health Care Spending?
National Personal health care spending Sector detail
Hospitals, home health care, etc.
State Place-based Residence-based
County ?
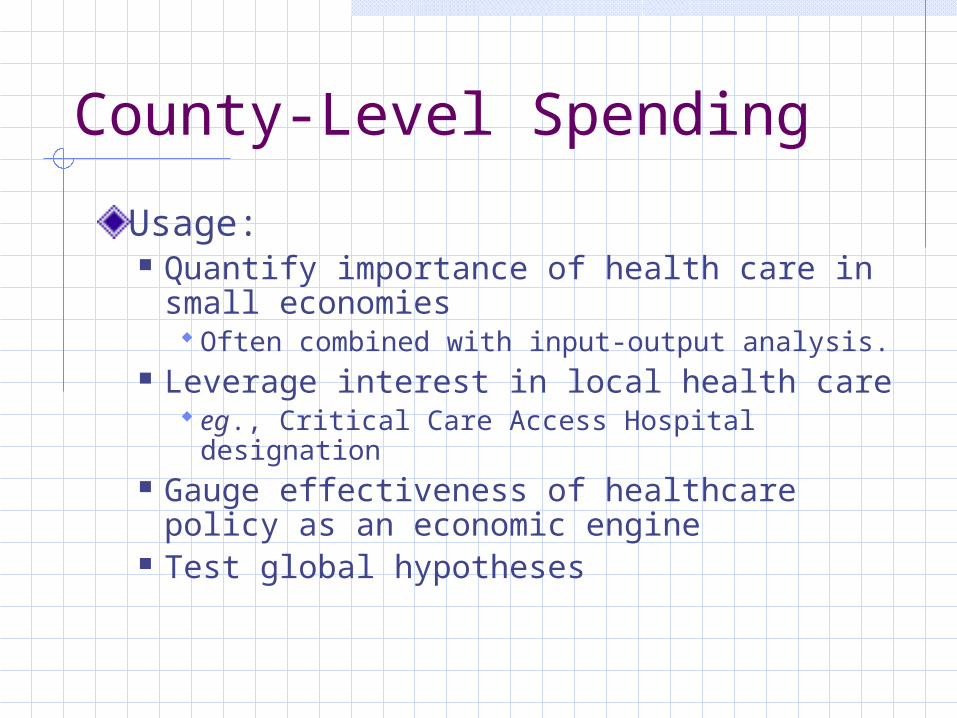
County-Level Spending
Usage: Quantify importance of health care in
small economies Often combined with input-output analysis.
Leverage interest in local health care eg., Critical Care Access Hospital
designation Gauge effectiveness of healthcare
policy as an economic engine Test global hypotheses
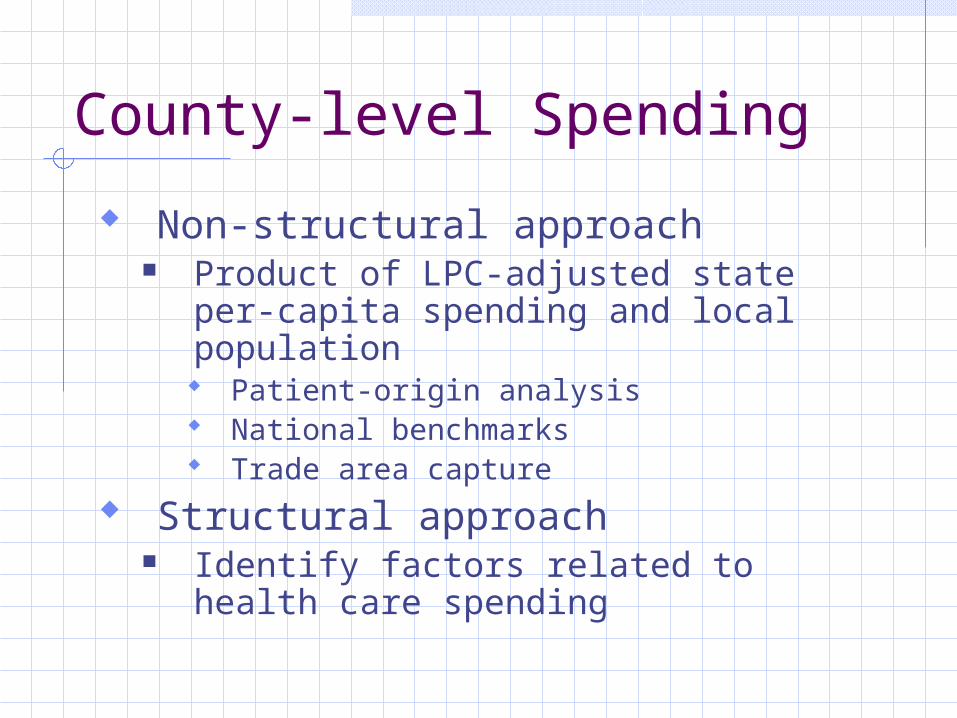
County-level Spending
Non-structural approach Product of LPC-adjusted state per-
capita spending and local population Patient-origin analysis National benchmarks Trade area capture
Structural approach Identify factors related to health
care spending
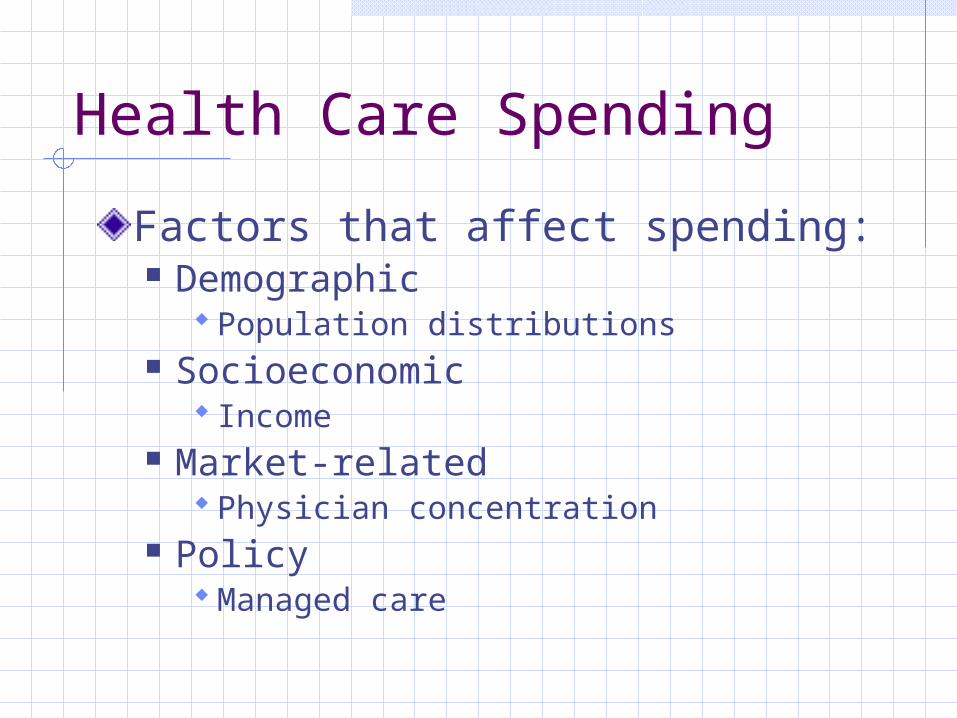
Health Care Spending
Factors that affect spending: Demographic
Population distributions Socioeconomic
Income Market-related
Physician concentration Policy
Managed care
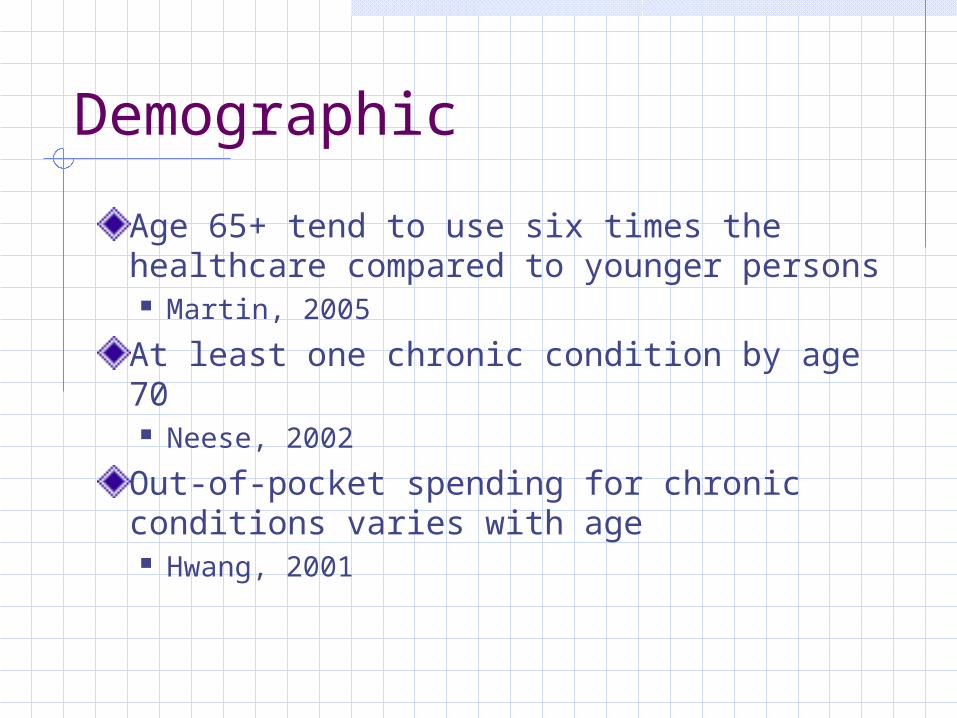
Demographic
Age 65+ tend to use six times the healthcare compared to younger persons Martin, 2005
At least one chronic condition by age 70 Neese, 2002
Out-of-pocket spending for chronic conditions varies with age Hwang, 2001
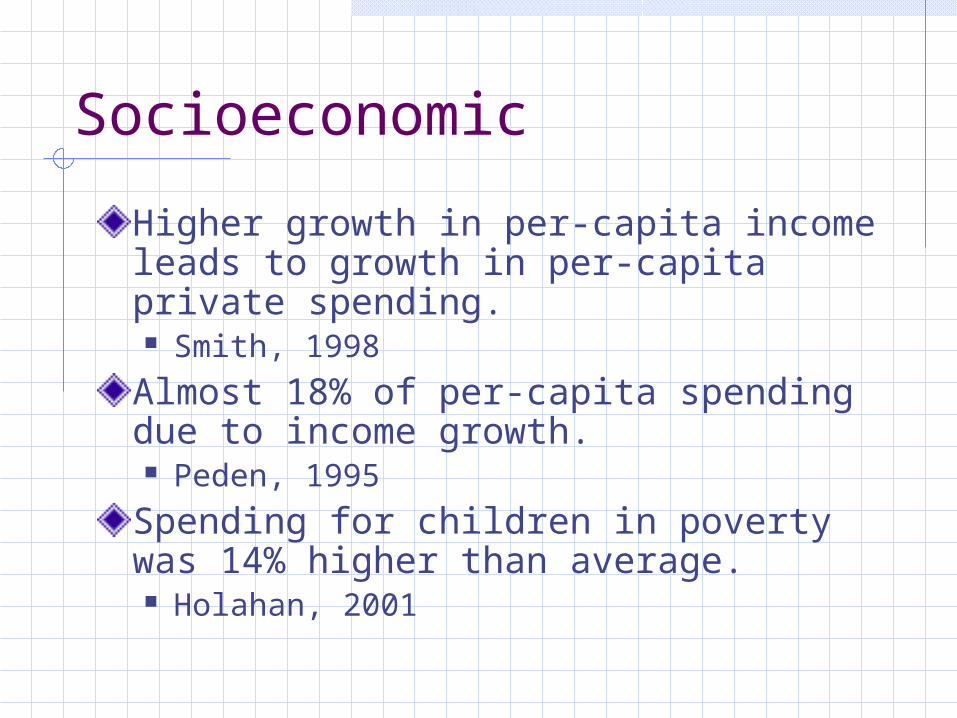
Socioeconomic
Higher growth in per-capita income leads to growth in per-capita private spending. Smith, 1998
Almost 18% of per-capita spending due to income growth. Peden, 1995
Spending for children in poverty was 14% higher than average. Holahan, 2001
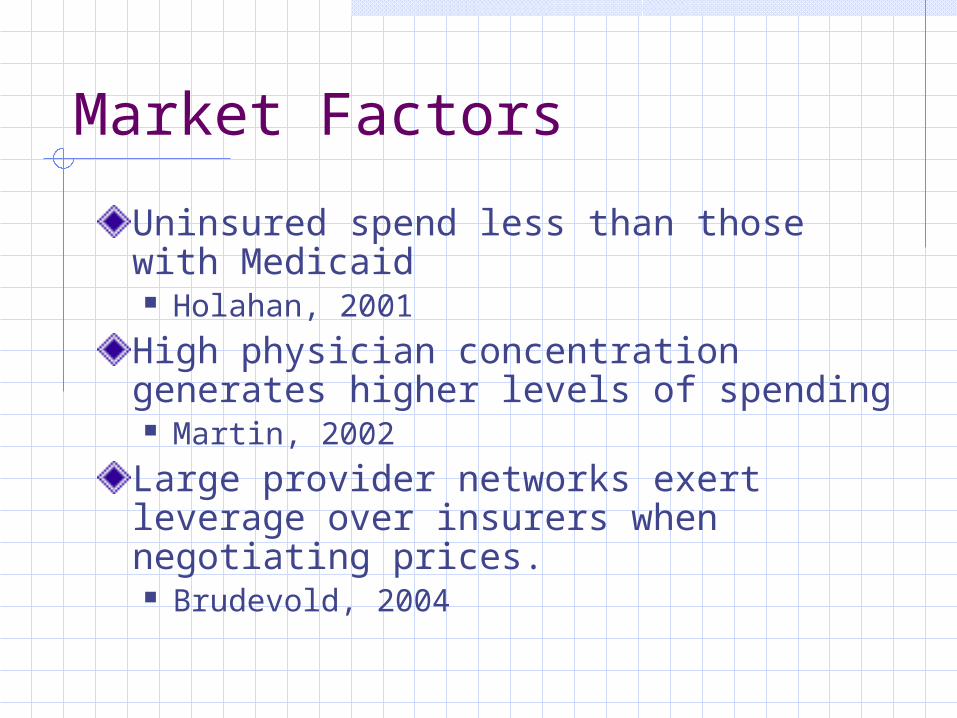
Market Factors
Uninsured spend less than those with Medicaid Holahan, 2001
High physician concentration generates higher levels of spending Martin, 2002
Large provider networks exert leverage over insurers when negotiating prices. Brudevold, 2004
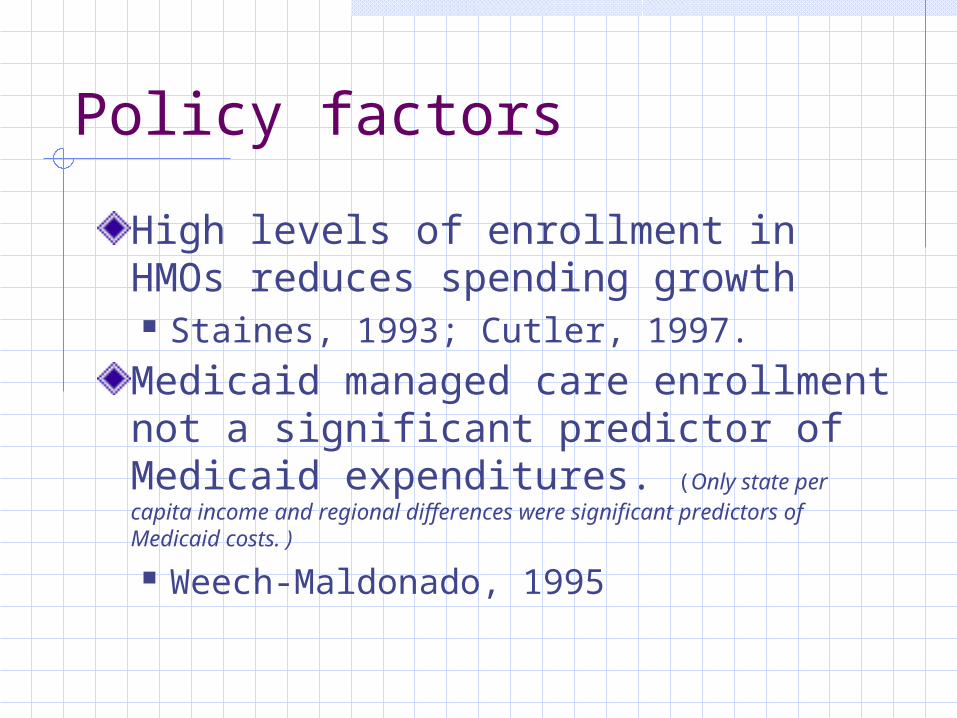
Policy factors
High levels of enrollment in HMOs reduces spending growth Staines, 1993; Cutler, 1997.
Medicaid managed care enrollment not a significant predictor of Medicaid expenditures. (Only state per capita income and regional differences were significant predictors of Medicaid costs. )
Weech-Maldonado, 1995
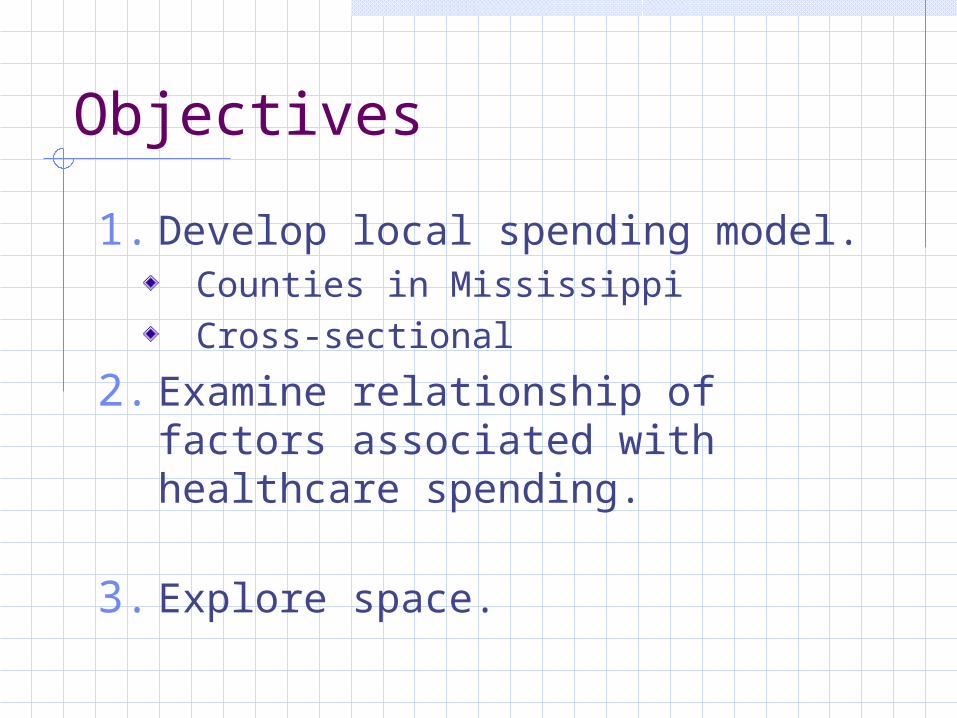
Objectives
1. Develop local spending model.Counties in MississippiCross-sectional
2. Examine relationship of factors associated with healthcare spending.
3. Explore space.
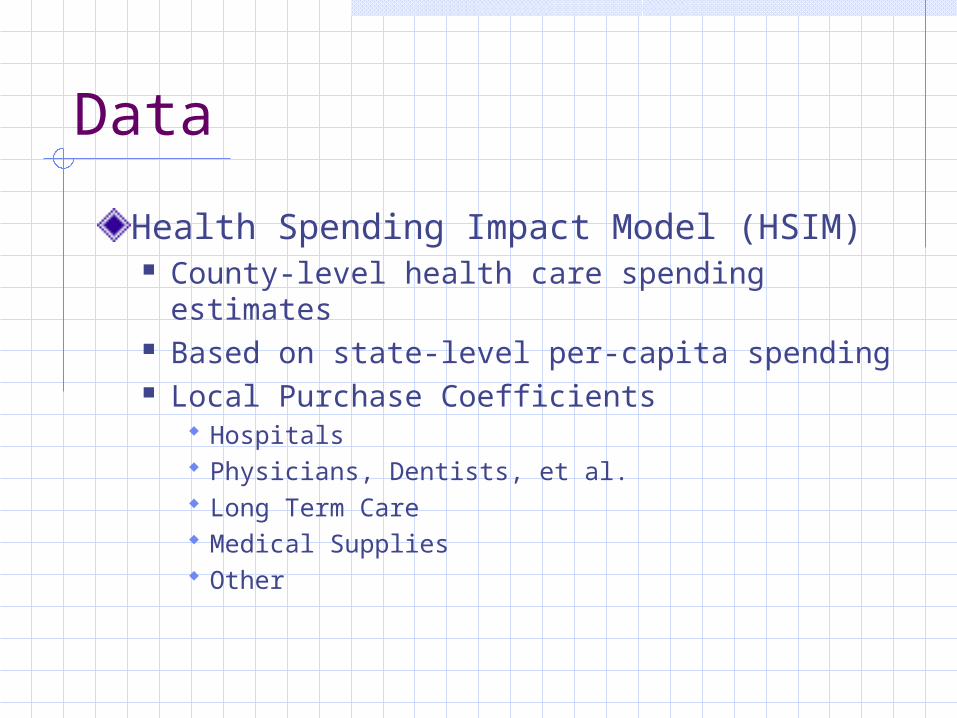
Data
Health Spending Impact Model (HSIM) County-level health care spending estimates Based on state-level per-capita spending Local Purchase Coefficients
Hospitals Physicians, Dentists, et al. Long Term Care Medical Supplies Other
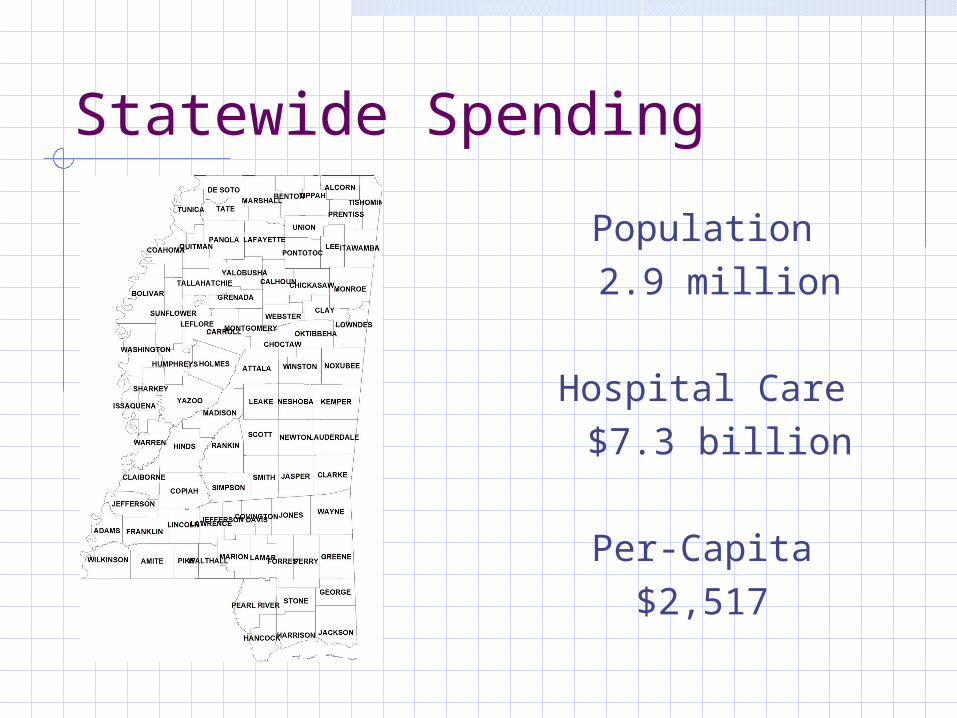
Statewide Spending
Population2.9 million
Hospital Care$7.3 billion
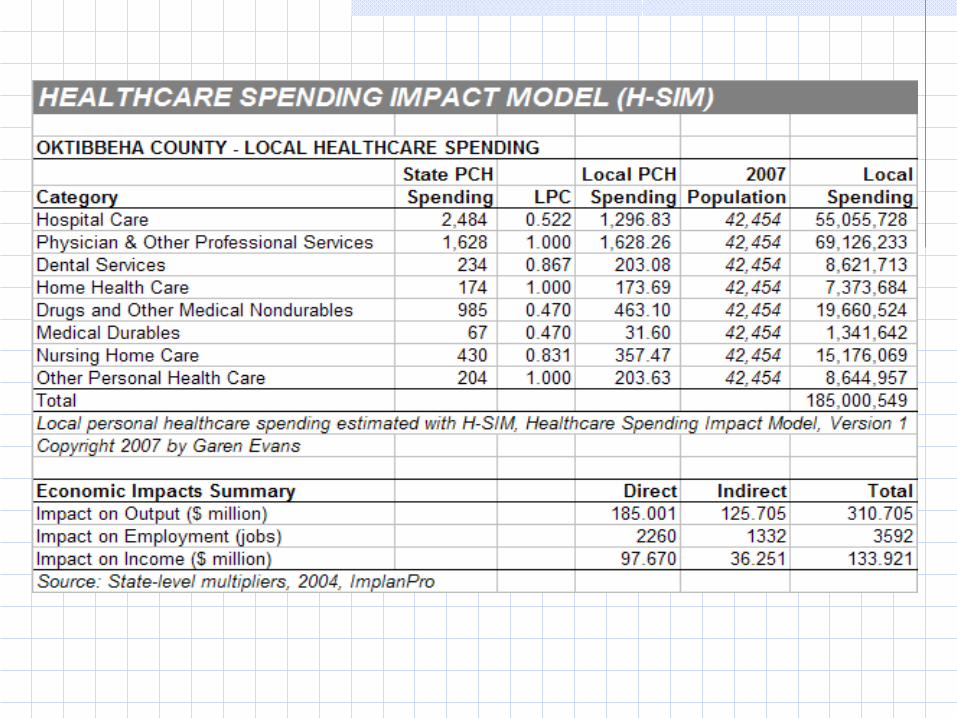
Per-Capita$2,517
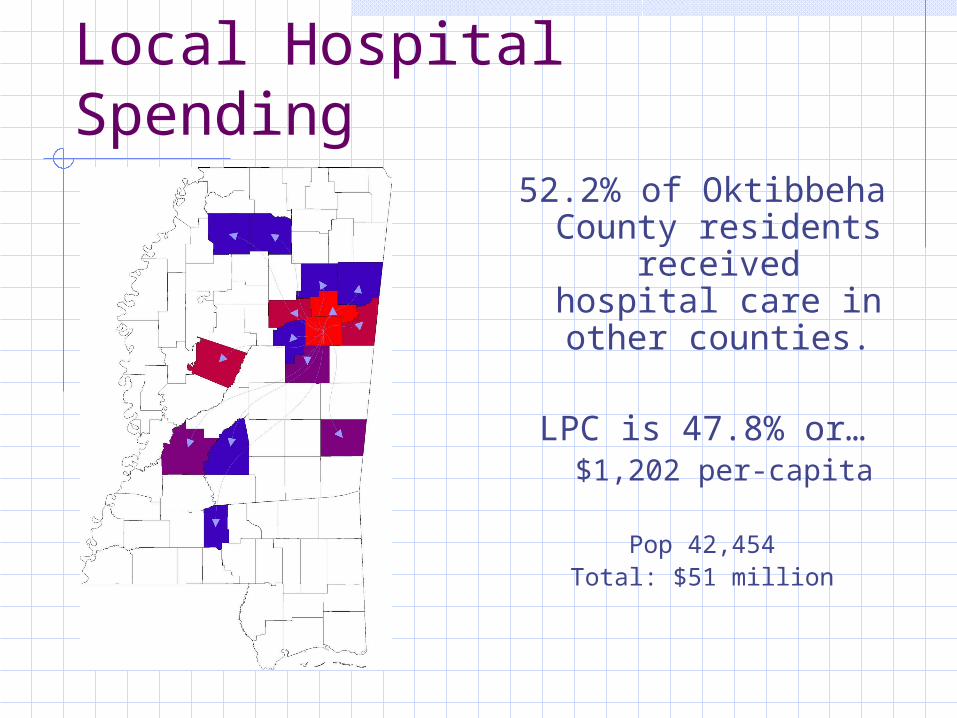
Local Hospital Spending52.2% of Oktibbeha
County residents received hospital
care in other counties.
LPC is 47.8% or…$1,202 per-capita
Pop 42,454Total: $51 million
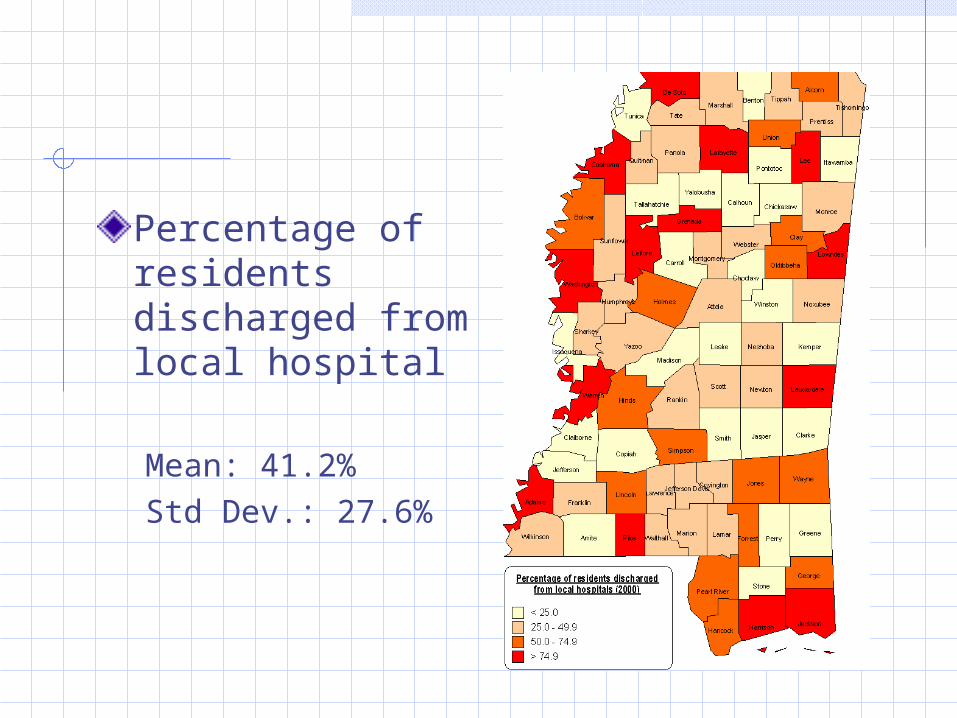
Percentage of residents discharged from local hospital
Mean: 41.2%Std Dev.: 27.6%

County-level per-capita spending for health care
Mean: $3,576
Max: $5,189Min: $956
11 < 1 SD (13%)16 > 1 SD (19.5%)
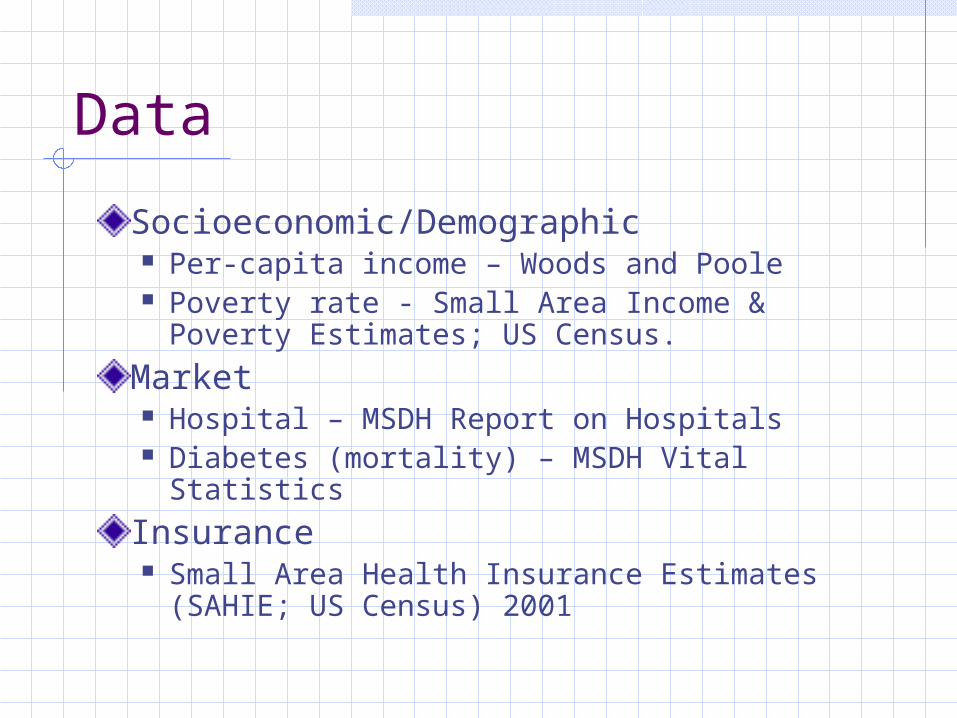
Data
Socioeconomic/Demographic Per-capita income – Woods and Poole Poverty rate - Small Area Income & Poverty
Estimates; US Census.
Market Hospital – MSDH Report on Hospitals Diabetes (mortality) – MSDH Vital Statistics
Insurance Small Area Health Insurance Estimates
(SAHIE; US Census) 2001
Spatial Weights
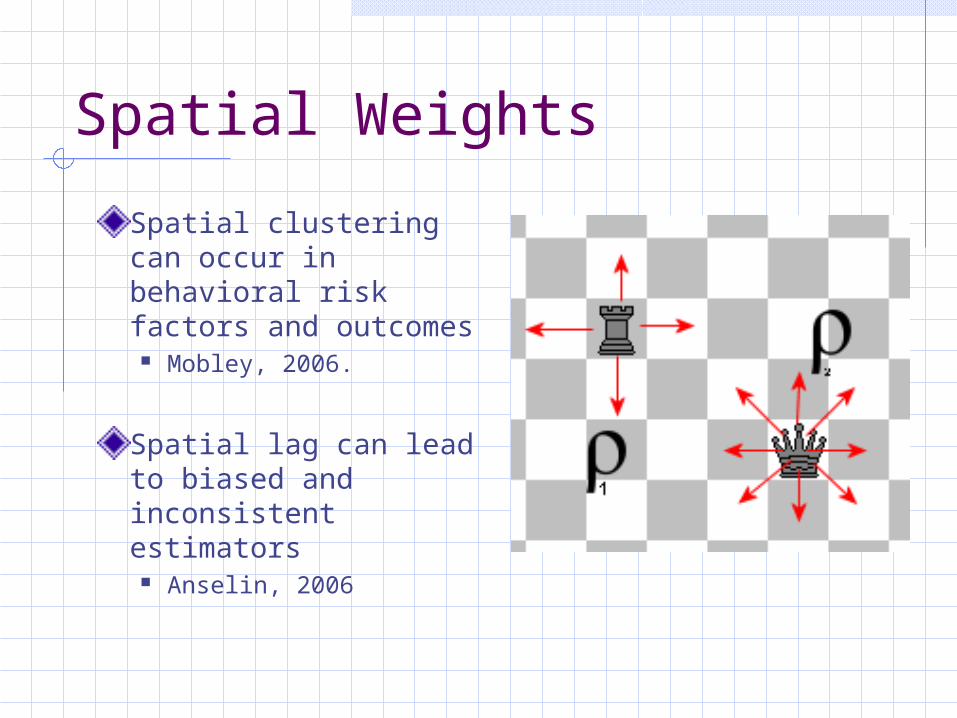
Spatial clustering can occur in behavioral risk factors and outcomes
Mobley, 2006.
Spatial lag can lead to biased and inconsistent estimators
Anselin, 2006
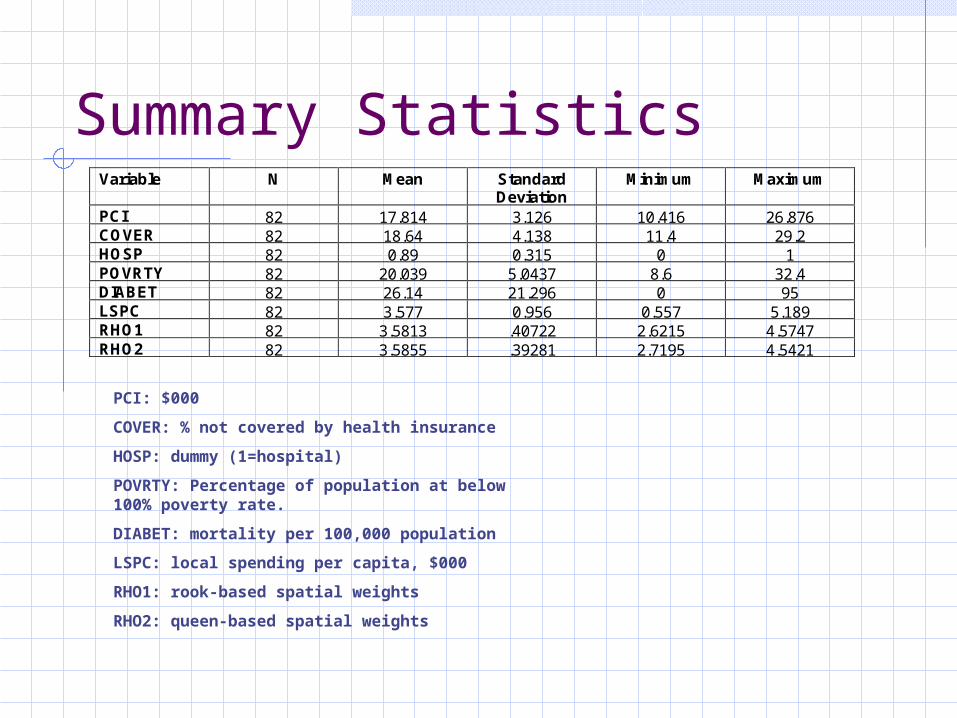
Summary Statistics
PCI: $000
COVER: % not covered by health insurance
HOSP: dummy (1=hospital)
POVRTY: Percentage of population at below 100% poverty rate.
DIABET: mortality per 100,000 population
LSPC: local spending per capita, $000
RHO1: rook-based spatial weights
RHO2: queen-based spatial weights
Variable N Mean Standard Deviation
Minimum Maximum
PCI 82 17.814 3.126 10.416 26.876 COVER 82 18.64 4.138 11.4 29.2 HOSP 82 0.89 0.315 0 1 POVRTY 82 20.039 5.0437 8.6 32.4 DIABET 82 26.14 21.296 0 95 LSPC 82 3.577 0.956 0.557 5.189 RHO1 82 3.5813 .40722 2.6215 4.5747 RHO2 82 3.5855 .39281 2.7195 4.5421
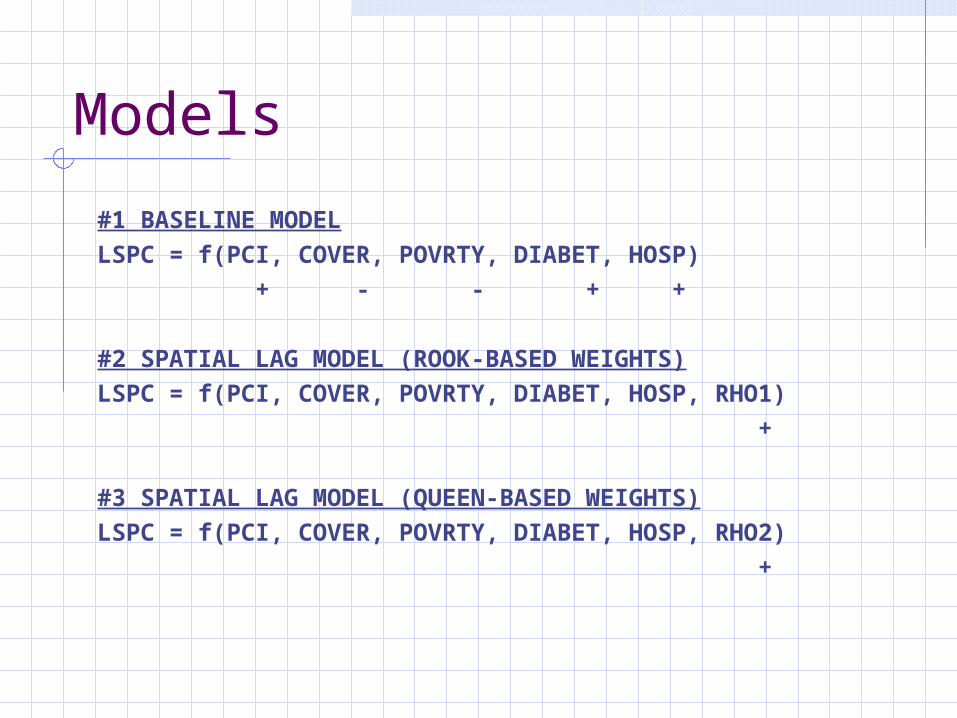
Models
#1 BASELINE MODEL
LSPC = f(PCI, COVER, POVRTY, DIABET, HOSP)
+ - - + +
#2 SPATIAL LAG MODEL (ROOK-BASED WEIGHTS)
LSPC = f(PCI, COVER, POVRTY, DIABET, HOSP, RHO1)
+
#3 SPATIAL LAG MODEL (QUEEN-BASED WEIGHTS)
LSPC = f(PCI, COVER, POVRTY, DIABET, HOSP, RHO2)
+
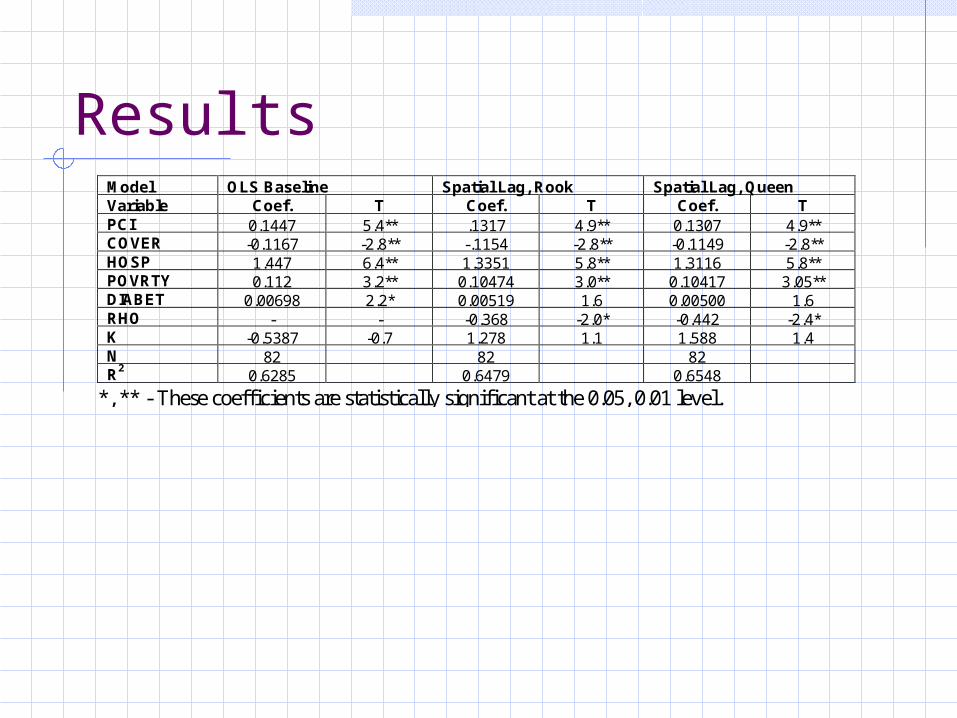
ResultsModel OLS Baseline Spatial Lag, Rook Spatial Lag, Queen Variable Coef. T Coef. T Coef. T PCI 0.1447 5.4** .1317 4.9** 0.1307 4.9** COVER -0.1167 -2.8** -.1154 -2.8** -0.1149 -2.8** HOSP 1.447 6.4** 1.3351 5.8** 1.3116 5.8** POVRTY 0.112 3.2** 0.10474 3.0** 0.10417 3.05** DIABET 0.00698 2.2* 0.00519 1.6 0.00500 1.6 RHO - - -0.368 -2.0* -0.442 -2.4* K -0.5387 -0.7 1.278 1.1 1.588 1.4 N 82 82 82 R2 0.6285 0.6479 0.6548
*, ** - These coefficients are statistically significant at the 0.05, 0.01 level.
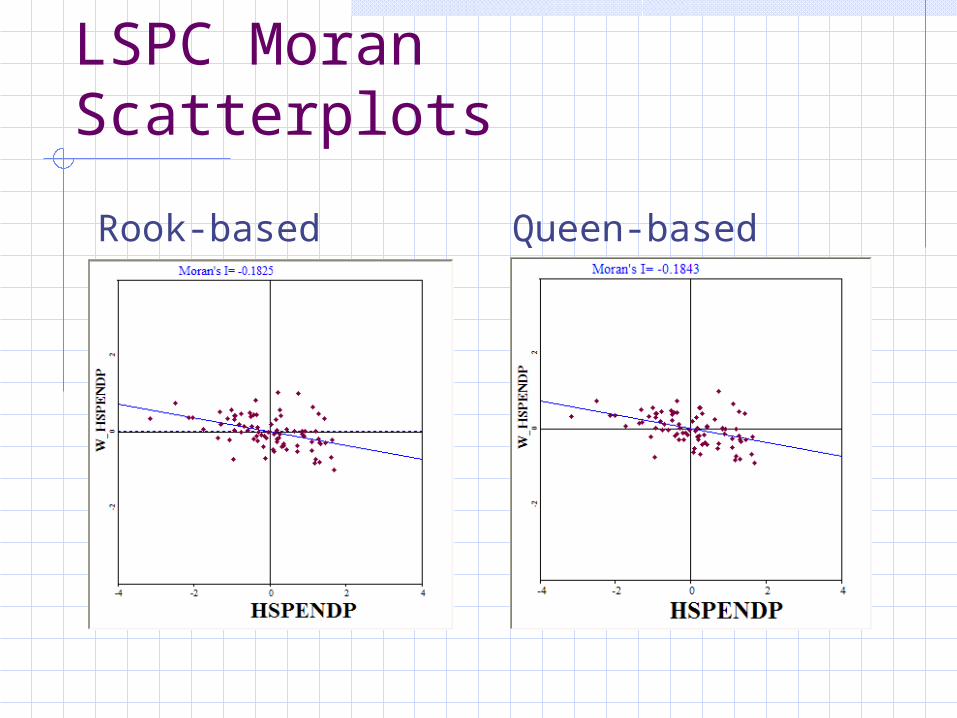
LSPC Moran Scatterplots
Rook-based Queen-based
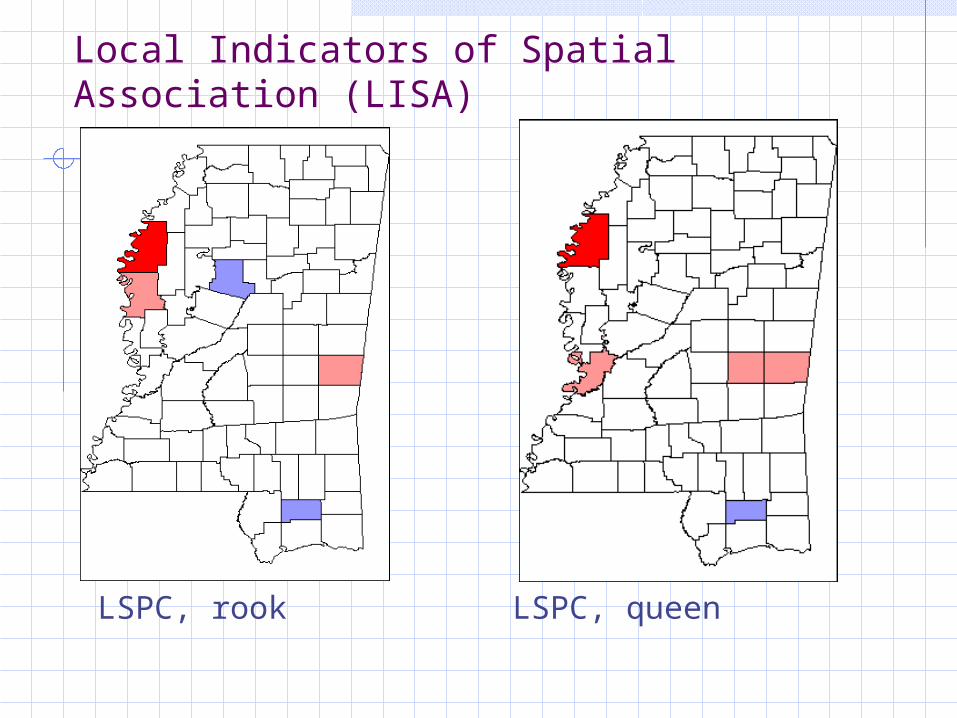
Local Indicators of Spatial Association (LISA)
LSPC, rook LSPC, queen
Summary
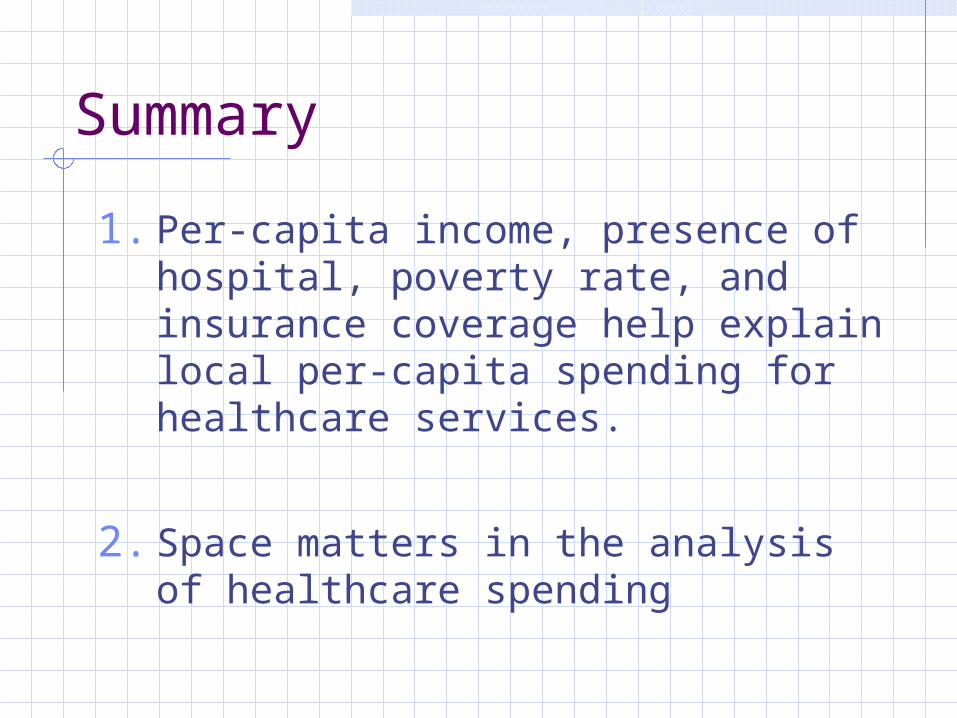
1. Per-capita income, presence of hospital, poverty rate, and insurance coverage help explain local per-capita spending for healthcare services.
2. Space matters in the analysis of healthcare spending
Summary
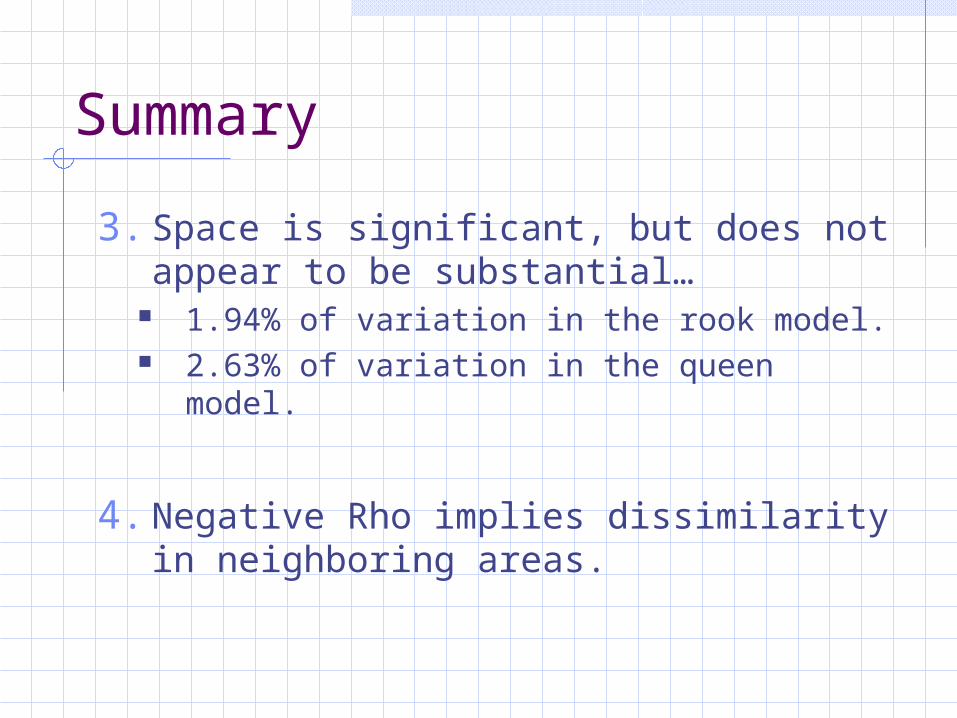
3. Space is significant, but does not appear to be substantial…
1.94% of variation in the rook model. 2.63% of variation in the queen model.
4. Negative Rho implies dissimilarity in neighboring areas.


![October 3, 2019 Garen Fedeles, Esq. Santicola, Steele ......From: Garen Fedeles To: DC, OpenRecords Cc: midland water authority borough of midland Subject: [External] Advisory Opinion](https://img.pdfslide.us/doc/110x75/5fe447d43616553e0750a15f/october-3-2019-garen-fedeles-esq-santicola-steele-from-garen-fedeles.jpg)