Embed Size (px)
Citation preview
JUNIPER NETWORKS INC (JNPR)
10-Q Quarterly report pursuant to sections 13 or 15(d)
Filed on 08/08/2012Filed Period 06/30/2012
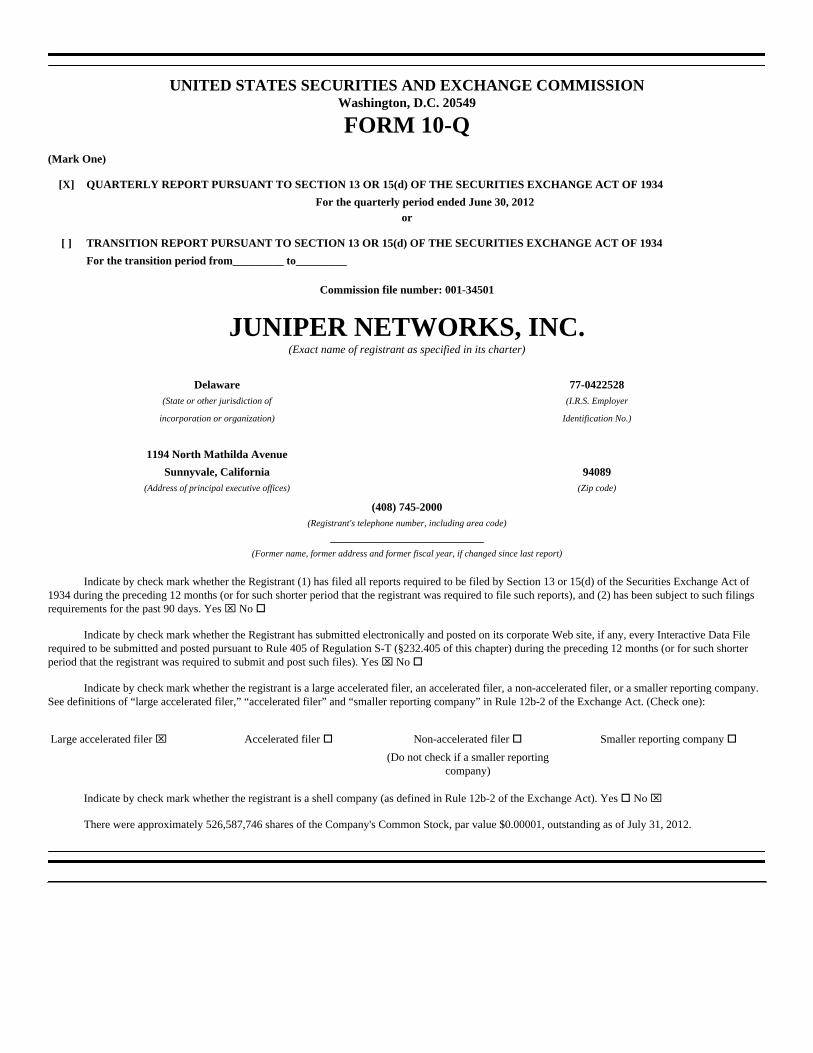
UNITED STATES SECURITIES AND EXCHANGE COMMISSIONWashington, D.C. 20549
FORM 10-Q(Mark One)
[X] QUARTERLY REPORT PURSUANT TO SECTION 13 OR 15(d) OF THE SECURITIES EXCHANGE ACT OF 1934
For the quarterly period ended June 30, 2012or
[ ] TRANSITION REPORT PURSUANT TO SECTION 13 OR 15(d) OF THE SECURITIES EXCHANGE ACT OF 1934
For the transition period from_________ to_________
Commission file number: 001-34501
JUNIPER NETWORKS, INC.(Exact name of registrant as specified in its charter)
Delaware 77-0422528(State or other jurisdiction of (I.R.S. Employer
incorporation or organization) Identification No.)
1194 North Mathilda Avenue
Sunnyvale, California 94089(Address of principal executive offices) (Zip code)
(408) 745-2000(Registrant's telephone number, including area code)
_________________________________
(Former name, former address and former fiscal year, if changed since last report)
Indicate by check mark whether the Registrant (1) has filed all reports required to be filed by Section 13 or 15(d) of the Securities Exchange Act of1934 during the preceding 12 months (or for such shorter period that the registrant was required to file such reports), and (2) has been subject to such filingsrequirements for the past 90 days. Yes x No o
Indicate by check mark whether the Registrant has submitted electronically and posted on its corporate Web site, if any, every Interactive Data Filerequired to be submitted and posted pursuant to Rule 405 of Regulation S-T (§232.405 of this chapter) during the preceding 12 months (or for such shorterperiod that the registrant was required to submit and post such files). Yes x No o
Indicate by check mark whether the registrant is a large accelerated filer, an accelerated filer, a non-accelerated filer, or a smaller reporting company.See definitions of “large accelerated filer,” “accelerated filer” and “smaller reporting company” in Rule 12b-2 of the Exchange Act. (Check one):
Large accelerated filer x Accelerated filer o Non-accelerated filer o Smaller reporting company o
(Do not check if a smaller reportingcompany)
Indicate by check mark whether the registrant is a shell company (as defined in Rule 12b-2 of the Exchange Act). Yes o No x
There were approximately 526,587,746 shares of the Company's Common Stock, par value $0.00001, outstanding as of July 31, 2012.
Juniper Networks, Inc.
Table of Contents
PART I - FINANCIAL INFORMATION 3
Item 1. Condensed Consolidated Financial Statements 3
Condensed Consolidated Statements of Comprehensive IncomeThree and Six Months Ended June 30, 2012 and 2011
3
Condensed Consolidated Balance Sheets June 30, 2012 and December 31, 2011
4
Condensed Consolidated Statements of Cash FlowsSix Months Ended June 30, 2012 and 2011
5
Notes to Condensed Consolidated Financial Statements 6
Item 2. Management’s Discussion and Analysis of Financial Condition and Results of Operations 32
Item 3. Quantitative and Qualitative Disclosures About Market Risk 43
Item 4. Controls and Procedures 43
PART II - OTHER INFORMATION 44
Item 1. Legal Proceedings 44
Item 1A. Risk Factors 44
Item 2. Unregistered Sales of Equity Securities and Use of Proceeds 56
Item 6. Exhibits 57
SIGNATURES 58
Exhibit Index 59
2
Table of Contents
PART I — FINANCIAL INFORMATION
Item 1. Condensed Consolidated Financial Statements
Juniper Networks, Inc.
Condensed Consolidated Statements of Comprehensive Income(In thousands, except per share amounts)
(Unaudited)
Three Months Ended June 30, Six Months Ended June 30,
2012 2011 2012 2011
Net revenues:
Product $ 804,662 $ 891,428 $ 1,576,535 $ 1,768,868
Service 269,097 229,116 529,722 453,288
Total net revenues 1,073,759 1,120,544 2,106,257 2,222,156
Cost of revenues:
Product 292,589 292,391 573,218 558,137
Service 113,297 105,987 231,111 205,968
Total cost of revenues 405,886 398,378 804,329 764,105
Gross margin 667,873 722,166 1,301,928 1,458,051
Operating expenses:
Research and development 268,734 257,250 538,336 519,229
Sales and marketing 259,455 246,635 517,174 492,926
General and administrative 48,775 44,260 103,441 89,184
Amortization of purchased intangible assets 1,236 1,332 2,414 2,876
Restructuring 3,161 (916) 5,200 (1,263)
Acquisition-related (206) 2,685 936 6,786
Total operating expenses 581,155 551,246 1,167,501 1,109,738
Operating income 86,718 170,920 134,427 348,313
Other income (expense), net 2,770 (13,688) (21,661) (20,150)
Income before income taxes and noncontrolling interest
89,488 157,232 112,766 328,163
Income tax provision 31,769 41,714 38,777 82,985
Consolidated net income 57,719 115,518 73,989 245,178
Adjust for net loss attributable to noncontrolling interest
— 42 — 132
Net income attributable to Juniper Networks $ 57,719 $ 115,560 $ 73,989 $ 245,310
Net income per share attributable to Juniper Networks common stockholders:
Basic $ 0.11 $ 0.22 $ 0.14 $ 0.46
Diluted $ 0.11 $ 0.21 $ 0.14 $ 0.45
Shares used in computing net income per share:
Basic 527,756 532,909 527,989 531,827
Diluted 531,755 546,452 533,753 547,729
Comprehensive income $ 50,069 $ 116,584 $ 83,217 $ 257,331
See accompanying Notes to Condensed Consolidated Financial Statements
3
Table of Contents
Juniper Networks, Inc.
Condensed Consolidated Balance Sheets(In thousands, except par values)
June 30,2012
December 31,2011
(Unaudited)
ASSETS
Current assets:
Cash and cash equivalents $ 3,044,310 $ 2,910,420
Short-term investments 394,507 641,323
Accounts receivable, net of allowances 406,756 577,386
Deferred tax assets, net 177,412 154,310
Prepaid expenses and other current assets 206,771 156,222
Total current assets 4,229,756 4,439,661
Property and equipment, net 711,953 598,581
Long-term investments 832,966 740,659
Restricted cash and investments 82,002 78,307
Purchased intangible assets, net 143,774 123,114
Goodwill 3,987,707 3,928,144
Other long-term assets 58,123 75,354
Total assets $ 10,046,281 $ 9,983,820
LIABILITIES AND STOCKHOLDERS' EQUITY
Current liabilities:
Accounts payable $ 199,563 $ 324,843
Accrued compensation 245,331 223,018
Accrued warranty 29,776 28,276
Deferred revenue 773,275 712,663
Income taxes payable 24,942 12,545
Other accrued liabilities 180,377 165,358
Total current liabilities 1,453,264 1,466,703
Long-term debt 999,108 999,034
Long-term deferred revenue 219,617 254,364
Long-term income taxes payable 108,178 108,471
Other long-term liabilities 57,191 65,590
Commitments and contingencies
Juniper Networks stockholders' equity:
Convertible preferred stock, $0.00001 par value; 10,000 shares authorized; none issued and outstanding
— —
Common stock, $0.00001 par value; 1,000,000 shares authorized; 526,122 shares and 526,409 shares issued and outstanding at June 30, 2012 and December 31, 2011, respectively
5 5
Additional paid-in capital 10,154,457 10,079,169
Accumulated other comprehensive loss (8,362) (17,590)
Accumulated deficit (2,937,653) (2,972,402)
Total Juniper Networks stockholders' equity 7,208,447 7,089,182
Noncontrolling interest 476 476
Total stockholders' equity 7,208,923 7,089,658
Total liabilities and stockholders' equity $ 10,046,281 $ 9,983,820
See accompanying Notes to Condensed Consolidated Financial Statements
4
Table of Contents
Juniper Networks, Inc.
Condensed Consolidated Statements of Cash Flows(In thousands)(Unaudited)
Six Months Ended June 30,
2012 2011
Cash flows from operating activities:
Consolidated net income $ 73,989 $ 245,178
Adjustments to reconcile consolidated net income to net cash provided by operating activities:
Depreciation and amortization 89,827 82,649
Non-cash portion of share-based compensation 126,887 106,243
Deferred income taxes (23,102) 8,677
Gain on investments, net (787) —
Excess tax benefits from share-based compensation (6,770) (43,331)
Amortization of debt issuance costs 472 273
Changes in operating assets and liabilities, net of effects from acquisitions:
Accounts receivable, net 170,694 107,982
Prepaid expenses and other assets (46,470) 6,408
Accounts payable (137,562) (34,051)
Accrued compensation 21,347 (38,756)
Income taxes payable 17,186 51,220
Other accrued liabilities 2,754 19,670
Deferred revenue 25,865 45,795
Net cash provided by operating activities 314,330 557,957
Cash flows from investing activities:
Purchases of property and equipment (169,713) (115,941)
Purchases of trading investments (3,120) (3,127)
Purchases of available-for-sale investments (614,842) (1,293,670)
Proceeds from sales of available-for-sale investments 399,642 685,258
Proceeds from maturities of available-for-sale investments 371,635 238,000
Payments for business acquisitions, net of cash and cash equivalents acquired (90,487) (31,073)
Proceeds from sales of privately-held investments 19,839 259
Purchases of privately-held investments (6,123) (8,902)
Purchase of other assets (297) —
Changes in restricted cash (211) (1,236)
Net cash used in investing activities (93,677) (530,432)
Cash flows from financing activities:
Proceeds from issuance of common stock 49,797 303,874
Purchases and retirement of common stock (150,087) (355,171)
Payment for capital lease obligation (1,430) —
Issuance of long-term debt, net — 991,556
Change in customer financing arrangements 8,187 15,064
Excess tax benefits from share-based compensation 6,770 43,331
Net cash (used in) provided by financing activities (86,763) 998,654
Net increase in cash and cash equivalents 133,890 1,026,179
Cash and cash equivalents at beginning of period 2,910,420 1,811,887
Cash and cash equivalents at end of period $ 3,044,310 $ 2,838,066
See accompanying Notes to Condensed Consolidated Financial Statements
5
Table of Contents
Juniper Networks, Inc.
Notes to Condensed Consolidated Financial Statements(Unaudited)
Note 1. Basis of Presentation
The unaudited Condensed Consolidated Financial Statements of Juniper Networks, Inc. (“Juniper Networks” or the “Company”) have been prepared inaccordance with U.S. generally accepted accounting principles (“U.S. GAAP”) for interim financial information as well as the instructions to Form 10-Q andthe rules and regulations of the U.S. Securities and Exchange Commission (“SEC”). Accordingly, they do not include all of the information and footnotesrequired by U.S. GAAP for complete financial statements. The Condensed Consolidated Balance Sheet as of December 31, 2011 , is derived from the auditedConsolidated Financial Statements for the year ended December 31, 2011 . In the opinion of management, all adjustments, including normal recurringaccruals, considered necessary for a fair presentation have been included. The results of operations for the three and six months ended June 30, 2012 , are notnecessarily indicative of the results that may be expected for the year ending December 31, 2012 , or any future period. The information included in thisQuarterly Report on Form 10-Q ("Report") should be read in conjunction with “Management's Discussion and Analysis of Financial Condition and Results ofOperations,” “Risk Factors,” “Quantitative and Qualitative Disclosures About Market Risk,” and the Consolidated Financial Statements and footnotes theretoincluded in the Company's Annual Report on Form 10-K for the year ended December 31, 2011 .
The preparation of financial statements in accordance with U.S. GAAP requires management to make estimates and assumptions that affect the amountsreported in the Condensed Consolidated Financial Statements and accompanying notes. Actual results could differ materially from those estimates.
Beginning in the first quarter of 2012, the Company aligned its organizational structure to focus on its platform and software strategy, which resulted in tworeportable segments organized principally by product families: Platform Systems Division ("PSD") and Software Solutions Division ("SSD"). In fiscal 2011,the Company was organized into two reportable segments, Infrastructure and Service Layer Technology. The Company has reclassified the segment data forthe prior periods to conform to the current period's presentation. The segment change did not impact previously reported consolidated net revenues, operatingincome, net income, and net income per share. See Note 12, Segments, for further discussion of the Company's segment reorganization.
As of June 30, 2012, the Company owned a 60 percent interest in a joint venture with Nokia Siemens Networks B.V. (“NSN”). Given the Company's majorityownership interest in the joint venture, the accounts of the joint venture have been consolidated with the accounts of the Company, and a noncontrollinginterest has been recorded for the noncontrolling investor's interests in the net assets and operations of the joint venture. In July 2011, NSN and the Companyentered into an agreement to cease operation of and terminate the joint venture. NSN has assumed the activities of the joint venture. The Company is in theprocess of winding down this joint venture and the termination of this joint venture is not expected to have a material effect on the Company's financialposition or results of operations.
Note 2. Summary of Significant Accounting Policies
Recent Accounting Pronouncements
In September 2011, the Financial Accounting Standards Board ("FASB") issued Accounting Standards Update ("ASU") No. 2011-08, Topic 350 - Intangibles- Goodwill and Other ("ASU 2011-08"), which amends Topic 350 and provides entities an option to perform a qualitative assessment to determine whetherfurther impairment testing on goodwill is necessary. Specifically, an entity has the option to first assess qualitative factors to determine whether it is necessaryto perform the current two-step test. If an entity believes, as a result of its qualitative assessment, that it is more-likely-than-not that the fair value of areporting unit is less than its carrying amount, the quantitative impairment test is required. Otherwise, no further testing is required. The Company adoptedthis standard in the first quarter of 2012. The Company’s adoption of the standard during the first quarter of 2012 did not impact its consolidated results ofoperations or financial condition.
In June 2011, the FASB issued ASU No. 2011-05, Topic 220 - Presentation of Comprehensive Income (“ASU 2011-05”), which requires companies topresent net income and other comprehensive income in one continuous statement or in two separate, but consecutive, statements. In addition, in December2011, the FASB issued ASU No. 2011-12, Topic 220 - Comprehensive Income ("ASU 2011-12"), which defers the requirement to present components ofreclassifications of other comprehensive income on the face of the income statement. The Company adopted both standards in the first quarter of 2012.
6
Table of Contents
Juniper Networks, Inc.
Notes to Condensed Consolidated Financial Statements (Continued)(Unaudited)
The Company’s adoption of the standard during the first quarter of 2012 did not impact its consolidated results of operations or financial condition.
In May 2011, the FASB issued ASU No. 2011-04, Topic 820 - Amendments to Achieve Common Fair Value Measurement and Disclosure Requirements inU.S. GAAP and IFRSs (“ASU 2011-04”), which amends the fair value measurement guidance and includes some enhanced disclosure requirements. The mostsignificant change in disclosures is an expansion of the information required for Level 3 measurements based on unobservable inputs. The Company adoptedthis standard in the first quarter of 2012. The Company’s adoption of the standard during the first quarter of 2012 did not impact its consolidated results ofoperations or financial condition.
Note 3. Business Combinations
The Company's Condensed Consolidated Financial Statements include the operating results of acquired businesses from the date of each acquisition. Proforma results of operations for these acquisitions have not been presented as the financial impact to the Company's consolidated results of operations, bothindividually and in aggregate, is not material.
During the six months ended June 30, 2012, the Company completed two acquisitions. The fair values of certain income based taxes and residual goodwill arenot yet finalized and subject to change. The Company expects to continue to obtain information to assist in determining the fair value of the net assetsacquired at the acquisition date during the measurement period. Measurement period adjustments determined to be material will be applied retrospectively tothe period of acquisition.
On February 13, 2012, the Company acquired 100% of the equity securities of Mykonos Software, Inc. ("Mykonos"). The acquisition of Mykonos is intendedto extend Juniper's security portfolio with an intrusion deception system capable of detecting an attacker before an attack is in process. Goodwill recognizedas the result of the acquisition was assigned to the SSD segment.
On March 8, 2012, the Company acquired a source code license, patent joint-ownership, and employees related to the service management layer ofBitGravity, Inc. ("BitGravity") Content Delivery Network ("CDN") technology. The transaction complements the Company's Media Flow Solution andcontent and media delivery strategy, to enable service providers, on-line media companies, and content delivery networks to deliver on-line content more cost-effectively while simultaneously improving the end-user experience. Goodwill recognized as the result of the acquisition was assigned to the SSD segment.
The following table presents the preliminary purchase consideration allocations for these acquisitions, including cash and cash equivalents acquired (inmillions):
Mykonos BitGravity Total
Net tangible assets/(liabilities) acquired $ (0.8) $ 0.1 $ (0.7)
Intangible assets acquired 24.3 12.4 36.7
Goodwill 59.1 0.5 59.6
Total $ 82.6 $ 13.0 $ 95.6
The Company recorded an adjustment of $0.2 million and recognized $4.2 million of acquisition-related costs during the three months ended June 30, 2012and June 30, 2011 , respectively, and $0.9 million and $9.3 million of acquisition-related costs during the six months ended June 30, 2012 and June 30, 2011 ,respectively. These acquisition-related charges were expensed in the period incurred and reported in the Company's Condensed Consolidated Statements ofComprehensive Income within cost of revenues and operating expenses.
The goodwill recognized for the acquisitions completed during the six months ended June 30, 2012, was primarily attributable to expected synergies and wasnot deductible for U.S. federal income tax purposes.
7
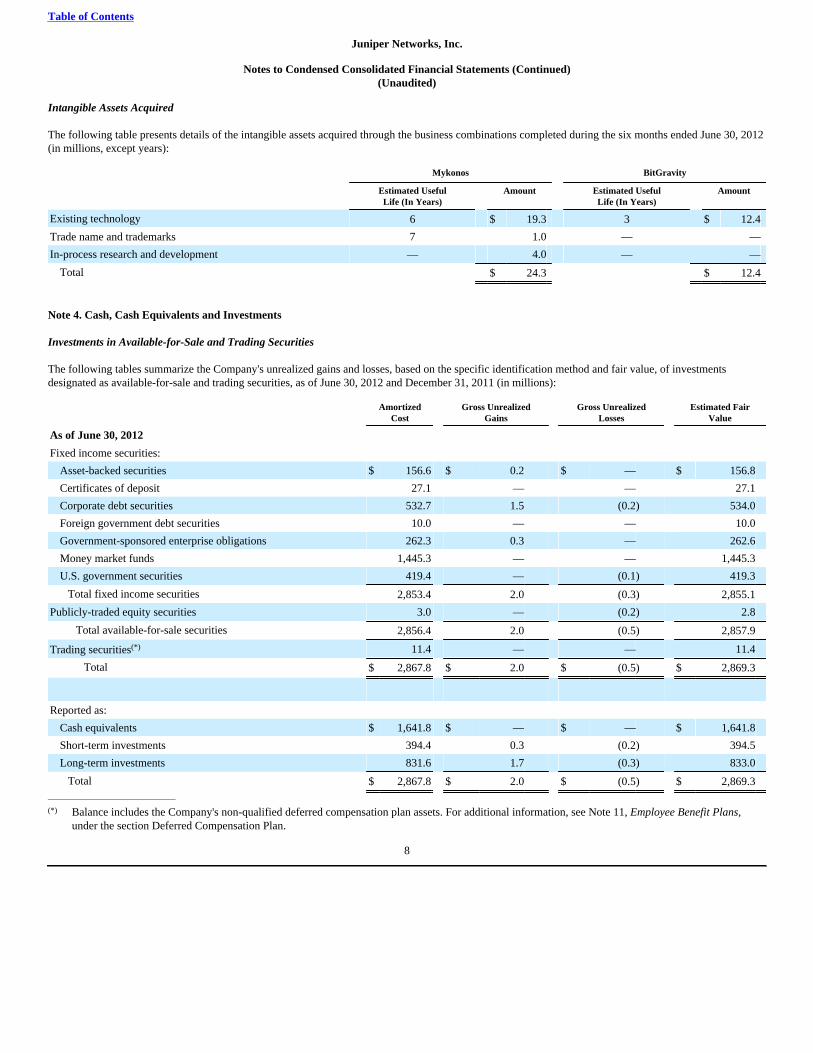
Table of Contents
Juniper Networks, Inc.
Notes to Condensed Consolidated Financial Statements (Continued)(Unaudited)
Intangible Assets Acquired
The following table presents details of the intangible assets acquired through the business combinations completed during the six months ended June 30, 2012(in millions, except years):
Mykonos BitGravity
Estimated UsefulLife (In Years)
Amount Estimated UsefulLife (In Years)
Amount
Existing technology 6 $ 19.3 3 $ 12.4
Trade name and trademarks 7 1.0 — —
In-process research and development — 4.0 — —
Total $ 24.3 $ 12.4
Note 4. Cash, Cash Equivalents and Investments
Investments in Available-for-Sale and Trading Securities
The following tables summarize the Company's unrealized gains and losses, based on the specific identification method and fair value, of investmentsdesignated as available-for-sale and trading securities, as of June 30, 2012 and December 31, 2011 (in millions):
AmortizedCost
Gross UnrealizedGains
Gross UnrealizedLosses
Estimated FairValue
As of June 30, 2012
Fixed income securities:
Asset-backed securities $ 156.6 $ 0.2 $ — $ 156.8
Certificates of deposit 27.1 — — 27.1
Corporate debt securities 532.7 1.5 (0.2) 534.0
Foreign government debt securities 10.0 — — 10.0
Government-sponsored enterprise obligations 262.3 0.3 — 262.6
Money market funds 1,445.3 — — 1,445.3
U.S. government securities 419.4 — (0.1) 419.3
Total fixed income securities 2,853.4 2.0 (0.3) 2,855.1
Publicly-traded equity securities 3.0 — (0.2) 2.8
Total available-for-sale securities 2,856.4 2.0 (0.5) 2,857.9
Trading securities(*) 11.4 — — 11.4
Total $ 2,867.8 $ 2.0 $ (0.5) $ 2,869.3
Reported as:
Cash equivalents $ 1,641.8 $ — $ — $ 1,641.8
Short-term investments 394.4 0.3 (0.2) 394.5
Long-term investments 831.6 1.7 (0.3) 833.0
Total $ 2,867.8 $ 2.0 $ (0.5) $ 2,869.3________________________________
(*) Balance includes the Company's non-qualified deferred compensation plan assets. For additional information, see Note 11, Employee Benefit Plans,under the section Deferred Compensation Plan.
8
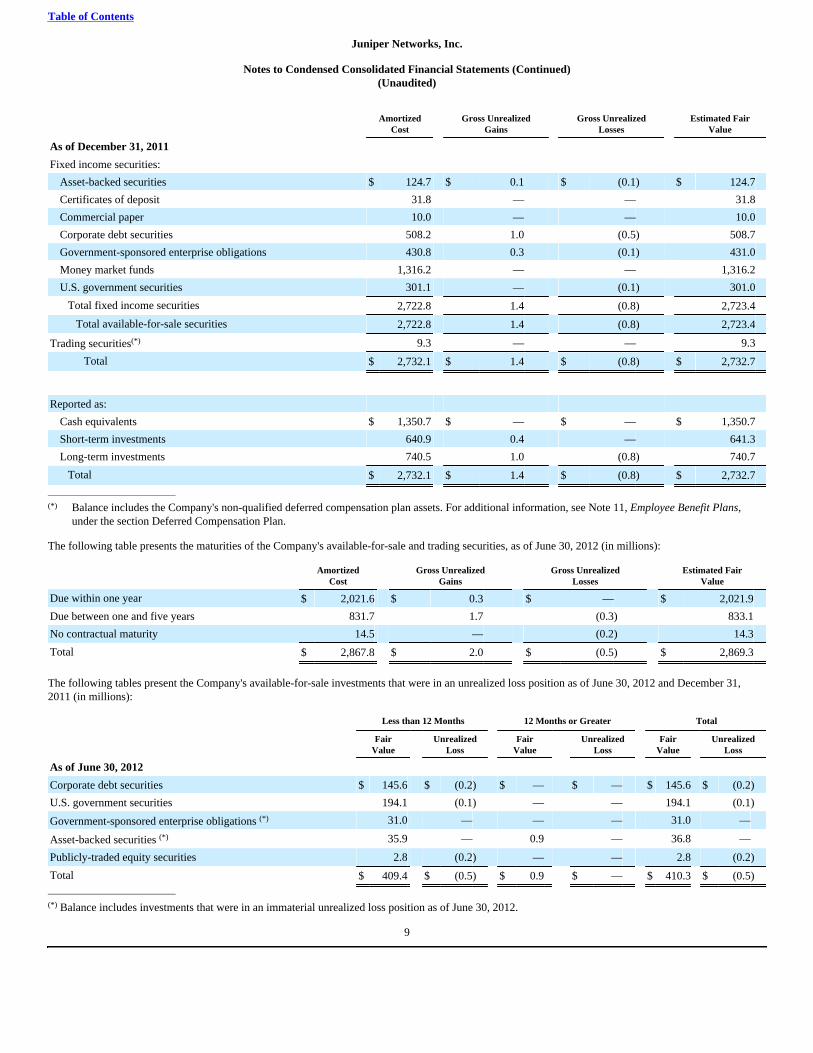
Table of Contents
Juniper Networks, Inc.
Notes to Condensed Consolidated Financial Statements (Continued)(Unaudited)
AmortizedCost
Gross UnrealizedGains
Gross UnrealizedLosses
Estimated FairValue
As of December 31, 2011
Fixed income securities:
Asset-backed securities $ 124.7 $ 0.1 $ (0.1) $ 124.7
Certificates of deposit 31.8 — — 31.8
Commercial paper 10.0 — — 10.0
Corporate debt securities 508.2 1.0 (0.5) 508.7
Government-sponsored enterprise obligations 430.8 0.3 (0.1) 431.0
Money market funds 1,316.2 — — 1,316.2
U.S. government securities 301.1 — (0.1) 301.0
Total fixed income securities 2,722.8 1.4 (0.8) 2,723.4
Total available-for-sale securities 2,722.8 1.4 (0.8) 2,723.4
Trading securities(*) 9.3 — — 9.3
Total $ 2,732.1 $ 1.4 $ (0.8) $ 2,732.7
Reported as:
Cash equivalents $ 1,350.7 $ — $ — $ 1,350.7
Short-term investments 640.9 0.4 — 641.3
Long-term investments 740.5 1.0 (0.8) 740.7
Total $ 2,732.1 $ 1.4 $ (0.8) $ 2,732.7
________________________________
(*) Balance includes the Company's non-qualified deferred compensation plan assets. For additional information, see Note 11, Employee Benefit Plans,under the section Deferred Compensation Plan.
The following table presents the maturities of the Company's available-for-sale and trading securities, as of June 30, 2012 (in millions):
AmortizedCost
Gross UnrealizedGains
Gross UnrealizedLosses
Estimated FairValue
Due within one year $ 2,021.6 $ 0.3 $ — $ 2,021.9
Due between one and five years 831.7 1.7 (0.3) 833.1
No contractual maturity 14.5 — (0.2) 14.3
Total $ 2,867.8 $ 2.0 $ (0.5) $ 2,869.3
The following tables present the Company's available-for-sale investments that were in an unrealized loss position as of June 30, 2012 and December 31,2011 (in millions):
Less than 12 Months 12 Months or Greater Total
FairValue
UnrealizedLoss
FairValue
UnrealizedLoss
FairValue
UnrealizedLoss
As of June 30, 2012
Corporate debt securities $ 145.6 $ (0.2) $ — $ — $ 145.6 $ (0.2)
U.S. government securities 194.1 (0.1) — — 194.1 (0.1)
Government-sponsored enterprise obligations (*) 31.0 — — — 31.0 —
Asset-backed securities (*) 35.9 — 0.9 — 36.8 —
Publicly-traded equity securities 2.8 (0.2) — — 2.8 (0.2)
Total $ 409.4 $ (0.5) $ 0.9 $ — $ 410.3 $ (0.5)________________________________
(*) Balance includes investments that were in an immaterial unrealized loss position as of June 30, 2012.
9
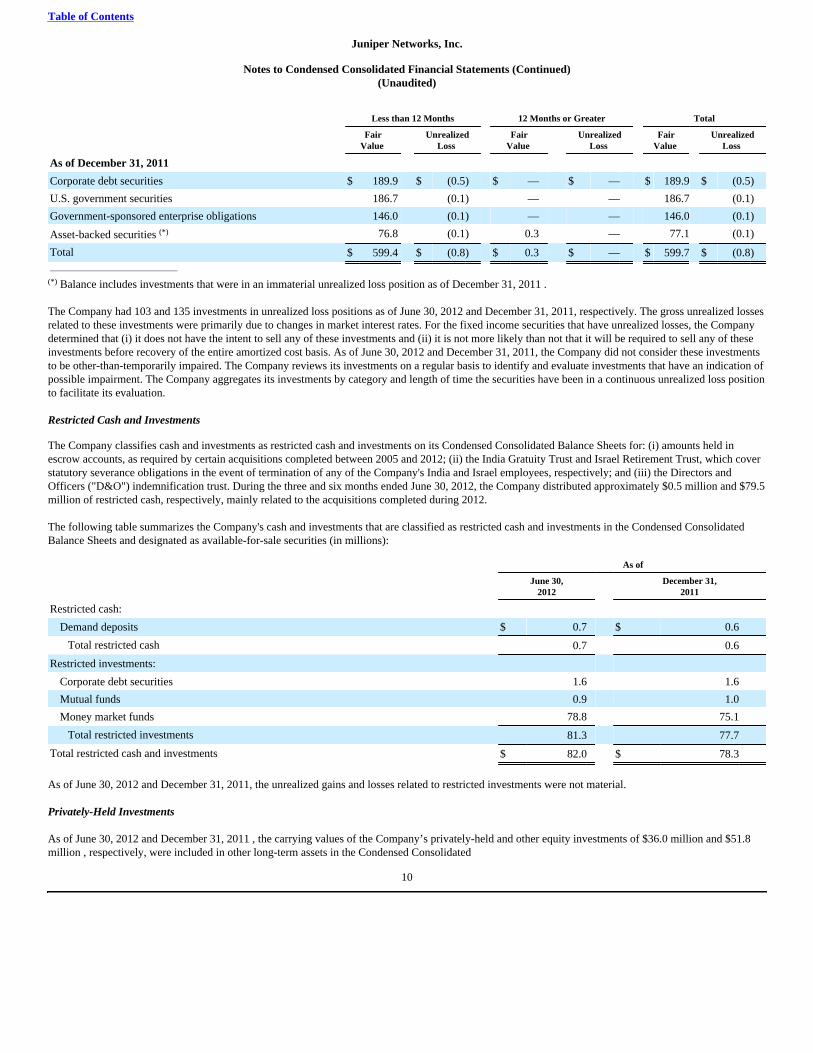
Table of Contents
Juniper Networks, Inc.
Notes to Condensed Consolidated Financial Statements (Continued)(Unaudited)
Less than 12 Months 12 Months or Greater Total
FairValue
UnrealizedLoss
FairValue
UnrealizedLoss
FairValue
UnrealizedLoss
As of December 31, 2011
Corporate debt securities $ 189.9 $ (0.5) $ — $ — $ 189.9 $ (0.5)
U.S. government securities 186.7 (0.1) — — 186.7 (0.1)
Government-sponsored enterprise obligations 146.0 (0.1) — — 146.0 (0.1)
Asset-backed securities (*) 76.8 (0.1) 0.3 — 77.1 (0.1)
Total $ 599.4 $ (0.8) $ 0.3 $ — $ 599.7 $ (0.8) ________________________________
(*) Balance includes investments that were in an immaterial unrealized loss position as of December 31, 2011 .
The Company had 103 and 135 investments in unrealized loss positions as of June 30, 2012 and December 31, 2011, respectively. The gross unrealized lossesrelated to these investments were primarily due to changes in market interest rates. For the fixed income securities that have unrealized losses, the Companydetermined that (i) it does not have the intent to sell any of these investments and (ii) it is not more likely than not that it will be required to sell any of theseinvestments before recovery of the entire amortized cost basis. As of June 30, 2012 and December 31, 2011, the Company did not consider these investmentsto be other-than-temporarily impaired. The Company reviews its investments on a regular basis to identify and evaluate investments that have an indication ofpossible impairment. The Company aggregates its investments by category and length of time the securities have been in a continuous unrealized loss positionto facilitate its evaluation.
Restricted Cash and Investments
The Company classifies cash and investments as restricted cash and investments on its Condensed Consolidated Balance Sheets for: (i) amounts held inescrow accounts, as required by certain acquisitions completed between 2005 and 2012; (ii) the India Gratuity Trust and Israel Retirement Trust, which coverstatutory severance obligations in the event of termination of any of the Company's India and Israel employees, respectively; and (iii) the Directors andOfficers ("D&O") indemnification trust. During the three and six months ended June 30, 2012, the Company distributed approximately $0.5 million and $79.5million of restricted cash, respectively, mainly related to the acquisitions completed during 2012.
The following table summarizes the Company's cash and investments that are classified as restricted cash and investments in the Condensed ConsolidatedBalance Sheets and designated as available-for-sale securities (in millions):
As of
June 30,2012
December 31,2011
Restricted cash:
Demand deposits $ 0.7 $ 0.6
Total restricted cash 0.7 0.6
Restricted investments:
Corporate debt securities 1.6 1.6
Mutual funds 0.9 1.0
Money market funds 78.8 75.1
Total restricted investments 81.3 77.7
Total restricted cash and investments $ 82.0 $ 78.3
As of June 30, 2012 and December 31, 2011, the unrealized gains and losses related to restricted investments were not material.
Privately-Held Investments
As of June 30, 2012 and December 31, 2011 , the carrying values of the Company’s privately-held and other equity investments of $36.0 million and $51.8million , respectively, were included in other long-term assets in the Condensed Consolidated
10
Table of Contents
Juniper Networks, Inc.
Notes to Condensed Consolidated Financial Statements (Continued)(Unaudited)
Balance Sheets. During the three and six months ended June 30, 2012, the Company invested $5.0 million and $6.1 million, respectively, in privately-heldinvestments. During the three and six months ended June 30, 2011, the Company invested $2.9 million and $8.9 million, respectively, in privately-held andother equity investments.
During the three and six months ended June 30, 2012, the Company recognized a net gain of $14.8 million and $0.8 million, respectively, related to theCompany's privately-held investments. There were no gains or losses from the Company's privately-held and other equity investments during the three andsix months ended June 30, 2011.
Note 5. Fair Value Measurements
Assets and Liabilities Measured at Fair Value on a Recurring Basis
The following tables provide a summary of assets and liabilities measured at fair value on a recurring basis and as reported in the Condensed ConsolidatedBalance Sheets (in millions):
Fair Value Measurements at June 30, 2012 Using:
Quoted Prices inActive Markets For
Identical Assets
Significant OtherObservable
Remaining Inputs
Significant OtherUnobservable
Remaining Inputs
(Level 1) (Level 2) (Level 3) Total
Assets measured at fair value:
Available-for-sale debt securities:
Asset-backed securities $ — $ 156.8 $ — $ 156.8
Certificate of deposit — 27.1 — 27.1
Corporate debt securities (1) — 535.6 — 535.6
Foreign government debt securities — 10.0 — 10.0
Government-sponsored enterprise obligations 262.6 — — 262.6
Money market funds (2) 1,524.1 — — 1,524.1
Mutual funds (3) 0.9 — — 0.9
U.S. government securities 206.3 213.0 — 419.3
Total available-for-sale debt securities 1,993.9 942.5 — 2,936.4
Available-for-sale equity securities:
Publicly-traded equity securities 2.8 — — 2.8
Total available-for-sale securities 1,996.7 942.5 — 2,939.2
Trading securities:
Mutual funds (4) 11.4 — — 11.4
Derivative assets:
Foreign exchange contracts — 0.4 — 0.4
Total assets measured at fair value $ 2,008.1 $ 942.9 $ — $ 2,951.0
Liabilities measured at fair value:
Derivative liabilities:
Foreign exchange contracts $ — $ 4.0 $ — $ 4.0
Total liabilities measured at fair value $ — $ 4.0 $ — $ 4.0________________________________
(1) Balance includes $1.6 million of restricted investments measured at fair market value, related to the Company's India Gratuity Trust.(2) Balance includes $78.8 million of restricted investments measured at fair market value, related to the Company's D&O trust and acquisitions related
escrows.(3) Balance relates to the restricted investments measured at fair market value of the Company's India Gratuity Trust.(4) Balance relates to investments measured at fair value related to the Company's non-qualified deferred compensation plan assets.
11
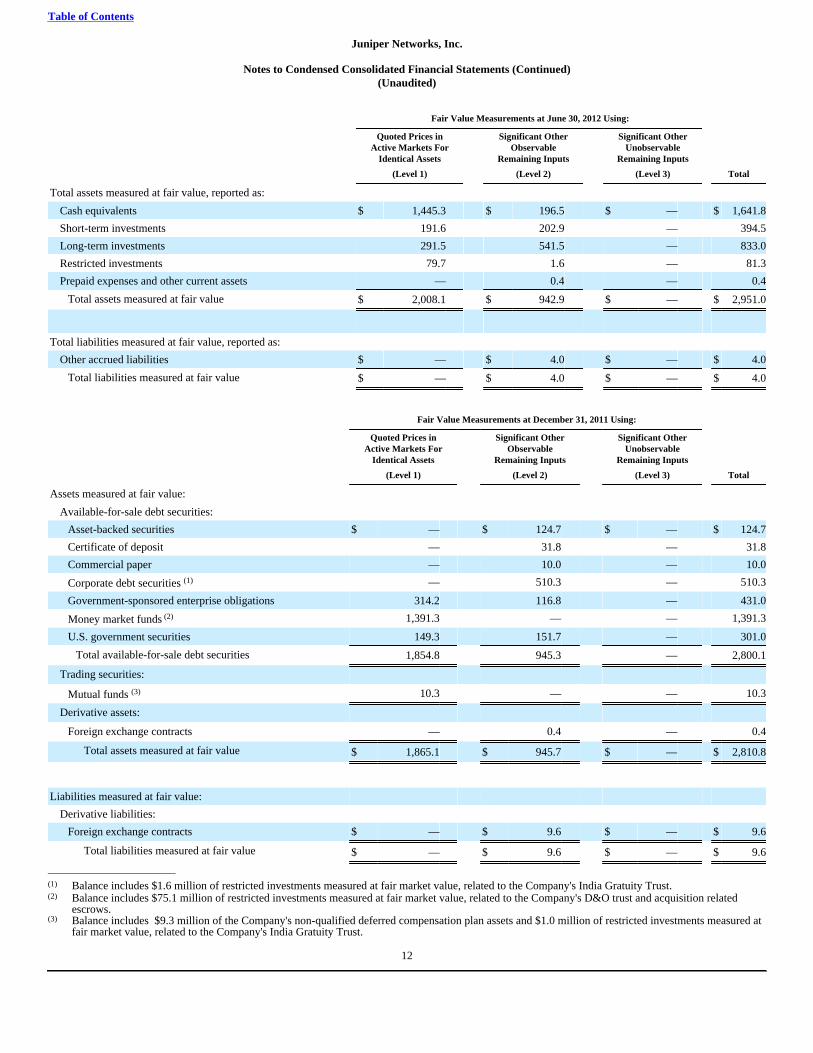
Table of Contents
Juniper Networks, Inc.
Notes to Condensed Consolidated Financial Statements (Continued)(Unaudited)
Fair Value Measurements at June 30, 2012 Using:
Quoted Prices inActive Markets For
Identical Assets
Significant OtherObservable
Remaining Inputs
Significant OtherUnobservable
Remaining Inputs
(Level 1) (Level 2) (Level 3) Total
Total assets measured at fair value, reported as:
Cash equivalents $ 1,445.3 $ 196.5 $ — $ 1,641.8
Short-term investments 191.6 202.9 — 394.5
Long-term investments 291.5 541.5 — 833.0
Restricted investments 79.7 1.6 — 81.3
Prepaid expenses and other current assets — 0.4 — 0.4
Total assets measured at fair value $ 2,008.1 $ 942.9 $ — $ 2,951.0
Total liabilities measured at fair value, reported as:
Other accrued liabilities $ — $ 4.0 $ — $ 4.0
Total liabilities measured at fair value $ — $ 4.0 $ — $ 4.0
Fair Value Measurements at December 31, 2011 Using:
Quoted Prices inActive Markets For
Identical Assets
Significant OtherObservable
Remaining Inputs
Significant OtherUnobservable
Remaining Inputs
(Level 1) (Level 2) (Level 3) Total
Assets measured at fair value:
Available-for-sale debt securities:
Asset-backed securities $ — $ 124.7 $ — $ 124.7
Certificate of deposit — 31.8 — 31.8
Commercial paper — 10.0 — 10.0
Corporate debt securities (1) — 510.3 — 510.3
Government-sponsored enterprise obligations 314.2 116.8 — 431.0
Money market funds (2) 1,391.3 — — 1,391.3
U.S. government securities 149.3 151.7 — 301.0
Total available-for-sale debt securities 1,854.8 945.3 — 2,800.1
Trading securities:
Mutual funds (3) 10.3 — — 10.3
Derivative assets:
Foreign exchange contracts — 0.4 — 0.4
Total assets measured at fair value $ 1,865.1 $ 945.7 $ — $ 2,810.8
Liabilities measured at fair value:
Derivative liabilities:
Foreign exchange contracts $ — $ 9.6 $ — $ 9.6
Total liabilities measured at fair value $ — $ 9.6 $ — $ 9.6
________________________________
(1) Balance includes $1.6 million of restricted investments measured at fair market value, related to the Company's India Gratuity Trust.(2) Balance includes $75.1 million of restricted investments measured at fair market value, related to the Company's D&O trust and acquisition related
escrows.(3) Balance includes $9.3 million of the Company's non-qualified deferred compensation plan assets and $1.0 million of restricted investments measured at
fair market value, related to the Company's India Gratuity Trust.
12
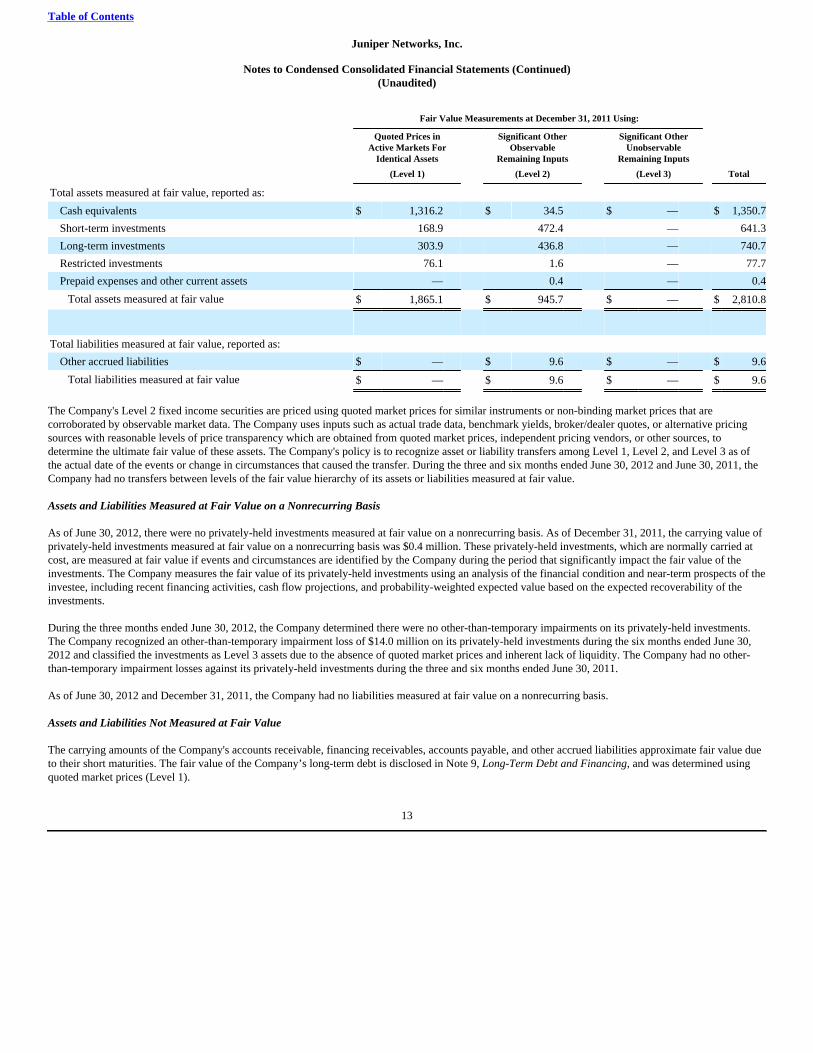
Table of Contents
Juniper Networks, Inc.
Notes to Condensed Consolidated Financial Statements (Continued)(Unaudited)
Fair Value Measurements at December 31, 2011 Using:
Quoted Prices inActive Markets For
Identical Assets
Significant OtherObservable
Remaining Inputs
Significant OtherUnobservable
Remaining Inputs
(Level 1) (Level 2) (Level 3) Total
Total assets measured at fair value, reported as:
Cash equivalents $ 1,316.2 $ 34.5 $ — $ 1,350.7
Short-term investments 168.9 472.4 — 641.3
Long-term investments 303.9 436.8 — 740.7
Restricted investments 76.1 1.6 — 77.7
Prepaid expenses and other current assets — 0.4 — 0.4
Total assets measured at fair value $ 1,865.1 $ 945.7 $ — $ 2,810.8
Total liabilities measured at fair value, reported as:
Other accrued liabilities $ — $ 9.6 $ — $ 9.6
Total liabilities measured at fair value $ — $ 9.6 $ — $ 9.6
The Company's Level 2 fixed income securities are priced using quoted market prices for similar instruments or non-binding market prices that arecorroborated by observable market data. The Company uses inputs such as actual trade data, benchmark yields, broker/dealer quotes, or alternative pricingsources with reasonable levels of price transparency which are obtained from quoted market prices, independent pricing vendors, or other sources, todetermine the ultimate fair value of these assets. The Company's policy is to recognize asset or liability transfers among Level 1, Level 2, and Level 3 as ofthe actual date of the events or change in circumstances that caused the transfer. During the three and six months ended June 30, 2012 and June 30, 2011, theCompany had no transfers between levels of the fair value hierarchy of its assets or liabilities measured at fair value.
Assets and Liabilities Measured at Fair Value on a Nonrecurring Basis
As of June 30, 2012, there were no privately-held investments measured at fair value on a nonrecurring basis. As of December 31, 2011, the carrying value ofprivately-held investments measured at fair value on a nonrecurring basis was $0.4 million. These privately-held investments, which are normally carried atcost, are measured at fair value if events and circumstances are identified by the Company during the period that significantly impact the fair value of theinvestments. The Company measures the fair value of its privately-held investments using an analysis of the financial condition and near-term prospects of theinvestee, including recent financing activities, cash flow projections, and probability-weighted expected value based on the expected recoverability of theinvestments.
During the three months ended June 30, 2012, the Company determined there were no other-than-temporary impairments on its privately-held investments.The Company recognized an other-than-temporary impairment loss of $14.0 million on its privately-held investments during the six months ended June 30,2012 and classified the investments as Level 3 assets due to the absence of quoted market prices and inherent lack of liquidity. The Company had no other-than-temporary impairment losses against its privately-held investments during the three and six months ended June 30, 2011.
As of June 30, 2012 and December 31, 2011, the Company had no liabilities measured at fair value on a nonrecurring basis.
Assets and Liabilities Not Measured at Fair Value
The carrying amounts of the Company's accounts receivable, financing receivables, accounts payable, and other accrued liabilities approximate fair value dueto their short maturities. The fair value of the Company’s long-term debt is disclosed in Note 9, Long-Term Debt and Financing, and was determined usingquoted market prices (Level 1).
13
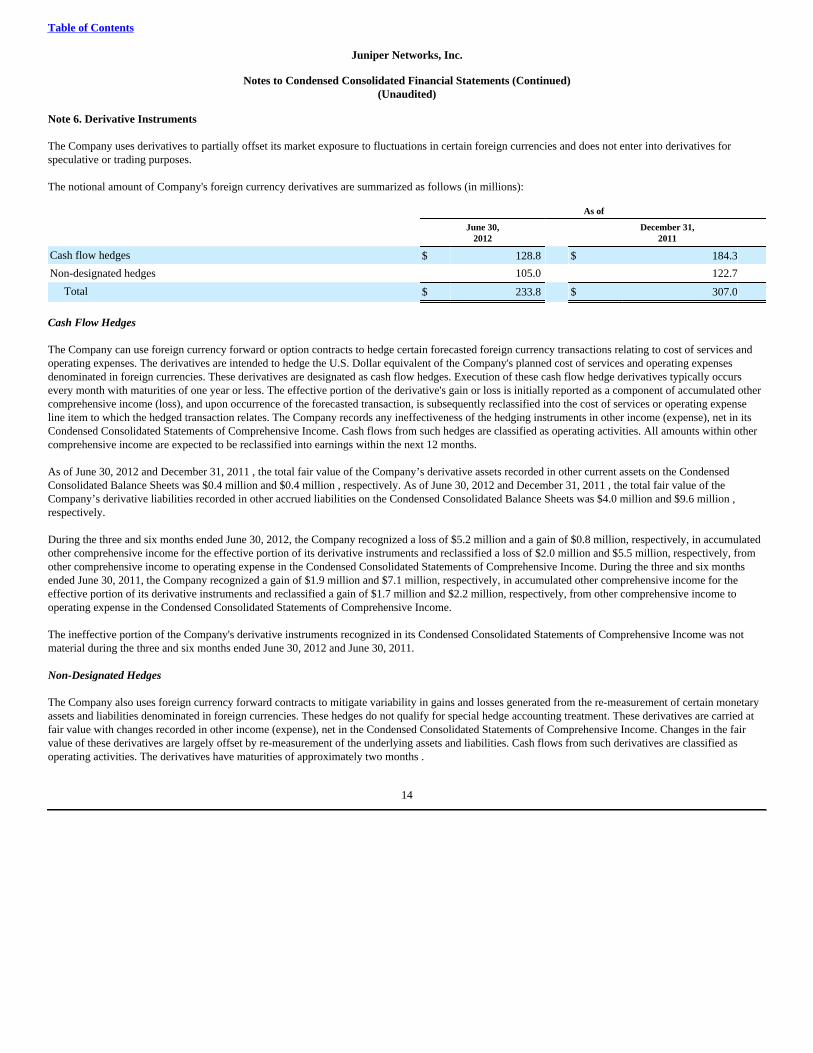
Table of Contents
Juniper Networks, Inc.
Notes to Condensed Consolidated Financial Statements (Continued)(Unaudited)
Note 6. Derivative Instruments
The Company uses derivatives to partially offset its market exposure to fluctuations in certain foreign currencies and does not enter into derivatives forspeculative or trading purposes.
The notional amount of Company's foreign currency derivatives are summarized as follows (in millions):
As of
June 30,2012
December 31,2011
Cash flow hedges $ 128.8 $ 184.3
Non-designated hedges 105.0 122.7
Total $ 233.8 $ 307.0
Cash Flow Hedges
The Company can use foreign currency forward or option contracts to hedge certain forecasted foreign currency transactions relating to cost of services andoperating expenses. The derivatives are intended to hedge the U.S. Dollar equivalent of the Company's planned cost of services and operating expensesdenominated in foreign currencies. These derivatives are designated as cash flow hedges. Execution of these cash flow hedge derivatives typically occursevery month with maturities of one year or less. The effective portion of the derivative's gain or loss is initially reported as a component of accumulated othercomprehensive income (loss), and upon occurrence of the forecasted transaction, is subsequently reclassified into the cost of services or operating expenseline item to which the hedged transaction relates. The Company records any ineffectiveness of the hedging instruments in other income (expense), net in itsCondensed Consolidated Statements of Comprehensive Income. Cash flows from such hedges are classified as operating activities. All amounts within othercomprehensive income are expected to be reclassified into earnings within the next 12 months.
As of June 30, 2012 and December 31, 2011 , the total fair value of the Company’s derivative assets recorded in other current assets on the CondensedConsolidated Balance Sheets was $0.4 million and $0.4 million , respectively. As of June 30, 2012 and December 31, 2011 , the total fair value of theCompany’s derivative liabilities recorded in other accrued liabilities on the Condensed Consolidated Balance Sheets was $4.0 million and $9.6 million ,respectively.
During the three and six months ended June 30, 2012, the Company recognized a loss of $5.2 million and a gain of $0.8 million, respectively, in accumulatedother comprehensive income for the effective portion of its derivative instruments and reclassified a loss of $2.0 million and $5.5 million, respectively, fromother comprehensive income to operating expense in the Condensed Consolidated Statements of Comprehensive Income. During the three and six monthsended June 30, 2011, the Company recognized a gain of $1.9 million and $7.1 million, respectively, in accumulated other comprehensive income for theeffective portion of its derivative instruments and reclassified a gain of $1.7 million and $2.2 million, respectively, from other comprehensive income tooperating expense in the Condensed Consolidated Statements of Comprehensive Income.
The ineffective portion of the Company's derivative instruments recognized in its Condensed Consolidated Statements of Comprehensive Income was notmaterial during the three and six months ended June 30, 2012 and June 30, 2011.
Non-Designated Hedges
The Company also uses foreign currency forward contracts to mitigate variability in gains and losses generated from the re-measurement of certain monetaryassets and liabilities denominated in foreign currencies. These hedges do not qualify for special hedge accounting treatment. These derivatives are carried atfair value with changes recorded in other income (expense), net in the Condensed Consolidated Statements of Comprehensive Income. Changes in the fairvalue of these derivatives are largely offset by re-measurement of the underlying assets and liabilities. Cash flows from such derivatives are classified asoperating activities. The derivatives have maturities of approximately two months .
14
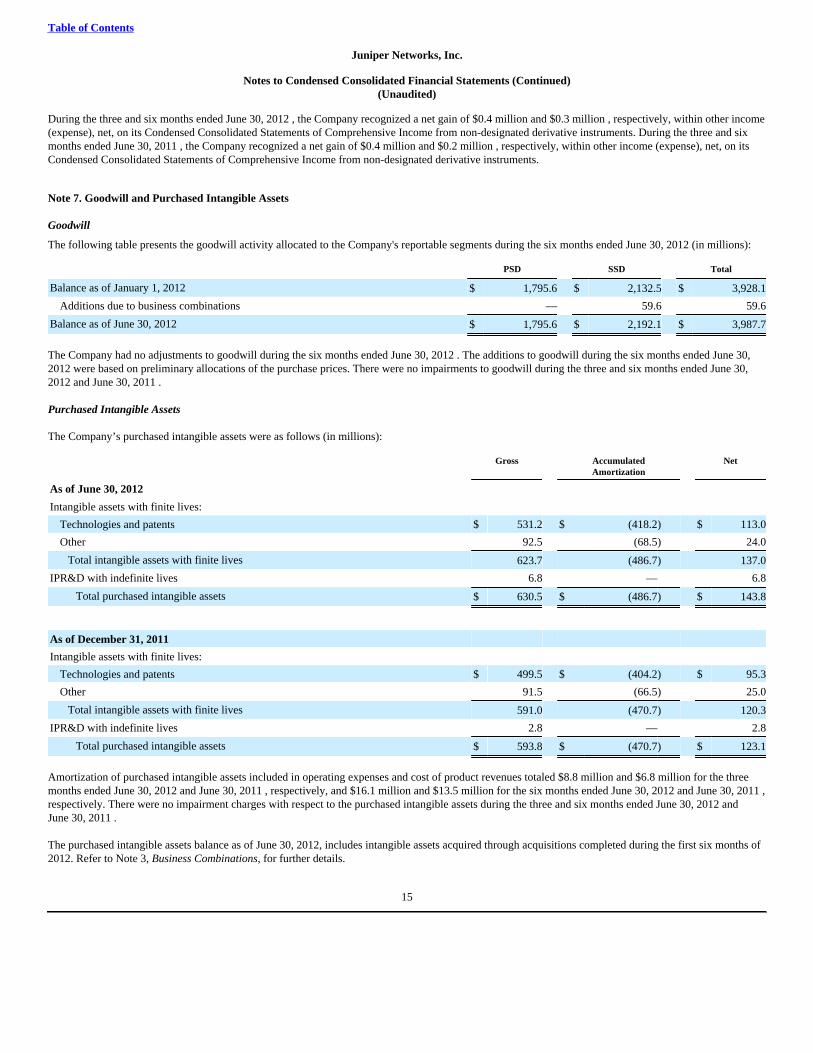
Table of Contents
Juniper Networks, Inc.
Notes to Condensed Consolidated Financial Statements (Continued)(Unaudited)
During the three and six months ended June 30, 2012 , the Company recognized a net gain of $0.4 million and $0.3 million , respectively, within other income(expense), net, on its Condensed Consolidated Statements of Comprehensive Income from non-designated derivative instruments. During the three and sixmonths ended June 30, 2011 , the Company recognized a net gain of $0.4 million and $0.2 million , respectively, within other income (expense), net, on itsCondensed Consolidated Statements of Comprehensive Income from non-designated derivative instruments.
Note 7. Goodwill and Purchased Intangible Assets
Goodwill
The following table presents the goodwill activity allocated to the Company's reportable segments during the six months ended June 30, 2012 (in millions):
PSD SSD Total
Balance as of January 1, 2012 $ 1,795.6 $ 2,132.5 $ 3,928.1
Additions due to business combinations — 59.6 59.6
Balance as of June 30, 2012 $ 1,795.6 $ 2,192.1 $ 3,987.7
The Company had no adjustments to goodwill during the six months ended June 30, 2012 . The additions to goodwill during the six months ended June 30,2012 were based on preliminary allocations of the purchase prices. There were no impairments to goodwill during the three and six months ended June 30,2012 and June 30, 2011 . Purchased Intangible Assets
The Company’s purchased intangible assets were as follows (in millions):
Gross AccumulatedAmortization
Net
As of June 30, 2012
Intangible assets with finite lives:
Technologies and patents $ 531.2 $ (418.2) $ 113.0
Other 92.5 (68.5) 24.0
Total intangible assets with finite lives 623.7 (486.7) 137.0
IPR&D with indefinite lives 6.8 — 6.8
Total purchased intangible assets $ 630.5 $ (486.7) $ 143.8
As of December 31, 2011
Intangible assets with finite lives:
Technologies and patents $ 499.5 $ (404.2) $ 95.3
Other 91.5 (66.5) 25.0
Total intangible assets with finite lives 591.0 (470.7) 120.3
IPR&D with indefinite lives 2.8 — 2.8
Total purchased intangible assets $ 593.8 $ (470.7) $ 123.1
Amortization of purchased intangible assets included in operating expenses and cost of product revenues totaled $8.8 million and $6.8 million for the threemonths ended June 30, 2012 and June 30, 2011 , respectively, and $16.1 million and $13.5 million for the six months ended June 30, 2012 and June 30, 2011 ,respectively. There were no impairment charges with respect to the purchased intangible assets during the three and six months ended June 30, 2012 andJune 30, 2011 .
The purchased intangible assets balance as of June 30, 2012, includes intangible assets acquired through acquisitions completed during the first six months of2012. Refer to Note 3, Business Combinations, for further details.
15
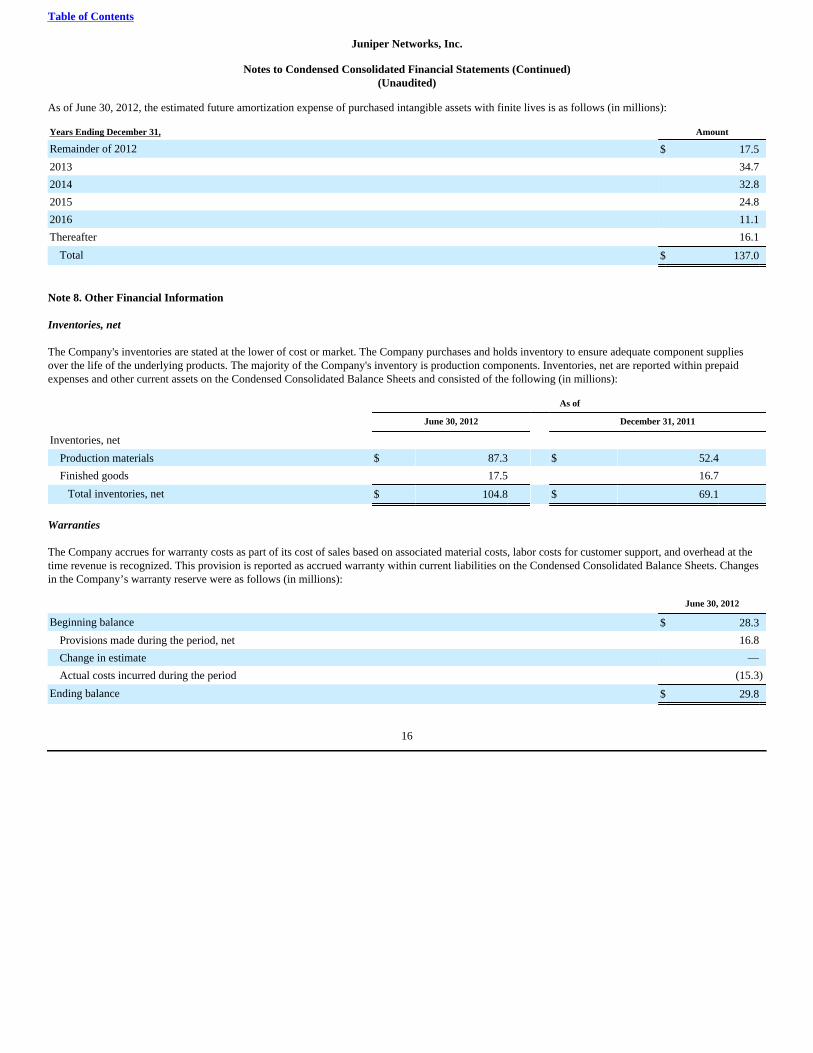
Table of Contents
Juniper Networks, Inc.
Notes to Condensed Consolidated Financial Statements (Continued)(Unaudited)
As of June 30, 2012, the estimated future amortization expense of purchased intangible assets with finite lives is as follows (in millions):
Years Ending December 31, Amount
Remainder of 2012 $ 17.5
2013 34.7
2014 32.8
2015 24.8
2016 11.1
Thereafter 16.1
Total $ 137.0
Note 8. Other Financial Information
Inventories, net
The Company's inventories are stated at the lower of cost or market. The Company purchases and holds inventory to ensure adequate component suppliesover the life of the underlying products. The majority of the Company's inventory is production components. Inventories, net are reported within prepaidexpenses and other current assets on the Condensed Consolidated Balance Sheets and consisted of the following (in millions):
As of
June 30, 2012 December 31, 2011
Inventories, net
Production materials $ 87.3 $ 52.4
Finished goods 17.5 16.7
Total inventories, net $ 104.8 $ 69.1
Warranties
The Company accrues for warranty costs as part of its cost of sales based on associated material costs, labor costs for customer support, and overhead at thetime revenue is recognized. This provision is reported as accrued warranty within current liabilities on the Condensed Consolidated Balance Sheets. Changesin the Company’s warranty reserve were as follows (in millions):
June 30, 2012
Beginning balance $ 28.3
Provisions made during the period, net 16.8
Change in estimate —
Actual costs incurred during the period (15.3)
Ending balance $ 29.8
16
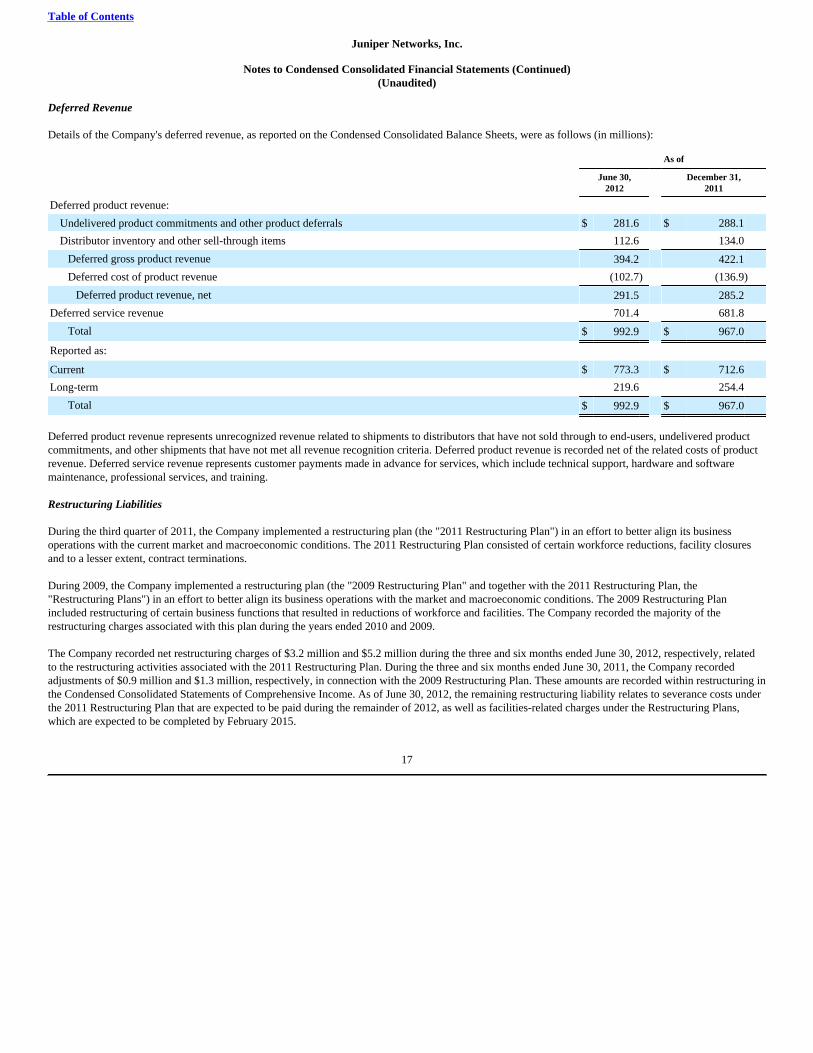
Table of Contents
Juniper Networks, Inc.
Notes to Condensed Consolidated Financial Statements (Continued)(Unaudited)
Deferred Revenue
Details of the Company's deferred revenue, as reported on the Condensed Consolidated Balance Sheets, were as follows (in millions):
As of
June 30,2012
December 31,2011
Deferred product revenue:
Undelivered product commitments and other product deferrals $ 281.6 $ 288.1
Distributor inventory and other sell-through items 112.6 134.0
Deferred gross product revenue 394.2 422.1
Deferred cost of product revenue (102.7) (136.9)
Deferred product revenue, net 291.5 285.2
Deferred service revenue 701.4 681.8
Total $ 992.9 $ 967.0
Reported as:
Current $ 773.3 $ 712.6
Long-term 219.6 254.4
Total $ 992.9 $ 967.0
Deferred product revenue represents unrecognized revenue related to shipments to distributors that have not sold through to end-users, undelivered productcommitments, and other shipments that have not met all revenue recognition criteria. Deferred product revenue is recorded net of the related costs of productrevenue. Deferred service revenue represents customer payments made in advance for services, which include technical support, hardware and softwaremaintenance, professional services, and training.
Restructuring Liabilities
During the third quarter of 2011, the Company implemented a restructuring plan (the "2011 Restructuring Plan") in an effort to better align its businessoperations with the current market and macroeconomic conditions. The 2011 Restructuring Plan consisted of certain workforce reductions, facility closuresand to a lesser extent, contract terminations.
During 2009, the Company implemented a restructuring plan (the "2009 Restructuring Plan" and together with the 2011 Restructuring Plan, the"Restructuring Plans") in an effort to better align its business operations with the market and macroeconomic conditions. The 2009 Restructuring Planincluded restructuring of certain business functions that resulted in reductions of workforce and facilities. The Company recorded the majority of therestructuring charges associated with this plan during the years ended 2010 and 2009.
The Company recorded net restructuring charges of $3.2 million and $5.2 million during the three and six months ended June 30, 2012, respectively, relatedto the restructuring activities associated with the 2011 Restructuring Plan. During the three and six months ended June 30, 2011, the Company recordedadjustments of $0.9 million and $1.3 million, respectively, in connection with the 2009 Restructuring Plan. These amounts are recorded within restructuring inthe Condensed Consolidated Statements of Comprehensive Income. As of June 30, 2012, the remaining restructuring liability relates to severance costs underthe 2011 Restructuring Plan that are expected to be paid during the remainder of 2012, as well as facilities-related charges under the Restructuring Plans,which are expected to be completed by February 2015.
17
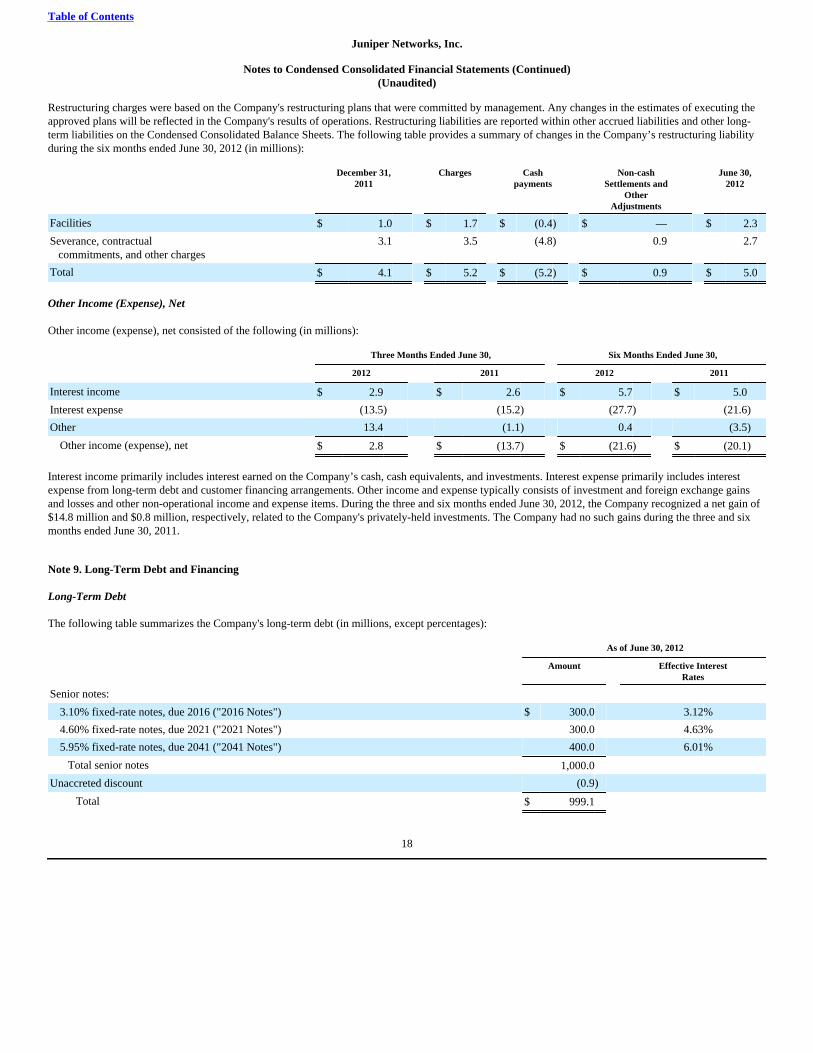
Table of Contents
Juniper Networks, Inc.
Notes to Condensed Consolidated Financial Statements (Continued)(Unaudited)
Restructuring charges were based on the Company's restructuring plans that were committed by management. Any changes in the estimates of executing theapproved plans will be reflected in the Company's results of operations. Restructuring liabilities are reported within other accrued liabilities and other long-term liabilities on the Condensed Consolidated Balance Sheets. The following table provides a summary of changes in the Company’s restructuring liabilityduring the six months ended June 30, 2012 (in millions):
December 31,2011
Charges Cashpayments
Non-cashSettlements and
OtherAdjustments
June 30,2012
Facilities $ 1.0 $ 1.7 $ (0.4) $ — $ 2.3
Severance, contractual commitments, and other charges
3.1 3.5 (4.8) 0.9 2.7
Total $ 4.1 $ 5.2 $ (5.2) $ 0.9 $ 5.0
Other Income (Expense), Net
Other income (expense), net consisted of the following (in millions):
Three Months Ended June 30, Six Months Ended June 30,
2012 2011 2012 2011
Interest income $ 2.9 $ 2.6 $ 5.7 $ 5.0
Interest expense (13.5) (15.2) (27.7) (21.6)
Other 13.4 (1.1) 0.4 (3.5)
Other income (expense), net $ 2.8 $ (13.7) $ (21.6) $ (20.1)
Interest income primarily includes interest earned on the Company’s cash, cash equivalents, and investments. Interest expense primarily includes interestexpense from long-term debt and customer financing arrangements. Other income and expense typically consists of investment and foreign exchange gainsand losses and other non-operational income and expense items. During the three and six months ended June 30, 2012, the Company recognized a net gain of$14.8 million and $0.8 million, respectively, related to the Company's privately-held investments. The Company had no such gains during the three and sixmonths ended June 30, 2011.
Note 9. Long-Term Debt and Financing
Long-Term Debt
The following table summarizes the Company's long-term debt (in millions, except percentages):
As of June 30, 2012
Amount Effective InterestRates
Senior notes:
3.10% fixed-rate notes, due 2016 ("2016 Notes") $ 300.0 3.12%
4.60% fixed-rate notes, due 2021 ("2021 Notes") 300.0 4.63%
5.95% fixed-rate notes, due 2041 ("2041 Notes") 400.0 6.01%
Total senior notes 1,000.0
Unaccreted discount (0.9)
Total $ 999.1
18
Table of Contents
Juniper Networks, Inc.
Notes to Condensed Consolidated Financial Statements (Continued)(Unaudited)
The effective interest rates for the 2016 Notes, 2021 Notes, and 2041 Notes (collectively the “Notes”) include the interest on the Notes, accretion of thediscount, and amortization of issuance costs. At June 30, 2012 and December 31, 2011, the estimated fair value of the Notes included in long-term debt wasapproximately $1,097.3 million and $1,069.8 million, respectively, based on quoted market prices (Level 1). Customer Financing Arrangements
The Company has customer financing arrangements to sell its accounts receivable to a major third-party financing provider. The program does not and is notintended to affect the timing of revenue recognition because the Company only recognizes revenue upon sell-through. Under the financing arrangements,proceeds from the financing provider are due to the Company 30 days from the sale of the receivable. In these transactions with the financing provider, theCompany surrendered control over the transferred assets. The accounts receivable were isolated from the Company and put beyond the reach of creditors,even in the event of bankruptcy. The Company does not maintain effective control over the transferred assets through obligations or rights to redeem, transfer,or repurchase the receivables after they have been transferred.
Pursuant to the financing arrangements for the sale of receivables, the Company sold net receivables of $162.6 million and $224.2 million during the threemonths ended June 30, 2012 and June 30, 2011, respectively, and $283.2 million and $399.0 million during the six months ended June 30, 2012 and June 30,2011, respectively.
The Company received cash proceeds from the financing provider of $147.3 million and $207.6 million during the three months ended June 30, 2012 andJune 30, 2011 , respectively, and $325.8 million and $401.9 million during the six months ended June 30, 2012 and June 30, 2011 , respectively. As ofJune 30, 2012 and December 31, 2011 , the amounts owed by the financing provider were $114.0 million and $162.9 million , respectively, and were recordedin accounts receivable on the Company’s Condensed Consolidated Balance Sheets.
The portion of the receivable financed that has not been recognized as revenue is accounted for as a financing arrangement and is included in other accruedliabilities and other long-term liabilities in the Condensed Consolidated Balance Sheets. As of June 30, 2012 and December 31, 2011, the estimated cashreceived from the financing provider not recognized as revenue from distributors was $41.3 million and $33.3 million, respectively.
Note 10. Equity
Stock Repurchase Activities
In June 2012, the Company’s Board of Directors (the “Board”) approved a stock repurchase program (the "2012 Stock Repurchase Program"), whichauthorized the Company to repurchase up to $1.0 billion of its common stock. This authorization was in addition to the $1.0 billion approved by the Board inFebruary 2010 (the "2010 Stock Repurchase Program").
The Company repurchased and retired approximately 5.0 million and 7.4 million shares of its common stock at an average price of $18.76 and $19.72 pershare for an aggregate purchase price of $94.0 million and $145.6 million during the three and six months ended June 30, 2012, respectively, under its stockrepurchase programs. The Company repurchased and retired approximately 3.9 million and 8.6 million shares of its common stock at an average price of$38.94 and $40.71 per share for an aggregate purchase price of $150.0 million and $350.2 million during the three and six months ended June 30, 2011,respectively, under its stock repurchase programs. As of June 30, 2012, there was $1.1 billion authorized funds remaining under its stock repurchaseprograms.
19
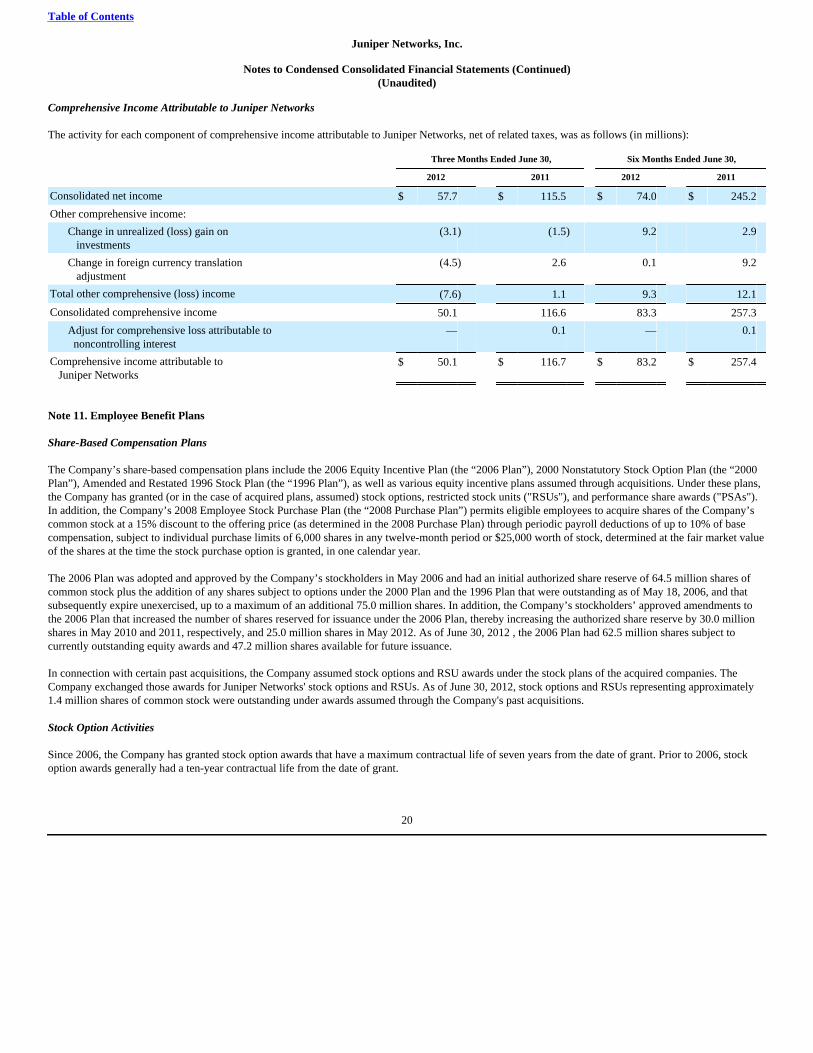
Table of Contents
Juniper Networks, Inc.
Notes to Condensed Consolidated Financial Statements (Continued)(Unaudited)
Comprehensive Income Attributable to Juniper Networks
The activity for each component of comprehensive income attributable to Juniper Networks, net of related taxes, was as follows (in millions):
Three Months Ended June 30, Six Months Ended June 30,
2012 2011 2012 2011
Consolidated net income $ 57.7 $ 115.5 $ 74.0 $ 245.2
Other comprehensive income:
Change in unrealized (loss) gain on investments
(3.1) (1.5) 9.2 2.9
Change in foreign currency translation adjustment
(4.5) 2.6 0.1 9.2
Total other comprehensive (loss) income (7.6) 1.1 9.3 12.1
Consolidated comprehensive income 50.1 116.6 83.3 257.3
Adjust for comprehensive loss attributable to noncontrolling interest
— 0.1 — 0.1
Comprehensive income attributable to Juniper Networks
$ 50.1 $ 116.7 $ 83.2 $ 257.4
Note 11. Employee Benefit Plans
Share-Based Compensation Plans
The Company’s share-based compensation plans include the 2006 Equity Incentive Plan (the “2006 Plan”), 2000 Nonstatutory Stock Option Plan (the “2000Plan”), Amended and Restated 1996 Stock Plan (the “1996 Plan”), as well as various equity incentive plans assumed through acquisitions. Under these plans,the Company has granted (or in the case of acquired plans, assumed) stock options, restricted stock units ("RSUs"), and performance share awards ("PSAs").In addition, the Company’s 2008 Employee Stock Purchase Plan (the “2008 Purchase Plan”) permits eligible employees to acquire shares of the Company’scommon stock at a 15% discount to the offering price (as determined in the 2008 Purchase Plan) through periodic payroll deductions of up to 10% of basecompensation, subject to individual purchase limits of 6,000 shares in any twelve-month period or $25,000 worth of stock, determined at the fair market valueof the shares at the time the stock purchase option is granted, in one calendar year.
The 2006 Plan was adopted and approved by the Company’s stockholders in May 2006 and had an initial authorized share reserve of 64.5 million shares ofcommon stock plus the addition of any shares subject to options under the 2000 Plan and the 1996 Plan that were outstanding as of May 18, 2006, and thatsubsequently expire unexercised, up to a maximum of an additional 75.0 million shares. In addition, the Company’s stockholders’ approved amendments tothe 2006 Plan that increased the number of shares reserved for issuance under the 2006 Plan, thereby increasing the authorized share reserve by 30.0 millionshares in May 2010 and 2011, respectively, and 25.0 million shares in May 2012. As of June 30, 2012 , the 2006 Plan had 62.5 million shares subject tocurrently outstanding equity awards and 47.2 million shares available for future issuance.
In connection with certain past acquisitions, the Company assumed stock options and RSU awards under the stock plans of the acquired companies. TheCompany exchanged those awards for Juniper Networks' stock options and RSUs. As of June 30, 2012, stock options and RSUs representing approximately1.4 million shares of common stock were outstanding under awards assumed through the Company's past acquisitions.
Stock Option Activities
Since 2006, the Company has granted stock option awards that have a maximum contractual life of seven years from the date of grant. Prior to 2006, stockoption awards generally had a ten-year contractual life from the date of grant.
20
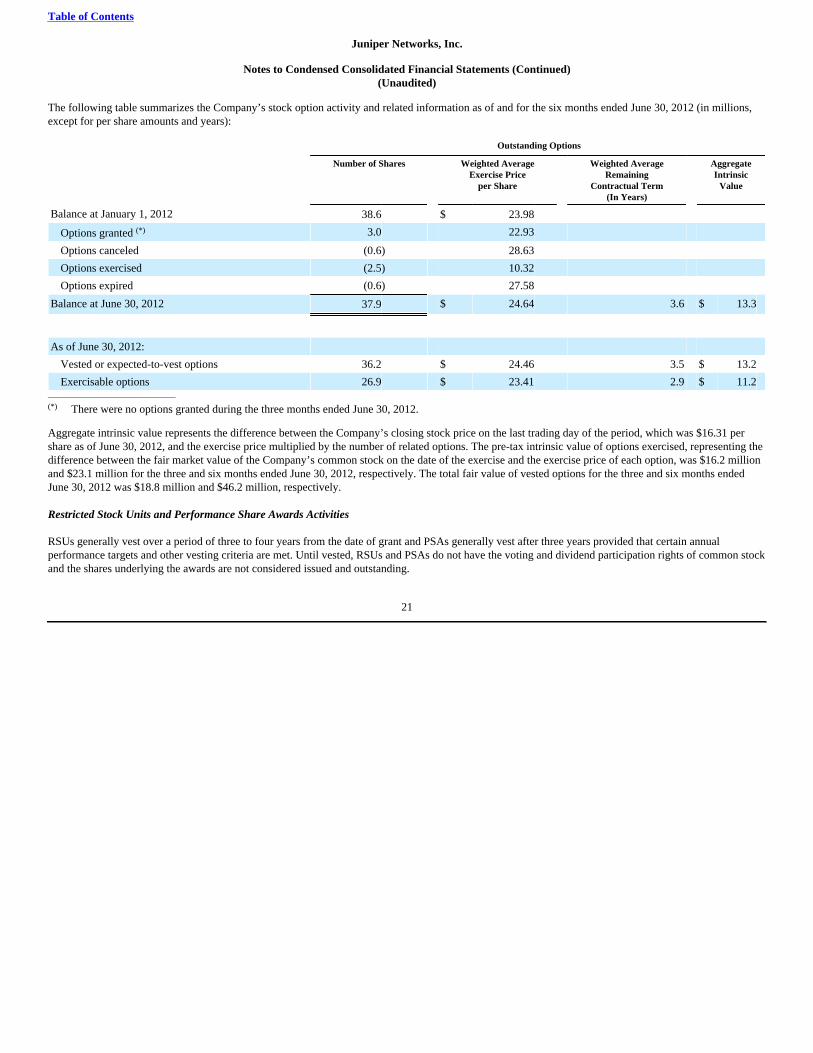
Table of Contents
Juniper Networks, Inc.
Notes to Condensed Consolidated Financial Statements (Continued)(Unaudited)
The following table summarizes the Company’s stock option activity and related information as of and for the six months ended June 30, 2012 (in millions,except for per share amounts and years):
Outstanding Options
Number of Shares Weighted AverageExercise Price
per Share
Weighted AverageRemaining
Contractual Term(In Years)
AggregateIntrinsic
Value
Balance at January 1, 2012 38.6 $ 23.98
Options granted (*) 3.0 22.93
Options canceled (0.6) 28.63
Options exercised (2.5) 10.32
Options expired (0.6) 27.58
Balance at June 30, 2012 37.9 $ 24.64 3.6 $ 13.3
As of June 30, 2012:
Vested or expected-to-vest options 36.2 $ 24.46 3.5 $ 13.2
Exercisable options 26.9 $ 23.41 2.9 $ 11.2________________________________
(*) There were no options granted during the three months ended June 30, 2012.
Aggregate intrinsic value represents the difference between the Company’s closing stock price on the last trading day of the period, which was $16.31 pershare as of June 30, 2012, and the exercise price multiplied by the number of related options. The pre-tax intrinsic value of options exercised, representing thedifference between the fair market value of the Company’s common stock on the date of the exercise and the exercise price of each option, was $16.2 millionand $23.1 million for the three and six months ended June 30, 2012, respectively. The total fair value of vested options for the three and six months endedJune 30, 2012 was $18.8 million and $46.2 million, respectively.
Restricted Stock Units and Performance Share Awards Activities
RSUs generally vest over a period of three to four years from the date of grant and PSAs generally vest after three years provided that certain annualperformance targets and other vesting criteria are met. Until vested, RSUs and PSAs do not have the voting and dividend participation rights of common stockand the shares underlying the awards are not considered issued and outstanding.
21
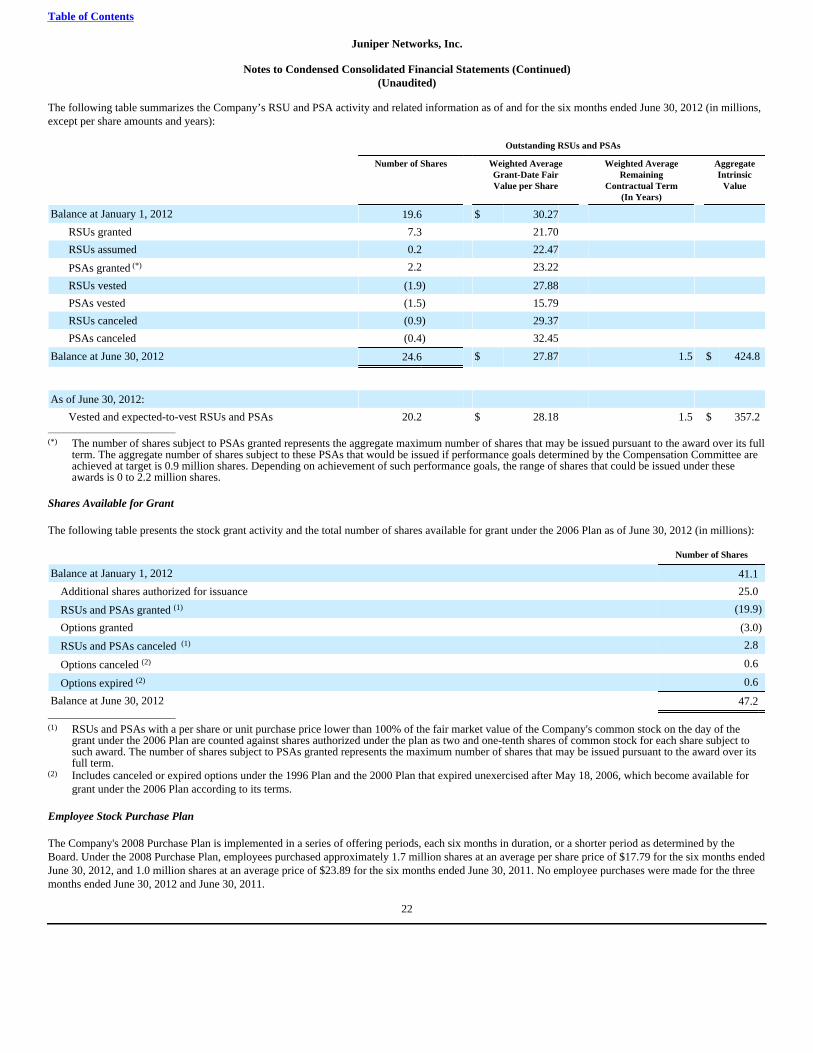
Table of Contents
Juniper Networks, Inc.
Notes to Condensed Consolidated Financial Statements (Continued)(Unaudited)
The following table summarizes the Company’s RSU and PSA activity and related information as of and for the six months ended June 30, 2012 (in millions,except per share amounts and years):
Outstanding RSUs and PSAs
Number of Shares Weighted AverageGrant-Date FairValue per Share
Weighted AverageRemaining
Contractual Term(In Years)
AggregateIntrinsic
Value
Balance at January 1, 2012 19.6 $ 30.27
RSUs granted 7.3 21.70
RSUs assumed 0.2 22.47
PSAs granted (*) 2.2 23.22
RSUs vested (1.9) 27.88
PSAs vested (1.5) 15.79
RSUs canceled (0.9) 29.37
PSAs canceled (0.4) 32.45
Balance at June 30, 2012 24.6 $ 27.87 1.5 $ 424.8
As of June 30, 2012:
Vested and expected-to-vest RSUs and PSAs 20.2 $ 28.18 1.5 $ 357.2________________________________
(*) The number of shares subject to PSAs granted represents the aggregate maximum number of shares that may be issued pursuant to the award over its fullterm. The aggregate number of shares subject to these PSAs that would be issued if performance goals determined by the Compensation Committee areachieved at target is 0.9 million shares. Depending on achievement of such performance goals, the range of shares that could be issued under theseawards is 0 to 2.2 million shares.
Shares Available for Grant
The following table presents the stock grant activity and the total number of shares available for grant under the 2006 Plan as of June 30, 2012 (in millions):
Number of Shares
Balance at January 1, 2012 41.1
Additional shares authorized for issuance 25.0
RSUs and PSAs granted (1) (19.9)
Options granted (3.0)
RSUs and PSAs canceled (1) 2.8
Options canceled (2) 0.6
Options expired (2) 0.6
Balance at June 30, 2012 47.2________________________________
(1) RSUs and PSAs with a per share or unit purchase price lower than 100% of the fair market value of the Company's common stock on the day of thegrant under the 2006 Plan are counted against shares authorized under the plan as two and one-tenth shares of common stock for each share subject tosuch award. The number of shares subject to PSAs granted represents the maximum number of shares that may be issued pursuant to the award over itsfull term.
(2) Includes canceled or expired options under the 1996 Plan and the 2000 Plan that expired unexercised after May 18, 2006, which become available forgrant under the 2006 Plan according to its terms.
Employee Stock Purchase Plan
The Company's 2008 Purchase Plan is implemented in a series of offering periods, each six months in duration, or a shorter period as determined by theBoard. Under the 2008 Purchase Plan, employees purchased approximately 1.7 million shares at an average per share price of $17.79 for the six months endedJune 30, 2012, and 1.0 million shares at an average price of $23.89 for the six months ended June 30, 2011. No employee purchases were made for the threemonths ended June 30, 2012 and June 30, 2011.
22
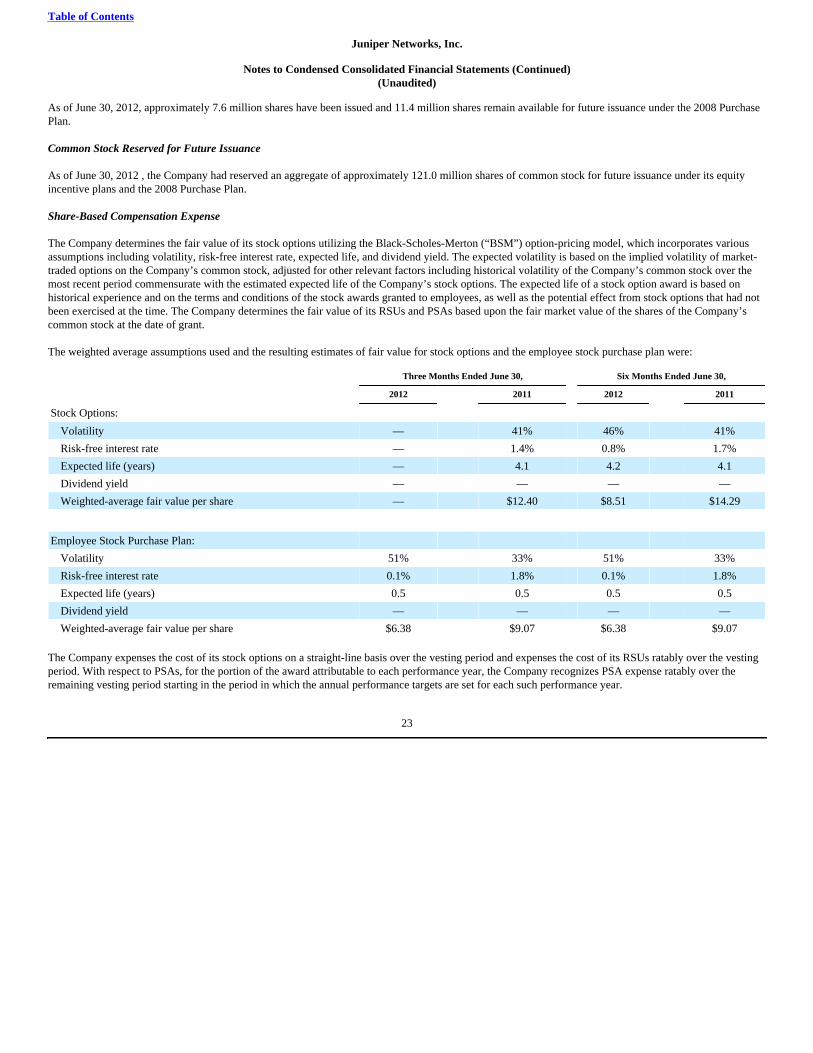
Table of Contents
Juniper Networks, Inc.
Notes to Condensed Consolidated Financial Statements (Continued)(Unaudited)
As of June 30, 2012, approximately 7.6 million shares have been issued and 11.4 million shares remain available for future issuance under the 2008 PurchasePlan.
Common Stock Reserved for Future Issuance
As of June 30, 2012 , the Company had reserved an aggregate of approximately 121.0 million shares of common stock for future issuance under its equityincentive plans and the 2008 Purchase Plan.
Share-Based Compensation Expense
The Company determines the fair value of its stock options utilizing the Black-Scholes-Merton (“BSM”) option-pricing model, which incorporates variousassumptions including volatility, risk-free interest rate, expected life, and dividend yield. The expected volatility is based on the implied volatility of market-traded options on the Company’s common stock, adjusted for other relevant factors including historical volatility of the Company’s common stock over themost recent period commensurate with the estimated expected life of the Company’s stock options. The expected life of a stock option award is based onhistorical experience and on the terms and conditions of the stock awards granted to employees, as well as the potential effect from stock options that had notbeen exercised at the time. The Company determines the fair value of its RSUs and PSAs based upon the fair market value of the shares of the Company’scommon stock at the date of grant.
The weighted average assumptions used and the resulting estimates of fair value for stock options and the employee stock purchase plan were:
Three Months Ended June 30, Six Months Ended June 30,
2012 2011 2012 2011
Stock Options:
Volatility — 41% 46% 41%
Risk-free interest rate — 1.4% 0.8% 1.7%
Expected life (years) — 4.1 4.2 4.1
Dividend yield — — — —
Weighted-average fair value per share — $12.40 $8.51 $14.29
Employee Stock Purchase Plan:
Volatility 51% 33% 51% 33%
Risk-free interest rate 0.1% 1.8% 0.1% 1.8%
Expected life (years) 0.5 0.5 0.5 0.5
Dividend yield — — — —
Weighted-average fair value per share $6.38 $9.07 $6.38 $9.07
The Company expenses the cost of its stock options on a straight-line basis over the vesting period and expenses the cost of its RSUs ratably over the vestingperiod. With respect to PSAs, for the portion of the award attributable to each performance year, the Company recognizes PSA expense ratably over theremaining vesting period starting in the period in which the annual performance targets are set for each such performance year.
23
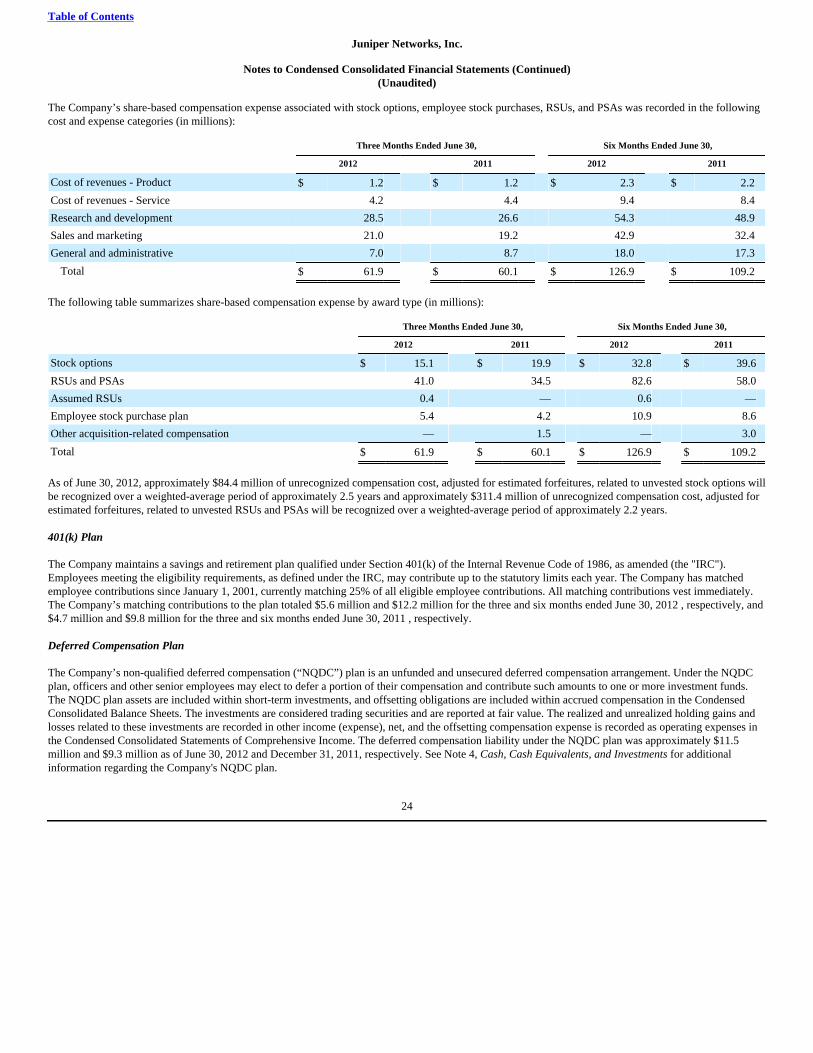
Table of Contents
Juniper Networks, Inc.
Notes to Condensed Consolidated Financial Statements (Continued)(Unaudited)
The Company’s share-based compensation expense associated with stock options, employee stock purchases, RSUs, and PSAs was recorded in the followingcost and expense categories (in millions):
Three Months Ended June 30, Six Months Ended June 30,
2012 2011 2012 2011
Cost of revenues - Product $ 1.2 $ 1.2 $ 2.3 $ 2.2
Cost of revenues - Service 4.2 4.4 9.4 8.4
Research and development 28.5 26.6 54.3 48.9
Sales and marketing 21.0 19.2 42.9 32.4
General and administrative 7.0 8.7 18.0 17.3
Total $ 61.9 $ 60.1 $ 126.9 $ 109.2
The following table summarizes share-based compensation expense by award type (in millions):
Three Months Ended June 30, Six Months Ended June 30,
2012 2011 2012 2011
Stock options $ 15.1 $ 19.9 $ 32.8 $ 39.6
RSUs and PSAs 41.0 34.5 82.6 58.0
Assumed RSUs 0.4 — 0.6 —
Employee stock purchase plan 5.4 4.2 10.9 8.6
Other acquisition-related compensation — 1.5 — 3.0
Total $ 61.9 $ 60.1 $ 126.9 $ 109.2
As of June 30, 2012, approximately $84.4 million of unrecognized compensation cost, adjusted for estimated forfeitures, related to unvested stock options willbe recognized over a weighted-average period of approximately 2.5 years and approximately $311.4 million of unrecognized compensation cost, adjusted forestimated forfeitures, related to unvested RSUs and PSAs will be recognized over a weighted-average period of approximately 2.2 years.
401(k) Plan
The Company maintains a savings and retirement plan qualified under Section 401(k) of the Internal Revenue Code of 1986, as amended (the "IRC").Employees meeting the eligibility requirements, as defined under the IRC, may contribute up to the statutory limits each year. The Company has matchedemployee contributions since January 1, 2001, currently matching 25% of all eligible employee contributions. All matching contributions vest immediately.The Company’s matching contributions to the plan totaled $5.6 million and $12.2 million for the three and six months ended June 30, 2012 , respectively, and$4.7 million and $9.8 million for the three and six months ended June 30, 2011 , respectively.
Deferred Compensation Plan
The Company’s non-qualified deferred compensation (“NQDC”) plan is an unfunded and unsecured deferred compensation arrangement. Under the NQDCplan, officers and other senior employees may elect to defer a portion of their compensation and contribute such amounts to one or more investment funds.The NQDC plan assets are included within short-term investments, and offsetting obligations are included within accrued compensation in the CondensedConsolidated Balance Sheets. The investments are considered trading securities and are reported at fair value. The realized and unrealized holding gains andlosses related to these investments are recorded in other income (expense), net, and the offsetting compensation expense is recorded as operating expenses inthe Condensed Consolidated Statements of Comprehensive Income. The deferred compensation liability under the NQDC plan was approximately $11.5million and $9.3 million as of June 30, 2012 and December 31, 2011, respectively. See Note 4, Cash, Cash Equivalents, and Investments for additionalinformation regarding the Company's NQDC plan.
24
Table of Contents
Juniper Networks, Inc.
Notes to Condensed Consolidated Financial Statements (Continued)(Unaudited)
Note 12. Segments
The Company’s chief operating decision maker (“CODM”) allocates resources and assesses performance based on financial information of the Company’sdivisions. In fiscal 2012, the Company reorganized its operations into two reportable segments principally by product families: PSD and SSD. As a result ofthe change, product families and services were organized within the two divisions based on homogeneity of products and technology.
To provide improved visibility and comparability, the Company reclassified segment operating results for 2011 to conform with certain 2012 organizationalrealignments.
The Company’s PSD segment primarily offers scalable routing and switching products that are used in service provider, enterprise, and public sector networksto control and direct network traffic from data centers, core, edge, aggregation, campus, Wide Area Networks ("WANs"), branch, and customer premiseequipment level. The Company's PSD segment consists of routing, switching, and security/other products and services. Routing includes products andservices from the E, M, MX, PTX and T Series. Switching primarily consists of products and services for EX Series and wireless local area network solutions,as well as QFabric™. Security/other includes products and services from the branch SRX, branch firewall, and J Series, as well as the network applicationplatform, Junos® Space.
The Company's SSD segment offers solutions that meet a broad array of our customers’ priorities, from protecting the users, applications and data on thenetwork to providing network services across a distributed infrastructure. The SSD segment primarily consists of security/other and routing products andservices. Security/other includes High-End SRX services and vGW Virtual Gateways, High-End Firewall virtual private network systems and appliances,secure socket layer virtual private network appliances, intrusion detection and prevention appliances, wide area network optimization platforms, and JunosPulse. Routing primarily consists of Routing Services Software and Mobile Applications (such as MobileNext TM ).
The CODM does not allocate to the Company's business segments certain operating expenses managed separately at the corporate level. Direct costs andoperating expenses, such as standard cost of goods sold, research and development, and product marketing expenses, are generally applied to each segment.Indirect costs, such as manufacturing overhead and other cost of revenues, are allocated based on factors including headcount, usage, and revenue. Segmentcontribution margin is comprised of these direct costs and operating expenses, as well as these indirect costs. Corporate unallocated charges includes: sales,marketing, general and administrative costs, share-based compensation, amortization of purchased intangible assets, restructuring and impairment charges,gains or losses on equity investments, other net income and expense, income taxes, and certain other charges. Segment contribution margin excludes thesecorporate unallocated charges.
25
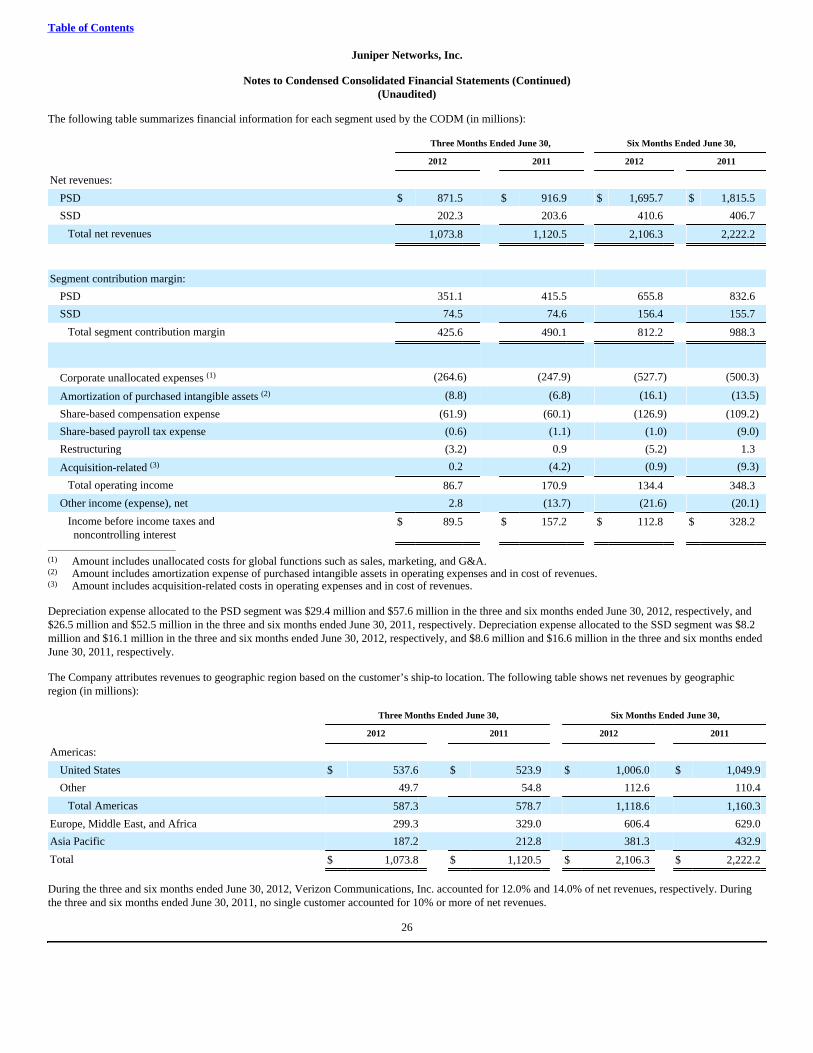
Table of Contents
Juniper Networks, Inc.
Notes to Condensed Consolidated Financial Statements (Continued)(Unaudited)
The following table summarizes financial information for each segment used by the CODM (in millions):
Three Months Ended June 30, Six Months Ended June 30,
2012 2011 2012 2011
Net revenues:
PSD $ 871.5 $ 916.9 $ 1,695.7 $ 1,815.5
SSD 202.3 203.6 410.6 406.7
Total net revenues 1,073.8 1,120.5 2,106.3 2,222.2
Segment contribution margin:
PSD 351.1 415.5 655.8 832.6
SSD 74.5 74.6 156.4 155.7
Total segment contribution margin 425.6 490.1 812.2 988.3
Corporate unallocated expenses (1) (264.6) (247.9) (527.7) (500.3)
Amortization of purchased intangible assets (2) (8.8) (6.8) (16.1) (13.5)
Share-based compensation expense (61.9) (60.1) (126.9) (109.2)
Share-based payroll tax expense (0.6) (1.1) (1.0) (9.0)
Restructuring (3.2) 0.9 (5.2) 1.3
Acquisition-related (3) 0.2 (4.2) (0.9) (9.3)
Total operating income 86.7 170.9 134.4 348.3
Other income (expense), net 2.8 (13.7) (21.6) (20.1)
Income before income taxes and noncontrolling interest
$ 89.5 $ 157.2 $ 112.8 $ 328.2
________________________________
(1) Amount includes unallocated costs for global functions such as sales, marketing, and G&A.(2) Amount includes amortization expense of purchased intangible assets in operating expenses and in cost of revenues.(3) Amount includes acquisition-related costs in operating expenses and in cost of revenues.
Depreciation expense allocated to the PSD segment was $29.4 million and $57.6 million in the three and six months ended June 30, 2012, respectively, and$26.5 million and $52.5 million in the three and six months ended June 30, 2011, respectively. Depreciation expense allocated to the SSD segment was $8.2million and $16.1 million in the three and six months ended June 30, 2012, respectively, and $8.6 million and $16.6 million in the three and six months endedJune 30, 2011, respectively.
The Company attributes revenues to geographic region based on the customer’s ship-to location. The following table shows net revenues by geographicregion (in millions):
Three Months Ended June 30, Six Months Ended June 30,
2012 2011 2012 2011
Americas:
United States $ 537.6 $ 523.9 $ 1,006.0 $ 1,049.9
Other 49.7 54.8 112.6 110.4
Total Americas 587.3 578.7 1,118.6 1,160.3
Europe, Middle East, and Africa 299.3 329.0 606.4 629.0
Asia Pacific 187.2 212.8 381.3 432.9
Total $ 1,073.8 $ 1,120.5 $ 2,106.3 $ 2,222.2
During the three and six months ended June 30, 2012, Verizon Communications, Inc. accounted for 12.0% and 14.0% of net revenues, respectively. Duringthe three and six months ended June 30, 2011, no single customer accounted for 10% or more of net revenues.
26

Table of Contents
Juniper Networks, Inc.
Notes to Condensed Consolidated Financial Statements (Continued)(Unaudited)
The Company tracks assets by physical location. The majority of the Company’s assets, excluding cash and cash equivalents and investments, as of June 30,2012 and December 31, 2011 , were attributable to U.S. operations. As of June 30, 2012 and December 31, 2011 , gross property and equipment held in theU.S., as a percentage of total property and equipment, was approximately 80% . Although management reviews asset information on a corporate level andallocates depreciation expense by segment, the CODM does not review asset information on a segment basis.
Note 13. Income Taxes
The Company recorded a tax provision of $31.8 million and $38.8 million , or effective tax rates of 35.5% and 34.4% for the three and six months endedJune 30, 2012 , respectively. The Company recorded a tax provision of $41.7 million and $83.0 million for the three and six months ended June 30, 2011 , oreffective tax rates of 26.5% and 25.3% , respectively.
The effective tax rates for the three and six months ended June 30, 2012, are similar to the federal statutory rate of 35%. The rates reflect the benefit ofearnings in foreign jurisdictions, which are subject to lower tax rates, offset by the impact of the Company's investment activity. The effective rates for theperiods do not reflect the benefit of the federal R&D credit, which expired on December 31, 2011. The effective tax rate for the three and six months ended June 30, 2011, differs from the federal statutory rate of 35% primarily due to the federal R&D creditand the benefit of earnings in foreign jurisdictions, which are subject to lower tax rates.
The increase in the gross unrecognized tax benefits for the six months ended June 30, 2012 was not material. In the same period, a benefit primarily related toexpiration of statutes of limitation in the amount of approximately $3.8 million, including interest and penalties, impacted the effective tax rate.
The Company is currently under examination by the Internal Revenue Service ("IRS") for the 2004 through 2009 tax years. The Company is also subject totwo separate ongoing examinations by the India tax authorities for the 2004 tax year and 2004 through 2008 tax years, respectively. Additionally, theCompany has not reached a final resolution with the IRS on an adjustment it proposed for the 1999 and 2000 tax years. The Company is not aware of anyother examination by taxing authorities in any other major jurisdictions in which it files income tax returns as of June 30, 2012. In 2011, as part of the 2005 and 2006 IRS audit, the Company received a proposed adjustment related to its intercompany R&D cost sharing arrangement forthe license of intangibles acquired in 2005. In 2009, as part of the 2004 IRS audit, the Company received a similar proposed adjustment related to the licenseof intangibles acquired in 2004.
In 2008, the Company received a proposed adjustment from the India tax authorities related to the 2004 tax year. In 2009, the India tax authoritiescommenced a separate investigation of our 2004 through 2008 tax returns and are disputing the Company's determination of taxable income due to the costbasis of certain fixed assets. The Company accrued $4.6 million in penalties and interest in 2009 related to this matter. The Company understands that theIndia tax authorities may issue an initial assessment that is substantially higher than this amount. As a result, in accordance with the administrative andjudicial process in India, the Company may be required to make payments that are substantially higher than the amount accrued in order to ultimately settlethis issue. The Company strongly believes that any assessment it may receive in excess of the amount accrued would be inconsistent with applicable India taxlaws and intends to defend this position vigorously. The Company is pursuing all available administrative procedures relative to the matters referenced above. The Company believes that it has adequatelyprovided for any reasonably foreseeable outcomes related to these proposed adjustments and the ultimate resolution of these matters is unlikely to have amaterial effect on its consolidated financial condition or results of operations; however there is still a possibility that an adverse outcome of these matterscould have a material effect on its consolidated financial condition and results of operations. For more information, see Note 15, Commitments andContingencies, under the heading “IRS Notices of Proposed Adjustments.”
The Company engages in continuous discussions and negotiations with tax authorities regarding tax matters in various jurisdictions. It is reasonably possiblethat the balance of the gross unrecognized tax benefits will decrease by approximately $2.8 million within the next twelve months due to lapses of applicablestatutes of limitation in multiple jurisdictions that the Company operated in. However, at this time, the Company is unable to make a reasonably reliableestimate of the timing of payments related to the remaining unrecognized tax liabilities due to uncertainties in the timing of tax audit outcomes.
27
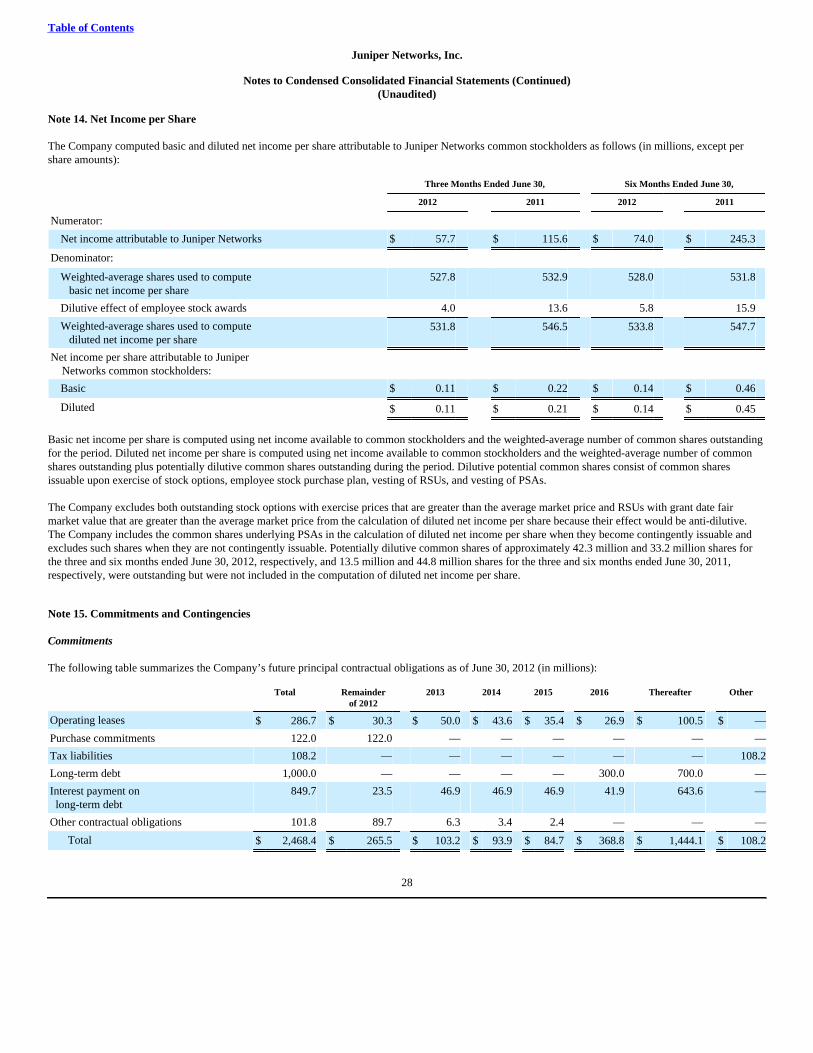
Table of Contents
Juniper Networks, Inc.
Notes to Condensed Consolidated Financial Statements (Continued)(Unaudited)
Note 14. Net Income per Share
The Company computed basic and diluted net income per share attributable to Juniper Networks common stockholders as follows (in millions, except pershare amounts):
Three Months Ended June 30, Six Months Ended June 30,
2012 2011 2012 2011
Numerator:
Net income attributable to Juniper Networks $ 57.7 $ 115.6 $ 74.0 $ 245.3
Denominator:
Weighted-average shares used to compute basic net income per share
527.8 532.9 528.0 531.8
Dilutive effect of employee stock awards 4.0 13.6 5.8 15.9
Weighted-average shares used to compute diluted net income per share
531.8 546.5 533.8 547.7
Net income per share attributable to Juniper Networks common stockholders:
Basic $ 0.11 $ 0.22 $ 0.14 $ 0.46
Diluted $ 0.11 $ 0.21 $ 0.14 $ 0.45
Basic net income per share is computed using net income available to common stockholders and the weighted-average number of common shares outstandingfor the period. Diluted net income per share is computed using net income available to common stockholders and the weighted-average number of commonshares outstanding plus potentially dilutive common shares outstanding during the period. Dilutive potential common shares consist of common sharesissuable upon exercise of stock options, employee stock purchase plan, vesting of RSUs, and vesting of PSAs.
The Company excludes both outstanding stock options with exercise prices that are greater than the average market price and RSUs with grant date fairmarket value that are greater than the average market price from the calculation of diluted net income per share because their effect would be anti-dilutive.The Company includes the common shares underlying PSAs in the calculation of diluted net income per share when they become contingently issuable andexcludes such shares when they are not contingently issuable. Potentially dilutive common shares of approximately 42.3 million and 33.2 million shares forthe three and six months ended June 30, 2012, respectively, and 13.5 million and 44.8 million shares for the three and six months ended June 30, 2011,respectively, were outstanding but were not included in the computation of diluted net income per share.
Note 15. Commitments and Contingencies
Commitments
The following table summarizes the Company’s future principal contractual obligations as of June 30, 2012 (in millions):
Total Remainderof 2012
2013 2014 2015 2016 Thereafter Other
Operating leases $ 286.7 $ 30.3 $ 50.0 $ 43.6 $ 35.4 $ 26.9 $ 100.5 $ —
Purchase commitments 122.0 122.0 — — — — — —
Tax liabilities 108.2 — — — — — — 108.2
Long-term debt 1,000.0 — — — — 300.0 700.0 —
Interest payment on long-term debt
849.7 23.5 46.9 46.9 46.9 41.9 643.6 —
Other contractual obligations 101.8 89.7 6.3 3.4 2.4 — — —
Total $ 2,468.4 $ 265.5 $ 103.2 $ 93.9 $ 84.7 $ 368.8 $ 1,444.1 $ 108.2
28
Table of Contents
Juniper Networks, Inc.
Notes to Condensed Consolidated Financial Statements (Continued)(Unaudited)
Operating Leases
The Company leases certain facilities and equipment under operating leases that expire at various times, the longest of which expires on November 30, 2022.Future minimum payments for non-cancelable operating leases totaled $286.7 million as of June 30, 2012. Rent expense was $15.8 million and $31.5 millionfor the three and six months ended June 30, 2012, respectively, and $17.8 million and $32.6 million for the three and six months ended June 30, 2011,respectively.
Purchase Commitments
In order to reduce manufacturing lead times and ensure adequate component supply, contract manufacturers utilized by the Company place non-cancelable,non-returnable (“NCNR”) orders for components based on the Company’s build forecasts. As of June 30, 2012, there were NCNR component orders placedby the contract manufacturers with a value of $122.0 million. The contract manufacturers use the components to build products based on the Company’sforecasts and customer purchase orders received by the Company. Generally, the Company does not own the components and title to the products transfersfrom the contract manufacturers to the Company and immediately to the Company’s customers upon delivery at a designated shipment location. If thecomponents remain unused or the products remain unsold for specified periods, the Company may incur carrying charges or obsolete materials charges forcomponents that the contract manufacturers purchased to build products to meet the Company’s forecast or customer orders. As of June 30, 2012, theCompany had accrued $15.9 million based on its estimate of such charges.
Tax Liabilities
As of June 30, 2012, the Company had $108.2 million included in long-term liabilities in the Condensed Consolidated Balance Sheets for unrecognized taxpositions. At this time, the Company is unable to make a reasonably reliable estimate of the timing of payments related to the $108.2 million in liability due touncertainties in the timing of tax audit outcomes.
Long-Term Debt and Interest Payment on Long-Term Debt
As of June 30, 2012, the Company held long-term debt with a carrying value of $999.1 million. Of these Notes, $300.0 million will mature in 2016 and bearsinterest at a fixed rate of 3.10%, $300.0 million will mature in 2021 and bears interest at a fixed rate of 4.60%, and $400.0 million will mature in 2041 andbears interest at a fixed rate of 5.95%. Interest on the Notes is payable semiannually. See Note 9, Long-Term Debt and Financing, for further discussion of theCompany's long-term debt.
Other Contractual Obligations
As of June 30, 2012, other contractual obligations primarily consisted of $28.8 million in indemnity-related and service related escrows, required by certainacquisitions completed in 2005 and 2010, $58.1 million in campus build-out obligations, and other miscellaneous commitments.
Guarantees
The Company enters into agreements with customers that contain indemnification provisions relating to potential situations where claims could be alleged thatthe Company’s products infringe the intellectual property rights of a third-party. The Company also has financial guarantees consisting of guarantees ofproduct and service performance, guarantees related to third-party customer-financing arrangements, customs and duties guarantees, and standby letters ofcredit for certain lease facilities. As of June 30, 2012 and December 31, 2011, the Company had $19.5 million and $19.9 million, respectively, in bankguarantees and standby letters of credit related to these financial guarantees.
Legal Proceedings
The Company is involved in disputes, litigation, and other legal actions, including, but not limited to, the matters described below. The Company isaggressively defending its current litigation matters, and while there can be no assurances, the Company currently believes that there are no existing claims orproceedings that are likely to have a material adverse effect on its financial position, the outcome of these matters is currently not determinable. There aremany uncertainties associated with
29
Table of Contents
Juniper Networks, Inc.
Notes to Condensed Consolidated Financial Statements (Continued)(Unaudited)
any litigation, and these actions or other third-party claims against the Company may cause the Company to incur costly litigation and/or substantialsettlement charges. In addition, the resolution of any intellectual property litigation may require the Company to make royalty payments, which couldadversely affect gross margins in future periods. If any of those events were to occur, the Company's business, financial condition, results of operations, andcash flows could be adversely affected. The actual liability in any such matters may be materially different from the Company's estimates, if any, which couldresult in the need to adjust the liability and record additional expenses. Unless otherwise noted below, during the period presented, we have not: recorded anyaccrual for loss contingencies associated with such legal proceedings; determined that an unfavorable outcome is probable or reasonably possible; ordetermined that the amount or range of any possible loss is reasonably estimable.
2011 Federal Securities Class Action
On August 15, 2011, a purported securities class action lawsuit, captioned City of Royal Oak Retirement System v. Juniper Networks, Inc., et al., Case No.11-cv-04003-LHK, was filed in the United States District Court for the Northern District of California naming the Company and certain of its officers anddirectors as defendants. The complaint alleges that the defendants made false and misleading statements regarding the Company's business and prospects.Plaintiffs seek an unspecified amount of monetary damages on behalf of the purported class. On January 9, 2012 the Court appointed City of Omaha Policeand Fire Retirement System and City of Bristol Pension Fund as lead plaintiff. Lead plaintiff filed an amended complaint on February 13, 2012. The amendedcomplaint alleges that defendants made false and misleading statements about Juniper's business and future prospects, and failed to adequately disclose theimpact of certain changes in accounting rules. The amended complaint purports to assert claims for violations of Sections 10(b), 20(a) and 20A of theSecurities Exchange Act of 1934 and SEC Rule 10b-5 on behalf of those who purchased or otherwise acquired Juniper's common stock between July 20, 2010and July 26, 2011, inclusive. On March 14, 2012, Defendants filed motions to dismiss. Plaintiffs filed their opposition to the motions on April 13, 2012.Defendants filed reply briefs on May 4, 2012. On July 23, 2012, the Court issued an order dismissing the action and giving Plaintiffs 21 days to file anamended complaint.
2011 California State Derivative Lawsuits
Between August 22 and September 9, 2011, four purported shareholder derivative actions were filed in the Superior Court of the State of California, Countyof Santa Clara, naming certain of the Company's officers and directors as defendants. The Company is named only as a nominal defendant in the actions. Theactions were consolidated as In re Juniper Networks, Inc. Shareholder Litigation, Case No. 1-11-CV-207701 (Lead Case), by order dated September 12, 2011.The complaints are generally based upon the disclosures and alleged omissions challenged in the securities class action. The complaints purport to assertclaims against the defendants for breach of fiduciary duties, unjust enrichment, abuse of control, gross mismanagement, and waste of corporate assets. Thecomplaints seek, among other relief, damages in an unspecified amount, restitution, and attorneys' fees and costs. On March 8, 2012, the Company filed amotion to stay the action until resolution of the federal securities class action discussed above, and also filed a demurrer seeking to dismiss the action for thereason that plaintiffs lack standing. The plaintiffs filed oppositions to both motions on April 5, 2012. Defendants filed reply briefs on May 7, 2012. At ahearing on July 27, 2012, the Court ordered that the actions be stayed until such time as the federal court issues an order denying a motion to dismiss in thesecurities class action, City of Omaha Police and Fire Retirement System v. Juniper Networks, Inc. et al., Case No. CV-11-4003-LHK. The Court deferreddeciding the demurrer pending the stay.
2011 Federal Derivative Lawsuit
On September 27, 2011 and December 28, 2011, two purported shareholder derivative actions, captioned Ratinova v. Johnson, et al., Case No. 11-cv-04792and Lisa E. Coppola, ERA v. Johnson, et al., Case No. 11-cv-06667, respectively, were filed in the United States District Court for the Northern District ofCalifornia naming certain of the Company's officers and directors as defendants. The Company is named only as a nominal defendant in the action. Like thestate derivative actions, the federal derivative lawsuits are generally based upon the disclosures and alleged omissions challenged in the securities class action.The complaints purport to assert claims against the defendants for breach of fiduciary duties and unjust enrichment. The complaints seek, among other relief,damages in an unspecified amount, restitution, and attorneys' fees and costs. By order dated January 30, 2012, the Court consolidated the actions as In reJuniper Networks, Inc. Shareholder Derivative Litigation, Master File No. 11-cv-04792-LHK. On February 3, 2012, the parties filed a stipulation in which theparties requested that the Court stay the action until such time as the Court entered an order denying a motion to dismiss in the related federal securities classaction described above. On February 6, 2012, the Court granted the parties' stipulation.
30
Table of Contents
Juniper Networks, Inc.
Notes to Condensed Consolidated Financial Statements (Continued)(Unaudited)
IRS Notices of Proposed Adjustments
In 2011, as a result of its audit of the Company's U.S. federal income tax returns for the 2005 and 2006 fiscal years, the IRS issued a Preliminary Notice ofDeficiency (“PNOD”) regarding the Company's transfer pricing transactions under its intercompany R&D cost sharing arrangement related to the license ofintangibles acquired in 2005. The asserted changes would affect the Company's income tax liabilities for tax years subsequent to 2004. Because of the PNOD,the estimated incremental tax liabilities for all relative tax years would be approximately $92 million, excluding interest and penalties. The Company has fileda protest to the proposed deficiency with the IRS.
In 2009, the Company received a PNOD from the IRS claiming that the Company owes additional taxes, plus interest and possible penalties, for the 2004 taxyear based on a transfer pricing transaction related to the license of acquired intangibles under an intercompany R&D cost sharing arrangement. The assertedchanges to the Company's 2004 tax year would affect the Company's income tax liabilities in tax years subsequent to 2003. In addition, the Company has notreached a final resolution with the IRS on an adjustment the IRS proposed for the 1999 and 2000 tax years. Because of the PNOD, the estimated incrementaltax liability would be approximately $807 million, excluding interest and penalties. The Company has filed a protest to the PNOD, which is under review bythe Appeals Division of the IRS.
The Company strongly believes the IRS' position with regard to transfer pricing transactions for the Company's 2004 through 2006 fiscal years areinconsistent with applicable tax laws, judicial precedent and existing Treasury regulations, and that the Company's previously reported income tax provisionsfor the years in question are appropriate. However, there can be no assurance that these matters will be resolved in the Company's favor. Regardless ofwhether these matters are resolved in the Company's favor, the final resolution of these matters could be expensive and time-consuming to defend and/orsettle. While the Company believes it has provided adequately for these matters, there is still a possibility that an adverse outcome from these matters couldhave a material effect on its results of operations and financial condition. In September 2008, as part of its ongoing audit of the U.S. federal income tax return for the 2004 fiscal year, the IRS issued a Notice of Proposed Adjustment(“NOPA”) regarding the Company's business credits. The Company believes that it has adequately provided for any reasonable foreseeable outcome related tothis proposed adjustment.
The Company is also under routine examination by certain state and non-U.S. tax authorities. The Company believes that it has adequately provided for anyreasonably foreseeable outcome related to these audits.
Note 16. Subsequent Events
Stock Repurchases
Subsequent to June 30, 2012 , through the filing of this Report, the Company repurchased 6.7 million shares of its common stock, for $118.8 million at anaverage purchase price of $17.73 per share, under its stock repurchase programs. Repurchases of 5.7 million shares were settled prior to the filing of thisReport and the remaining shares will be settled after the filing date. Under the 2012 Stock Repurchase Program, the Company has $949.4 million authorizedfunds remaining as of the filing date. There were no remaining funds under the 2010 Stock Repurchase Program. Purchases under the Company's stockrepurchase programs are subject to a review of the circumstances in place at the time and will be made from time to time as permitted by securities laws andother legal requirements. These programs may be discontinued at any time.
Asset Acquisition
Subsequent to June 30, 2012, the Company finalized an agreement with Riverbed Technology ("Riverbed"). Under the terms of this agreement, the Companywill license Riverbed's application delivery controller technology for cash consideration of $75.0 million, certain software integration services, and jointmarketing efforts relating to wide area network optimization solutions.
31
Table of Contents
Item 2. Management's Discussion and Analysis of Financial Condition and Results of Operations
Forward-Looking Statements
This Quarterly Report on Form 10-Q (“Report”), including the “Management’s Discussion and Analysis of Financial Condition and Results of Operations,”contains forward-looking statements regarding future events and the future results of Juniper Networks, Inc. (“we,” “us,” "Juniper," or the “Company”) thatare based on our current expectations, estimates, forecasts, and projections about our business, our results of operations, the industry in which we operate,and the beliefs and assumptions of our management. Words such as “expects,” “anticipates,” “targets,” “goals,” “projects,” “would,” “could,” “intends,”“plans,” “believes,” “seeks,” “estimates,” variations of such words, and similar expressions are intended to identify such forward-looking statements. Theseforward-looking statements are only predictions and are subject to risks, uncertainties, and assumptions that are difficult to predict. Therefore, actual resultsmay differ materially and adversely from those expressed in any forward-looking statements. Factors that might cause or contribute to such differencesinclude, but are not limited to, those discussed in this Report under the section entitled “Risk Factors” in Item 1A of Part II and elsewhere, and in otherreports we file with the U.S. Securities and Exchange Commission ("SEC"), specifically our most recent Annual Report on Form 10-K. While forward-lookingstatements are based on reasonable expectations of our management at the time that they are made, given these risks and uncertainties, readers are cautionednot to place undue reliance on such forward-looking statements. We undertake no obligation to revise or update publicly any forward-looking statements forany reason.
The following discussion is based upon our unaudited Condensed Consolidated Financial Statements included in Part 1, Item I, of this Report, which havebeen prepared in accordance with U.S. generally accepted accounting principles (“U.S. GAAP”). In the course of operating our business, we routinely makedecisions as to the timing of the payment of invoices, the collection of receivables, the manufacturing and shipment of products, the fulfillment of orders, thepurchase of supplies, and the building of inventory and spare parts, among other matters. Each of these decisions has some impact on the financial results forany given period. In making these decisions, we consider various factors, including contractual obligations, customer satisfaction, competition, internal andexternal financial targets and expectations, and financial planning objectives.
To aid in understanding our operating results for the periods covered by this Report, we have provided a summary of our business and market environmentalong with a financial results overview. These sections should be read in conjunction with the more detailed discussion and analysis of our consolidatedfinancial condition and results of operations in this Item 2, our “Risk Factors” section included in Item 1A of Part II, and our unaudited CondensedConsolidated Financial Statements and Notes included in Item 1 of Part I of this Report.
Business and Market Environment
At Juniper Networks, we design, develop, and sell products and services that together provide our customers with a high-performance network infrastructurebuilt on simplicity, security, openness, and scale. We serve the high-performance networking requirements of global service providers, enterprises,governments, and research and public sector organizations that view the network as critical to their success. Our core competencies in hardware systems,silicon design, network architecture, and our open cross-network software platform are helping customers achieve unmatched performance, greater choice andflexibility while reducing overall total cost of ownership.
We do business in three geographic regions: Americas, Europe, Middle East and Africa (“EMEA”), and Asia Pacific (“APAC”). Beginning in the first quarterof 2012, we aligned our organizational structure to focus on our platform and software strategy, which resulted in two business segments: Platform SystemsDivision ("PSD") and Software Solutions Division ("SSD"). Our PSD segment primarily offers scalable routing and switching products that are used inservice provider, enterprise, and public sector networks to control and direct network traffic from data centers, core, edge, aggregation, campus, wireless localarea network ("WLAN"), branch, and customer premise equipment level. Our SSD segment offers solutions that address a broad array of our customers'priorities, from protecting the users, applications, and data on the network to providing network services across a distributed infrastructure. Both segmentsoffer worldwide services, including technical support and professional services, as well as educational and training programs to our customers.
Over the past three years we have focused our organization on a common vision for the new network and we believe that the organizational structure we havein place will effectively drive our innovative portfolio and support our customers' next-generation network requirements. Together, our high-performanceproduct and service offerings help our customers to convert legacy networks that provide commoditized services into more valuable assets that providedifferentiation, value, increased performance, reliability, and security to end-users. We remain dedicated to uncovering new ideas and innovations that willserve the exponentially increasing demands of the networked world, and we will endeavor to continue to build solutions that center on simplification,automation, and open innovation.
32
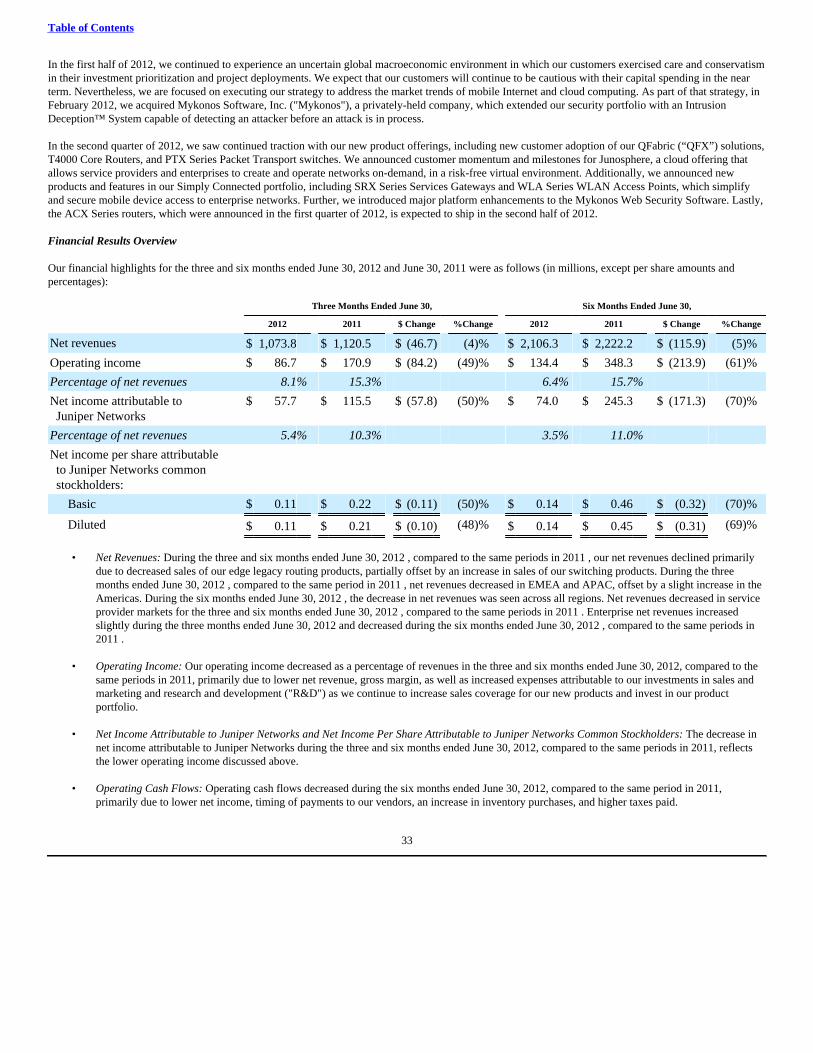
Table of Contents
In the first half of 2012, we continued to experience an uncertain global macroeconomic environment in which our customers exercised care and conservatismin their investment prioritization and project deployments. We expect that our customers will continue to be cautious with their capital spending in the nearterm. Nevertheless, we are focused on executing our strategy to address the market trends of mobile Internet and cloud computing. As part of that strategy, inFebruary 2012, we acquired Mykonos Software, Inc. ("Mykonos"), a privately-held company, which extended our security portfolio with an IntrusionDeception™ System capable of detecting an attacker before an attack is in process.
In the second quarter of 2012, we saw continued traction with our new product offerings, including new customer adoption of our QFabric (“QFX”) solutions,T4000 Core Routers, and PTX Series Packet Transport switches. We announced customer momentum and milestones for Junosphere, a cloud offering thatallows service providers and enterprises to create and operate networks on-demand, in a risk-free virtual environment. Additionally, we announced newproducts and features in our Simply Connected portfolio, including SRX Series Services Gateways and WLA Series WLAN Access Points, which simplifyand secure mobile device access to enterprise networks. Further, we introduced major platform enhancements to the Mykonos Web Security Software. Lastly,the ACX Series routers, which were announced in the first quarter of 2012, is expected to ship in the second half of 2012.
Financial Results Overview
Our financial highlights for the three and six months ended June 30, 2012 and June 30, 2011 were as follows (in millions, except per share amounts andpercentages):
Three Months Ended June 30, Six Months Ended June 30,
2012 2011 $ Change %Change 2012 2011 $ Change %Change
Net revenues $ 1,073.8 $ 1,120.5 $ (46.7) (4)% $ 2,106.3 $ 2,222.2 $ (115.9) (5)%
Operating income $ 86.7 $ 170.9 $ (84.2) (49)% $ 134.4 $ 348.3 $ (213.9) (61)%
Percentage of net revenues 8.1% 15.3% 6.4% 15.7%
Net income attributable to Juniper Networks
$ 57.7 $ 115.5 $ (57.8) (50)% $ 74.0 $ 245.3 $ (171.3) (70)%
Percentage of net revenues 5.4% 10.3% 3.5% 11.0%
Net income per share attributable to Juniper Networks common stockholders:
Basic $ 0.11 $ 0.22 $ (0.11) (50)% $ 0.14 $ 0.46 $ (0.32) (70)%
Diluted $ 0.11 $ 0.21 $ (0.10) (48)% $ 0.14 $ 0.45 $ (0.31) (69)%
• Net Revenues: During the three and six months ended June 30, 2012 , compared to the same periods in 2011 , our net revenues declined primarilydue to decreased sales of our edge legacy routing products, partially offset by an increase in sales of our switching products. During the threemonths ended June 30, 2012 , compared to the same period in 2011 , net revenues decreased in EMEA and APAC, offset by a slight increase in theAmericas. During the six months ended June 30, 2012 , the decrease in net revenues was seen across all regions. Net revenues decreased in serviceprovider markets for the three and six months ended June 30, 2012 , compared to the same periods in 2011 . Enterprise net revenues increasedslightly during the three months ended June 30, 2012 and decreased during the six months ended June 30, 2012 , compared to the same periods in2011 .
• Operating Income: Our operating income decreased as a percentage of revenues in the three and six months ended June 30, 2012, compared to thesame periods in 2011, primarily due to lower net revenue, gross margin, as well as increased expenses attributable to our investments in sales andmarketing and research and development ("R&D") as we continue to increase sales coverage for our new products and invest in our productportfolio.
• Net Income Attributable to Juniper Networks and Net Income Per Share Attributable to Juniper Networks Common Stockholders: The decrease innet income attributable to Juniper Networks during the three and six months ended June 30, 2012, compared to the same periods in 2011, reflectsthe lower operating income discussed above.
• Operating Cash Flows: Operating cash flows decreased during the six months ended June 30, 2012, compared to the same period in 2011,primarily due to lower net income, timing of payments to our vendors, an increase in inventory purchases, and higher taxes paid.
33
Table of Contents
• Book-to-Bill: Book-to-bill was greater than one as of June 30, 2012 and was one as of December 31, 2011.
• Deferred Revenue: Total deferred revenue increased by $25.9 million to $992.9 million as of June 30, 2012, compared to $967.0 million as ofDecember 31, 2011, primarily due to an increase in deferred service revenue driven by service contract renewals.
• Stock Repurchase Plan Activity: Under our stock repurchase programs, we repurchased approximately 5.0 million shares of our common stock inthe open market at an average price of $18.76 per share for an aggregate purchase price of $94.0 million during the three months ended June 30,2012 and 7.4 million shares of our common stock at an average price of $19.72 per share for an aggregate purchase price of $145.6 million duringthe six months ended June 30, 2012.
Critical Accounting Policies and Estimates
The preparation of financial statements and related disclosures in conformity with U.S. GAAP requires us to make judgments, assumptions, and estimates thataffect the amounts reported in the condensed consolidated financial statements and the accompanying notes. On an ongoing basis, we evaluate our estimatesand assumptions, including those related to sales returns, pricing credits, warranty costs, allowance for doubtful accounts, impairment of long-term assets,especially goodwill and intangible assets, contract manufacturer exposures for carrying and obsolete material charges, assumptions used in the valuation ofshare-based compensation, and litigation. These estimates and assumptions are based on current facts, historical experience, and various other factors that webelieve are reasonable under the circumstances to determine reported amounts of assets, liabilities, revenue and expenses that are not readily apparent fromother sources. To the extent there are material differences between our estimates and the actual results, our future consolidated results of operations may beaffected. For further information about our accounting policies and estimates, see Note 2, Summary of Significant Accounting Policies , in Notes toConsolidated Financial Statements in Item 8 of Part II of the Annual Report on Form 10-K for the year ended December 31, 2011. Actual results may differfrom these estimates under different assumptions or conditions.
An accounting policy is considered to be critical if the nature of the estimates or assumptions is material due to the levels of subjectivity and judgmentnecessary to account for highly uncertain matters or the susceptibility of such matters to change, and the effect of the estimates and assumptions on financialcondition or operating performance is material. The accounting policies we believe to reflect our more significant estimates, judgments and assumptions andare most critical to understanding and evaluating our reported financial results are as follows:
• Revenue Recognition;• Contract Manufacturer Liabilities; • Warranty Costs; • Goodwill and Purchased Intangible Assets; • Share-Based Compensation; • Income Taxes; and• Loss Contingencies.
During the six months ended June 30, 2012 , there were no significant changes to our critical accounting policies and estimates as compared to the criticalaccounting policies and estimates disclosed in Management's Discussion and Analysis of Financial Condition and Results of Operations contained in Part II,Item 7 of our Annual Report on Form 10-K for the year ended December 31, 2011.
Recent Accounting Pronouncements Not Yet Effective
In July 2012, the Financial Accounting Standards Board ("FASB") issued Accounting Standards Update ("ASU") No. 2012-02, Topic 350 - Intangibles -Goodwill and Other ("ASU 2012-02"), which amends Topic 350 to allow an entity to first assess qualitative factors to determine whether it is more likely thannot that the fair value of an indefinite-lived intangible asset is less than its carrying value. An entity would not be required to determine the fair value of theindefinite-lived intangible unless the entity determines, based on the qualitative assessment, that it is more likely than not that its fair value is less than thecarrying value. ASU 2012-02 is effective for annual and interim impairment tests performed for fiscal years beginning after September 15, 2012 and earlyadoption is permitted. We will adopt this standard in the fourth quarter of 2012 and do not expect the adoption will have an impact on our consolidated resultsof operations or financial condition.
34
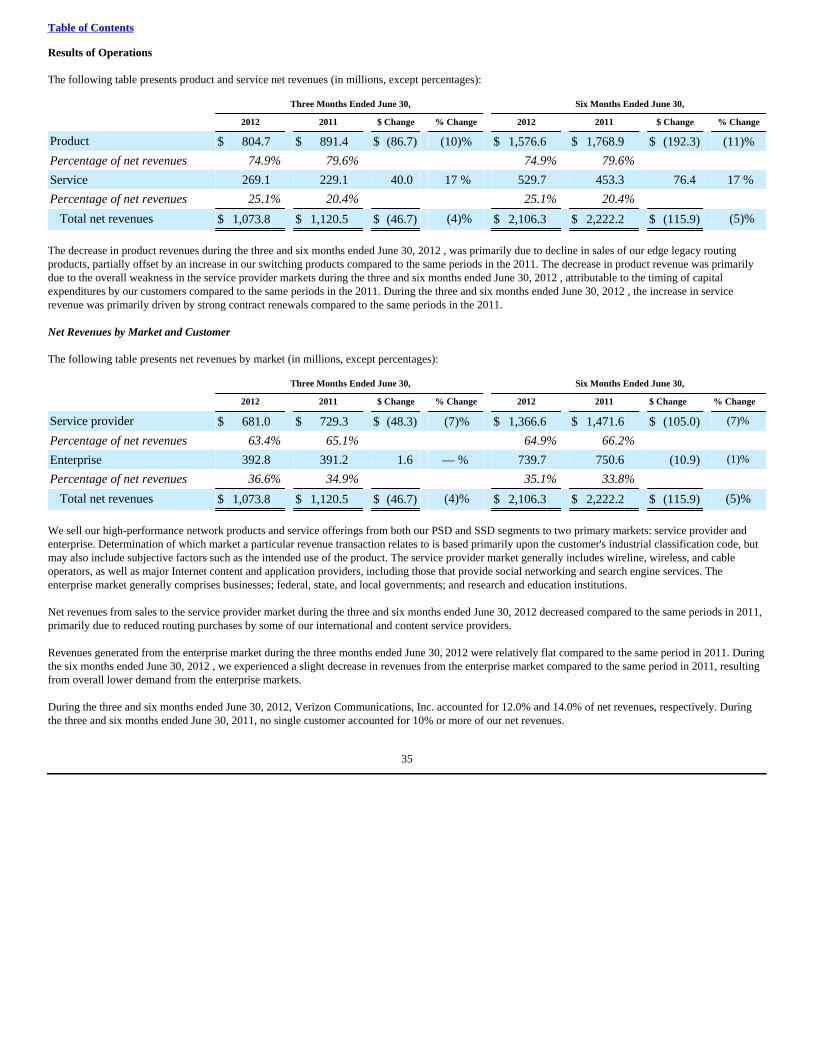
Table of Contents
Results of Operations
The following table presents product and service net revenues (in millions, except percentages):
Three Months Ended June 30, Six Months Ended June 30,
2012 2011 $ Change % Change 2012 2011 $ Change % Change
Product $ 804.7 $ 891.4 $ (86.7) (10)% $ 1,576.6 $ 1,768.9 $ (192.3) (11)%
Percentage of net revenues 74.9% 79.6% 74.9% 79.6%
Service 269.1 229.1 40.0 17 % 529.7 453.3 76.4 17 %
Percentage of net revenues 25.1% 20.4% 25.1% 20.4%
Total net revenues $ 1,073.8 $ 1,120.5 $ (46.7) (4)% $ 2,106.3 $ 2,222.2 $ (115.9) (5)%
The decrease in product revenues during the three and six months ended June 30, 2012 , was primarily due to decline in sales of our edge legacy routingproducts, partially offset by an increase in our switching products compared to the same periods in the 2011. The decrease in product revenue was primarilydue to the overall weakness in the service provider markets during the three and six months ended June 30, 2012 , attributable to the timing of capitalexpenditures by our customers compared to the same periods in the 2011. During the three and six months ended June 30, 2012 , the increase in servicerevenue was primarily driven by strong contract renewals compared to the same periods in the 2011.
Net Revenues by Market and Customer
The following table presents net revenues by market (in millions, except percentages):
Three Months Ended June 30, Six Months Ended June 30,
2012 2011 $ Change % Change 2012 2011 $ Change % Change
Service provider $ 681.0 $ 729.3 $ (48.3) (7)% $ 1,366.6 $ 1,471.6 $ (105.0) (7)%
Percentage of net revenues 63.4% 65.1% 64.9% 66.2%
Enterprise 392.8 391.2 1.6 — % 739.7 750.6 (10.9) (1)%
Percentage of net revenues 36.6% 34.9% 35.1% 33.8%
Total net revenues $ 1,073.8 $ 1,120.5 $ (46.7) (4)% $ 2,106.3 $ 2,222.2 $ (115.9) (5)%
We sell our high-performance network products and service offerings from both our PSD and SSD segments to two primary markets: service provider andenterprise. Determination of which market a particular revenue transaction relates to is based primarily upon the customer's industrial classification code, butmay also include subjective factors such as the intended use of the product. The service provider market generally includes wireline, wireless, and cableoperators, as well as major Internet content and application providers, including those that provide social networking and search engine services. Theenterprise market generally comprises businesses; federal, state, and local governments; and research and education institutions.
Net revenues from sales to the service provider market during the three and six months ended June 30, 2012 decreased compared to the same periods in 2011,primarily due to reduced routing purchases by some of our international and content service providers.
Revenues generated from the enterprise market during the three months ended June 30, 2012 were relatively flat compared to the same period in 2011. Duringthe six months ended June 30, 2012 , we experienced a slight decrease in revenues from the enterprise market compared to the same period in 2011, resultingfrom overall lower demand from the enterprise markets.
During the three and six months ended June 30, 2012, Verizon Communications, Inc. accounted for 12.0% and 14.0% of net revenues, respectively. Duringthe three and six months ended June 30, 2011, no single customer accounted for 10% or more of our net revenues.
35
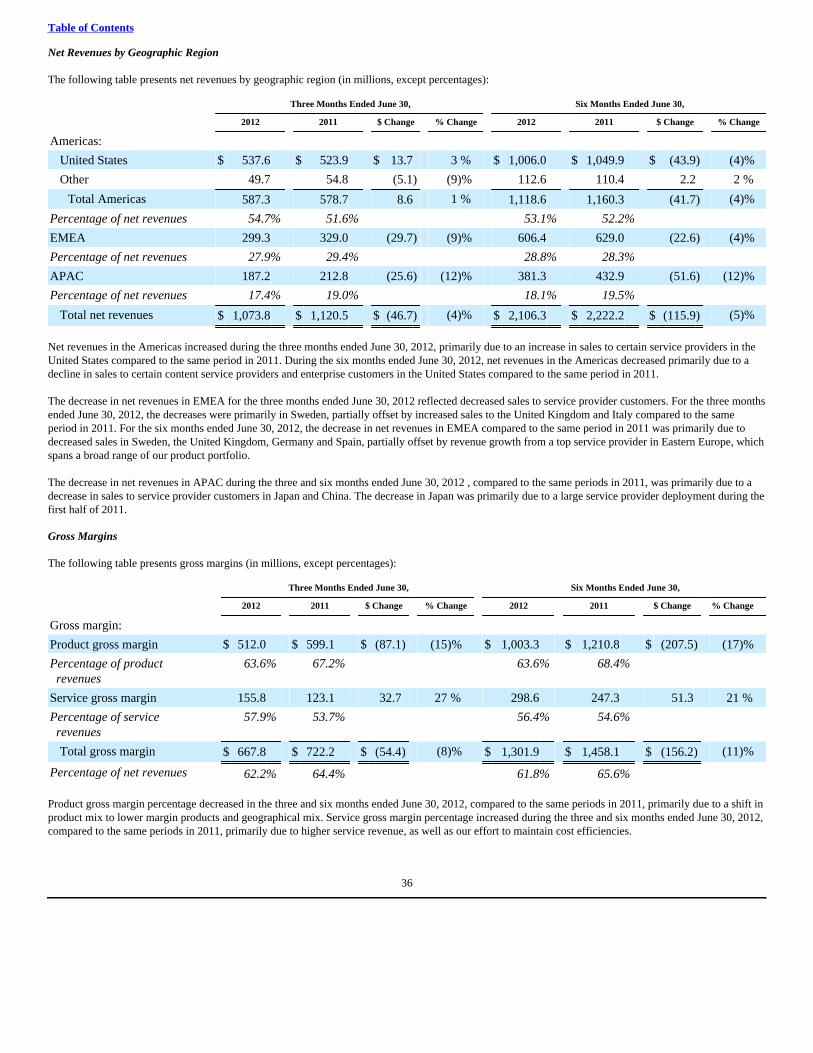
Table of Contents
Net Revenues by Geographic Region
The following table presents net revenues by geographic region (in millions, except percentages):
Three Months Ended June 30, Six Months Ended June 30,
2012 2011 $ Change % Change 2012 2011 $ Change % Change
Americas:
United States $ 537.6 $ 523.9 $ 13.7 3 % $ 1,006.0 $ 1,049.9 $ (43.9) (4)%
Other 49.7 54.8 (5.1) (9)% 112.6 110.4 2.2 2 %
Total Americas 587.3 578.7 8.6 1 % 1,118.6 1,160.3 (41.7) (4)%
Percentage of net revenues 54.7% 51.6% 53.1% 52.2%
EMEA 299.3 329.0 (29.7) (9)% 606.4 629.0 (22.6) (4)%
Percentage of net revenues 27.9% 29.4% 28.8% 28.3%
APAC 187.2 212.8 (25.6) (12)% 381.3 432.9 (51.6) (12)%
Percentage of net revenues 17.4% 19.0% 18.1% 19.5%
Total net revenues $ 1,073.8 $ 1,120.5 $ (46.7) (4)% $ 2,106.3 $ 2,222.2 $ (115.9) (5)%
Net revenues in the Americas increased during the three months ended June 30, 2012, primarily due to an increase in sales to certain service providers in theUnited States compared to the same period in 2011. During the six months ended June 30, 2012, net revenues in the Americas decreased primarily due to adecline in sales to certain content service providers and enterprise customers in the United States compared to the same period in 2011.
The decrease in net revenues in EMEA for the three months ended June 30, 2012 reflected decreased sales to service provider customers. For the three monthsended June 30, 2012, the decreases were primarily in Sweden, partially offset by increased sales to the United Kingdom and Italy compared to the sameperiod in 2011. For the six months ended June 30, 2012, the decrease in net revenues in EMEA compared to the same period in 2011 was primarily due todecreased sales in Sweden, the United Kingdom, Germany and Spain, partially offset by revenue growth from a top service provider in Eastern Europe, whichspans a broad range of our product portfolio.
The decrease in net revenues in APAC during the three and six months ended June 30, 2012 , compared to the same periods in 2011, was primarily due to adecrease in sales to service provider customers in Japan and China. The decrease in Japan was primarily due to a large service provider deployment during thefirst half of 2011.
Gross Margins
The following table presents gross margins (in millions, except percentages):
Three Months Ended June 30, Six Months Ended June 30,
2012 2011 $ Change % Change 2012 2011 $ Change % Change
Gross margin:
Product gross margin $ 512.0 $ 599.1 $ (87.1) (15)% $ 1,003.3 $ 1,210.8 $ (207.5) (17)%
Percentage of product revenues
63.6% 67.2% 63.6% 68.4%
Service gross margin 155.8 123.1 32.7 27 % 298.6 247.3 51.3 21 %
Percentage of service revenues
57.9% 53.7% 56.4% 54.6%
Total gross margin $ 667.8 $ 722.2 $ (54.4) (8)% $ 1,301.9 $ 1,458.1 $ (156.2) (11)%
Percentage of net revenues 62.2% 64.4% 61.8% 65.6%
Product gross margin percentage decreased in the three and six months ended June 30, 2012, compared to the same periods in 2011, primarily due to a shift inproduct mix to lower margin products and geographical mix. Service gross margin percentage increased during the three and six months ended June 30, 2012,compared to the same periods in 2011, primarily due to higher service revenue, as well as our effort to maintain cost efficiencies.
36
Table of Contents
Operating Expenses
The following table presents operating expenses (in millions, except percentages):
Three Months Ended June 30, Six Months Ended June 30,
2012 2011 $ Change % Change 2012 2011 $ Change % Change
Research and development $ 268.7 $ 257.3 $ 11.4 4 % $ 538.3 $ 519.2 $ 19.1 4 %
Percentage of net revenues 25.0% 23.0 % 25.6% 23.4 %
Sales and marketing 259.5 246.6 12.9 5 % 517.2 492.9 24.3 5 %
Percentage of net revenues 24.2% 22.0 % 24.6% 22.2 %
General and administrative 48.8 44.3 4.5 10 % 103.5 89.2 14.3 16 %
Percentage of net revenues 4.5% 3.9 % 4.9% 4.0 %
Amortization of purchased intangible assets
1.2 1.3 (0.1) (8)% 2.4 2.9 (0.5) (17)%
Percentage of net revenues 0.1% 0.1 % 0.1% 0.1 %
Restructuring 3.2 (0.9) 4.1 N/M 5.2 (1.3) 6.5 N/M
Percentage of net revenues 0.3% (0.1)% 0.2% (0.1)%
Acquisition-related (0.2) 2.7 (2.9) N/M 0.9 6.8 (5.9) (87)%
Percentage of net revenues —% 0.2 % —% 0.3 %
Total operating expenses $ 581.2 $ 551.3 $ 29.9 5 % $ 1,167.5 $ 1,109.7 $ 57.8 5 %
Percentage of net revenues 54.1% 49.1 % 55.4% 49.9 % ________________________
N/M = not meaningful
Research and development expense increased during the three and six months ended June 30, 2012, compared to the same periods in 2011, primarily due to anincrease in personnel expenses as we continue to invest in new product innovation and expand our product portfolio.
Sales and marketing expenses increased during the three and six months ended June 30, 2012 , compared to the same periods in 2011 , primarily due to anincrease in marketing and advertisement related expenses, personnel related expenses, partially offset by lower commissions during the first half of 2012.
General and administrative expenses increased during the three and six months ended June 30, 2012, compared to the same periods in 2011, primarily due toan increase in outside professional services, which included legal and consulting fees to support our financial-related initiatives.
Amortization of purchased intangible assets decreased during the three and six months ended June 30, 2012, compared to the same periods in 2011, primarilydue to certain intangible assets which were fully amortized in 2011, partially offset by the addition of intangible assets from acquisitions completed during thefirst quarter of 2012.
We incurred $3.2 million and $5.2 million of net restructuring charges during the three and six months ended June 30, 2012, as we continued to execute our2011 Restructuring Plan, which was implemented during the third quarter of 2011, to better align our business operations with macroeconomic and othermarket conditions. These restructuring charges were related to workforce reductions and facilities closures. As we complete the alignment next quarter, weestimate that we will incur additional facility costs ranging from $5 million to $6 million. In addition, as part of our productivity and efficiency initiatives, weplan to reduce ongoing operating expenses. We anticipate that these initiatives will result in operating expense reductions of approximately $150 million forthe full year 2013, in comparison to the current full year levels. Further, we anticipate that this may involve future restructuring charges.
Acquisition-related charges were lower during the three and six months ended June 30, 2012 , compared to the three and six months ended June 30, 2011 ,primarily due to higher acquisition-related costs for our acquisitions completed during the fourth quarter of 2010 and during the first half of 2011 as comparedto the most recent periods. See Note 3, Business Combinations , in the Notes to Condensed Consolidated Financial Statements in Item 1 of Part I of thisReport, for further discussion of these acquisitions.
37
Table of Contents
Share-Based Compensation Share-based compensation expense associated with stock options, employee stock purchases, restricted stock units ("RSUs"), and performance share awards("PSAs") was recorded in the following cost and expense categories (in millions, except percentages):
Three Months Ended June 30, Six Months Ended June 30,
2012 2011 $ Change % Change 2012 2011 $ Change % Change
Cost of revenues - Product $ 1.2 $ 1.2 $ — — % $ 2.3 $ 2.2 $ 0.1 5%
Cost of revenues - Service 4.2 4.4 (0.2) (5)% 9.4 8.4 1.0 12%
Research and development 28.5 26.6 1.9 7 % 54.3 48.9 5.4 11%
Sales and marketing 21.0 19.2 1.8 9 % 42.9 32.4 10.5 32%
General and administrative 7.0 8.7 (1.7) (20)% 18.0 17.3 0.7 4%
Total $ 61.9 $ 60.1 $ 1.8 3 % $ 126.9 $ 109.2 $ 17.7 16%
Share-based compensation expense increased during the three and six months ended June 30, 2012, compared to the same periods in 2011, primarily due to anincrease in RSU awards granted and a change in standard vesting terms of those awards granted during the first half of 2012.
Effect of Foreign Currency
The change in operating expenses, including cost of service revenue, research and development, sales and marketing, and general and administrativeexpenses, due to foreign currency fluctuations was approximately 3% and not material during the three and six months ended June 30, 2012, respectively. Forthe three and six months ended June 30, 2011, foreign currency fluctuations were not material.
Other Income (Expense), Net and Income Tax Provision
The following table presents other income (expense), net and income tax provision (in millions, except percentages):
Three Months Ended June 30, Six Months Ended June 30,
2012 2011 $ Change % Change 2012 2011 $ Change % Change
Interest income $ 2.9 $ 2.6 $ 0.3 12 % $ 5.7 $ 5.0 $ 0.7 14 %
Interest expense (13.5) (15.2) 1.7 (11)% (27.7) (21.6) (6.1) 28 %
Other 13.4 (1.1) 14.5 N/M 0.4 (3.5) 3.9 N/M
Total other income (expense), net
$ 2.8 $ (13.7) $ 16.5 N/M $ (21.6) $ (20.1) $ (1.5) 7 %
Percentage of net revenues 0.3% (1.2)% (1.0)% (0.9)%
Income tax provision $ 31.8 $ 41.7 $ (9.9) (24)% $ 38.8 $ 83.0 $ (44.2) (53)%
Effective tax rate 35.5% 26.5 % 34.4 % 25.3 % ________________________
N/M = not meaningful
Interest income primarily includes interest income from our cash, cash equivalents, and investments. Interest income increased during the three and sixmonths ended June 30, 2012 as compared to the same periods in the prior year, primarily due to a slight increase in the cash and investment balances. Interestexpense primarily consists of interest from our long-term debt and customer financing arrangements. During the three months ended June 30, 2012 , thedecrease in interest expense compared to the same period in 2011, was primarily due to the capitalization of interest relating to our campus build-out. Duringthe six months ended June 30, 2012 , the increase in interest expense compared to the same period in 2011, was primarily due to the issuance of our debt nearthe end of the first quarter of 2011. Other typically consists of investment and foreign exchange gains and losses and other non-operational income andexpense items. As compared to the three and six months ended June 30, 2011 , the increase in Other was primarily due to a net gain on privately-heldinvestments of $14.8 million recorded during the three months ended June 30, 2012 .
38
Table of Contents
The effective tax rates for the three and six months ended June 30, 2012 , are similar to the federal statutory rate of 35% . The effective rates for the periodsdo not reflect the benefit of the federal R&D credit, which expired on December 31, 2011. The effective tax rates for the three and six months ended June 30,2011 differed from the federal statutory rate of 35% primarily due to the federal R&D credit and the benefit of earnings in foreign jurisdictions, which aresubject to lower tax rates.
For a further explanation of our income tax provision, see Note 13, Income Taxes, in Notes to Condensed Consolidated Financial Statements in Item 1 ofPart I of this Report.
Segment Information
For a description of the products and services for each segment, see Note 12, Segments, in Notes to Condensed Consolidated Financial Statements in Item I ofPart I of this Report.
Platform Systems Division Segment
Three Months Ended June 30, Six Months Ended June 30,
2012 2011 $ Change % Change 2012 2011 $ Change % Change
(in millions except percentages) (in millions except percentages)
PSD product revenues:
Routers $ 487.4 $ 580.6 $ (93.2) (16)% $ 945.0 $ 1,163.4 $ (218.4) (19)%
Switches 139.9 117.1 22.8 19 % 263.4 217.7 45.7 21 %
Security/other 41.8 53.8 (12.0) (22)% 88.1 105.2 (17.1) (16)%
Total PSD product revenues
669.1 751.5 (82.4) (11)% 1,296.5 1,486.3 (189.8) (13)%
PSD service revenues 202.4 165.4 37.0 22 % 399.2 329.2 70.0 21 %
Total PSD revenues $ 871.5 $ 916.9 $ (45.4) (5)% $ 1,695.7 $ 1,815.5 $ (119.8) (7)%
PSD contribution margin (*) $ 351.1 $ 415.5 $ (64.4) (15)% $ 655.8 $ 832.6 $ (176.8) (21)%
Percentage of PSD revenues 40.3% 45.3% 38.7% 45.9% _______________________________(*) A reconciliation of total segment operating income to income before taxes and noncontrolling interest can be found in Note 12, Segments, in Notes to
Condensed Consolidated Financial Statements in Item I of this Report.
During the three and six months ended June 30, 2012, PSD product revenues decreased compared to the same periods in 2011, due to lower spending by ourinternational and content service provider customers which resulted in decreased sales of our routing and security/other products. The decrease was primarilyattributable to the decline in sales of our edge legacy routing products, partially offset by the increase in the sale of our switching products.
During the three and six months ended June 30, 2012, PSD service revenues increased compared to the same periods in 2011. The increase was mainlyattributable to stronger contract renewal on support services.
PSD contribution margin as a percent of PSD revenues decreased during the three and six months ended June 30, 2012, compared to the same periods in 2011,primarily due to the decline in revenues and to a lesser extent, product mix due to higher volume of lower margin products, geographical mix, and increasedcosts as the result of new product introductions.
39
Table of Contents
Software Solutions Divisions Segment
Three Months Ended June 30, Six Months Ended June 30,
2012 2011 $ Change % Change 2012 2011 $ Change % Change
(in millions except percentages) (in millions except percentages)
SSD product revenues:
Security/other $ 117.0 $ 105.3 $ 11.7 11 % $ 239.7 $ 221.9 $ 17.8 8 %
Routing 18.6 34.7 (16.1) (46)% 40.4 60.7 (20.3) (33)%
Total SSD product revenues
135.6 140.0 (4.4) (3)% 280.1 282.6 (2.5) (1)%
SSD service revenues 66.7 63.7 3.0 5 % 130.5 124.1 6.4 5 %
Total SSD revenues $ 202.3 $ 203.7 $ (1.4) (1)% $ 410.6 $ 406.7 $ 3.9 1 %
SSD contribution margin (*) $ 74.5 $ 74.6 $ (0.1) — % $ 156.4 $ 155.7 $ 0.7 — %
Percentage of SSD revenues 36.8% 36.6% 38.1% 38.3% _______________________________(*) A reconciliation of total segment operating income to income before taxes and noncontrolling interest can be found in Note 12, Segments, in Notes to
Condensed Consolidated Financial Statement in Item I of this Report.
During the three and six months ended June 30, 2012 , SSD product revenues decreased slightly compared to the same periods in 2011. The decrease wasprimarily due to a decline in sales of our routing service products, partially offset by increased sales of our security products as a result of strong serviceprovider demand during the three and six months ended June 30, 2012 .
During the three and six months ended June 30, 2012, SSD service revenues increased compared to the same periods in 2011. The increase was mainlyattributable to stronger contract renewal on support services during the period.
SSD contribution margin as a percentage of SSD revenues was relatively flat for the three and six months ended June 30, 2012, compared to the same periodsin 2011. The increase during the three months ended June 30, 2012 was attributable to lower product royalty and higher service revenue. The decrease duringthe six months ended June 30, 2012 was primarily due to a shift in product mix toward higher sale volume of lower margin products.
Liquidity and Capital Resources
Historically, we have funded our business primarily through our operating activities and the issuance of our common stock, and more recently, the issuance oflong-term debt. The following table shows our capital resources (in millions, except percentages and days sales outstanding):
June 30,2012
December 31,2011
$ Change % Change
Working capital $ 2,776.5 $ 2,973.0 $ (196.5) (7)%
Deferred revenue $ 992.9 $ 967.0 $ 25.9 3 %
Days sales outstanding ("DSO") 34 46 (12) (26)%
Cash and cash equivalents $ 3,044.3 $ 2,910.4 $ 133.9 5 %
Short-term investments 394.5 641.3 (246.8) (38)%
Long-term investments 833.0 740.7 92.3 12 %
Total cash, cash equivalents, and investments 4,271.8 4,292.4 (20.6) — %
Long-term debt 999.1 999.0 0.1 — %
Net cash, cash equivalents, and investments $ 3,272.7 $ 3,293.4 $ (20.7) (1)%
The significant components of our working capital are cash and cash equivalents, short-term investments, and accounts receivable, reduced by accountspayable, accrued liabilities, and short-term deferred revenue. Working capital decreased by $196.5 million in the six months ended June 30, 2012, primarilydue to purchases of capital equipment, campus build-out expenditures, repurchases of our outstanding common stock under our stock repurchase programs,and cash payments for acquisitions completed during the first half of 2012.
40
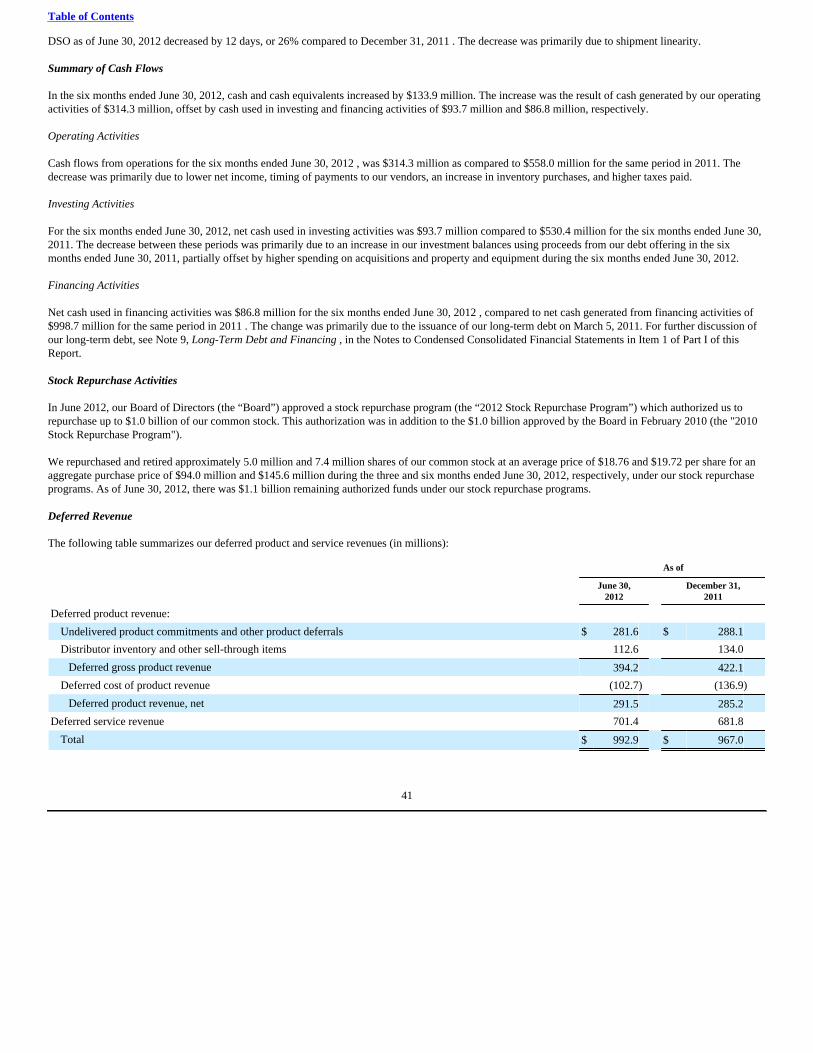
Table of Contents
DSO as of June 30, 2012 decreased by 12 days, or 26% compared to December 31, 2011 . The decrease was primarily due to shipment linearity.
Summary of Cash Flows
In the six months ended June 30, 2012, cash and cash equivalents increased by $133.9 million. The increase was the result of cash generated by our operatingactivities of $314.3 million, offset by cash used in investing and financing activities of $93.7 million and $86.8 million, respectively.
Operating Activities
Cash flows from operations for the six months ended June 30, 2012 , was $314.3 million as compared to $558.0 million for the same period in 2011. Thedecrease was primarily due to lower net income, timing of payments to our vendors, an increase in inventory purchases, and higher taxes paid.
Investing Activities
For the six months ended June 30, 2012, net cash used in investing activities was $93.7 million compared to $530.4 million for the six months ended June 30,2011. The decrease between these periods was primarily due to an increase in our investment balances using proceeds from our debt offering in the sixmonths ended June 30, 2011, partially offset by higher spending on acquisitions and property and equipment during the six months ended June 30, 2012.
Financing Activities
Net cash used in financing activities was $86.8 million for the six months ended June 30, 2012 , compared to net cash generated from financing activities of$998.7 million for the same period in 2011 . The change was primarily due to the issuance of our long-term debt on March 5, 2011. For further discussion ofour long-term debt, see Note 9, Long-Term Debt and Financing , in the Notes to Condensed Consolidated Financial Statements in Item 1 of Part I of thisReport.
Stock Repurchase Activities
In June 2012, our Board of Directors (the “Board”) approved a stock repurchase program (the “2012 Stock Repurchase Program”) which authorized us torepurchase up to $1.0 billion of our common stock. This authorization was in addition to the $1.0 billion approved by the Board in February 2010 (the "2010Stock Repurchase Program").
We repurchased and retired approximately 5.0 million and 7.4 million shares of our common stock at an average price of $18.76 and $19.72 per share for anaggregate purchase price of $94.0 million and $145.6 million during the three and six months ended June 30, 2012, respectively, under our stock repurchaseprograms. As of June 30, 2012, there was $1.1 billion remaining authorized funds under our stock repurchase programs.
Deferred Revenue
The following table summarizes our deferred product and service revenues (in millions):
As of
June 30,2012
December 31,2011
Deferred product revenue:
Undelivered product commitments and other product deferrals $ 281.6 $ 288.1
Distributor inventory and other sell-through items 112.6 134.0
Deferred gross product revenue 394.2 422.1
Deferred cost of product revenue (102.7) (136.9)
Deferred product revenue, net 291.5 285.2
Deferred service revenue 701.4 681.8
Total $ 992.9 $ 967.0
41
Table of Contents
Deferred gross product revenue as of June 30, 2012, decreased $27.9 million compared to December 31, 2011, primarily due to the release of several largeproduct commitments delivered during the six months ended June 30, 2012. Total deferred service revenue increased $19.6 million compared toDecember 31, 2011, primarily due to an increase in new service contracts and renewal of existing contracts.
Contractual Obligations
There have been no significant changes during the six months ended June 30, 2012 , to the contractual obligations disclosed in Management's Discussion andAnalysis of Financial Condition and Results of Operations, set forth in Part II, Item 7, of our Annual Report on Form 10-K for the fiscal year endedDecember 31, 2011 .
Liquidity and Capital Resource Requirements
Liquidity and capital resources may be impacted by our operating activities as well as acquisitions and investments in strategic relationships that we havemade or we may make in the future. Additionally, if we were to repurchase additional shares of our common stock under the 2012 Stock Repurchase Programand 2010 Stock Repurchase Program, our liquidity may be impacted. As of June 30, 2012 , 52% of our cash and investment balances were held outside of theU.S., which may be subject to U.S. taxes if repatriated.
In August 2010, we filed a $1.5 billion shelf registration statement with the SEC. In March 2011, we issued $1.0 billion in principle amount of senior notesunder the shelf registration statement. While we have no current plans to do so, we may issue up to $500 million in additional securities under the shelfregistration statement. The shelf registration statement is intended to give us flexibility to take advantage of financing opportunities as needed or deemeddesirable in light of market conditions. Any additional offerings of securities under the shelf registration statement will be made pursuant to a prospectus.However, such financing opportunities may not be available on terms acceptable to us or at all.
We have been focused on managing our annual equity usage as a percentage of the common stock outstanding to align with peer group competitive levels andhave made changes in recent years to reduce the number of shares underlying the equity awards we grant. For fiscal year 2012, we intend to target the numberof shares underlying equity awards granted on an annual basis at 2.75% or less of our common stock outstanding. Based upon shares underlying our grants todate of options, RSUs, and PSAs (counting only the on-target measure of such PSAs), we believe we are on track with respect to this goal for 2012.
Based on past performance and current expectations, we believe that our existing cash and cash equivalents, short-term, and long-term investments, togetherwith cash generated from operations as well as cash generated from the exercise of employee stock options and purchases under our employee stock purchaseplan will be sufficient to fund our operations and anticipated growth for at least the next 12 months. We believe our working capital is sufficient to meet ourliquidity requirements for capital expenditures, commitments, and other liquidity requirements associated with our existing operations during the same period.However, our future liquidity and capital requirements may vary materially from those now planned depending on many factors, including:
• level and mix of our product, sales, and gross profit margins;
• our business, product, capital expenditures and R&D plans;
• repurchases of our common stock;
• incurrence and repayment of debt and related interest obligations;
• litigation expenses, settlements, and judgments, or similar items related to resolution of tax audits;
• volume price discounts and customer rebates;
• accounts receivable levels that we maintain;
• acquisitions and/or funding of other businesses, assets, products, or technologies;
• changes in our compensation policies;
42
Table of Contents
• capital improvements for new and existing facilities;
• technological advances;
• our competitors' responses to our products and/or pricing;
• our relationships with supplies, partners, and customers;
• possible future investments in raw material and finished goods inventories;
• expenses related to future restructuring plans, if any;
• tax expense associated with share-based awards;
• issuance of share-based awards and the related payment in cash for withholding taxes in the current year and possibly during future years;
• level of exercises of stock options and stock purchases under our equity incentive plans; and
• general economic conditions and specific conditions in our industry and markets, including the effects of disruptions in global credit and financialmarkets, international conflicts, and related uncertainties.
Factors That May Affect Future Results
A description of the risk factors associated with our business is included under “Risk Factors” in Item 1A of Part II of this Report.
Item 3. Quantitative and Qualitative Disclosures About Market Risk
Our exposures to market risk have not changed materially since December 31, 2011. For quantitative and qualitative disclosures about market risk, see Item7A Quantitative and Qualitative Disclosures About Market Risk, in our Annual Report on Form 10-K for the year ended December 31, 2011.
Item 4. Controls and Procedures
Evaluation of Disclosure Controls and Procedures
Attached as exhibits to this report are certifications of our principal executive officer and principal financial officer, which are required in accordance withRule 13a-14 of the Securities Exchange Act of 1934, as amended (the “Exchange Act”). This “Controls and Procedures” section includes informationconcerning the controls and related evaluations referred to in the certifications and it should be read in conjunction with the certifications for a more completeunderstanding of the topics presented.
We carried out an evaluation, under the supervision and with the participation of our management, including our principal executive officer and principalfinancial officer, of the effectiveness of the design and operation of our disclosure controls and procedures, as defined in Rules 13a-15(e) and 15d-15(e) underthe Exchange Act. Based upon that evaluation, our principal executive officer and principal financial officer concluded that, as of the end of the periodcovered in this report, our disclosure controls and procedures were effective to ensure that information required to be disclosed by us in reports that we file orsubmit under the Exchange Act is recorded, processed, summarized, and reported within the time periods specified in Securities and Exchange Commissionrules and forms and is accumulated and communicated to our management, including our principal executive officer and principal financial officer, asappropriate to allow timely decisions regarding required disclosure.
Changes in Internal Controls
There were no changes in our internal control over financial reporting that occurred during the second quarter of 2012 that have materially affected, or arereasonably likely to materially affect, our internal control over financial reporting.
43
Table of Contents
Inherent Limitations on Effectiveness of Controls
Our management, including the Chief Executive Officer (“CEO”) and Chief Financial Officer (“CFO”), does not expect that our disclosure controls or ourinternal control over financial reporting will prevent or detect all error and all fraud. A control system, no matter how well designed and operated, can provideonly reasonable, not absolute, assurance that the control system’s objectives will be met. Our controls and procedures are designed to provide reasonableassurance that our control system’s objectives will be met and our CEO and CFO have concluded that our disclosure controls and procedures are effective atthe reasonable assurance level. The design of a control system must reflect the fact that there are resource constraints, and the benefits of controls must beconsidered relative to their costs. Further, because of the inherent limitations in all control systems, no evaluation of controls can provide absolute assurancethat misstatements due to error or fraud will not occur or that all control issues and instances of fraud, if any, within the Company have been detected. Theseinherent limitations include the realities that judgments in decision-making can be faulty and that breakdowns can occur because of simple error or mistake.Controls can also be circumvented by the individual acts of some persons, by collusion of two or more people, or by management override of these controls.The design of any system of controls is based in part on certain assumptions about the likelihood of future events. Projections of any evaluation of controlseffectiveness to future periods are subject to risks. Over time, controls may become inadequate because of changes in conditions or deterioration in the degreeof compliance with policies or procedures.
PART II — OTHER INFORMATION
Item 1. Legal Proceedings
The information set forth under the “Legal Proceedings” section in Note 15, Commitments and Contingencies, in Notes to Condensed Consolidated FinancialStatements in Item 1 of Part I of this Quarterly Report on Form 10-Q, is incorporated herein by reference.
Item 1A. Risk Factors
Factors That May Affect Future Results
Investments in our securities involve significant risks. The market price of our stock has historically reflected a higher multiple of earnings than many othercompanies. Accordingly, even small changes in investor expectations for our future growth and earnings, whether as a result of actual or rumored financial oroperating results, changes in the mix of the products and services sold, acquisitions, industry changes, or other factors, could trigger, and have triggered in thepast, significant fluctuations in the market price of our common stock. Investors in our securities should carefully consider all of the relevant factors disclosedby the Company, including, but not limited to, the following factors, that could affect our stock price.
Our quarterly results are unpredictable and subject to substantial fluctuations, and, as a result, we may fail to meet the expectations of securities analystsand investors, which could adversely affect the trading price of our common stock.
Our revenues and operating results may vary significantly from quarter-to-quarter due to a number of factors, many of which are outside of our control andany of which may cause our stock price to fluctuate.
The factors that may cause our quarterly results to vary quarter by quarter and be unpredictable include, but are not limited to: limited visibility into customerspending plans, changes in the mix of products and services sold, changes in geographies in which our products and services are sold, changing market andeconomic conditions, current and potential customer consolidation, competition, customer concentration, long sales and implementation cycles, regionaleconomic and political conditions, and seasonality. For example, many companies in our industry experience adverse seasonal fluctuations in customerspending, particularly in the first and third quarters.
As a result of these factors, we believe that quarter-to-quarter comparisons of operating results are not necessarily a good indication of what our futureperformance will be. It is likely that in some future quarters, our operating results may be below our guidance or the expectations of securities analysts orinvestors, in which case the price of our common stock may decline. Such a decline could occur, and has occurred in the past, even when we have met ourpublicly stated revenues and/or earnings guidance.
44
Table of Contents
Fluctuating economic conditions make it difficult to predict revenues for a particular period and a shortfall in revenues or increase in costs of productionmay harm our operating results.
Our revenues depend significantly on general economic conditions and the demand for products in the markets in which we compete. Economic weakness,customer financial difficulties, and constrained spending on network expansion and enterprise infrastructure have in the past resulted in, and may in the futureresult in, decreased revenues and earnings. Such factors could make it difficult to accurately forecast sales and operating results and could negatively affectour ability to provide accurate forecasts to our contract manufacturers and manage our contract manufacturer relationships and other expenses. In addition,concerns over the sovereign debt situation in certain countries in the European Union, as well as continued turmoil in the geopolitical environment in manyparts of the world, have and may continue to put pressure on global economic conditions, which has led, and could continue to lead, to reduced demand forour products, to delays or reductions in network expansions or infrastructure projects, and/or higher costs of production. Economic weakness may also lead tolonger collection cycles for payments due from our customers, an increase in customer bad debt, restructuring initiatives and associated expenses, andimpairment of investments. Furthermore, the continued weakness and uncertainty in worldwide credit markets, including the sovereign debt situation incertain countries in the European Union, may adversely impact the ability of our customers to adequately fund their expected capital expenditures, whichcould lead to delays or cancellations of planned purchases of our products or services. In addition, our operating expenses are largely based on anticipatedrevenue trends and a high percentage of our expenses is, and will continue to be, fixed in the short and medium term.
Uncertainty about future economic conditions also makes it difficult to forecast operating results and to make decisions about future investments. Future orcontinued economic weakness, failure of our customers and markets to recover from such weakness, customer financial difficulties, increases in costs ofproduction, and reductions in spending on network maintenance and expansion could have a material adverse effect on demand for our products andconsequently on our business, financial condition, and results of operations.
A limited number of our customers comprise a significant portion of our revenues and any decrease in revenues from these customers could have anadverse effect on our net revenues and operating results.
A substantial majority of our net revenues depend on sales to a limited number of customers and distribution partners. For example, Verizon accounted forgreater than 15% of our net revenues in the first quarter of 2012 and 12% of our net revenues in the second quarter of 2012. Changes in the businessrequirements, vendor selection, financial prospects, capital resources, and expenditures, or purchasing behavior (including product mix purchased) of our keycustomers could significantly decrease sales to such customers or could lead to delays or cancellations of planned purchases of our products or services, whichincreases the risk of quarterly fluctuations in our revenues and operating results. Any of these factors could adversely affect our business, financial condition,and results of operations.
In addition, in recent years, there has been movement towards consolidation in the telecommunications industry (for example, the acquisitions of GlobalCrossing by Level 3 Communications and Qwest Communications by CenturyLink) and that consolidation trend has continued. If our customers or partnersare parties to consolidation transactions they may suspend or indefinitely reduce their purchases of our products or other unforeseen consequences could harmour business, financial condition, and results of operations.
The long sales and implementation cycles for our products, as well as our expectation that some customers will sporadically place large orders with shortlead times, may cause our revenues and operating results to vary significantly from quarter-to-quarter.
A customer's decision to purchase certain of our products, particularly new products, involves a significant commitment of its resources and a lengthyevaluation and product qualification process. As a result, the sales cycle may be lengthy. In particular, customers making critical decisions regarding thedesign and implementation of large network deployments may engage in very lengthy procurement processes that may delay or impact expected future orders.Throughout the sales cycle, we may spend considerable time educating and providing information to prospective customers regarding the use and benefits ofour products. Even after making the decision to purchase, customers may deploy our products slowly and deliberately. Timing of deployment can vary widelyand depends on the skill set of the customer, the size of the network deployment, the complexity of the customer's network environment, and the degree ofhardware and operating system configuration necessary to deploy the products. Customers with large networks usually expand their networks in largeincrements on a periodic basis. Accordingly, we may receive purchase orders for significant dollar amounts on an irregular basis. These long cycles, as well asour expectation that customers will tend to sporadically place large orders with short lead times, both of which may be exacerbated by the impact of continuedglobal economic weakness, may cause revenues and operating results to vary significantly and unexpectedly from quarter-to-quarter.
45
Table of Contents
We face intense competition that could reduce our revenues and adversely affect our business and financial results.
Competition is intense in the markets that we address. The PSD market has historically been dominated by Cisco, with competition coming from othercompanies such as Alcatel-Lucent, Brocade, Extreme Networks, Hewlett Packard Company, and Huawei. In the SSD market, we face intense competitionfrom a broader group of companies such as Check Point, Cisco, F5 Networks, Palo Alto Networks, and Fortinet. In addition, a number of other small publicand private companies have products or have announced plans for new products to address the same challenges and markets that our products address.
In addition, actual or speculated consolidation among competitors, or the acquisition of our partners and/or resellers by competitors, can increase thecompetitive pressures faced by us as customers may delay spending decisions. For example, Ericsson acquired Redback in 2007, and Brocade acquiredFoundry Networks in 2009. A number of our competitors have substantially greater resources and can offer a wider range of products and services for theoverall network equipment market than we do. If we are unable to compete successfully against existing and future competitors on the basis of productofferings or price, we could experience a loss in market share and revenues and/or be required to reduce prices, which could reduce our gross margins, andwhich could materially and adversely affect our business, financial condition, and results of operations.
We expect our gross margins to vary over time, and the level of product gross margins achieved by us in recent years may not be sustainable.
We expect our product gross margins to vary from quarter-to-quarter, and the gross margins we have achieved in recent years may not be sustainable and maybe adversely affected in the future by numerous factors, including customer, product and geographic mix shifts, increased price competition in one or more ofthe markets in which we compete, increases in material or labor costs, increases in inventory carrying costs, excess product component or obsolescencecharges from our contract manufacturers, increased costs due to changes in component pricing or charges incurred due to component holding periods if we donot accurately forecast product demand, warranty related issues, or our introduction of new products or entry into new markets with different pricing and coststructures.
If we receive product orders late in a quarter, we may be unable to recognize revenue for these orders in the same period, which could adversely affect ourquarterly revenues.
Generally, our PSD products are not stocked by distributors or resellers due to their cost and complexity and configurations required by our customers, and wegenerally build such products as orders are received. In recent years, the volume of orders received late in any given fiscal quarter has generally continued toincrease but remains unpredictable. If orders for certain products are received late in any quarter, we may not be able to build, ship, and recognize revenue forthese orders in the same period, which could adversely affect our ability to meet our expected revenues for such quarter. Additionally, we determine ouroperating expenses largely on the basis of anticipated revenues and a high percentage of our expenses are fixed in the short and medium term. As a result, afailure or delay in generating or recognizing revenue could cause significant variations in our operating results and operating margin from quarter-to-quarter.
We rely on value-added and other resellers, as well as distribution partners, to sell our products, and disruptions to, or our failure to effectively developand manage our distribution channel and the processes and procedures that support it could adversely affect our ability to generate revenues from thesale of our products.
Our future success is highly dependent upon establishing and maintaining successful relationships with a variety of value-added and other reseller anddistribution partners, including our worldwide strategic partners such as Ericsson, IBM, and NSN. The majority of our revenues are derived through value-added resellers and distributors, most of which also sell our competitors’ products, and some of which sell their own products that compete with our products.Our revenues depend in part on the performance of these partners. The loss of or reduction in sales to our value-added resellers or distributors could materiallyreduce our revenues. For example, in 2006, one of our largest resellers, Lucent, was acquired by Alcatel, a competitor of ours. As a result of the merger,Lucent became a competitor, their resale of our products declined, and we ultimately terminated our reseller agreement with Lucent. Our competitors may insome cases be effective in leveraging their market share positions or in providing incentives to current or potential resellers and distributors to favor theirproducts or to prevent or reduce sales of our products. If we fail to develop and maintain relationships with our partners, fail to develop new relationships withvalue-added resellers and distributors in new markets, or expand the number of distributors and resellers in existing markets, fail to manage, train or motivateexisting value-added resellers and distributors effectively, or if these partners are not successful in their sales efforts, sales of our products may decrease, andour business, financial condition, and results of operations would suffer.
46
Table of Contents
In addition, we recognize a portion of our revenues based on a sell-through model using information provided by our distributors. If those distributors provideus with inaccurate or untimely information, the amount or timing of our revenues could be adversely impacted.
Further, in order to develop and expand our distribution channel, we must continue to offer attractive channel programs to potential partners and scale andimprove our processes and procedures that support the channel. As a result, our programs, processes and procedures may become increasingly complex andinherently difficult to manage. We have previously entered into OEM agreements with partners pursuant to which they rebrand and resell our products as partof their product portfolios. These types of relationships are complex and require additional processes and procedures that may be challenging and costly toimplement, maintain and manage. Our failure to successfully manage and develop our distribution channel and the programs, processes and procedures thatsupport it could adversely affect our ability to generate revenues from the sale of our products.
Our ability to process orders and ship products in a timely manner is dependent in part on our business systems and performance of the systems andprocesses of third parties such as our contract manufacturers, suppliers, or other partners, as well as the interfaces between our systems and the systemsof such third parties. If our systems, the systems and processes of those third parties, or the interfaces between them experience delays or fail, ourbusiness processes and our ability to build and ship products could be impacted, and our financial results could be harmed.
Some of our business processes depend upon our information technology ("IT") systems, the systems, and processes of third parties, and on the interfaces ofour systems with the systems of third parties. For example, our order entry system feeds information into the systems of our contract manufacturers, whichenables them to build and ship our products. If those systems fail or are interrupted, our processes may function at a diminished level or not at all. This couldnegatively impact our ability to ship products or otherwise operate our business, and our financial results could be harmed. For example, although it did notadversely affect our shipments, an earthquake in late December of 2006 disrupted our communications with China, where a significant part of ourmanufacturing occurs.
We also rely upon the performance of the systems and processes of our contract manufacturers to build and ship our products. If those systems and processesexperience interruption or delay, our ability to build and ship our products in a timely manner may be harmed. For example, as we have expanded our contractmanufacturing base to China, we have experienced instances where our contract manufacturer was not able to ship products in the time periods expected byus. If we are not able to ship our products or if product shipments are delayed, our ability to recognize revenue in a timely manner for those products would beaffected and our financial results could be harmed.
Telecommunications companies and our other large customers generally require more onerous terms and conditions in our contracts with them. As weseek to sell more products to such customers, we may be required to agree to terms and conditions that could have an adverse effect on our business orability to recognize revenues. Telecommunications service provider companies, which comprise a significant portion of our customer base, and other large companies, because of their size,generally have greater purchasing power and, accordingly, have requested and received more favorable terms from others, which often translate into moreonerous terms and conditions from us. Recently, France Telecom-Orange and Deutsche Telekom AG have formed a company for the purpose of purchasingproducts from, and negotiating more favorable contractual terms with, suppliers. As we seek to sell more products to this class of customer, we may berequired to agree to such terms and conditions, which may include terms that affect the timing of our ability to recognize revenue and have an adverse effecton our business, financial condition, and results of operations. Consolidation among such large customers can further increase their buying power and abilityto require onerous terms. For example, customers in this class have purchased products from other vendors who promised but failed to deliver certain functionality and/or had productsthat caused problems or outages in the networks of these customers. As a result, these customers may request additional features from us and requiresubstantial penalties for failure to deliver such features or may require substantial penalties for any network outages that may be caused by our products.These additional requests and penalties, if we are required to agree to them, may require us to defer revenue recognition from such sales, which maynegatively affect our business, financial condition, and results of operations.
47
Table of Contents
We are dependent on sole source and limited source suppliers for several key components, which makes us susceptible to shortages or price fluctuationsin our supply chain, and we may face increased challenges in supply chain management in the future. During periods of high demand for electronic products, component shortages are possible, and the predictability of the availability of such components maybe limited. Any future growth in our business and the economy is likely to create greater pressures on us and our suppliers to accurately forecast overallcomponent demand and to establish optimal component levels. If shortages or delays persist, the price of these components may increase, or the componentsmay not be available at all. We may not be able to secure enough components at reasonable prices or of acceptable quality to build new products in a timelymanner, and our revenues and gross margins could suffer until other sources can be developed. For example, from time to time, we have experiencedcomponent shortages that resulted in delays of product shipments. We currently purchase numerous key components, including ASICs, from single or limitedsources. The development of alternate sources for those components is time-consuming, difficult, and costly. In addition, the lead times associated withcertain components are lengthy and preclude rapid changes in quantities and delivery schedules. Also, long-term supply and maintenance obligations tocustomers increase the duration for which specific components are required, which may further increase the risk of component shortages or the cost ofcarrying inventory. In the event of a component shortage or supply interruption from these suppliers, we may not be able to develop alternate or secondsources in a timely manner. If we are unable to buy these components in quantities sufficient to meet our requirements on a timely basis, we will not be able todeliver product to our customers, which would seriously affect present and future sales, which would, in turn, adversely affect our business, financialcondition, and results of operations. In addition, the development, licensing, or acquisition of new products in the future may increase the complexity of supply chain management. Failure toeffectively manage the supply of key components and products would adversely affect our business.
System security risks, data protection breaches, and cyber-attacks could compromise our proprietary information, disrupt our internal operations andharm public perception of our security products, which could cause our business and reputation to suffer and adversely affect our stock price. In the ordinary course of business, we store sensitive data, including intellectual property, our proprietary business information and that of our customers,suppliers and business partners on our networks. The secure maintenance of this information is critical to our operations and business strategy. Increasingly,companies, including Juniper Networks, are subject to a wide variety of attacks on their networks on an ongoing basis. Despite our security measures, JuniperNetworks' information technology and infrastructure may be vulnerable to penetration or attacks by computer programmers and hackers, or breached due toemployee error, malfeasance or other disruptions. Any such breach could compromise our networks, creating system disruptions or slowdowns and exploitingsecurity vulnerabilities of our products, and the information stored on our networks could be accessed, publicly disclosed, lost or stolen, which could subjectus to liability to our customers, suppliers, business partners and others, and cause us reputational and financial harm. In addition, sophisticated hardware andoperating system software and applications that we produce or procure from third parties may contain defects in design or manufacture, including "bugs" andother problems that could unexpectedly interfere with the operation of our networks.
If an actual or perceived breach of network security occurs in our network or in the network of a customer of our security products, regardless of whether thebreach is attributable to our products, the market perception of the effectiveness of our products could be harmed. Because the techniques used by computerprogrammers and hackers, many of whom are highly sophisticated and well-funded, to access or sabotage networks change frequently and generally are notrecognized until after they are used, we may be unable to anticipate or immediately detect these techniques. This could impede our sales, manufacturing,distribution or other critical functions. In addition, the economic costs to us to eliminate or alleviate cyber or other security problems, bugs, viruses, worms,malicious software systems and security vulnerabilities could be significant and may be difficult to anticipate or measure because the damage may differbased on the identity and motive of the programmer or hacker, which are often difficult to identify.
Regulation of the telecommunications industry could harm our operating results and future prospects.
The traditional telecommunications industry is highly regulated, and our business and financial condition could be adversely affected by changes inregulations relating to the Internet telecommunications industry. Currently, there are few laws or regulations that apply directly to access to or commerce onIP networks, but future regulations could include sales taxes on products sold via the Internet and Internet service provider access charges. We could beadversely affected by regulation of IP networks and commerce in any country where we market equipment and services to service or content providers.Regulations governing the range of services and business models that can be offered by service providers or content providers could
48
Table of Contents
adversely affect those customers' needs for products designed to enable a wide range of such services or business models. For instance, the U.S. FederalCommunications Commission has issued regulations governing aspects of fixed broadband networks and wireless networks; these regulations might impactservice provider and content provider business models and as such, providers' needs for Internet telecommunications equipment and services. In addition,many jurisdictions are evaluating or implementing regulations relating to cyber security, supply chain integrity, privacy and data protection, which can affectthe market and requirements for networking and security equipment.
In addition, environmental regulations relevant to electronic equipment manufacturing or operations may impact our business and financial conditionadversely. For instance, the European Union has adopted WEEE and ROHS regulations, which require producers of electrical and electronic equipment toassume responsibility for collecting, treating, recycling and disposing of products when they have reached the end of their useful life, and REACHregulations, which regulate handling of certain chemical substances that may be used in our products. In addition, some governments have regulationsprohibiting government entities from purchasing security products that do not meet specified indigenous certification criteria, even though those criteria maybe in conflict with accepted international standards. Similar regulations are in effect or under consideration in several jurisdictions where we do business.
The adoption and implementation of such regulations could decrease demand for our products, increase the cost of building and selling our products, impactour ability to ship products into affected areas and recognize revenue in a timely manner and require us to spend significant time and expense to comply. Anyof these impacts could have a material adverse effect on our business, financial condition, and results of operations.
Governmental regulations affecting the import or export of products or affecting products containing encryption capabilities could negatively affect ourrevenues.
Certain of our products contain or use encryption technology. The United States and various foreign governments have imposed controls, export licenserequirements, and restrictions on the import or export, among other things, encryption technology. In addition, from time to time, governmental agencies haveproposed additional regulation of encryption technology, such as requiring certification, notifications, review of source code, or the escrow and governmentalrecovery of private encryption keys. For example, Russia and China recently have implemented new requirements relating to products containing encryptionand India has imposed special warranty and other obligations associated with technology deemed critical. Governmental regulation of encryption or IPnetworking technology and regulation of imports or exports, or our failure to obtain required import or export approval for our products, could harm ourinternational and domestic sales and adversely affect our revenues. In addition, failure to comply with such regulations could result in penalties, costs, andrestrictions on import or export privileges or adversely affect sales to government agencies or government-funded projects.
If we do not successfully anticipate technological shifts, market needs and opportunities, and develop products and product enhancements that meet thosetechnological shifts, needs and opportunities, or if those products are not made available in a timely manner or do not gain market acceptance, we maynot be able to compete effectively and our ability to generate revenues will suffer.
We cannot guarantee that we will be able to anticipate future technological shifts, market needs and opportunities or be able to develop new products orproduct enhancements to meet such technological shifts, needs or opportunities in a timely manner or at all. If we fail to anticipate market requirements or failto develop and introduce new products or product enhancements to meet those needs in a timely manner, it could cause us to lose customers, and such failurecould substantially decrease or delay market acceptance and sales of our present and future products, which would significantly harm our business, financialcondition, and results of operations. Even if we are able to anticipate, develop, and commercially introduce new products and enhancements, there can be noassurance that new products or enhancements will achieve widespread market acceptance.
For example, in connection with the acquisitions of Altor and Trapeze in 2010, we are now offering a virtualization security product and a WLAN product.Additionally, in 2011, we announced our new data center product, the QFabric™ solution, our mobility solutions with our MobileNextTM software and ourConverged Supercore product, which converges the optical and packet layers of the network. If these or other new products do not gain market acceptance at asufficient rate of growth, our ability to meet future financial targets may be adversely affected. In addition, if we fail to achieve market acceptance at asufficient rate of growth, our ability to meet future financial targets and aspirations may be adversely affected. Finally, if we fail to deliver new or announcedproducts to the market in a timely manner, it could adversely affect the market acceptance of those products and harm our competitive position and ourbusiness and financial results.
49
Table of Contents
Our ability to develop, market, and sell products could be harmed if we are unable to retain or hire key personnel. Our future success depends upon our ability to recruit and retain the services of executive, engineering, sales and marketing, and support personnel. Thesupply of highly qualified individuals, in particular engineers in very specialized technical areas, or sales people specializing in the service provider andenterprise markets, is limited and competition for such individuals is intense. None of our officers or key employees is bound by an employment agreementfor any specific term. The loss of the services of any of our key employees, the inability to attract or retain personnel in the future or delays in hiring requiredpersonnel, particularly engineers and sales people, and the complexity and time involved in replacing or training new employees, could delay the developmentand introduction of new products, and negatively impact our ability to market, sell, or support our products.
Changes in effective tax rates or adverse outcomes resulting from examination of our income or other tax returns could adversely affect our results.
Our future effective tax rates could be volatile and maybe adversely affected by: earnings being lower than anticipated in countries where we have lowerstatutory rates and higher than anticipated earnings in countries where we have higher statutory rates; changes in the valuation of our deferred tax assets andliabilities; expiration of, or lapses in, the R&D tax credit laws applicable to us; transfer pricing adjustments related to certain acquisitions, including thelicense of acquired intangibles under our intercompany R&D cost sharing arrangement; tax effects of share-based compensation; costs related tointercompany restructurings; or changes in tax laws, regulations, accounting principles, or interpretations thereof. In addition, we are subject to the continuousexamination of our income tax returns by the Internal Revenue Service (“IRS”) and other tax authorities. We regularly assess the likelihood of adverseoutcomes resulting from these examinations to determine the adequacy of our provision for income taxes. There can be no assurance that the outcomes fromthese continuous examinations will not have an adverse effect on our business, financial condition, and results of operations. From time to time, we receive preliminary notices of deficiency or notices of proposed adjustments from the IRS claiming that we owe additional taxes, plusinterest and possible penalties. For example, we received a preliminary notice of deficiency in 2011 and one in 2009 for prior tax years based on transferpricing transactions related to the license of acquired intangibles under an intercompany R&D cost sharing arrangement. As a result of the preliminary noticesof deficiency received in 2011 and 2009, the incremental tax liability would be approximately $92.0 million and $807.0 million, excluding interest andpenalties, respectively. We believe the IRS' position with regard to these matters is inconsistent with applicable tax laws, judicial precedent and existingTreasury regulations, and that our previously reported income tax provisions for the years in question are appropriate. However, there can be no assurance thatthese matters will be resolved in our favor. Regardless of whether these matters are resolved in our favor, the final resolution of these matters could beexpensive and time-consuming to defend and/or settle. While we believe we have provided adequately for these matters, there is a possibility that an adverseoutcome of these matters individually or in the aggregate could have a material effect on our results of operations and financial condition.
If we fail to accurately predict our manufacturing requirements, we could incur additional costs or experience manufacturing delays, which would harmour business.
We provide demand forecasts to our contract manufacturers and the manufacturers order components and plan capacity based on these forecasts. If weoverestimate our requirements, our contract manufacturers may assess charges, or we may have liabilities for excess inventory, each of which couldnegatively affect our gross margins. Conversely, because lead times for required materials and components vary significantly and depend on factors such asthe specific supplier, contract terms, and the demand for each component at a given time, if we underestimate our requirements, as we did in the third quarterof 2010 with respect to certain components, our contract manufacturers may have inadequate time, materials, and/or components required to produce ourproducts, which could increase costs or could delay or interrupt manufacturing of our products and result in delays in shipments and deferral or loss ofrevenues.
We are dependent on contract manufacturers with whom we do not have long-term supply contracts, and changes to those relationships, expected orunexpected, may result in delays or disruptions that could cause us to lose revenues and damage our customer relationships.
We depend on independent contract manufacturers (each of which is a third-party manufacturer for numerous companies) to manufacture our products.Although we have contracts with our contract manufacturers, these contracts do not require them to manufacture our products on a long-term basis in anyspecific quantity or at any specific price. In addition, it is time-consuming and costly to qualify and implement additional contract manufacturer relationships.Therefore, if we fail to effectively manage our contract manufacturer relationships, or if one or more of them experiences delays, disruptions, or qualitycontrol problems
50
Table of Contents
in our manufacturing operations, or if we had to change or add additional contract manufacturers or contract manufacturing sites, our ability to ship productsto our customers could be delayed. Also, the addition of manufacturing locations or contract manufacturers would increase the complexity of our supply chainmanagement. Moreover, an increasing portion of our manufacturing is performed in China and other countries and is therefore subject to risks associated withdoing business in other countries. Each of these factors could adversely affect our business, financial condition, and results of operations.
Upgrades to key internal systems and processes, and problems with the design or implementation of these systems and processes could interfere with, andtherefore harm, our business and operations.
We previously initiated a multi-year project to upgrade certain key internal systems and processes, including our company-wide human resourcesmanagement system, our customer relationship management (“CRM”) system and enterprise resource planning (“ERP”) system. In the first quarter of 2010,we implemented a major upgrade of our CRM system. In 2012 and 2013, we expect to implement major changes to our ERP system. We have invested, andwill continue to invest, significant capital and human resources in the design and implementation of these systems and processes. Any disruptions or delays inthe design and implementation of the new systems or processes, particularly any disruptions or delays that impact our operations, could adversely affect ourability to process customer orders, ship products, provide service and support to our customers, bill and track our customers, fulfill contractual obligations,record and transfer information in a timely and accurate manner, file SEC reports in a timely manner, or otherwise run our business. Even if we do notencounter these adverse effects, the design and implementation of these new systems and processes may be much more costly than we anticipated. If we areunable to successfully design and implement these new systems and processes as planned, or if the implementation of these systems and processes is morecostly than anticipated, our business, financial condition, and results of operations could be negatively impacted.
We are a party to lawsuits, proceedings, and other disputes, which are costly to defend and, if determined adversely to us, could require us to pay damagesor prevent us from taking certain actions, any or all of which could harm our business, financial condition, and results of operations.
We, and certain of our current and former officers and current and former members of our Board of Directors, are subject to various lawsuits. We have beenserved with lawsuits related to employment matters, commercial transactions and patent infringement as well as securities laws, a description of the securitieslawsuits can be found in Note 15, Commitments and Contingencies, in Notes to Condensed Consolidated Financial Statements of this Quarterly Report onForm 10-Q, under the heading “Legal Proceedings.” There can be no assurance that these or any actions that have been or may in the future be brought againstus, our officers, and our directors will be resolved favorably or that tentative settlements will become final. Regardless of whether they are resolved, theselawsuits are, and any future lawsuits or threatened legal proceedings to which we, our officers, or our directors may become a party will likely be, expensiveand time-consuming to defend, settle, and/or resolve. Legal proceedings, threatened legal proceedings or investigations, regardless of their ultimate outcome,could harm our reputation. Costs of defense, as well as any losses resulting from these claims or settlement of these claims, could significantly increase ourexpenses and could harm our business, financial condition, and results of operations.
We are a party to litigation and claims regarding intellectual property rights, resolution of which may be time- consuming and expensive, as well asrequire a significant amount of resources to prosecute, defend, or make our products non-infringing.
Third parties have asserted and may in the future assert claims or initiate litigation related to patent, copyright, trademark, and other intellectual propertyrights to technologies and related standards that are relevant to our products. The asserted claims and/or initiated litigation may include claims against us orour manufacturers, suppliers, partners, or customers, alleging that our products or services infringe proprietary rights. Regardless of the merit of these claims,they have been and can be time-consuming, result in costly litigation, and may require us to develop non-infringing technologies or enter into licenseagreements. Furthermore, because of the potential for high awards of damages or injunctive relief that are not necessarily predictable, even arguablyunmeritorious claims may be settled for significant amounts of money. If any infringement or other intellectual property claim made against us by any third-party is successful, if we are required to settle litigation for significant amounts of money, or if we fail to develop non-infringing technology or licenserequired proprietary rights on commercially reasonable terms and conditions, our business, financial condition, and results of operations could be materiallyand adversely affected.
We may face difficulties enforcing our proprietary rights.
We generally rely on patents, copyrights, trademarks, and trade secret laws to establish and maintain proprietary rights in our technology and products.Although we have been issued numerous patents and other patent applications are currently now
51
Table of Contents
pending, there can be no assurance that any of these patents or other proprietary rights will not be challenged, invalidated, or circumvented or that our rightswill, in fact, provide competitive advantages to us or protect our technology. Furthermore, the laws of some foreign countries may not protect our proprietaryrights to the same extent as do the laws of the United States. The outcome of any actions taken in these foreign countries may be different than if such actionswere determined under the laws of the United States. Although we are not dependent on any individual patents or group of patents for particular segments ofthe business for which we compete, if we are unable to protect our proprietary rights in a market, we may find ourselves at a competitive disadvantage toothers who need not incur the substantial expense, time, and effort required to create innovative products that have enabled our success.
Our success depends upon our ability to effectively plan and manage our resources and restructure our business through rapidly fluctuating economicand market conditions.
Our ability to successfully offer our products and services in a rapidly evolving market requires an effective planning, forecasting, and management process toenable us to effectively scale and adjust our business in response to fluctuating market opportunities and conditions. In periods of market expansion, we haveincreased investment in our business by, for example, increasing headcount and increasing our investment in R&D, sales and marketing, and other parts of ourbusiness as we have in the 2011 fiscal year and in the first quarter of 2012. Conversely, during 2009, in response to downward trending industry and marketconditions, we restructured our business, rebalanced our workforce, and reduced our real estate portfolio. Many of our expenses, such as real estate expenses,cannot be rapidly or easily adjusted because of fluctuations in our business or numbers of employees. Moreover, rapid changes in the size of our workforcecould adversely affect our ability to develop and deliver products and services as planned or impair our ability to realize our current or future businessobjectives.
We are subject to risks arising from our international operations, which may adversely affect our business, financial condition, and results of operations.
We derive a majority of our revenues from our international operations, and we plan to continue expanding our business in international markets in the future.We conduct significant sales and customer support operations directly and indirectly through our distributors and value-added resellers in countriesthroughout the world and depend on the operations of our contract manufacturers and suppliers that are located outside of the United States. In addition, aportion of our R&D and our general and administrative operations are conducted outside the United States. In some countries, we may experience reducedintellectual property protection. As a result of our international operations, we are affected by economic, regulatory, social, and political conditions in foreign countries, including changes ingeneral IT spending, the imposition of government controls, including critical infrastructure protection, changes or limitations in trade protection laws, otherregulatory requirements, which may affect our ability to import or export our products from various countries, service provider and government spendingpatterns affected by political considerations, unfavorable changes in tax treaties or laws, natural disasters, epidemic disease, labor unrest, earnings expatriationrestrictions, misappropriation of intellectual property, military actions, acts of terrorism, political and social unrest and difficulties in staffing and managinginternational operations. Any or all of these factors could have a material adverse impact on our business, financial condition, and results of operations. Moreover, local laws and customs in many countries differ significantly from those in the United States. In many foreign countries, particularly in those withdeveloping economies, it is common for others to engage in business practices that are prohibited by our internal policies and procedures or United Statesregulations applicable to us. There can be no assurance that our employees, contractors, channel partners, and agents will not take actions in violation of ourpolicies and procedures, which are designed to ensure compliance with U.S. and foreign laws and policies. Violations of laws or key control policies by ouremployees, contractors, channel partners, or agents could result in financial reporting problems, fines, penalties, or prohibition on the importation orexportation of our products, and could have a material adverse effect on our business, financial condition and results of operations.
We are exposed to fluctuations in currency exchange rates, which could negatively affect our financial condition and results of operations.
Because a majority of our business is conducted outside the United States, we face exposure to adverse movements in non-U.S. currency exchange rates.These exposures may change over time as business practices evolve and could have a material adverse impact on our financial condition and results ofoperations.
52
Table of Contents
The majority of our revenues and expenses are transacted in U.S. Dollars. We also have some transactions that are denominated in foreign currencies,primarily the British Pound, Euro, Indian Rupee, and Japanese Yen related to our sales and service operations outside of the United States. An increase in thevalue of the U.S. Dollar could increase the real cost to our customers of our products in those markets outside the United States in which we sell in U.S.Dollars, and a weakened U.S. Dollar could increase the cost of local operating expenses and procurement of raw materials to the extent we must purchasecomponents in foreign currencies.
Currently, we hedge only those currency exposures associated with certain assets and liabilities denominated in nonfunctional currencies and periodicallyhedge anticipated foreign currency cash flows. The hedging activities undertaken by us are intended to offset the impact of currency fluctuations on certainnonfunctional currency assets and liabilities. However, no amount of hedging can be effective against all circumstances, including long-term declines in thevalue of the U.S. Dollar. If our attempts to hedge against these risks are not successful, or if long-term declines in the value of the U.S. Dollar persist, ourfinancial condition and results of operations could be adversely impacted.
Integration of acquisitions could disrupt our business and harm our financial condition and stock price and may dilute the ownership of our stockholders.
We have made, and may continue to make, acquisitions in order to enhance our business. For example, in February 2012, we acquired Mykonos, and in 2010we acquired Altor, Trapeze, SMobile, and Ankeena. Acquisitions involve numerous risks, including problems combining the purchased operations,technologies or products, unanticipated costs, diversion of management's attention from our core businesses, adverse effects on existing business relationshipswith suppliers and customers, risks associated with entering markets in which we have no or limited prior experience, and potential loss of key employees.There can be no assurance that we will be able to integrate successfully any businesses, products, technologies, or personnel that we might acquire. Theintegration of businesses that we may acquire is likely to be a complex, time-consuming, and expensive process and we may not realize the anticipatedrevenues or other benefits associated with our acquisitions if we fail to successfully manage and operate the acquired business. If we fail in any acquisitionintegration efforts and are unable to efficiently operate as a combined organization utilizing common information and communication systems, operatingprocedures, financial controls, and human resources practices, our business, financial condition, and results of operations may be adversely affected.
Acquisitions may also require us to issue common stock or assume equity awards that dilute the ownership of our current stockholders, use a substantialportion of our cash resources, assume liabilities, record goodwill and amortizable intangible assets that will be subject to impairment testing on a regular basisand potential periodic impairment charges, incur amortization expenses related to certain intangible assets, and incur large and immediate write-offs andrestructuring and other related expenses, all of which could harm our financial condition and results of operations.
If we fail to adequately evolve our financial and managerial control and reporting systems and processes, our ability to manage and grow our businesswill be negatively affected.
Our ability to successfully offer our products and implement our business plan in a rapidly evolving market depends upon an effective planning andmanagement process. We will need to continue to improve our financial and managerial control and our reporting systems and procedures in order to manageour business effectively in the future. If we fail to continue to implement improved systems and processes, our ability to manage our business, financialcondition, and results of operations may be negatively affected.
Our financial condition and results of operations could suffer if there is an additional impairment of goodwill or other intangible assets with indefinitelives.
We are required to test annually and review on an interim basis, our goodwill and intangible assets with indefinite lives, including the goodwill associatedwith past acquisitions and any future acquisitions, to determine if impairment has occurred. As of June 30, 2012, our goodwill was $3,987.7 million. If suchassets are deemed impaired, an impairment loss equal to the amount by which the carrying amount exceeds the fair value of the assets would be recognized.This would result in incremental expenses for that quarter, which would reduce any earnings or increase any loss for the period in which the impairment wasdetermined to have occurred. For example, such impairment could occur if the market value of our common stock falls below certain levels for a sustainedperiod, or if the portions of our business related to companies we have acquired fail to grow at expected rates or decline. In the second quarter of 2006, ourimpairment evaluation resulted in a reduction of $1,280.0 million to the carrying value of goodwill on our balance sheet, primarily due to the decline in ourmarket capitalization that occurred over a period of approximately nine months prior to the impairment review and, to a lesser extent, a decrease in
53
Table of Contents
forecasted future cash flows. In recent years, economic weakness contributed to extreme price and volume fluctuations in global stock markets that reducedthe market price of many technology company stocks, including ours. Future declines in our stock price, as well as any marked decline in our level ofrevenues or gross margins, increase the risk that goodwill and intangible assets may become impaired in future periods. We cannot accurately predict theamount and timing of any impairment of assets.
Our products are highly technical and if they contain undetected errors or malware or do not meet customer quality expectations, our business could beadversely affected, and we may be subject to lawsuits or be required to pay damages in connection with any alleged or actual failure of our products andservices.
Our products are highly technical and complex, are critical to the operation of many networks, and, in the case of our security products, provide and monitornetwork security and may protect valuable information. Our products have contained and may contain one or more undetected errors, defects, or securityvulnerabilities. Some errors in our products may only be discovered after a product has been installed and used by end-customers. Any errors, defects,malware or security vulnerabilities discovered in our products after commercial release could result in monetary penalties, loss of revenues or delay inrevenue recognition, loss of customers, loss of future business and reputation, penalties, and increased service and warranty cost, any of which couldadversely affect our business, financial condition, and results of operations. In addition, in the event an error, defect, malware, or vulnerability is attributableto a component supplied by a third-party vendor, we may not be able to recover from the vendor all of the costs of remediation that we may incur. In addition,we could face claims for product liability, tort, or breach of warranty. Defending a lawsuit, regardless of its merit, is costly and may divert management’sattention. If our business liability insurance coverage is inadequate, or future coverage is unavailable on acceptable terms or at all, our financial condition andresults of operations could be harmed. Moreover, if our products fail to satisfy our customers' quality expectations for whatever reason, the perception of andthe demand for our products could be adversely affected.
If our products do not interoperate with our customers’ networks, installations will be delayed or cancelled and could harm our business.
Our products are designed to interface with our customers’ existing networks, each of which have different specifications and utilize multiple protocolstandards and products from other vendors. Many of our customers’ networks contain multiple generations of products that have been added over time asthese networks have grown and evolved. Our products must interoperate with many or all of the products within these networks as well as future products inorder to meet our customers’ requirements. If we find errors in the existing software or defects in the hardware used in our customers’ networks, we may needto modify our software or hardware to fix or overcome these errors so that our products will interoperate and scale with the existing software and hardware,which could be costly and could negatively affect our business, financial condition, and results of operations. In addition, if our products do not interoperatewith those of our customers’ networks, demand for our products could be adversely affected or orders for our products could be cancelled. This could hurt ouroperating results, damage our reputation, and seriously harm our business and prospects.
Our products incorporate and rely upon licensed third-party technology, and if licenses of third-party technology do not continue to be available to us orbecome very expensive, our revenues and ability to develop and introduce new products could be adversely affected.
We integrate licensed third-party technology into certain of our products. From time to time, we may be required to license additional technology from third-parties to develop new products or product enhancements. Third-party licenses may not be available or continue to be available to us on commerciallyreasonable terms. The failure to comply with the terms of any license may result in our inability to continue to use such license. Our inability to maintain orre-license any third-party licenses required in our products or our inability to obtain third-party licenses necessary to develop new products and productenhancements, could require us, if possible, to develop substitute technology or obtain substitute technology of lower quality or performance standards or at agreater cost, any of which could delay or prevent product shipment and harm our business, financial condition, and results of operations.
We sell our products to customers that use those products to build networks and IP infrastructure, and if the demand for network and IP systems does notcontinue to grow, then our business, financial condition, and results of operations could be adversely affected.
A substantial portion of our business and revenues depends on the growth of secure IP infrastructure and on the deployment of our products by customers thatdepend on the continued growth of IP services. As a result of changes in the economy capital spending or the building of network capacity in excess ofdemand, all of which have in the past particularly affected
54
Table of Contents
telecommunications service providers, spending on IP infrastructure can vary, which could have a material adverse effect on our business, financial condition,and results of operations. In addition, a number of our existing customers are evaluating the build out of their next generation networks. During the decision-making period when the customers are determining the design of those networks and the selection of the equipment they will use in those networks, suchcustomers may greatly reduce or suspend their spending on secure IP infrastructure. Such delays in purchases can make it more difficult to predict revenuesfrom such customers, can cause fluctuations in the level of spending by these customers and, even where our products are ultimately selected, can have amaterial adverse effect on our business, financial condition, and results of operations.
While we believe that we currently have adequate internal control over financial reporting, we are exposed to risks from legislation requiring companiesto evaluate those internal controls.
Section 404 of the Sarbanes-Oxley Act of 2002 requires our management to report on, and our independent auditors to attest to, the effectiveness of ourinternal control over financial reporting. We have an ongoing program to perform the system and process evaluation and testing necessary to comply withthese requirements. We have and will continue to incur significant expenses and devote management resources to Section 404 compliance on an ongoingbasis. In the event that our Chief Executive Officer, Chief Financial Officer, or independent registered public accounting firm determine in the future that, ourinternal controls over financial reporting are not effective as defined under Section 404, investor perceptions may be adversely affected if our financialstatements are not reliable and could cause a decline in the market price of our stock and otherwise negatively affect our liquidity and financial condition.
The investment of our cash balance and our investments in government and corporate debt securities are subject to risks, which may cause losses andaffect the liquidity of these investments.
At June 30, 2012 , we had $3,044.3 million in cash and cash equivalents and $1,227.5 million in short- and long-term investments. We have invested theseamounts primarily in U.S. government securities, government-sponsored enterprise obligations, foreign government debt securities, corporate notes andbonds, commercial paper, and money market funds meeting certain criteria. Certain of these investments are subject to general credit, liquidity, market, andinterest rate risks, which may be exacerbated by U.S. sub-prime mortgage defaults that have affected various sectors of the financial markets and caused creditand liquidity issues at many financial institutions. Our future investment income may fall short of expectations due to changes in interest rates or if the declinein fair value of our publicly traded debt or equity investments is judged to be other-than-temporary. These market risks associated with our investmentportfolio may have a negative adverse effect on our liquidity, financial condition, and results of operations.
We may be unable to generate the cash flow to service our debt obligations, including the Senior Notes.
In March 2011, we issued senior unsecured notes for an aggregate principle amount of $1.0 billion (see discussion in Note 9, Long-Term Debt and Financing,in the Notes to Condensed Consolidated Financial Statements). We may not be able to generate sufficient cash flow to enable us to service our indebtedness,including the notes, or to make anticipated capital expenditures. Our ability to pay our expenses and satisfy our debt obligations, refinance our debtobligations and fund planned capital expenditures will depend on our future performance, which will be affected by general economic, financial, competitive,legislative, regulatory and other factors beyond our control. Based upon current levels of operations, we believe cash flow from operations and available cashwill be adequate for the foreseeable future to meet our anticipated requirements for working capital, capital expenditures and scheduled payments of principaland interest on our indebtedness, including the senior notes. However, if we are unable to generate sufficient cash flow from operations or to borrow sufficientfunds in the future to service our debt, we may be required to sell assets, reduce capital expenditures, refinance all or a portion of our existing debt (includingthe senior notes) or obtain additional financing. There is no assurance that we will be able to refinance our debt, sell assets or borrow more money on termsacceptable to us, or at all.
The indenture that governs the senior notes also contains various covenants that limit our ability and the ability of our subsidiaries to, among other things:
• incur liens;
• incur sale and leaseback transactions; and
• consolidate or merge with or into, or sell substantially all of our assets to, another person
55
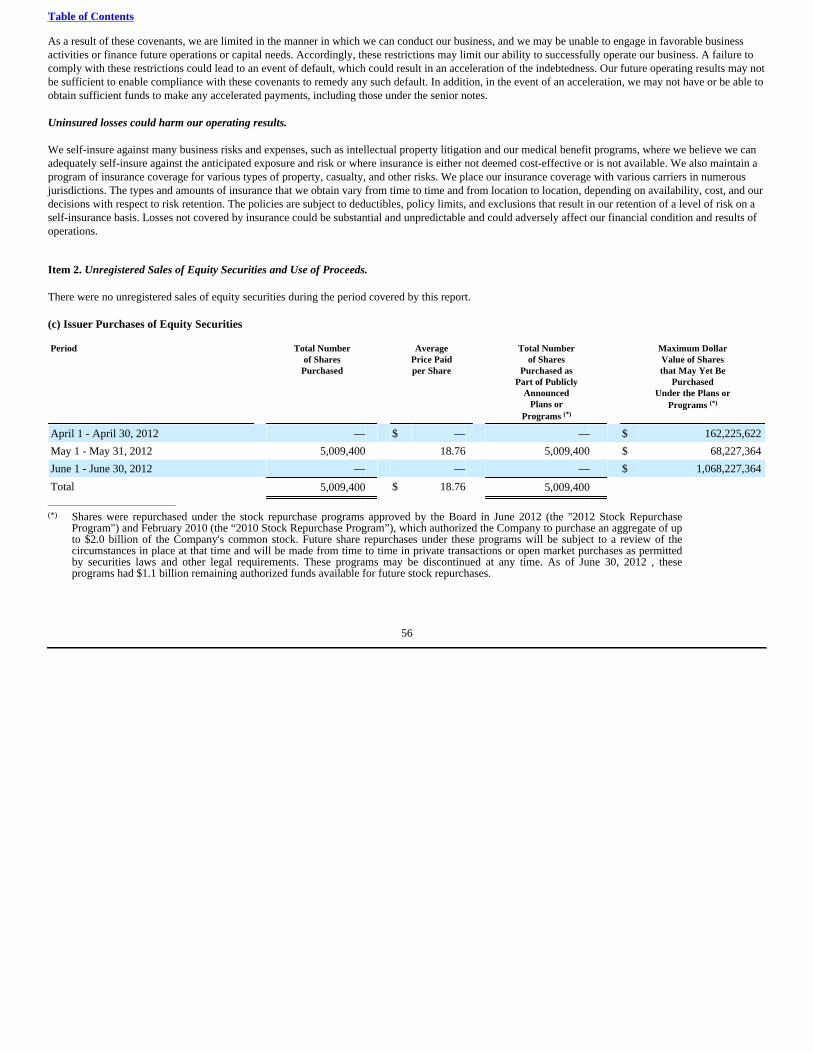
Table of Contents
As a result of these covenants, we are limited in the manner in which we can conduct our business, and we may be unable to engage in favorable businessactivities or finance future operations or capital needs. Accordingly, these restrictions may limit our ability to successfully operate our business. A failure tocomply with these restrictions could lead to an event of default, which could result in an acceleration of the indebtedness. Our future operating results may notbe sufficient to enable compliance with these covenants to remedy any such default. In addition, in the event of an acceleration, we may not have or be able toobtain sufficient funds to make any accelerated payments, including those under the senior notes.
Uninsured losses could harm our operating results.
We self-insure against many business risks and expenses, such as intellectual property litigation and our medical benefit programs, where we believe we canadequately self-insure against the anticipated exposure and risk or where insurance is either not deemed cost-effective or is not available. We also maintain aprogram of insurance coverage for various types of property, casualty, and other risks. We place our insurance coverage with various carriers in numerousjurisdictions. The types and amounts of insurance that we obtain vary from time to time and from location to location, depending on availability, cost, and ourdecisions with respect to risk retention. The policies are subject to deductibles, policy limits, and exclusions that result in our retention of a level of risk on aself-insurance basis. Losses not covered by insurance could be substantial and unpredictable and could adversely affect our financial condition and results ofoperations.
Item 2. Unregistered Sales of Equity Securities and Use of Proceeds.
There were no unregistered sales of equity securities during the period covered by this report.
(c) Issuer Purchases of Equity Securities
Period Total Numberof Shares
Purchased
AveragePrice Paidper Share
Total Numberof Shares
Purchased asPart of Publicly
AnnouncedPlans or
Programs (*)
Maximum DollarValue of Sharesthat May Yet Be
PurchasedUnder the Plans or
Programs (*)
April 1 - April 30, 2012 — $ — — $ 162,225,622
May 1 - May 31, 2012 5,009,400 18.76 5,009,400 $ 68,227,364
June 1 - June 30, 2012 — — — $ 1,068,227,364
Total 5,009,400 $ 18.76 5,009,400 ________________________________
(*) Shares were repurchased under the stock repurchase programs approved by the Board in June 2012 (the "2012 Stock RepurchaseProgram") and February 2010 (the “2010 Stock Repurchase Program”), which authorized the Company to purchase an aggregate of upto $2.0 billion of the Company's common stock. Future share repurchases under these programs will be subject to a review of thecircumstances in place at that time and will be made from time to time in private transactions or open market purchases as permittedby securities laws and other legal requirements. These programs may be discontinued at any time. As of June 30, 2012 , theseprograms had $1.1 billion remaining authorized funds available for future stock repurchases.
56
Table of Contents
Item 6. Exhibits
ExhibitNumber
Description of Document
3.1 Certificate of Amendment of Amended and Restated Certificate of Incorporation of Juniper Networks, Inc. (incorporated by reference toExhibit 3.1 to the Company's Current Report on Form 8-K filed with the Securities and Exchange Commission on May 24, 2012)
3.2 Amended and Restated Bylaws of Juniper Networks, Inc. (incorporated by reference to Exhibit 3.2 to the Company's Current Report onForm 8-K filed with the Securities and Exchange Commission on May 24, 2012)
10.1 Juniper Networks, Inc. 2006 Equity Incentive Plan, as amended (incorporated by reference to Exhibit 10.1 to the Company's Current Reporton Form 8-K filed with the Securities and Exchange Commission on May 24, 2012)
10.2 Juniper Networks, Inc. 2008 Employee Stock Purchase Plan, as amended (incorporated by reference to Exhibit 10.2 to the Company'sCurrent Report on Form 8-K filed with the Securities and Exchange Commission on May 24, 2012)
12.1 Computation of Ratio of Earnings to Fixed Charges*
31.1 Certification of Chief Executive Officer pursuant to Rule 13a-14(a)/15d-14(a) of the Securities Exchange Act of 1934*
31.2 Certification of Chief Financial Officer pursuant to Rule 13a-14(a)/15d-14(a) of the Securities Exchange Act of 1934*
32.1 Certification of Chief Executive Officer pursuant to 18 U.S.C. Section 1350*
32.2 Certification of Chief Financial Officer pursuant to 18 U.S.C. Section 1350*
101 The following materials from Juniper Network Inc.'s Quarterly Report on Form 10-Q for the quarter ended June 30, 2012, formatted inXBRL (Extensible Business Reporting Language): (i) the Condensed Consolidated Statements of Comprehensive Income, (ii) theCondensed Consolidated Balance Sheets, and (iii) the Condensed Consolidated Statements of Cash Flows, and (iv) Notes to CondensedConsolidated Financial Statements*
101.INS XBRL Instance Document*
101.SCH XBRL Taxonomy Extension Schema Document*
101.CAL XBRL Taxonomy Extension Calculation Linkbase Document*
101.DEF XBRL Taxonomy Extension Definition Linkbase Document*
101.LAB XBRL Taxonomy Extension Label Linkbase Document*
101.PRE XBRL Taxonomy Extension Presentation Linkbase Document*
*Filed herewith.
57
Table of Contents
SIGNATURES
Pursuant to the requirements of the Securities Exchange Act of 1934, the registrant had duly caused this report to be signed on its behalf by the undersignedthereunto duly authorized.
Juniper Networks, Inc.
August 8, 2012 By: /s/ Robyn M. Denholm
Robyn M. Denholm
Executive Vice President and Chief Financial Officer(Duly Authorized Officer and PrincipalFinancial Officer)
August 8, 2012 By: /s/ Gene Zamiska
Gene Zamiska
Vice President, Finance and Corporate Controller(Duly Authorized Officer and Principal Accounting Officer)
58
Table of Contents
Exhibit Index
ExhibitNumber
Description of Document
3.1 Certificate of Amendment of Amended and Restated Certificate of Incorporation of Juniper Networks, Inc. (incorporated by reference toExhibit 3.1 to the Company's Current Report on Form 8-K filed with the Securities and Exchange Commission on May 24, 2012)
3.2 Amended and Restated Bylaws of Juniper Networks, Inc. (incorporated by reference to Exhibit 3.2 to the Company's Current Report onForm 8-K filed with the Securities and Exchange Commission on May 24, 2012)
10.1 Juniper Networks, Inc. 2006 Equity Incentive Plan, as amended (incorporated by reference to Exhibit 10.1 to the Company's Current Reporton Form 8-K filed with the Securities and Exchange Commission on May 24, 2012)
10.2 Juniper Networks, Inc. 2008 Employee Stock Purchase Plan, as amended (incorporated by reference to Exhibit 10.2 to the Company'sCurrent Report on Form 8-K filed with the Securities and Exchange Commission on May 24, 2012)
12.1 Computation of Ratio of Earnings to Fixed Charges*
31.1 Certification of Chief Executive Officer pursuant to Rule 13a-14(a)/15d-14(a) of the Securities Exchange Act of 1934*
31.2 Certification of Chief Financial Officer pursuant to Rule 13a-14(a)/15d-14(a) of the Securities Exchange Act of 1934*
32.1 Certification of Chief Executive Officer pursuant to 18 U.S.C. Section 1350*
32.2 Certification of Chief Financial Officer pursuant to 18 U.S.C. Section 1350*
101 The following materials from Juniper Network Inc.'s Quarterly Report on Form 10-Q for the quarter ended June 30, 2012, formatted inXBRL (Extensible Business Reporting Language): (i) the Condensed Consolidated Statements of Comprehensive Income, (ii) theCondensed Consolidated Balance Sheets, and (iii) the Condensed Consolidated Statements of Cash Flows, and (iv) Notes to CondensedConsolidated Financial Statements*
101.INS XBRL Instance Document*
101.SCH XBRL Taxonomy Extension Schema Document*
101.CAL XBRL Taxonomy Extension Calculation Linkbase Document*
101.DEF XBRL Taxonomy Extension Definition Linkbase Document*
101.LAB XBRL Taxonomy Extension Label Linkbase Document*
101.PRE XBRL Taxonomy Extension Presentation Linkbase Document*
*Filed herewith.
59
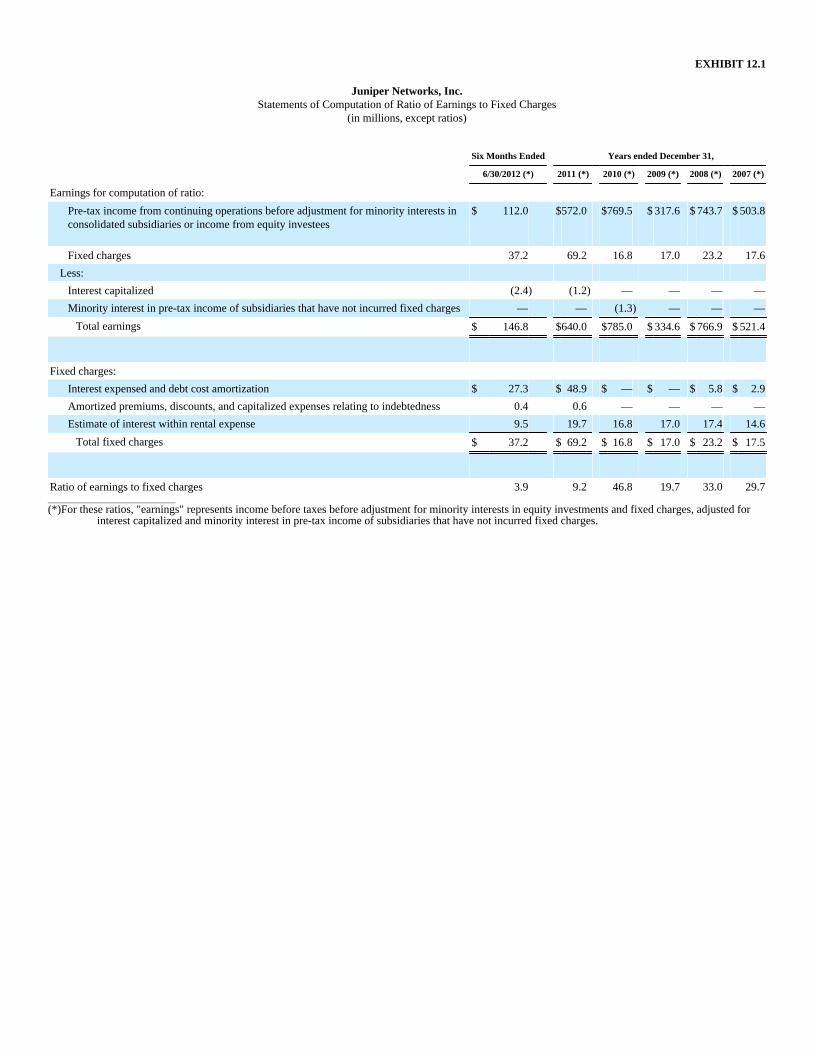
EXHIBIT 12.1
Juniper Networks, Inc.Statements of Computation of Ratio of Earnings to Fixed Charges
(in millions, except ratios)
Six Months Ended Years ended December 31,
6/30/2012 (*) 2011 (*) 2010 (*) 2009 (*) 2008 (*) 2007 (*)
Earnings for computation of ratio:
Pre-tax income from continuing operations before adjustment for minority interests inconsolidated subsidiaries or income from equity investees
$ 112.0 $572.0 $769.5 $ 317.6 $ 743.7 $ 503.8
Fixed charges 37.2 69.2 16.8 17.0 23.2 17.6
Less:
Interest capitalized (2.4) (1.2) — — — —
Minority interest in pre-tax income of subsidiaries that have not incurred fixed charges — — (1.3) — — —
Total earnings $ 146.8 $640.0 $785.0 $ 334.6 $ 766.9 $ 521.4
Fixed charges:
Interest expensed and debt cost amortization $ 27.3 $ 48.9 $ — $ — $ 5.8 $ 2.9
Amortized premiums, discounts, and capitalized expenses relating to indebtedness 0.4 0.6 — — — —
Estimate of interest within rental expense 9.5 19.7 16.8 17.0 17.4 14.6
Total fixed charges $ 37.2 $ 69.2 $ 16.8 $ 17.0 $ 23.2 $ 17.5
Ratio of earnings to fixed charges 3.9 9.2 46.8 19.7 33.0 29.7________________________________(*)For these ratios, "earnings" represents income before taxes before adjustment for minority interests in equity investments and fixed charges, adjusted for
interest capitalized and minority interest in pre-tax income of subsidiaries that have not incurred fixed charges.

EXHIBIT 31.1
Certification of Chief Executive OfficerPursuant to
Exchange Act Rules 13a-14(a) and 15d-14(a),As Adopted Pursuant to
Section 302 of the Sarbanes-Oxley Act of 2002
I, Kevin R. Johnson, certify that:
1. I have reviewed this quarterly report on Form 10-Q of Juniper Networks, Inc.;
2. Based on my knowledge, this report does not contain any untrue statement of a material fact or omit to state a material fact necessaryto make the statements made, in light of the circumstances under which such statements were made, not misleading with respect to theperiod covered by this report;
3. Based on my knowledge, the financial statements, and other financial information included in this report, fairly present in all materialrespects the financial condition, results of operations and cash flows of the registrant as of, and for, the periods presented in thisreport;
4. The registrant's other certifying officer(s) and I are responsible for establishing and maintaining disclosure controls and procedures (asdefined in Exchange Act Rules 13a-15(e) and 15d-15(e)) and internal control over financial reporting (as defined in Exchange ActRules 13a-15(f) and 15d-15(f)) for the registrant and have:
(a) Designed such disclosure controls and procedures, or caused such disclosure controls and procedures to be designed under oursupervision, to ensure that material information relating to the registrant, including its consolidated subsidiaries, is made known to usby others within those entities, particularly during the period in which this report is being prepared;
(b) Designed such internal control over financial reporting, or caused such internal control over financial reporting to be designed underour supervision, to provide reasonable assurance regarding the reliability of financial reporting and the preparation of financialstatements for external purposes in accordance with generally accepted accounting principles;
(c) Evaluated the effectiveness of the registrant's disclosure controls and procedures and presented in this report our conclusions about theeffectiveness of the disclosure controls and procedures, as of the end of the period covered by this report based on such evaluation;and
(d) Disclosed in this report any change in the registrant's internal control over financial reporting that occurred during the registrant's mostrecent fiscal quarter (the registrant's fourth fiscal quarter in the case of an annual report) that has materially affected, or is reasonablylikely to materially affect, the registrant's internal control over financial reporting; and
5. The registrant's other certifying officer(s) and I have disclosed, based on our most recent evaluation of internal control over financialreporting, to the registrant's auditors and the audit committee of the registrant's board of directors (or persons performing theequivalent functions):
(a) All significant deficiencies and material weaknesses in the design or operation of internal control over financial reporting which arereasonably likely to adversely affect the registrant's ability to record, process, summarize, and report financial information; and
(b) Any fraud, whether or not material, that involves management or other employees who have a significant role in the registrant'sinternal control over financial reporting.
Date: August 8, 2012
/s/ Kevin R. Johnson Kevin R. JohnsonChief Executive Officer

EXHIBIT 31.2
Certification of Chief Financial OfficerPursuant to
Exchange Act Rules 13a-14(a) and 15d-14(a),As Adopted Pursuant to
Section 302 of the Sarbanes-Oxley Act of 2002
I, Robyn M. Denholm, certify that:
1. I have reviewed this quarterly report on Form 10-Q of Juniper Networks, Inc.;
2. Based on my knowledge, this report does not contain any untrue statement of a material fact or omit to state a material fact necessaryto make the statements made, in light of the circumstances under which such statements were made, not misleading with respect to theperiod covered by this report;
3. Based on my knowledge, the financial statements, and other financial information included in this report, fairly present in all materialrespects the financial condition, results of operations and cash flows of the registrant as of, and for, the periods presented in thisreport;
4. The registrant's other certifying officer(s) and I are responsible for establishing and maintaining disclosure controls and procedures (asdefined in Exchange Act Rules 13a-15(e) and 15d-15(e)) and internal control over financial reporting (as defined in Exchange ActRules 13a-15(f) and 15d-15(f)) for the registrant and have:
(a) Designed such disclosure controls and procedures, or caused such disclosure controls and procedures to be designed under oursupervision, to ensure that material information relating to the registrant, including its consolidated subsidiaries, is made known to usby others within those entities, particularly during the period in which this report is being prepared;
(b) Designed such internal control over financial reporting, or caused such internal control over financial reporting to be designed underour supervision, to provide reasonable assurance regarding the reliability of financial reporting and the preparation of financialstatements for external purposes in accordance with generally accepted accounting principles;
(c) Evaluated the effectiveness of the registrant's disclosure controls and procedures and presented in this report our conclusions about theeffectiveness of the disclosure controls and procedures, as of the end of the period covered by this report based on such evaluation;and
(d) Disclosed in this report any change in the registrant's internal control over financial reporting that occurred during the registrant's mostrecent fiscal quarter (the registrant's fourth fiscal quarter in the case of an annual report) that has materially affected, or is reasonablylikely to materially affect, the registrant's internal control over financial reporting; and
5. The registrant's other certifying officer(s) and I have disclosed, based on our most recent evaluation of internal control over financialreporting, to the registrant's auditors and the audit committee of the registrant's board of directors (or persons performing theequivalent functions):
(a) All significant deficiencies and material weaknesses in the design or operation of internal control over financial reporting which arereasonably likely to adversely affect the registrant's ability to record, process, summarize, and report financial information; and
(b) Any fraud, whether or not material, that involves management or other employees who have a significant role in the registrant'sinternal control over financial reporting.
Date: August 8, 2012
/s/ Robyn M. Denholm Robyn M. DenholmExecutive Vice President and Chief Financial Officer
Exhibit 32.1
Certification of Chief Executive OfficerPursuant to 18 U.S.C. Section 1350 As Adopted
Pursuant to Section 906 of the Sarbanes-Oxley Act of 2002
I, Kevin R. Johnson, certify, pursuant to 18 U.S.C. Section 1350, as adopted pursuant to Section 906 of the Sarbanes-Oxley Act of 2002, that theQuarterly Report of Juniper Networks, Inc. on Form 10-Q for the three months ended June 30, 2012, fully complies with the requirements of Section 13(a) or15(d) of the Securities Exchange Act of 1934 and that information contained in such Quarterly Report on Form 10-Q fairly presents, in all material respects,the financial condition and results of operations of Juniper Networks, Inc.
/s/ Kevin R. Johnson Kevin R. JohnsonChief Executive OfficerAugust 8, 2012
Exhibit 32.2
Certification of Chief Financial OfficerPursuant to 18 U.S.C. Section 1350 As Adopted
Pursuant to Section 906 of the Sarbanes-Oxley Act of 2002
I, Robyn M. Denholm, certify, pursuant to 18 U.S.C. Section 1350, as adopted pursuant to Section 906 of the Sarbanes-Oxley Act of 2002, that theQuarterly Report of Juniper Networks, Inc. on Form 10-Q for the three months ended June 30, 2012, fully complies with the requirements of Section 13(a) or15(d) of the Securities Exchange Act of 1934 and that information contained in such Quarterly Report on Form 10-Q fairly presents, in all material respects,the financial condition and results of operations of Juniper Networks, Inc.
/s/ Robyn M. Denholm Robyn M. DenholmExecutive Vice President and Chief Financial OfficerAugust 8, 2012


![FORM 10−Qleasingnews.org/PDF/CITGROUPINC10Q[1].pdf · 2007-08-08 · FORM 10−Q CIT GROUP INC − cit Filed: August 07, 2007 (period: June 30, 2007) Quarterly report which provides](https://img.pdfslide.us/doc/110x75/5f66b93316ef4f7c0526850c/form-10a-1pdf-2007-08-08-form-10aq-cit-group-inc-a-cit-filed-august.jpg)