Embed Size (px)
Citation preview

10 pillars of change in India
India is one of the fastest-growing emerging markets. The government is introducing
dramatic changes to strengthen the economy, improve efficiency, reduce corruption and attract
more investment. Here are some of the measures and initiatives the Indian government
is implementing.

There has been a distinct step-up in the fight against corruption in recent years.
Two notes, the 500 and 1,000 rupee, were banned to fight counterfeiting and “black money”.
Aadhaar, a unique biometric 12-digit identity number, was launched in 2009. A powerful anti-corruption tool covering over 1 billion people, Aadhaar aims to curb corruption and reduce leakages involved in transferring benefit payments from the government.
Tax treaties have been struck with around 140 countries, aimed at sharing information and improving international co-operation.
India introduced a bill to counter illegitimate property holdings in 2015.
Anti-corruption drive
Aadhaar enrollment for adults remains high% of population enrolled in Aadhaar
0 to 4 years
5 to 17 years
18 years and above
FemaleMale
Source: UIDAI, Barclays Research
0
50
100
%
Source: Ministry of Electronics & Information Technology - Government of India
4.7%
23.5%
71.7%
2

2
Structural changes to India’s tax regime are aiming to improve the way revenue is collected.
The corporate tax regime is being simplified, aiming to lower the headline tax rate from 30% in 2015 to 25% by 2019. There are also plans to scrap several tax exemptions.
The introduction of a goods and services tax (GST) in July 2017 combines all indirect taxes (central, state and local level) into one.
Tax reforms
Labour compensationPower, fuel & waterLogistics
Cost as % of net sales
Source: World Bank, Barclays Research
GST could help to lower logistics costs for the manufacturing sector
Auto components
Textiles
Electronics
Heavy engineering
Hotels & tourism
Telecom
15 25 30 355 10 200%
3

3
In order to attract sustainable, long-term investments and boost manufacturing, limits on foreign direct investment
have been eased and regulations simplified.
Several sectors – notably defence manufacturing, railways, oil and gas, automobiles, roads and highways, aviation, ports, renewable energy – have been given automatic approval for FDI.
Foreign direct investment liberalisation
4

4
India is a top prospective host economy for FDI for 2017-2019.
As energy consumption continues to grow, the government is scaling up traditional sources of power and encouraging renewable power generation.
Coal production increased c.17% and power generation from conventional sources by c.20% since 2013.
Energy sector reforms
State energy subsidies have dropped from 1% of GDP in 2012 to 0.2% in 2016.
Annual renewable energy generation is poised to grow from 46GW in 2016 to 175GW in 2022.
There is a push to improve the financial health of state power distribution companies (Discoms).
Country (% of executives responding)
Current 2017 ranking (2016 ranking)
Note: Percentage of respondents selecting a country (each executive was asked to select the three most promising prospective host countries). Source: UNCTAD World Investment Report survey, Barclays Research
US 40%
1(1)
UK 7%
7(4)
India 20%
3(3)
Germany 7%
8(5)
Canada 4%
14(18)
Spain 5%
11(25)
Indonesia 11%
4(8)
Philippines 6%
10(9)
Vietnam 4%
12(14)
China 36%
2(2)
Singapore 4%
13(18)
Mexico 7%
9(7)
Brazil 9%
6(7)
Australia 3%
15(13)
Thailand 11%
5(14)
Source: Ministry of Power - Government of India 5

5
The priority is to build roads, highways, ports, railways, industrial freight corridors, power
generation, and rural electrification and irrigation.
In 2011, the rural-urban population distribution of India was 69% vs. 31%, respectively.(1)
Every minute, about 25-30 people migrate to major Indian cities from rural areas. By 2050, about 843 million people are
expected to occupy India’s urban areas.(2)
The government’s Smart Cities Mission aims to cover 100 cities by 2019. To build these smart cities, about $1.2 trillion(2)
needs to be invested in transportation, energy and public security over the next 20 years.
Urbanisation and infrastructure push
Sources: (1) 2011 Census of India(2) India Government estimate 6

6
The number of digital transactions increased 4.5 times between 2013 and 2016. It is estimated that the digital payments industry will grow 10 times to $500 billion by 2020, contributing 15% to India’s GDP.(1)
The Digital India drive aims to strengthen the country’s position as a digitally empowered society and knowledgeable economy, and help combat corruption.
Soft infrastructure
Initiatives ranging from improved sanitation to better digital access are key focuses of the reform programme.
By 2019, the government aims to construct another c.25 million rural and c.3.5 million urban household toilets.(4)
The Clean India Mission aims to spread awareness of sanitary practices and provide infrastructure in homes across the country. Only 33% of rural households had toilets in their homes.(2)
Rural households with toilet
Toilets added
YearTotal
+8.8mm +4.6mm +2.3mm
c.50mm
Under Clean India Mission
FY 10-11
51.5mmFY 11-12
60.3mmFY 12-13
64.9mmFY 13-14
67.2mm(3)Oct 14-Sep 17
Sources:(1) Digital Payments 2020 - The Making of a $500bn ecosystem in India - BCG/ Google - July 2016(2) 2011 Census of India (3) Up to November 2013(4) Ministry of Drinking Water and Sanitation - Government of India
7

7
8
A government priority is to enhance the ease of doing business in India. In 2017, the World Bank ranked India 130th out of 190
economies in its Doing Business survey, up from 142nd in 2015.
Boosting manufacturing and entrepreneurship
The government is intent on greater banking system penetration, with the aim of giving each household
access to at least one bank account.
Financial inclusion
The “Make in India” campaign promotes the country as a global hub for manufacturing, innovation and design.
The “Start up India” campaign promotes entrepreneurship and encourages job creation.
8
521
832
207
267
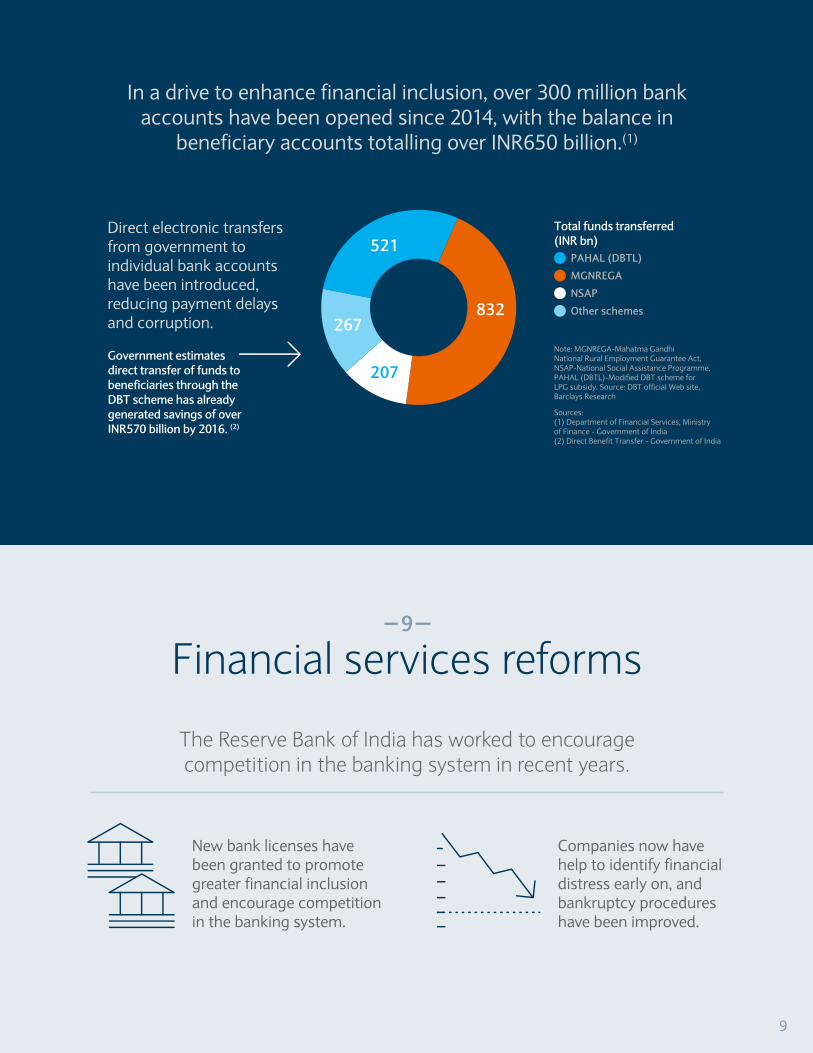
In a drive to enhance financial inclusion, over 300 million bank accounts have been opened since 2014, with the balance in
beneficiary accounts totalling over INR650 billion.(1)
Direct electronic transfers from government to individual bank accounts have been introduced, reducing payment delays and corruption.
Financial services reforms9
The Reserve Bank of India has worked to encourage competition in the banking system in recent years.
New bank licenses have been granted to promote greater financial inclusion and encourage competition in the banking system.
Companies now have help to identify financial distress early on, and bankruptcy procedures have been improved.
Government estimates direct transfer of funds to beneficiaries through the DBT scheme has already generated savings of over INR570 billion by 2016. (2)
Total funds transferred (INR bn)
PAHAL (DBTL)
MGNREGA
NSAP
Other schemes
Note: MGNREGA-Mahatma Gandhi National Rural Employment Guarantee Act, NSAP-National Social Assistance Programme, PAHAL (DBTL)-Modified DBT scheme for LPG subsidy. Source: DBT official Web site, Barclays Research
Sources:(1) Department of Financial Services, Ministry of Finance - Government of India(2) Direct Benefit Transfer - Government of India
9

10
Transparent and disciplined public policy
The Reserve Bank of India has adopted an inflation-targeting framework for monetary policy, and now targets retail Consumer Price Index (CPI) inflation at 4% +/- 2%.
A monetary policy committee (MPC) was formed in 2016.
Percentage point contribution to CPI
CPI inflation has eased significantly since 2012
Food & energy (fuel + transportation)
CPI (% y/y)
Core CPI
Source: GoI, Haver Analytics, Barclays Research
The central government has met all fiscal deficit targets since 2012, and the intention is a phased lowering in the public debt/GDP ratio.
Stay on top of this and other topics at Barclays.© Copyright Barclays Bank PLC 2017
Jul-12 Jul-13 Jul-14 Jul-15 Jul-16 Jul-17Jan-13 Jan-14 Jan-15 Jan-16 Jan-17
0
2
4
6
8
10
12
10

PERSONAL USE ONLYAll information contained herein shall only be used by the recipient
for his/her own personal reference. Any other use, including any
disclosure or distribution to of any information to any third party,
requires the express written permission of Barclays.
FOR INFORMATION PURPOSES ONLYThis information has been prepared by the Research Department
within the Investment Bank of Barclays Bank PLC and is distributed
by Barclays Bank PLC and/or one or more of its affiliates (collectively
and each individually, “Barclays”). The views expressed in this
publication are those of the author(s) alone and are subject to
change without notice. Barclays has no obligation to update this
publication. This information is intended for informational purposes
only and should not be regarded as an offer to sell or a solicitation of
an offer to buy the products or securities to which it applies. No
representation is made that any returns will be achieved through its
use.
INFORMATION PROVIDED MAY NOT BE ACCURATE OR COMPLETE AND MAY BE SOURCED FROM THIRD PARTIESAll information, whether proprietary to Barclays or a third party, is
provided "as is" and Barclays makes no express or implied warranties,
and expressly disclaims all warranties of merchantability or fitness
for a particular purpose or use with respect to any data included
herein. Other than disclosures relating to Barclays, the information
contained in this publication has been obtained from sources that
Barclays Research believes to be reliable, but Barclays makes no
representations that the information contained herein is accurate,
reliable, complete, or appropriate for use by all investors in all
locations. Further, Barclays does not guarantee the accuracy or
completeness of information which is obtained from, or is based
upon, trade and statistical services or other third-party sources.
Because of the possibility of human and mechanical errors as well as
other factors, Barclays is not responsible for any errors or omissions
in the information contained herein. Barclays is not responsible for,
and makes no warranties whatsoever as to, the content of any
third-party website accessed via a hyperlink contained herein and
such information is not incorporated by reference.
INFORMATION PROVIDED IS NOT INDICATIVE OF FUTURE RESULTS
Any data on past performance, modelling or back-testing contained
herein is not necessarily indicative of future results. All levels, prices
and spreads are historical and do not represent current market levels,
prices or spreads, some or all of which may have changed. The
information referenced herein or any of the results derived from any
analytic tools or reports referenced herein are not intended to predict
actual results and no assurances are given with respect thereto. The
value of and income from any investment may fluctuate from day to
day as a result of changes in relevant economic markets (including
changes in market liquidity).
NO LIABILITYTo the extent permitted by law, in no event shall Barclays, nor any
affiliate, nor any of their respective officers, directors, partners,
employees or third-party licensors have any liability for (a) any
special, punitive, indirect, or consequential damages; or (b) any lost
profits, lost revenue, loss of anticipated savings or loss of opportunity
or other financial loss, even if notified or advised of the possibility of
such damages or potential loss, arising from any use of the
information provided herein.
NO ADVICEThe information provided does not constitute investment advice or
take into account the individual financial circumstances or objectives
of the clients who receive it. You should consult with your own
accounting, legal or other advisors as to the adequacy of this
information for your purposes.
NO USE FOR VALUATION PURPOSESNo data or price information should be used for any valuation,
trading, settlement, accounting purposes or other related functions.
NOT AVAILABLE IN ALL JURISDICTIONSNot all products or services mentioned are available in all
jurisdictions. No offers, sales, resales, or delivery of any products or
services described herein or any offering materials relating to any
such products or services may be made in or from any jurisdiction
except in circumstances which will result with compliance with any
applicable laws and regulations and which will not impose any
obligations on Barclays.
TAX DISCLAIMERBarclays does not provide tax advice and nothing contained herein
should be construed to be tax advice. Accordingly, you should seek
advice based on your particular circumstances from an independent
tax advisor.
INTELLECTUAL PROPERTY© Copyright Barclays Bank PLC (2017). All rights reserved. No part
of this document may be reproduced or redistributed in any manner
without the prior written permission of Barclays.
Barclays Bank PLC is registered in England No. 1026167. Registered
office 1 Churchill Place, London, E14 5HP.
Disclosures
11