Embed Size (px)
Citation preview

1
The Research Perspective
I N F O C U S
Prime central London’s property market
Property, prices and predictions
1 0 N O V E M B E R 2 0 2 0

2
Where do we stand currently?

3
Tough times for the Prime Central London Market since 2014

4
A lack of urgency post covid
Travel restrictions
focusses overseas
buying on off-plan
investment
The discretionary
nature of demand means
fewer needs based buyers responding to
lifestyle drivers
Shut-down of amenities
removes the incentive to be in central
London
Falls in stocks and
commodities erodes global
wealth
Weaker global
economy curtails new
wealth generation
Attention shifts to the
amenity offering of
prime country property

Source: Savills 5
Rents and capital values over that period
-4.0%
-2.0%
0.0%
2.0%
4.0%
6.0%
8.0%
PCL Capital Values PCL Rental Values
Since March
-1.4%Capital Values
-5.0%Rental Values
Annual
-0.5%Capital Values
-4.7%Rental Values
Since 2014 peak
-20.9%Capital Values
-20.6%Rental Values
Source: Twenty CI 6
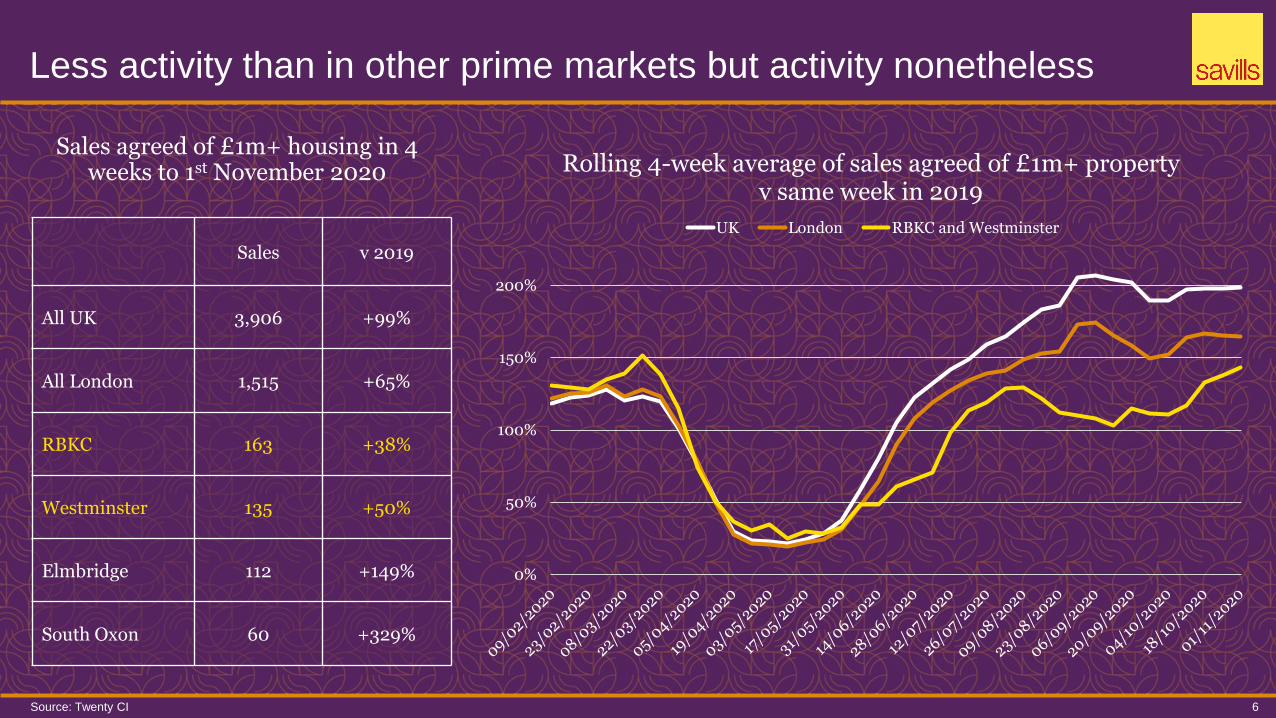
Less activity than in other prime markets but activity nonetheless
0%
50%
100%
150%
200%
Rolling 4-week average of sales agreed of £1m+ property v same week in 2019
UK London RBKC and Westminster
Sales v 2019
All UK 3,906 +99%
All London 1,515 +65%
RBKC 163 +38%
Westminster 135 +50%
Elmbridge 112 +149%
South Oxon 60 +329%
Sales agreed of £1m+ housing in 4 weeks to 1st November 2020

Source: Savills 7
With robust spend over £5m in Q3 this year
0
5
10
15
20
25
30
35
40
45
50
Jan-20 Feb-20 Mar-20 Apr-20 May-20 Jun-20 Jul-20 Aug-20 Sep-20
£5m - £10m £10m - £15m £15m - £20m £20m+ £5m+ average in previous 4 years
Quarter 3
£876m
Quarter 2
£436m
Quarter 1
£944m

8
When will conditions be right
for a recovery?

Source: Savills 9
Putting the downturn in context
Late eighties / early nineties
In the preceding 5 years
+107% nominal price growth
+75% real price growth
3.75 years of falls
Prices fall by
-26% in nominal terms
-39% in real terms
-26% in US$ terms
Post credit crunch
In the preceding 5 years
+66% nominal price growth
+52% real price growth
1.50 years of falls
Prices fall by
-22% in nominal terms
-26% in real terms
-45% in US$ terms
Since Mid 2014
In the preceding 5 years
+71% nominal price growth
+54% real price growth
6.50 years of falls
Prices fall by
-21% in nominal terms
-27% in real terms
-39% in US$ terms

Source: Savills 10
Competitive on a world stage
US$ per sq ft June 2014 US$ per sq ft June 2020
London 5,631 Hong Kong 8,129
Hong Kong 5,557 Tokyo 3,986
Tokyo 3,300 London 3,310
New York 3,112 New York 3,012
Sydney 2,764 Sydney 2,799
Paris 2,747 Shanghai 2,657
Shanghai 2,485 Paris 2,623
San Francisco 1,988 Los Angeles 2,516
Singapore 1,897 San Francisco 2,367
Los Angeles 1,692 Shenzhen 2,125
Guangzhou 1,499 Singapore 1,804
Shenzhen 1,138 Guangzhou 1,779

Source: Savills 11
Not uncompetitive from a tax perspective (US$10m)
0%
5%
10%
15%
20%
25%
30%
35%
40%
45%
Vancouver Hong Kong Singapore New York Sydney Madrid Londonpost 31st
March2021
Paris Londonpre 31stMarch2021
Berlin Dubai Shanghai
Per
cen
tag
e o
f p
rop
ert
y p
rice
($
10M
)
Cost of Buying Cost of Holding Cost of Selling
Source: Yahoo Finance 12
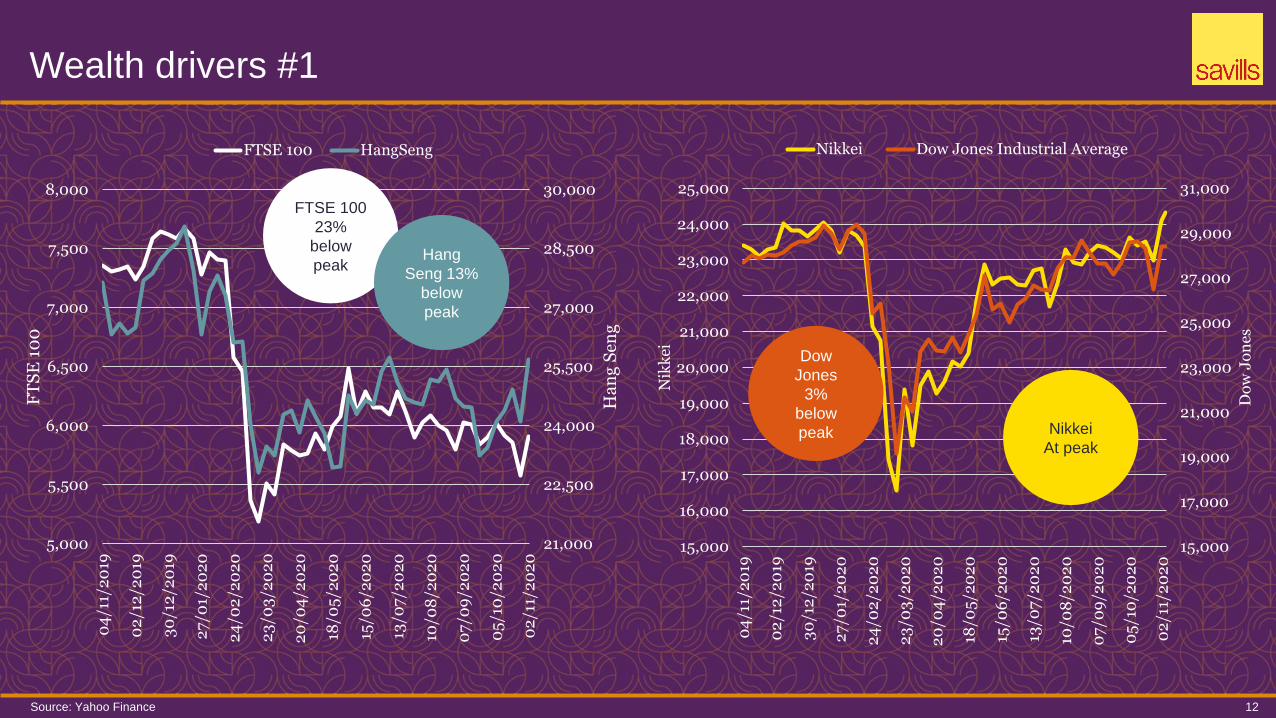
Wealth drivers #1
21,000
22,500
24,000
25,500
27,000
28,500
30,000
5,000
5,500
6,000
6,500
7,000
7,500
8,000
04
/11/
20
19
02
/12
/20
19
30
/12
/20
19
27
/01/
20
20
24
/02
/20
20
23
/03
/20
20
20
/04
/20
20
18/0
5/2
02
0
15/0
6/2
02
0
13/0
7/2
02
0
10/0
8/2
02
0
07
/09
/20
20
05
/10
/20
20
02
/11/
20
20
Ha
ng
Sen
g
FT
SE
10
0
FTSE 100 HangSeng
FTSE 100
23%
below
peakHang
Seng 13%
below
peak
15,000
17,000
19,000
21,000
23,000
25,000
27,000
29,000
31,000
15,000
16,000
17,000
18,000
19,000
20,000
21,000
22,000
23,000
24,000
25,000
04
/11/
20
19
02
/12
/20
19
30
/12
/20
19
27
/01/
20
20
24
/02
/20
20
23
/03
/20
20
20
/04
/20
20
18/0
5/2
02
0
15/0
6/2
02
0
13/0
7/2
02
0
10/0
8/2
02
0
07
/09
/20
20
05
/10
/20
20
02
/11/
20
20
Do
w J
on
es
Nik
kei
Nikkei Dow Jones Industrial Average
Nikkei
At peak
Dow
Jones
3%
below
peak

Source: Yahoo Finance, Pitchbook 13
Wealth drivers #2
0
500
1,000
1,500
2,000
2,500
0
10
20
30
40
50
60
70
Go
ld (
US
$)
Oil
(U
S$
per
ba
rrel
)
Commodities (US$)
Oil Gold
Private equity and venture
capital raised globally
Life Sciences
£108bn
in 2019
£105bn
to end Oct 2020
TMT£336bn
in 2019
£343bn
to end Oct 2020

Source: Heathrow Airport Limited 14
The absence of international travel in context
0
1,000,000
2,000,000
3,000,000
4,000,000
5,000,000
6,000,000
7,000,000
8,000,000
Heathrow Passenger NumbersExcludes Gatwick, Stansted, Edinburgh, Naples, Aberdeen, Glasgow and Southampton
UK EU Non-EU Europe Africa North America Latin America Middle East Asia / Pacific

Source: World Health Organisation 15
The search for a vaccine (as at 27th of October)
11Phase 3
Wider testing and
effectiveness assessed
Approval and
Distribution
12Phase 2
Expanded safety trials
154in pre clinical
trials
21Phase 1
Small-scale safety trials
Regulatory Review

16
What might that recovery look like?

Source: Savills 17
How has the market recovered in the past?
Late eighties / early nineties
During the downturn
prices fall by
-26% in nominal terms
-39% in real terms
In the next 5 years
prices rise by
+98% in nominal terms
+77% in real terms
Post credit crunch
During the downturn
prices fall by
-22% in nominal terms
-26% in real terms
In the next 5 years
prices rise by
+79% in nominal terms
+54% in real terms

18
A different environment for a recovery
The tax environment
is less welcoming
Despite low costs of funds
low income yields may
temper investor demand
It will face increased
competition as a global “tech city”
London has largely
matured as a global city
It will face challenges to maintain its position as a
global financial
sector
Sources of wealth will come under
greater scrutiny

Source: Savills 19
Prime Central London price forecasts
+4.0%2023
+17.5%5 year
+7.0%2022
-0.5%2020
+4.0%2021
+2.0%2024
Thank you
© Savills 2020
20
This presentation is for general informative purposes only. It may not be published, reproduced or quoted in part or in whole, nor may it be used as a basis for any contract, prospectus, agreement or other document
without prior consent. While all effort has been made to ensure its accuracy, Savills accepts no liability whatsoever for any direct or consequential loss arising from its use. The content is strictly copyright and
reproduction of the whole or part of it in any form is prohibited without written permission from Savills Research.