Embed Size (px)
Citation preview
1.0 EXECUTIVE SUMMARY
1.1 Background
In Lao PDR, the power sector serves two vital national priorities:
(i) It promotes economic and social advancement by providing a reliable and affordable domestic power supply.
(ii) It earns foreign exchange from electricity exports. Strategic planning of the sector under the Power System Development Plan (PSDP) considers system development for best furthering both domestic and export objectives. Power planning in Lao PDR has in the past been largely intuitive but as the national and regional power systems expand and integrate, the optimal direction of development is becoming more difficult to determine. A rational development plan is needed to guide sector expansion and several planning and strategy studies have been prepared in response to this need. However, they are to some extent fragmentary and contradictory. The Power System Development Plan builds on this previous work to outline a development path for the period from 2005 to 2020. On a domestic level, the Lao power system is still in an early stage of development. Currently only 41% of households in Lao PDR are electrified but the Government of Lao PDR (GOL) has committed itself to increasing this to 90% by 2020. On an international level, power markets in the Greater Mekong Sub-region are changing. Bilateral power trading is already established and Lao PDR has been a key participant in this development. The trend towards closer regional cooperation continues and this is opening up wider opportunities. Regional grid integration and market structures are planned, though their scope and timing remain open.
1.2 Demand Forecast
1.2.1 Domestic Market
The reference point in formulating a development plan for the Lao power system is the forecast of demand established by the Government’s target of electrifying 90% of household by 2020. This target will be achieved by:
(i) Off-grid development – a program of off-grid electrification targets 150,000 household installations by 2020.
(ii) Grid extension program to increase on-grid household electrification to meet the balance of households required to achieve the GOL’s target.
Power System Development Plan August 2004 Final Report – Vol A: Main Report 1
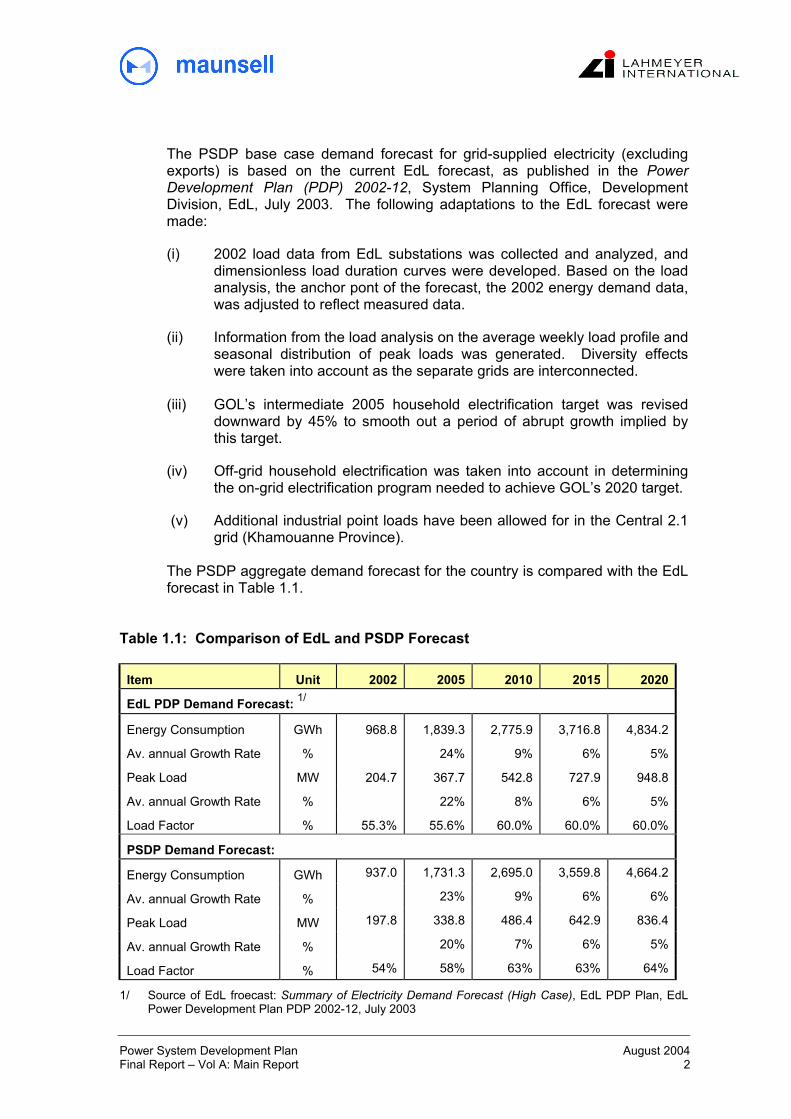
The PSDP base case demand forecast for grid-supplied electricity (excluding exports) is based on the current EdL forecast, as published in the Power Development Plan (PDP) 2002-12, System Planning Office, Development Division, EdL, July 2003. The following adaptations to the EdL forecast were made:
(i) 2002 load data from EdL substations was collected and analyzed, and dimensionless load duration curves were developed. Based on the load analysis, the anchor pont of the forecast, the 2002 energy demand data, was adjusted to reflect measured data.
(ii) Information from the load analysis on the average weekly load profile and seasonal distribution of peak loads was generated. Diversity effects were taken into account as the separate grids are interconnected.
(iii) GOL’s intermediate 2005 household electrification target was revised
downward by 45% to smooth out a period of abrupt growth implied by this target.
(iv) Off-grid household electrification was taken into account in determining the on-grid electrification program needed to achieve GOL’s 2020 target.
(v) Additional industrial point loads have been allowed for in the Central 2.1 grid (Khamouanne Province).
The PSDP aggregate demand forecast for the country is compared with the EdL forecast in Table 1.1.
Table 1.1: Comparison of EdL and PSDP Forecast
Item Unit 2002 2005 2010 2015 2020
EdL PDP Demand Forecast: 1/
Energy Consumption GWh 968.8 1,839.3 2,775.9 3,716.8 4,834.2
Av. annual Growth Rate % 24% 9% 6% 5%
Peak Load MW 204.7 367.7 542.8 727.9 948.8
Av. annual Growth Rate % 22% 8% 6% 5%
Load Factor % 55.3% 55.6% 60.0% 60.0% 60.0%
PSDP Demand Forecast:
Energy Consumption GWh 937.0 1,731.3 2,695.0 3,559.8 4,664.2
Av. annual Growth Rate % 23% 9% 6% 6%
Peak Load MW 197.8 338.8 486.4 642.9 836.4
Av. annual Growth Rate % 20% 7% 6% 5%
Load Factor % 54% 58% 63% 63% 64%
1/ Source of EdL froecast: Summary of Electricity Demand Forecast (High Case), EdL PDP Plan, EdL Power Development Plan PDP 2002-12, July 2003
Power System Development Plan August 2004 Final Report – Vol A: Main Report 2
1.2.2 Export Market
The Greater Mekong Subregion (GMS), comprising Lao PDR, Thailand, Vietnam, Cambodia, Myanmar and Yunnan Province of the People’s Republic of China, is endowed with substantial energy reserves, but they are unevenly distributed between member countries. Due to its energy surplus and geographical location at the hub of the GMS region, Lao PDR is strategically positioned to play a significant role in promoting regional power trade. The primary markets for Lao PDR are Thailand and Vietnam. These markets are large compared with the potential supply from Lao PDR and trade is therefore constrained by price rather than demand. Opportunities are also influenced by other factors including:
Relative costs of hydropower and thermal generation; •
•
•
•
•
Progress in establishing regional 500 kV transmission interconnections;
Timing and nature of power market reforms within GMS countries;
Availability of, and competition for, capital;
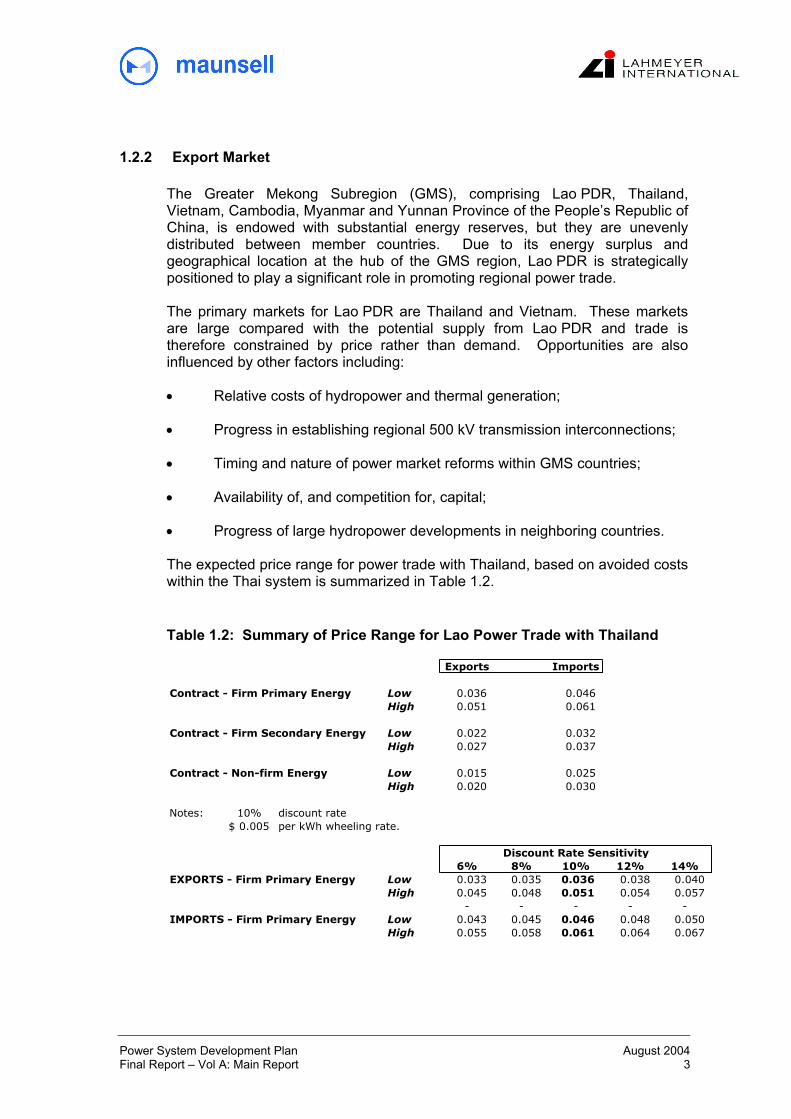
Progress of large hydropower developments in neighboring countries. The expected price range for power trade with Thailand, based on avoided costs within the Thai system is summarized in Table 1.2. Table 1.2: Summary of Price Range for Lao Power Trade with Thailand
Exports Imports
Contract - Firm Primary Energy Low 0.036 0.046 High 0.051 0.061
Contract - Firm Secondary Energy Low 0.022 0.032 High 0.027 0.037
Contract - Non-firm Energy Low 0.015 0.025 High 0.020 0.030
Notes: 10% discount rate0.005$ per kWh wheeling rate.
6% 8% 10% 12% 14%EXPORTS - Firm Primary Energy Low 0.033 0.035 0.036 0.038 0.040
High 0.045 0.048 0.051 0.054 0.057 - - - - -
IMPORTS - Firm Primary Energy Low 0.043 0.045 0.046 0.048 0.050 High 0.055 0.058 0.061 0.064 0.067
Discount Rate Sensitivity
Power System Development Plan August 2004 Final Report – Vol A: Main Report 3
Prices for future power trade with Vietnam and other GMS countries cannot be meaningfully specified until transmission linkages are firmly planned. Nevertheless, the basic principles governing price determination in the Thai market would also apply to other markets; i.e. Lao PDR will be able to trade power at a price up to the marginal cost of generation (capacity and energy), as adjusted for the cost of wheeling. Under current economic conditions five or six hydropower sites have the qualities needed for profitably serving either the Vietnamese or Thai markets. With growing demand in the region, increasing global energy prices and rising concern about greenhouse gasses, it is reasonable to expect an improvement in market conditions opening the way for other projects.
1.3 Project Evaluation
1.3.1 Evaluation Methodology
The TOR named 28 hydropower and two thermal projects for evaluation. The number of projects swelled to 33 after several new hydropower sites were added and one was dropped after it was found to be non-viable. Projects were evaluated on a standalone basis and also, as appropriate, in a basin context or in conjunctive operation with other projects. Desktop techniques were employed. No fieldwork was involved; evaluations used existing data. As appropriate, evaluations were based on a common set of assumptions to facilitate project comparisons on a consistent basis. The projects were evaluated in a two-stage process: (i) Screening: Projects were evaluated initially on a technical and
economic level using the Lahmeyer hydro project dimensioning and evaluation software, “EVALS”. Projects were compared on the basis of their weighted average generation costs (calculated assuming a value for secondary energy at only half the rate for primary). Those with values over a prescribed threshold were discarded unless by virtue of their system fit they were likely to perform a useful function in the domestic system. Nineteen hydropower sites were shortlisted.
(ii) Evaluation and Ranking: Shortlisted projects were studied in more
detail. Economic evaluations were preformed using EVALS. The project cash flows were adjusted to incorporate the monetary values of their positive and negative social and environmental effects. The value of weighted average generation cost, adjusted for social and environmental impacts, was used to rank projects.
1.3.2 Environmental Evaluation of Shortlisted Projects
For shortlisted projects, social and environmental effects were internalized into the evaluation and ranking process by reducing all impacts to monetary valuations. This was done using a new spreadsheet model, SESAMEE, to
Power System Development Plan August 2004 Final Report – Vol A: Main Report 4
process the many parameters involved in valuing project impacts. The model’s algorithms use market values and other input data to calculate positive and negative cash flows associated with each impact event. Two sets of cash flows were calculated using alternative market valuations as follows: • international (“global”) values; and • Lao (“local”) values. Each of the SESAMEE cash flows were separately combined with the project’s economic cash flows to give aggregate cash flows corresponding to global and local market valuations. The project rankings in Table 1.3 are based on cash flows derived from global market values. The SESAMEE approach introduces into the project evaluations large positive and negative cash flows hitherto neglected or externalized in traditional project evaluation methodologies. The influence of the SESAMEE cash flows on the ranking of projects, though, is minor except in one or two cases where projects are associated with significant environmental issues. The SESAMEE model is new and only limited verification has been possible within the PSDP timeframe. Calibration tests against existing impact studies were reassuring.
1.3.3 Ranking of Projects
Shortlisted projects are ranked according to their relative economic performance as measured by their weighted generation costs calculated using EVALS and SESAMEE. Project rankings are presented in Table 1.3. Projects were also analyzed on a financial basis to determine the financial tariff needed to satisfy investors and lenders. Hurdle rates were assumed as follows: • nominal, after-tax return on equity of 17% • minimum debt service coverage ratio of about 1.3. A standard set of assumptions was made regarding loan conditions and concession terms to ensure comparability. The results are formatted into a supply curve (Figure 1.1).
Power System Development Plan August 2004 Final Report – Vol A: Main Report 5
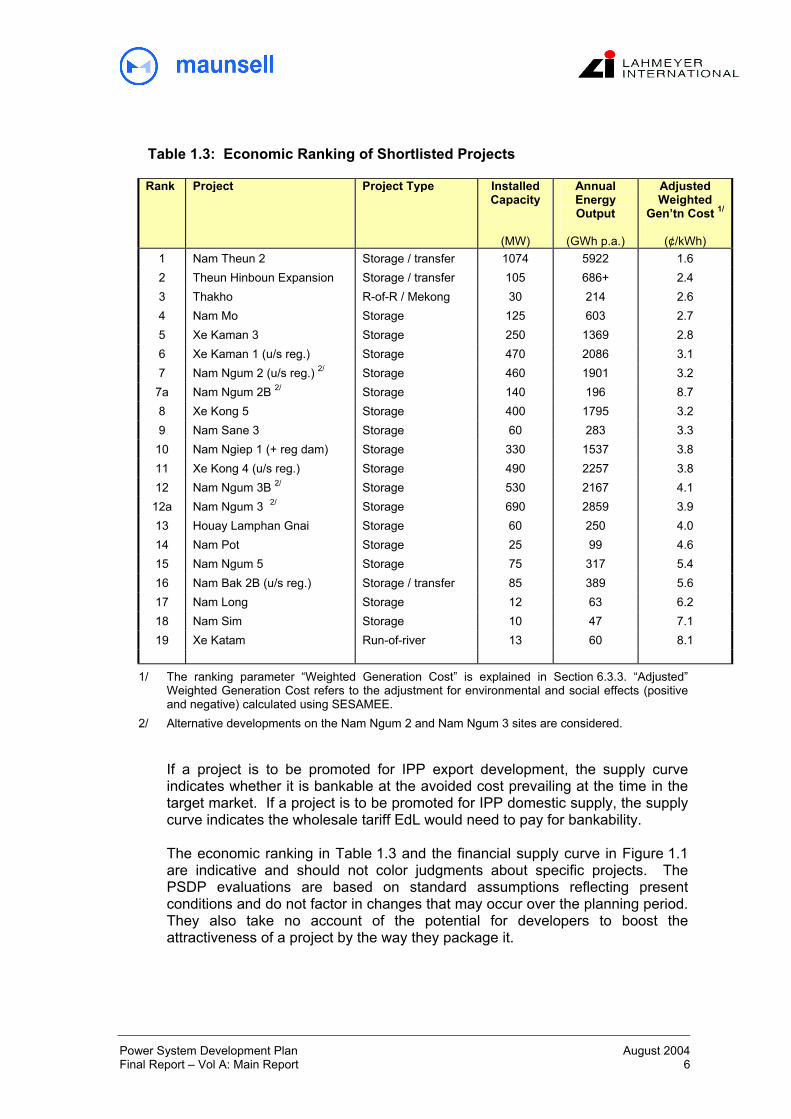
Table 1.3: Economic Ranking of Shortlisted Projects
Rank Project Project Type Installed Capacity
(MW)
Annual Energy Output
(GWh p.a.)
Adjusted Weighted
Gen’tn Cost 1/
(¢/kWh)
1 Nam Theun 2 Storage / transfer 1074 5922 1.6 2 Theun Hinboun Expansion Storage / transfer 105 686+ 2.4 3 Thakho R-of-R / Mekong 30 214 2.6 4 Nam Mo Storage 125 603 2.7 5 Xe Kaman 3 Storage 250 1369 2.8 6 Xe Kaman 1 (u/s reg.) Storage 470 2086 3.1 7 Nam Ngum 2 (u/s reg.) 2/ Storage 460 1901 3.2
7a Nam Ngum 2B 2/ Storage 140 196 8.7 8 Xe Kong 5 Storage 400 1795 3.2 9 Nam Sane 3 Storage 60 283 3.3
10 Nam Ngiep 1 (+ reg dam) Storage 330 1537 3.8 11 Xe Kong 4 (u/s reg.) Storage 490 2257 3.8 12 Nam Ngum 3B 2/ Storage 530 2167 4.1 12a Nam Ngum 3 2/ Storage 690 2859 3.9 13 Houay Lamphan Gnai Storage 60 250 4.0 14 Nam Pot Storage 25 99 4.6 15 Nam Ngum 5 Storage 75 317 5.4 16 Nam Bak 2B (u/s reg.) Storage / transfer 85 389 5.6 17 Nam Long Storage 12 63 6.2 18 Nam Sim Storage 10 47 7.1 19 Xe Katam Run-of-river 13 60 8.1
1/ The ranking parameter “Weighted Generation Cost” is explained in Section 6.3.3. “Adjusted” Weighted Generation Cost refers to the adjustment for environmental and social effects (positive and negative) calculated using SESAMEE.
2/ Alternative developments on the Nam Ngum 2 and Nam Ngum 3 sites are considered.
If a project is to be promoted for IPP export development, the supply curve indicates whether it is bankable at the avoided cost prevailing at the time in the target market. If a project is to be promoted for IPP domestic supply, the supply curve indicates the wholesale tariff EdL would need to pay for bankability. The economic ranking in Table 1.3 and the financial supply curve in Figure 1.1 are indicative and should not color judgments about specific projects. The PSDP evaluations are based on standard assumptions reflecting present conditions and do not factor in changes that may occur over the planning period. They also take no account of the potential for developers to boost the attractiveness of a project by the way they package it.
Power System Development Plan August 2004 Final Report – Vol A: Main Report 6
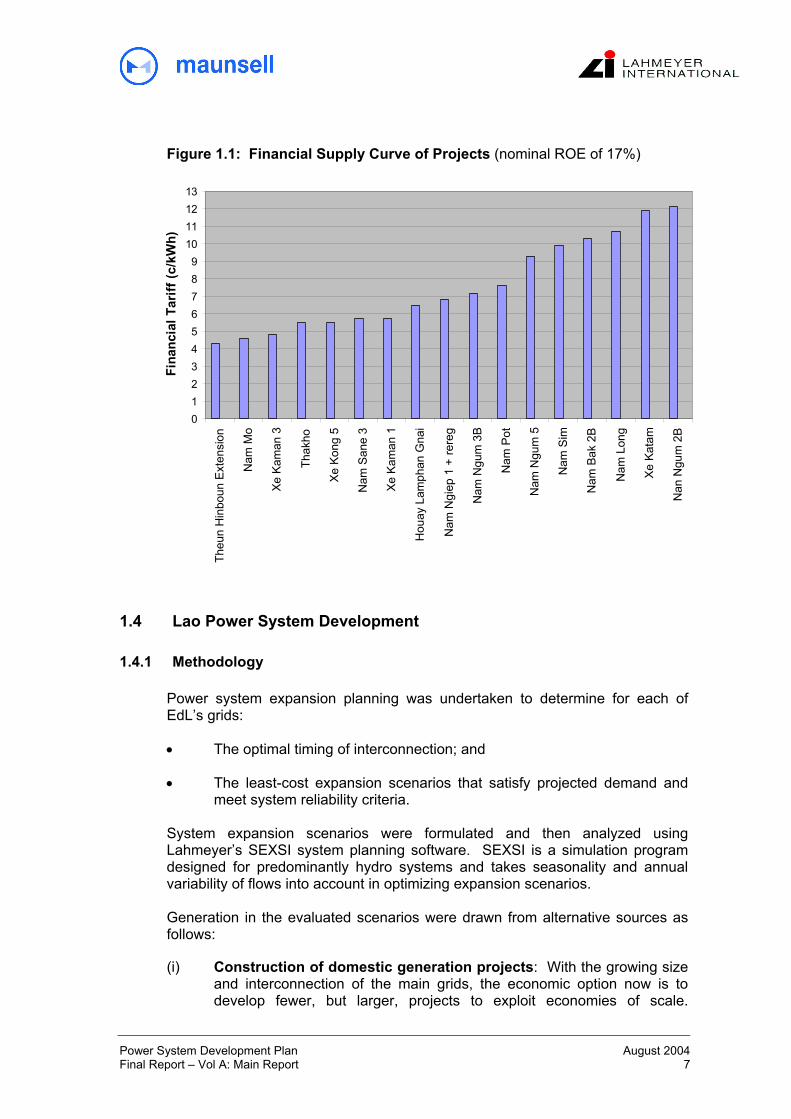
Figure 1.1: Financial Supply Curve of Projects (nominal ROE of 17%)
0123456789
10111213
Theu
n H
inbo
un E
xten
sion
Nam
Mo
Xe K
aman
3
Thak
ho
Xe K
ong
5
Nam
San
e 3
Xe K
aman
1
Hou
ay L
amph
an G
nai
Nam
Ngi
ep 1
+ re
reg
Nam
Ngu
m 3
B
Nam
Pot
Nam
Ngu
m 5
Nam
Sim
Nam
Bak
2B
Nam
Lon
g
Xe
Kata
m
Nan
Ngu
m 2
B
Fina
ncia
l Tar
iff (c
/kW
h)
1.4 Lao Power System Development
1.4.1 Methodology
Power system expansion planning was undertaken to determine for each of EdL’s grids:
• The optimal timing of interconnection; and
• The least-cost expansion scenarios that satisfy projected demand and meet system reliability criteria.
System expansion scenarios were formulated and then analyzed using Lahmeyer’s SEXSI system planning software. SEXSI is a simulation program designed for predominantly hydro systems and takes seasonality and annual variability of flows into account in optimizing expansion scenarios. Generation in the evaluated scenarios were drawn from alternative sources as follows:
(i) Construction of domestic generation projects: With the growing size and interconnection of the main grids, the economic option now is to develop fewer, but larger, projects to exploit economies of scale.
Power System Development Plan August 2004 Final Report – Vol A: Main Report 7

However, with a number of the more attractive sites now the subject of IPP mandates, the curious situation is arising where Lao PDR is putting the interests of its neighbors ahead of its own.
(ii) Purchases from IPP export projects:. Reliance on power purchases from IPPs up to the limit of the specified domestic entitlement is cost-effective and has the additional benefit of minimizing EdL’s capital requirements over the next five to ten years. However, this strategy involves uncertainty in, and lack of control over, the commissioning dates of new IPP capacity. Contingency planning involves the use of imports to buy time to implement a prepared fall-back scenario.
(iii) Purchases from Thailand: Interconnection of the EdL and EGAT systems confers significant power system planning advantages:
- Surplus energy that would otherwise be wasted through spilling can be sold to EGAT;
- Deficits in system demand can be covered by imports until they grow to equal the next capacity increment. In this way, new capacity is fully employed upon entering service, allowing the full economic benefit of new investments to be enjoyed from the outset.
- The timing of new capacity increments in hydro-based systems is often determined by system security concerns during dry years. Interconnection with the predominantly thermal Thai system allows EdL to cover dry year deficits with imports and thereby defer investments in new capacity.
- Slippages in the commissioning dates of IPP capacity selling partially or wholly to EdL can be covered for a period by increasing imports.
1.4.2 Grid Interconnection Strategy
The present EdL system consists of a number of separate grids. The principal grids are Central C1, Central C2.1, Central C2.2, and Southern. A strategy for interconnecting these grids was investigated using the SEXSI software and the following sequence and timing of interconnections was found to be optimal:
• Interconnection of C1 and C2.1 grids: The construction of a line from Pakxan to Thakhek should proceed as soon as possible.
• Interconnection of C2.1 and C2.2 grids: The construction of a line from Thakhek to Pakbo (Savannakhet) should proceed as soon as possible.
• Interconnection of C2.2 and Southern grids: An optimal interconnection date of 2017 was determined, but the optimization curve is flat and an earlier date could be justified. For the time being, a decision should be
Power System Development Plan August 2004 Final Report – Vol A: Main Report 8

deferred and the situation monitored. Interconnection should not occur before 2010.
In pure economic and financial terms, the construction of new transmission infrastructure to interconnect the three central grids through Lao territory may be more costly than the alternative of wheeling through the EGAT system. However, there are system security issues that may justify this additional outlay.
1.4.3 Northern Region
The major centers in the northern provinces of Oudomxai and Luangnamtha, and Phongsaly are currently being interconnected to the Central Grid under the Power Transmission and Distribution Project (PTD2). The loads from these centers are included in the system generation planning as part of the Central Grid. Several generation projects in the Northern Region were evaluated but none performed well. However, a small project of less than 50 MW, such as Viengphouka or Nam Long, may nevertheless be justified for its ancillary benefits including:
• Voltage support to the long 115 kV interconnection to the Central Grid; • Security of supply through reduced vulnerability to transmission outages; • Lower transmission losses through proximity of load and generation; • Diversification of generation (hydrological diversity, plant mix, etc.).
1.4.4 Central Region
Under the optimal grid interconnection strategy the Central grid, comprising the C1, C2.1 and C2.2 grids, will be interconnected as soon as possible. Industrial, mining and agricultural development in the Central Region is rapidly increasing the load in the Central Grid. There are a number of project sites that could be developed to meet this load but the least-cost expansion scenario (the “Preferred Scenario”) draws on GOL’s domestic off-take entitlements from two IPP projects, the Nam Theun 2 (75 MW) and Theun Hinboun Expansion (105 MW) projects (refer Figure 1.2). Under the Preferred Scenario, demand growth in the Central Grid to 2020 would be met in the following way:
Imports from EGAT would increase over the period to 2008. Imports, as a percentage of total energy, would peak in 2007 at about 30%.
•
•
•
In 2008, the new unit at Theun Hinboun (Unit 3, 105 MW) would come on-line and EdL would purchase its output from the Theun Hinboun Power Company.
From 2010, EdL would purchase its off-take entitlement of 300 GWh (75 MW) from the Nam Theun 2 Power Company;
Power System Development Plan August 2004 Final Report – Vol A: Main Report 9

By the time the Nam Theun 2 and Theun Hinboun Expansion domestic entitlements have been absorbed, peak load in the Central Grid would have grown to more than 400 MW. This opens the way for the introduction of larger and more cost-effective projects. Nam Ngiep 1 (213 MW), with a commissioning date of 2014, is the next least-cost augmentation. The Nam Ngiep 1 project could be developed as a public sector or private sector project or as a PPP.
•
The Preferred Scenario is heavily dependent on IPP off-take and a Fall-Back Scenario is developed to provide an expansion plan less susceptible to the uncertainties of IPP development. Smaller projects such as Nam Ngum 5, Nam Bak 2B or Nam Pot substitute for the Theun Hinboun Expansion off-take (refer Figure 1.3). The Fall-Back Scenario is about 5% higher more expensive than the Preferred Scenario.
Figure 1.2: Central Grid System Expansion 2005 – 2020 Preferred Scenario
2005 2007 2009 2011 2013 2015 2017 2019 20210
1
2
3
4
5Energy Demand (TWh)
Domestic Hydro + IPP Sales
Cross Border Imports
Export of Dump Energy
Energy Demand
T heu
n H
inbo
un E
xten
s ion
Nam
The
un 2
Nam
Nge
ip 1
Reference Scenario
Power System Development Plan August 2004 Final Report – Vol A: Main Report 10
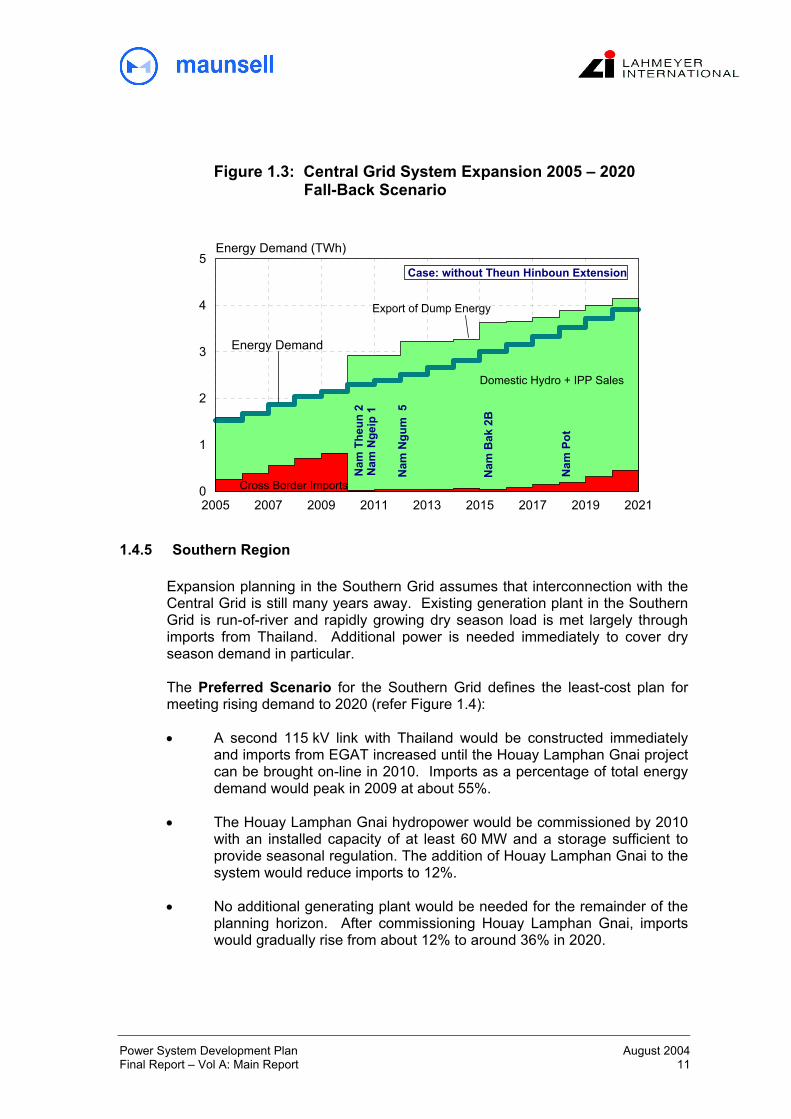
Figure 1.3: Central Grid System Expansion 2005 – 2020 Fall-Back Scenario
2005 2007 2009 2011 2013 2015 2017 2019 20210
1
2
3
4
5Energy Demand (TWh)
Domestic Hydro + IPP Sales
Cross Border Imports
Export of Dump Energy
Energy DemandN
am T
heun
2N
am N
g eip
1
Nam
Ngu
m 5
Nam
Pot
Nam
Bak
2B
Case: without Theun Hinboun Extension
1.4.5 Southern Region
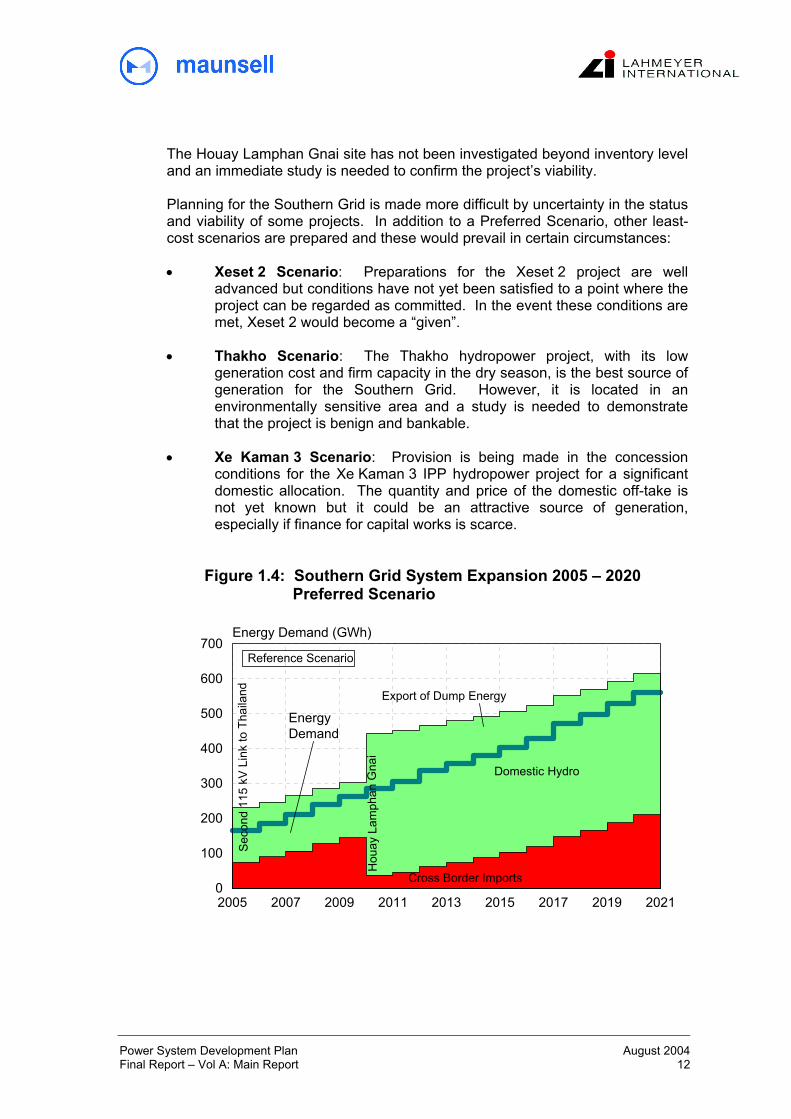
Expansion planning in the Southern Grid assumes that interconnection with the Central Grid is still many years away. Existing generation plant in the Southern Grid is run-of-river and rapidly growing dry season load is met largely through imports from Thailand. Additional power is needed immediately to cover dry season demand in particular. The Preferred Scenario for the Southern Grid defines the least-cost plan for meeting rising demand to 2020 (refer Figure 1.4):
A second 115 kV link with Thailand would be constructed immediately and imports from EGAT increased until the Houay Lamphan Gnai project can be brought on-line in 2010. Imports as a percentage of total energy demand would peak in 2009 at about 55%.
•
•
•
The Houay Lamphan Gnai hydropower would be commissioned by 2010 with an installed capacity of at least 60 MW and a storage sufficient to provide seasonal regulation. The addition of Houay Lamphan Gnai to the system would reduce imports to 12%.
No additional generating plant would be needed for the remainder of the planning horizon. After commissioning Houay Lamphan Gnai, imports would gradually rise from about 12% to around 36% in 2020.
Power System Development Plan August 2004 Final Report – Vol A: Main Report 11
The Houay Lamphan Gnai site has not been investigated beyond inventory level and an immediate study is needed to confirm the project’s viability. Planning for the Southern Grid is made more difficult by uncertainty in the status and viability of some projects. In addition to a Preferred Scenario, other least-cost scenarios are prepared and these would prevail in certain circumstances:
• Xeset 2 Scenario: Preparations for the Xeset 2 project are well advanced but conditions have not yet been satisfied to a point where the project can be regarded as committed. In the event these conditions are met, Xeset 2 would become a “given”.
• Thakho Scenario: The Thakho hydropower project, with its low generation cost and firm capacity in the dry season, is the best source of generation for the Southern Grid. However, it is located in an environmentally sensitive area and a study is needed to demonstrate that the project is benign and bankable.
• Xe Kaman 3 Scenario: Provision is being made in the concession conditions for the Xe Kaman 3 IPP hydropower project for a significant domestic allocation. The quantity and price of the domestic off-take is not yet known but it could be an attractive source of generation, especially if finance for capital works is scarce.
Figure 1.4: Southern Grid System Expansion 2005 – 2020 Preferred Scenario
2005 2007 2009 2011 2013 2015 2017 2019 20210
100
200
300
400
500
600
700Energy Demand (GWh)
Domestic Hydro
Cross Border Imports
Export of Dump Energy
Energy Demand
Hou
ay L
amph
an G
nai
Sec
ond
115
kV L
ink
to T
haila
nd
Reference Scenario
Power System Development Plan August 2004 Final Report – Vol A: Main Report 12
1.4.6 Transmission and Distribution
GOL’s electrification target of 90% of households by the year 2020 provides the overarching objective of grid development, but the factor that will most decide the rate at which the distribution system expands is the availability of funds. Multilateral and bilateral loans are in place for several major transmission and distribution projects but much of the program remains unfunded. Most of the urban and provincial centers have already been, or soon will be, electrified and grid investments are becoming increasingly marginal. Planned extensions of the EdL grid over the period to 2020 will absorb most of the remaining load centers of any significance into the grid. The additional load captured by these extensions has been included in the PSDP demand forecast.
1.4.7 Off-Grid Electrification
A component in GOL’s strategy for meeting its 2020 electrification target of 90% and its intermediate targets is its off-grid household electrification program employing conventional off-grid technologies includes solar photovoltaic and village hydro/diesel mini grids. The off-grid program targets 150,000 household installations by 2020, about 50,000 of which will be overtaken by the expansion of the grid during that period. Off-grid development is promoted by GOL and a number of development agencies as a means of bringing affordable electricity to remote communities for whom there is little prospect of grid electrification in the coming years. Energy Service Companies (ESCOs) have been established for the installation and servicing of off-grid units according to commercial principles. Due to the entrepreneurial nature of the program, the numbers of installations may vary widely from those targeted.
1.4.8 Domestic Power System Investment Program
Least cost development of the Lao power system as proposed in the PSDP involves a sequence of generation, transmission, distribution and off-grid investments to meet GOL’s electrification objectives and to satisfy resulting demand and system reliability criteria. The sequence of capital investments required under the PSDP domestic system expansion plan involves annual outlays on generation, transmission, distribution and off-grid development of the order of US$50 million. Due to the hiatus in generation development in recent years and the rapid growth implied in ambitious intermediate electrification targets, annual investment peaks at over US$100 million around 2010. The incremental cost of EdL system development under the PSDP Preferred Scenarios, including generation, transmission and distribution, is calculated to be about 8.4 ¢/kWh.
Power System Development Plan August 2004 Final Report – Vol A: Main Report 13
1.5 Export Market Development
1.5.1 Export Scenarios
There is no systematic basis for optimizing the sequence and timing of export projects in the way of domestic power system scenarios. In the Thai and Vietnamese markets, Lao PDR is a price taker and the formulation of export development scenarios essentially comes down to judgments about the quality of project sites and the ability of developers to package their projects to meet hurdle rates of return and debt service at the specified avoided cost tariff. Effective planning of export projects is further frustrated by a lack of control over financing and implementation processes. A Base Export Scenario is nominated in Table 1.4. As a sensitivity measure, an Optimistic Export Scenario is also proposed. Commercial operation dates were fixed according to a developer’s nominated date only where such dates are realistic. Projects were otherwise spaced to avoid institutional overload by keeping the number concurrently under development to a manageable level.
1.5.2 GOL Revenues from Export Development
The Base Export Scenario forms the basis of estimates of GOL’s cash flow receipts from export projects to 2020 (refer Table 1.5).
Power System Development Plan August 2004 Final Report – Vol A: Main Report 14
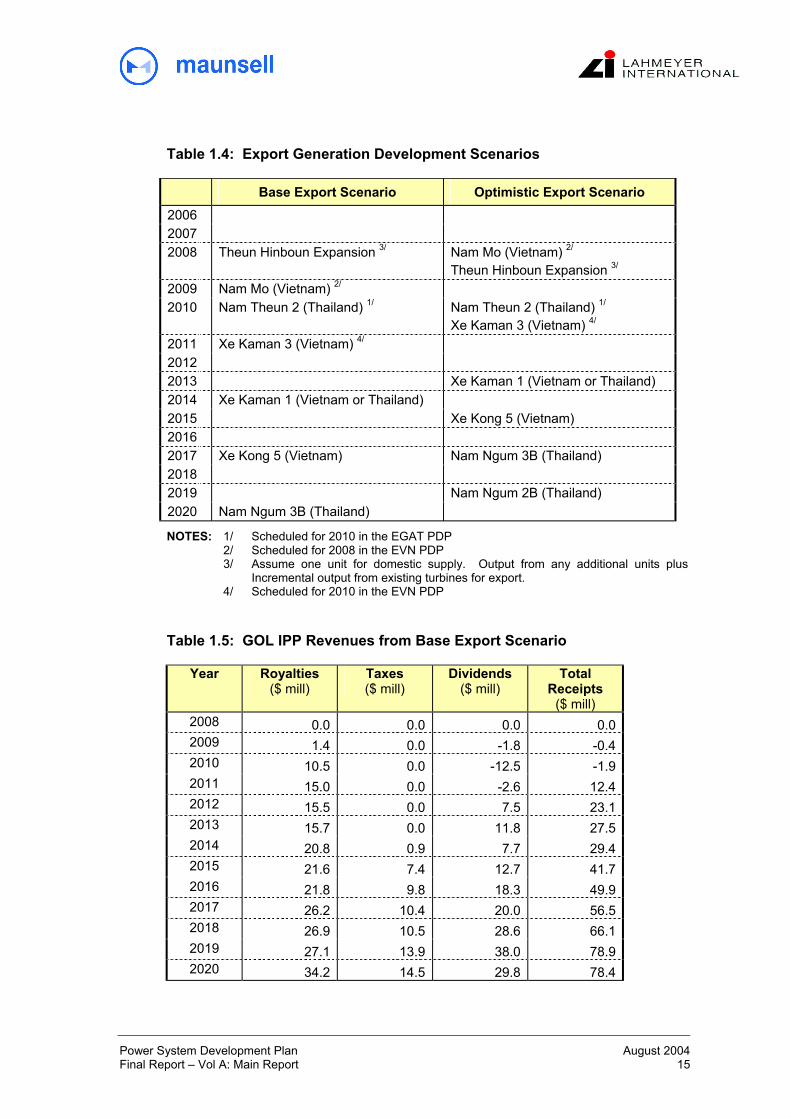
Table 1.4: Export Generation Development Scenarios
Base Export Scenario Optimistic Export Scenario 2006 2007 2008 Theun Hinboun Expansion 3/ Nam Mo (Vietnam) 2/
Theun Hinboun Expansion 3/ 2009 Nam Mo (Vietnam) 2/ 2010 Nam Theun 2 (Thailand) 1/
Nam Theun 2 (Thailand) 1/ Xe Kaman 3 (Vietnam) 4/
2011 Xe Kaman 3 (Vietnam) 4/
2012 2013 Xe Kaman 1 (Vietnam or Thailand) 2014 Xe Kaman 1 (Vietnam or Thailand) 2015 Xe Kong 5 (Vietnam) 2016 2017 Xe Kong 5 (Vietnam) Nam Ngum 3B (Thailand) 2018 2019 Nam Ngum 2B (Thailand) 2020 Nam Ngum 3B (Thailand)
NOTES: 1/ Scheduled for 2010 in the EGAT PDP 2/ Scheduled for 2008 in the EVN PDP 3/ Assume one unit for domestic supply. Output from any additional units plus
Incremental output from existing turbines for export. 4/ Scheduled for 2010 in the EVN PDP Table 1.5: GOL IPP Revenues from Base Export Scenario
Year Royalties ($ mill)
Taxes ($ mill)
Dividends ($ mill)
Total Receipts
($ mill) 2008 0.0 0.0 0.0 0.0 2009 1.4 0.0 -1.8 -0.4 2010 10.5 0.0 -12.5 -1.9 2011 15.0 0.0 -2.6 12.4 2012 15.5 0.0 7.5 23.1 2013 15.7 0.0 11.8 27.5 2014 20.8 0.9 7.7 29.4 2015 21.6 7.4 12.7 41.7 2016 21.8 9.8 18.3 49.9 2017 26.2 10.4 20.0 56.5 2018 26.9 10.5 28.6 66.1 2019 27.1 13.9 38.0 78.9 2020 34.2 14.5 29.8 78.4
Power System Development Plan August 2004 Final Report – Vol A: Main Report 15

1.6 Nam Theun 2 Issues
1.6.1 Scope of Studies
The TOR defines specific tasks in relation to the Nam Theun 2 Hydroelectric Project; they are to:
Evaluate alternative reservoir Full Supply Levels (FSLs) •
•
•
Compare Nam Theun 2 with alternative power projects and determine whether Nam Theun 2 is more beneficial for GOL than other projects in terms of the cost of domestic off-take and tax, royalty and dividend receipts.
Determine how long it will take for the domestic off-take allocation from Nam Theun 2 of 300 GWh per annum to be fully absorbed by the Lao power system.
1.6.2 Alternative Reservoir Full Supply Levels
The performance of Nam Theun 2 was simulated for a range of FSLs and Table 1.6 describes the effect on economic performance using annual energy production and weighted average cost of generation as indicators, expressed as a percentage of the NTPC reference case (FSL = 538 masl). Table 1.6: Nam Theun 2 – Comparison of FSLs
Reservoir
FSL (m asl)
Area (km2)
Volume (mcm)
Installed Capacity
(MW)
Energy Generation 2/
(GWh pa)
Relative Project
Cost (%)
Relative Generation
Cost 1/ (%)
538 450 3680 1074 5898 (100%) 100 100 535 354 2466 1070 5218 (88%) 98 118 532 291 1498 1060 4674 (79%) 96 136 530 218 984 1050 4544 (77%) 94 150 528 164 602 1040 4357 (74%) 92 225
NOTES: 1/ Based on weighted average generation cost. 2/ Energy outputs are adjusted for reduced generation at Theun Hinboun Deterioration of economic performance below RL 532 is severe and this sets an effective floor. More detailed comparisons of the NTPC reference case with two layouts were made: 1. Run-of-river case (FSL = 532 masl) 2. Ban Signo case with the dam moved upstream (FSL = 538 masl)
Power System Development Plan August 2004 Final Report – Vol A: Main Report 16

The run-of-river layout involves a significantly smaller reservoir and this would reduce the social and ecological impacts. Although significant, they are associated with a 36% increase in the cost of generation and this would render the project unviable. The Ban Signo variant has the same FSL as the NTPC reference case but impacts are reduced by moving the dam to a site about 10 km upstream. The principal social benefit of moving the dam upstream is a 9% reduction in the number of people resettled. From an environmental perspective, the principal gain is a 30% reduction in reservoir area, but the area saved is largely degraded. The economic penalty for the Ban Signo arrangement is an increase in the cost of generation of roughly 20%. This, too, could undermine the viability of the project under current market conditions.
1.6.3 Comparison of Price for Domestic Power Off-take from Nam Theun 2
Domestic power from an export IPP project such as Nam Theun 2 is priced against the opportunity cost of that power to the project company. In general terms, the revenue foregone by the project company with each unit of output sold to EdL rather than the foreign off-taker is equal to the export tariff adjusted for transmission loss differentials, wheeling and any differences in the level of supply commitment. The export tariff is determined, in turn, by negotiation based on avoided cost within the foreign off-taker’s system. Therefore, the value of the tariff is not a function of a project’s characteristics – these determine whether or not a project will proceed – but of the characteristics of the EGAT or EVN system and the skills of the negotiating teams.
1.6.4 Comparison of Government Receipts
GOL receipts generated over the lifetime of a project were compared for the projects making up the export scenarios defined in Table 1.4. An export project’s revenue earning potential for GOL comes in the form of taxes, royalties and dividends and this will depend on a number of factors including average annual generation, tariff, GOL equity share and concession terms (taxes and royalties). Cash flow projections of frontline IPP candidate projects confirm the greater earning capacity of Nam Theun 2 (refer Table 1.7).
Power System Development Plan August 2004 Final Report – Vol A: Main Report 17
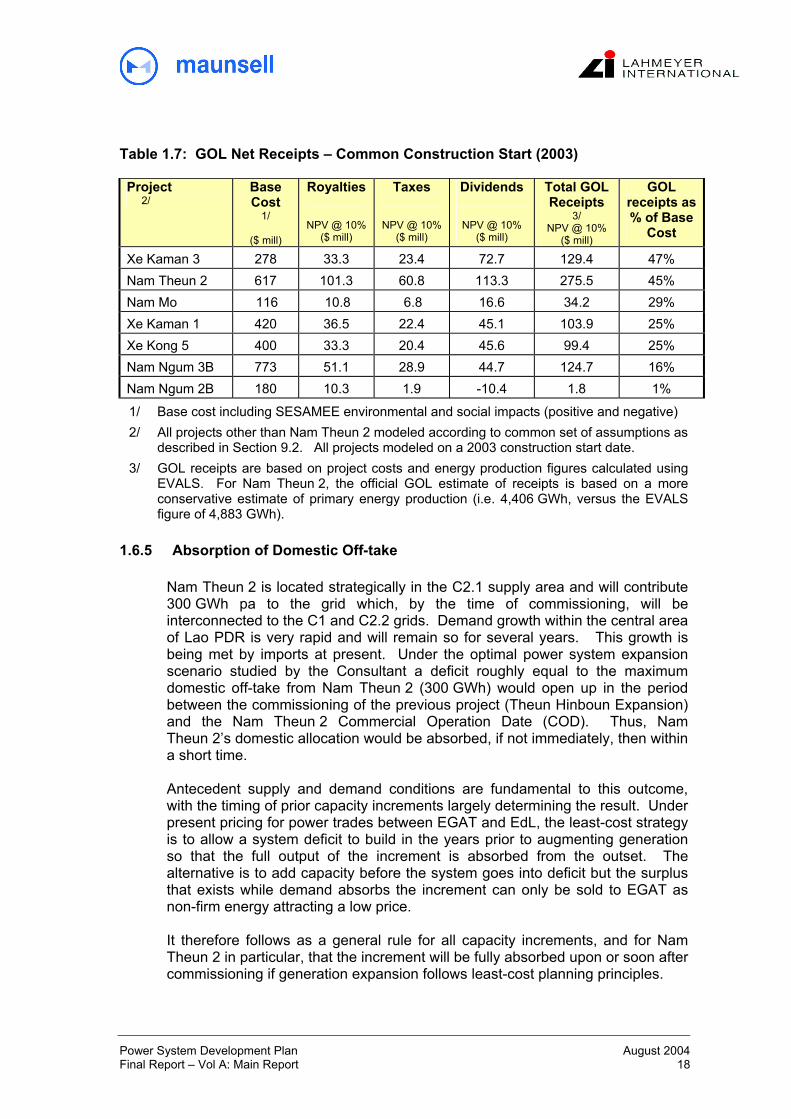
Table 1.7: GOL Net Receipts – Common Construction Start (2003)
Project 2/
Base Cost
1/
($ mill)
Royalties
NPV @ 10% ($ mill)
Taxes
NPV @ 10% ($ mill)
Dividends
NPV @ 10% ($ mill)
Total GOL Receipts
3/ NPV @ 10%
($ mill)
GOL receipts as % of Base
Cost
Xe Kaman 3 278 33.3 23.4 72.7 129.4 47% Nam Theun 2 617 101.3 60.8 113.3 275.5 45% Nam Mo 116 10.8 6.8 16.6 34.2 29% Xe Kaman 1 420 36.5 22.4 45.1 103.9 25% Xe Kong 5 400 33.3 20.4 45.6 99.4 25% Nam Ngum 3B 773 51.1 28.9 44.7 124.7 16% Nam Ngum 2B 180 10.3 1.9 -10.4 1.8 1%
1/ Base cost including SESAMEE environmental and social impacts (positive and negative) 2/ All projects other than Nam Theun 2 modeled according to common set of assumptions as
described in Section 9.2. All projects modeled on a 2003 construction start date. 3/ GOL receipts are based on project costs and energy production figures calculated using
EVALS. For Nam Theun 2, the official GOL estimate of receipts is based on a more conservative estimate of primary energy production (i.e. 4,406 GWh, versus the EVALS figure of 4,883 GWh).
1.6.5 Absorption of Domestic Off-take
Nam Theun 2 is located strategically in the C2.1 supply area and will contribute 300 GWh pa to the grid which, by the time of commissioning, will be interconnected to the C1 and C2.2 grids. Demand growth within the central area of Lao PDR is very rapid and will remain so for several years. This growth is being met by imports at present. Under the optimal power system expansion scenario studied by the Consultant a deficit roughly equal to the maximum domestic off-take from Nam Theun 2 (300 GWh) would open up in the period between the commissioning of the previous project (Theun Hinboun Expansion) and the Nam Theun 2 Commercial Operation Date (COD). Thus, Nam Theun 2’s domestic allocation would be absorbed, if not immediately, then within a short time. Antecedent supply and demand conditions are fundamental to this outcome, with the timing of prior capacity increments largely determining the result. Under present pricing for power trades between EGAT and EdL, the least-cost strategy is to allow a system deficit to build in the years prior to augmenting generation so that the full output of the increment is absorbed from the outset. The alternative is to add capacity before the system goes into deficit but the surplus that exists while demand absorbs the increment can only be sold to EGAT as non-firm energy attracting a low price. It therefore follows as a general rule for all capacity increments, and for Nam Theun 2 in particular, that the increment will be fully absorbed upon or soon after commissioning if generation expansion follows least-cost planning principles.
Power System Development Plan August 2004 Final Report – Vol A: Main Report 18