Embed Size (px)
Citation preview
3
1.0 Executive Summary 12
1.1 Introduction ..............................................................................................................................................................................12
1.1.1 Overview of Program Benefits
1.1.2 Consistency with MEEIA Objectives
1.1.3 The Value of DSM in Our Region
1.1.4 Benefits for All
1.2 Program Savings Targets and Cost-effectiveness ................................................................................................................ 15
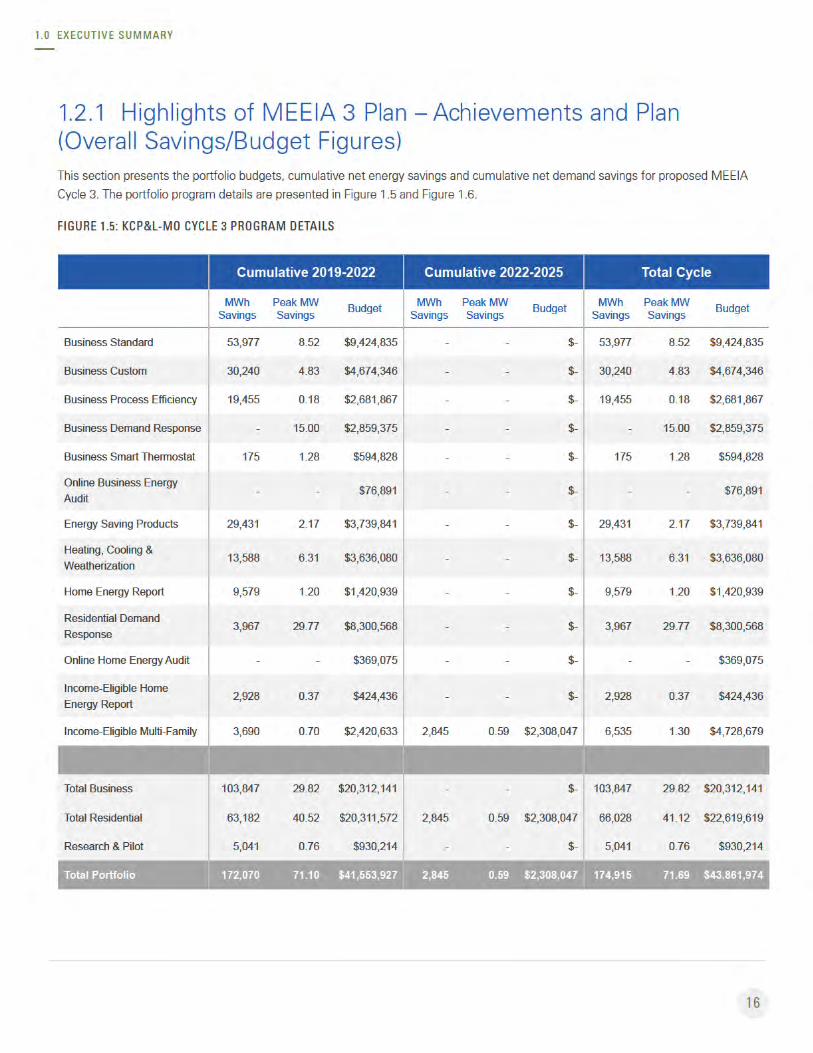
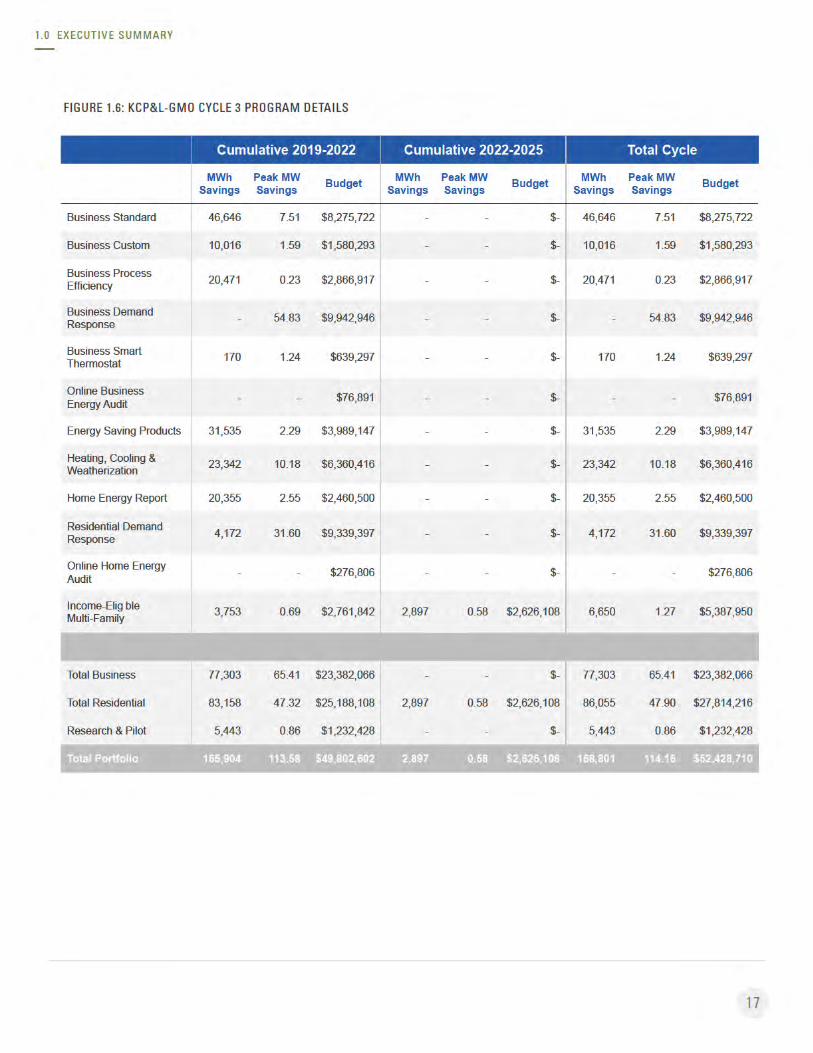
1.2.1 Highlights of MEEIA 3 Plan - Achievements and Plan (Overall Savings/Budget Figures)
1.2.2 Overall Cost-effectiveness
1.3 Recovery Mechanism .............................................................................................................................................................. 18
1.4 New Attributes this Cycle ........................................................................................................................................................ 19
1.5 Timeline and Considerations for Approval ........................................................................................................................... 20
1.5.1 Future Considerations
1.5.2 Alignment of Rules/Statute/Stakeholders/Utility
2.0 Plan Overview 22
2.1 Program History, Progress and Learnings ............................................................................................................................ 22
2.1.1 The Evolution of DSM
2.1.2 Our History of DSM Programs
2.2 Impact Benefits and Cost-Effectiveness ................................................................................................................................. 24
2.2.1 Cost-Effectiveness
2.2.2 Economic Impact
2.3 Market Potential and DSM Targets ........................................................................................................................................ 26
2.4 Customer-Focused Portfolio Approach ................................................................................................................................. 27
3.0 Program Portfolio Details 29
3.1 Energy Efficiency ...................................................................................................................................................................... 30
3.1.1 Residential Programs
3.1.2 Business Programs
TABLE OF CONTENTS
Table of Contents
4
3.2 Long-Lead Program Continuity .............................................................................................................................................. 37
3.2.1 Description
3.2.2 Targets and Participants
3.2.3 Rebates and Incentives
3.3 Demand Response (DR)........................................................................................................................................................... 38
3.3.1 Residential Demand Response
3.3.2 Business Demand Response
3.2.3 Distributed Energy Resource Management System (DERMS) Impact in MEEIA Cycle 3
3.3.3 DR Aggregation and Southwest Power Pool Market Participation
3.4 Income-Eligible Multi-Family Program .................................................................................................................................. 41
3.4.1 Overview
3.4.2 Implementation Strategy
3.4.3 Program Strategy
3.4.4 Rebates and Incentives
3.5 Innovative Programs ................................................................................................................................................................ 44
3.5.1 Proposed and Potential Residential Research and Pilot Offerings
3.6 Marketing .................................................................................................................................................................................. 46
3.6.1 Integrated Marketing Communications Approach
3.6.2 Targeted Marketing Communications
3.6.3 Marketing Collaborators
3.6.4 Filing and Stakeholder Communication
4.0 Recovery Mechanism 51
4.1 Overall Explanation of Mechanism ........................................................................................................................................ 51
4.1.1 Direct Program Costs Recovery Component
4.1.2 Throughput Disincentive (TD) Recovery Component
4.1.3 Earnings Opportunity (EO) Component
4.2 Proposed Changes to Improve the Mechanism .................................................................................................................... 52
4.2.1 Divide Non-Residential Rate by Customer Class
4.2.2 Changes to a 12-Month Rolling Forecast
4.2.3 Change the EO and Recovery to Annual
4.3 Program Costs .......................................................................................................................................................................... 54
4.4 Throughput Disincentive ......................................................................................................................................................... 55
4.4.1 Throughput Disincentive (TD) Calculation
4.4.2 Rate Case Annualization
TABLE OF CONTENTS
5
TABLE OF CONTENTS
4.5 Earnings Opportunity (EO) ...................................................................................................................................................... 57
4.5.1 Income-Eligible Multi-Family EO Performance Metrics
4.6 Customer DSIM Rate Impact Modeling ................................................................................................................................. 60
5.0 Sustaining Success 68
5.1 Missouri DSM Policy and KCP&L Resource Selection Process ........................................................................................... 68
5.2 Focusing on Long-Lived Measures ........................................................................................................................................ 72
5.3 Flexibility in Program During Cycle ........................................................................................................................................ 73
5.4 Ongoing Stakeholder Engagement ........................................................................................................................................ 73
5.5 EM&V Plan ................................................................................................................................................................................ 74
5.6 Opt-Out Margin ........................................................................................................................................................................ 74
6.0 Collaborative Process to Approval 75
6.1 Technical Conference Schedule ............................................................................................................................................. 75
6.2 Stakeholder Access to Information ........................................................................................................................................ 76
6.3 Key Factors and Company Positions for Approval ............................................................................................................... 76
6.4 Achievable Time Schedule ...................................................................................................................................................... 77
7.0 MEEIA Rules Requirements 79
7.1 MEEIA Rules Filing Requirements .......................................................................................................................................... 79
7.2 MEEIA Rules Variances ............................................................................................................................................................ 80
6
8.0 Appendices
APPENDICES
8.1 Program Tariff Sheets
8.2 Detailed Program Descriptions
8.3 Technical Resource Manual
8.4 Detailed EM&V Plan
8.5 2017 DSM Potential Study conducted by Applied Energy Group (AEG)
8.6 Measure Incentive Ranges
8.7 Earnings Opportunity Matrix
8.8 Customer Research
8.9 Financing Research
8.10 DSIM Tariff Sheets
8.11 Additional Integrated Resource Plan Results
8.12 Witness Details
7
List of Figures
LIST OF FIGURES
1.0 Executive Summary 12
Figure 1.1: Demand-Side Management Results to Date ............................................................................................................ 14
Figure 1.2: MEEIA 3 Proposed Demand-Side Management Efforts (Summary) ..................................................................... 14
Figure 1.3: Summary of KCP&L-MO MEEIA Cycle 2 and Proposed Cycle 3 ............................................................................ 15
Figure 1.4: Summary of KCP&L-GMO MEEIA Cycle 2 and Proposed Cycle 3 .......................................................................... 15
Figure 1.5: KCP&L-MO Cycle 3 Program Details ......................................................................................................................... 16
Figure 1.6: KCP&L-GMO Cycle 3 Program Details ...................................................................................................................... 17
Figure 1.7: KCP&L-MO Cycle 3 Portfolio Cost-Effectiveness Summary ................................................................................... 18
Figure 1.8: KCP&L-GMO Cycle 3 Portfolio Cost-Effectiveness Summary ................................................................................ 18
Figure 1.9: Select MEEIA 3 Program Improvements .................................................................................................................. 20
2.0 Plan Overview 22
Figure 2.1: Historic DSM Program Summary (2005 – September 30, 2018) ............................................................................ 23
Figure 2.2: MEEIA Cycle 2 Implementation Contractor FTEs in Missouri ................................................................................ 25
Figure 2.3: E-Source Residential Customer Satisfaction Study ................................................................................................. 27
3.0 Program Portfolio Details 29
Figure 3.1: Residential Energy Efficiency Programs ................................................................................................................... 31
Figure 3.2: Residential Education, Marketing and Training Activities ...................................................................................... 31
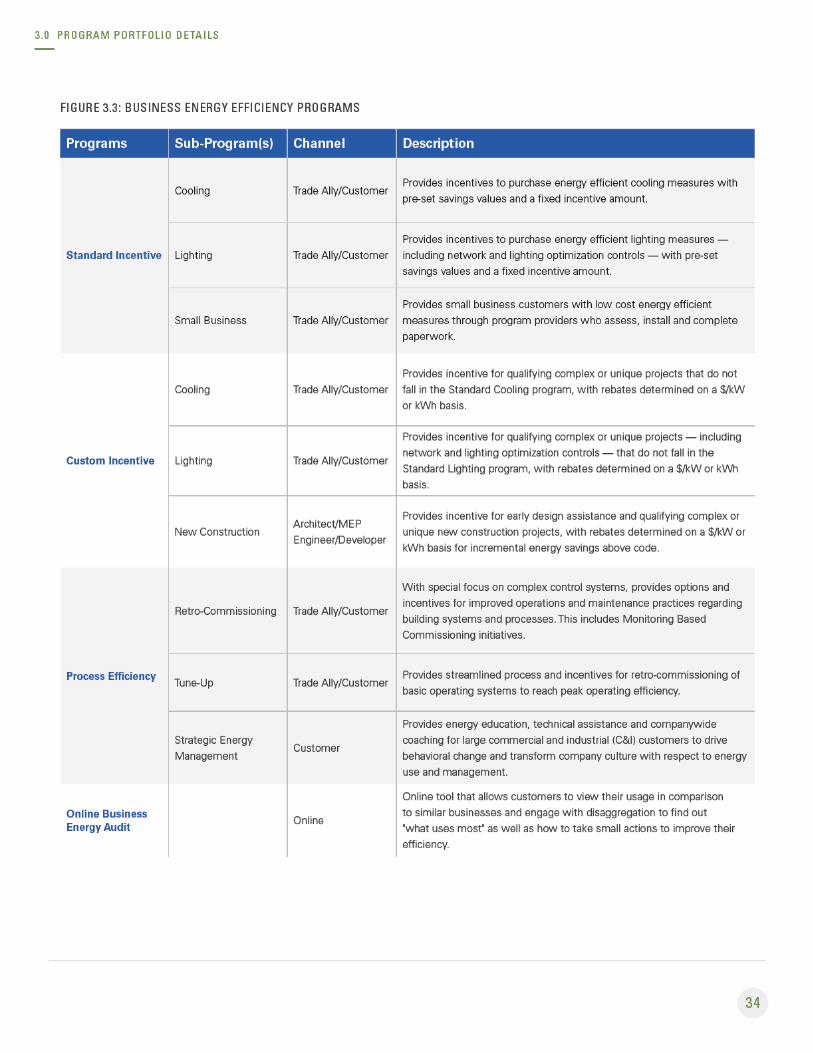
Figure 3.3: Business Energy Efficiency Programs....................................................................................................................... 34
Figure 3.4: Business Education and Training Activities ............................................................................................................. 35
Figure 3.5: Long-Lead Continuity Process ................................................................................................................................... 37
Figure 3.6: Demand Response Programs .................................................................................................................................... 38
Figure 3.7: Surround Sound Marketing Tactics .......................................................................................................................... 46
8
Figure 3.8: Marketing Funnel ....................................................................................................................................................... 47
Figure 3.9: Marketing Path Toward Customer Engagement .................................................................................................... 47
Figure 3.10: Continued Energy Efficiency Programs and Cost-Recovery Mechanism............................................................ 50
4.0 Recovery Mechanism 51
Figure 4.1: Positive Customer Impact of Change to Annual Recovery of EO and 12-Month Forecast Periods ................... 54
Figure 4.2: Initial Net-to-Gross (NTG) Factors by Program ........................................................................................................ 55
Figure 4.3: EO Matrix ..................................................................................................................................................................... 58
Figure 4.4: PV of Net Benefits – KCP&L-MO ................................................................................................................................ 60
Figure 4.5: PV of Net Benefits – KCP&L-GMO ............................................................................................................................. 60
Figure 4.6: DSIM Rates KCP&L-MO .............................................................................................................................................. 61
Figure 4.7: DSIM Rates KCP&L-GMO ........................................................................................................................................... 61
Figure 4.8: DSIM Bill Impacts KCP&L-MO ................................................................................................................................... 62
Figure 4.9: DSIM Bill Impacts KCP&L-GMO ................................................................................................................................. 62
Figure 4.10: kWh Savings from Baseline kWh Sales KCP&L-MO.............................................................................................. 63
Figure 4.11: kWh Savings from Baseline kWh Sales KCP&L-GMO ........................................................................................... 63
Figure 4.12: MEEIA Cycle 3 Plan Impacts on KCP&L-MO Earnings .......................................................................................... 65
Figure 4.13: MEEIA Cycle 3 Plan Impacts on KCP&L-GMO Earnings ....................................................................................... 66
Figure 4.14: MEEIA Cycle 3 Plan Impact on KCP&L-MO Key Credit Metrics ............................................................................ 67
Figure 4.15: MEEIA Cycle 3 Plan Impact on KCP&L-GMO Key Credit Metrics ......................................................................... 67
5.0 Sustaining Success 68
Figure 5.1: MEEIA Cycle 3 Benefits ($ million, 20-year NPVRR)
KCP&L-MO/KCP&L-GMO Joint Plans ........................................................................................................................................... 70
Figure 5.2: RAP- Benefits ($ million, 20-year NPVRR)
KCP&L-MO/KCP&L-GMO Joint Plans ........................................................................................................................................... 71
Figure 5.3: MEEIA Cycle 3 Benefits ($ million, 20-year NPVRR)
KCP&L-MO Standalone ................................................................................................................................................................. 71
Figure 5.4: RAP- Benefits ($ million, 20-year NPVRR)
KCP&L-MO Standalone ................................................................................................................................................................. 71
Figure 5.5: KCP&L-MO & KCP&L-GMO - Demand Impact of Long Life Measures .................................................................. 72
LIST OF FIGURES
9
6.0 Collaborative Process to Approval 75
Figure 6.1: Proposed Technical Conference Schedule ............................................................................................................... 75
Figure 6.2: Proposed Timeline ...................................................................................................................................................... 78
7.0 MEEIA Rules Requirements 79
Figure 7.1: MEEIA Rules Filing Requirements ............................................................................................................................. 79
LIST OF FIGURES

10
Terminology
TERMINOLOGY
ADSM automated demand-side management
AFUDC allowance for funds used during construction
AMI advanced metering infrastructure
ARP Alternative Resource Plan
ASC Accounting Standards Codification
BDR Business Demand Response
BMS building management systems
BYO bring your own
C&I commercial and industrial
CCB customer care and billing
CRM customer relationship management
CSS customer self-service
DER distributed energy resources
DERMS Distributed Energy Resource Management System
DR demand response
DRI Demand Response Incentive
DSIM demand-side investment mechanism
DSM demand-side management
EE energy efficiency
EEPIF Energy Efficiency Project Intake Form
EM&V evaluation, measurement and verification
EMS energy management systems
EO earnings opportunity
EPRI Electric Power Research Institute
EV electric vehicle
FASB Financial Accounting Standards Board
FTE full-time equivalent
HER Home Energy Reports
11
TERMINOLOGY
IEMF Income-Eligible Multi-Family
IRP Integrated Resource Plan
ISO Independent System Operator
LGS Large General Service
LIHTC Low-Income Housing Tax Credit
LPS Large Power Supply
MAP Maximum Achievable Potential
MBDR market-based demand response
MEEAC Missouri Energy Efficiency Advisory Collaborative
MEEIA Missouri Energy Efficiency Investment Act
MGS Medium General Service
MHDC Missouri Housing Development Commission
MPSC (or Commission) Missouri Public Service Commission
NPV net present value
NPVRR net present value of revenue requirement
NTG net-to-gross
PAYS Pay As You Save
PCT participant cost test
RAP Realistic Achievable Potential
RIM ratepayer impact measure test
S&A Stipulation and Agreement
SEM Strategic Energy Management
SGS Small General Service
SMB small medium-sized businesses
SPP Southwest Power Pool
TD throughput disincentive
TRC total resource cost test
TRM Technical Resource Manual
UCT utility cost test
12
1.1 Introduction
Nationwide, utility demand-side management (energy
efficiency and demand response) programs have made
a significant impact over several decades. For Missouri
electric utilities and customers, the passage of the
Missouri Energy Efficiency Investment Act (MEEIA) in
2009 created an opportunity to work together to achieve
sustainable results. Yet even with great progress over
the past decade, great potential remains. Through the
continuation and expansion of MEEIA efforts at Kansas
City Power & Light (KCP&L) — encompassing both Kansas
City Power & Light Company (KCP&L-MO) and KCP&L
Greater Missouri Operations Company (KCP&L-GMO)
jurisdictions — this report outlines plans to further tap
into that potential with our MEEIA Cycle 3 portfolio of
demand-side programs.
1 .0 EXECUTIVE SUMMARY
1.0 Executive Summary
13
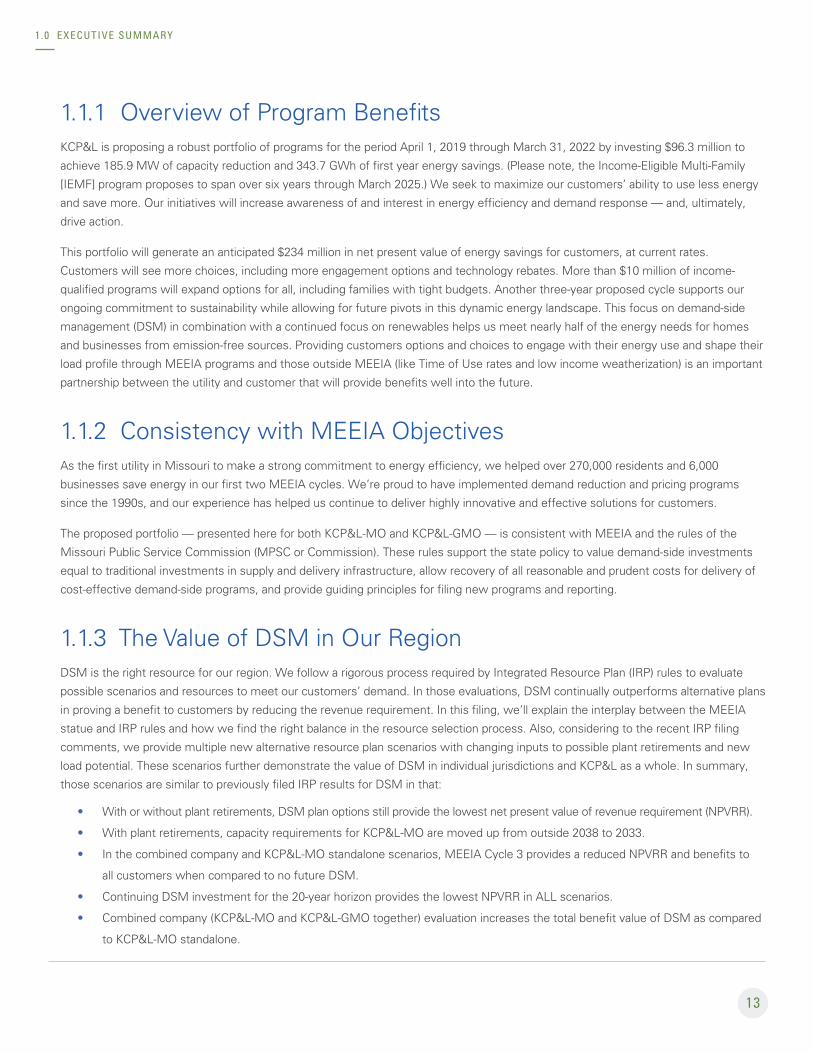
1.1.1 Overview of Program BenefitsKCP&L is proposing a robust portfolio of programs for the period April 1, 2019 through March 31, 2022 by investing $96.3 million to
achieve 185.9 MW of capacity reduction and 343.7 GWh of first year energy savings. (Please note, the Income-Eligible Multi-Family
[IEMF] program proposes to span over six years through March 2025.) We seek to maximize our customers’ ability to use less energy
and save more. Our initiatives will increase awareness of and interest in energy efficiency and demand response — and, ultimately,
drive action.
This portfolio will generate an anticipated $234 million in net present value of energy savings for customers, at current rates.
Customers will see more choices, including more engagement options and technology rebates. More than $10 million of income-
qualified programs will expand options for all, including families with tight budgets. Another three-year proposed cycle supports our
ongoing commitment to sustainability while allowing for future pivots in this dynamic energy landscape. This focus on demand-side
management (DSM) in combination with a continued focus on renewables helps us meet nearly half of the energy needs for homes
and businesses from emission-free sources. Providing customers options and choices to engage with their energy use and shape their
load profile through MEEIA programs and those outside MEEIA (like Time of Use rates and low income weatherization) is an important
partnership between the utility and customer that will provide benefits well into the future.
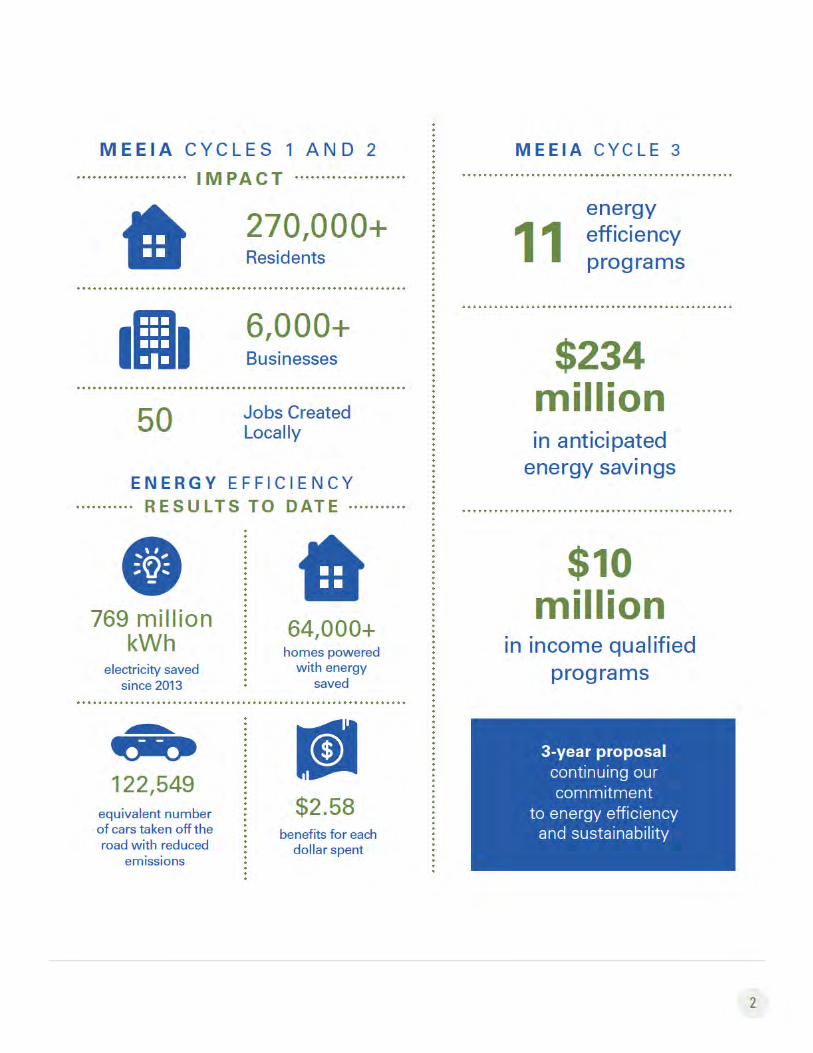
1.1.2 Consistency with MEEIA ObjectivesAs the first utility in Missouri to make a strong commitment to energy efficiency, we helped over 270,000 residents and 6,000
businesses save energy in our first two MEEIA cycles. We’re proud to have implemented demand reduction and pricing programs
since the 1990s, and our experience has helped us continue to deliver highly innovative and effective solutions for customers.
The proposed portfolio — presented here for both KCP&L-MO and KCP&L-GMO — is consistent with MEEIA and the rules of the
Missouri Public Service Commission (MPSC or Commission). These rules support the state policy to value demand-side investments
equal to traditional investments in supply and delivery infrastructure, allow recovery of all reasonable and prudent costs for delivery of
cost-effective demand-side programs, and provide guiding principles for filing new programs and reporting.
1.1.3 The Value of DSM in Our RegionDSM is the right resource for our region. We follow a rigorous process required by Integrated Resource Plan (IRP) rules to evaluate
possible scenarios and resources to meet our customers’ demand. In those evaluations, DSM continually outperforms alternative plans
in proving a benefit to customers by reducing the revenue requirement. In this filing, we’ll explain the interplay between the MEEIA
statue and IRP rules and how we find the right balance in the resource selection process. Also, considering to the recent IRP filing
comments, we provide multiple new alternative resource plan scenarios with changing inputs to possible plant retirements and new
load potential. These scenarios further demonstrate the value of DSM in individual jurisdictions and KCP&L as a whole. In summary,
those scenarios are similar to previously filed IRP results for DSM in that:
• With or without plant retirements, DSM plan options still provide the lowest net present value of revenue requirement (NPVRR).
• With plant retirements, capacity requirements for KCP&L-MO are moved up from outside 2038 to 2033.
• In the combined company and KCP&L-MO standalone scenarios, MEEIA Cycle 3 provides a reduced NPVRR and benefits to
all customers when compared to no future DSM.
• Continuing DSM investment for the 20-year horizon provides the lowest NPVRR in ALL scenarios.
• Combined company (KCP&L-MO and KCP&L-GMO together) evaluation increases the total benefit value of DSM as compared
to KCP&L-MO standalone.
1 .0 EXECUTIVE SUMMARY

14
1.1.4 Benefits for AllThese programs benefit all customers and the community. In addition to demonstrating a reduced revenue requirement in the IRP
analysis, investing in demand-side management:
• Helps keep energy costs low for everyone, regardless of direct participation
• Contributes to a more sustainable energy future, ensuring reliable electricity for generations
• Spurs economic activity and jobs in our service territories
• Provides supplementary benefits for non-electric consumption, such as water and natural gas savings
• Generates positive economic impact for local trade allies and implementers
FIGURE 1.1: DEMAND-SIDE MANAGEMENT RESULTS TO DATE
769 million kWh Electricity saved since 2013
64,074 Homes powered with energy saved
122,549 Cars (equivalent) taken off the road with reduced emissions
$2.58 Benefits for each dollar spent
50 jobs Created locally, plus many other indirect jobs
FIGURE 1.2: MEEIA 3 PROPOSED DEMAND-SIDE MANAGEMENT EFFORTS (SUMMARY)
11 programs Including two new and nine existing
3 years Program length (six years for IEMF)
$32 million Annual investment
$234 million Anticipated savings for customers
$41.7 million Rebates available for residential and business customers
$10 million In low income programs
1 .0 EXECUTIVE SUMMARY
15
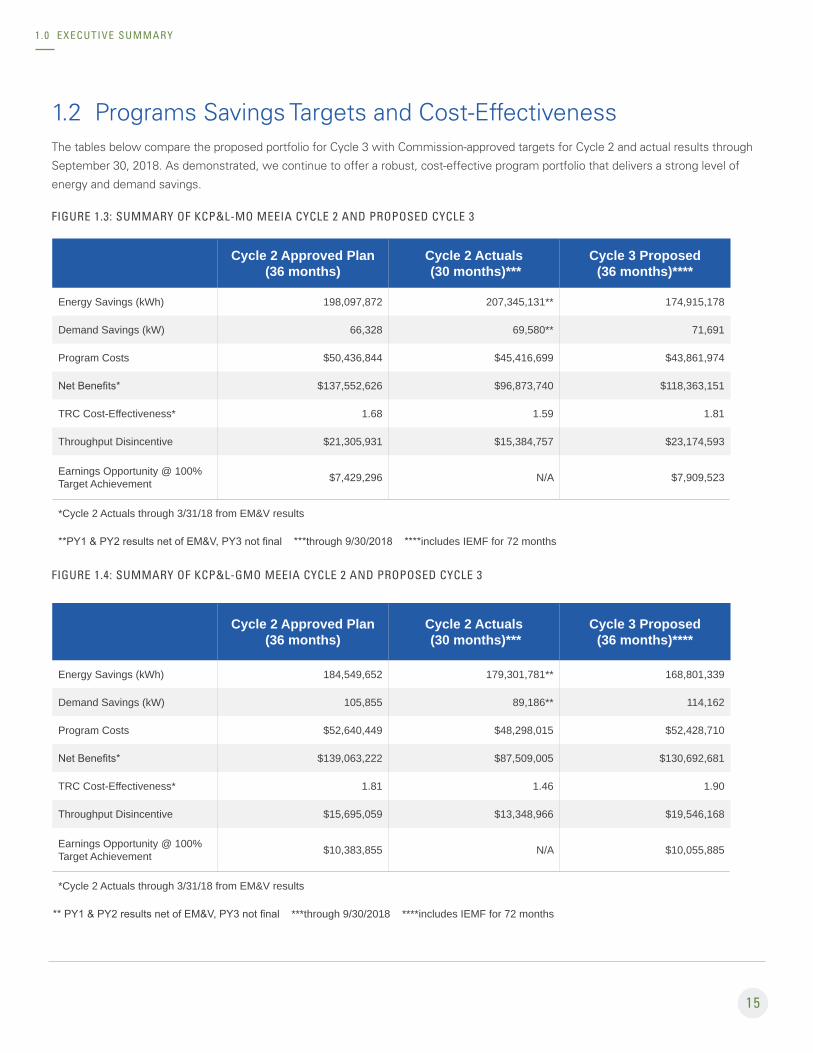
1.2 Programs Savings Targets and Cost-EffectivenessThe tables below compare the proposed portfolio for Cycle 3 with Commission-approved targets for Cycle 2 and actual results through
September 30, 2018. As demonstrated, we continue to offer a robust, cost-effective program portfolio that delivers a strong level of
energy and demand savings.
FIGURE 1.3: SUMMARY OF KCP&L-MO MEEIA CYCLE 2 AND PROPOSED CYCLE 3
Cycle 2 Approved Plan (36 months)
Cycle 2 Actuals (30 months)***
Cycle 3 Proposed (36 months)****
Energy Savings (kWh) 198,097,872 207,345,131** 174,915,178
Demand Savings (kW) 66,328 69,580** 71,691
Program Costs $50,436,844 $45,416,699 $43,861,974
Net Benefits* $137,552,626 $96,873,740 $118,363,151
TRC Cost-Effectiveness* 1.68 1.59 1.81
Throughput Disincentive $21,305,931 $15,384,757 $23,174,593
Earnings Opportunity @ 100% Target Achievement $7,429,296 N/A $7,909,523
*Cycle 2 Actuals through 3/31/18 from EM&V results
**PY1 & PY2 results net of EM&V, PY3 not final ***through 9/30/2018 ****includes IEMF for 72 months
FIGURE 1.4: SUMMARY OF KCP&L-GMO MEEIA CYCLE 2 AND PROPOSED CYCLE 3
Cycle 2 Approved Plan (36 months)
Cycle 2 Actuals (30 months)***
Cycle 3 Proposed (36 months)****
Energy Savings (kWh) 184,549,652 179,301,781** 168,801,339
Demand Savings (kW) 105,855 89,186** 114,162
Program Costs $52,640,449 $48,298,015 $52,428,710
Net Benefits* $139,063,222 $87,509,005 $130,692,681
TRC Cost-Effectiveness* 1.81 1.46 1.90
Throughput Disincentive $15,695,059 $13,348,966 $19,546,168
Earnings Opportunity @ 100% Target Achievement $10,383,855 N/A $10,055,885
*Cycle 2 Actuals through 3/31/18 from EM&V results
** PY1 & PY2 results net of EM&V, PY3 not final ***through 9/30/2018 ****includes IEMF for 72 months
1 .0 EXECUTIVE SUMMARY
18
1 .0 EXECUTIVE SUMMARY
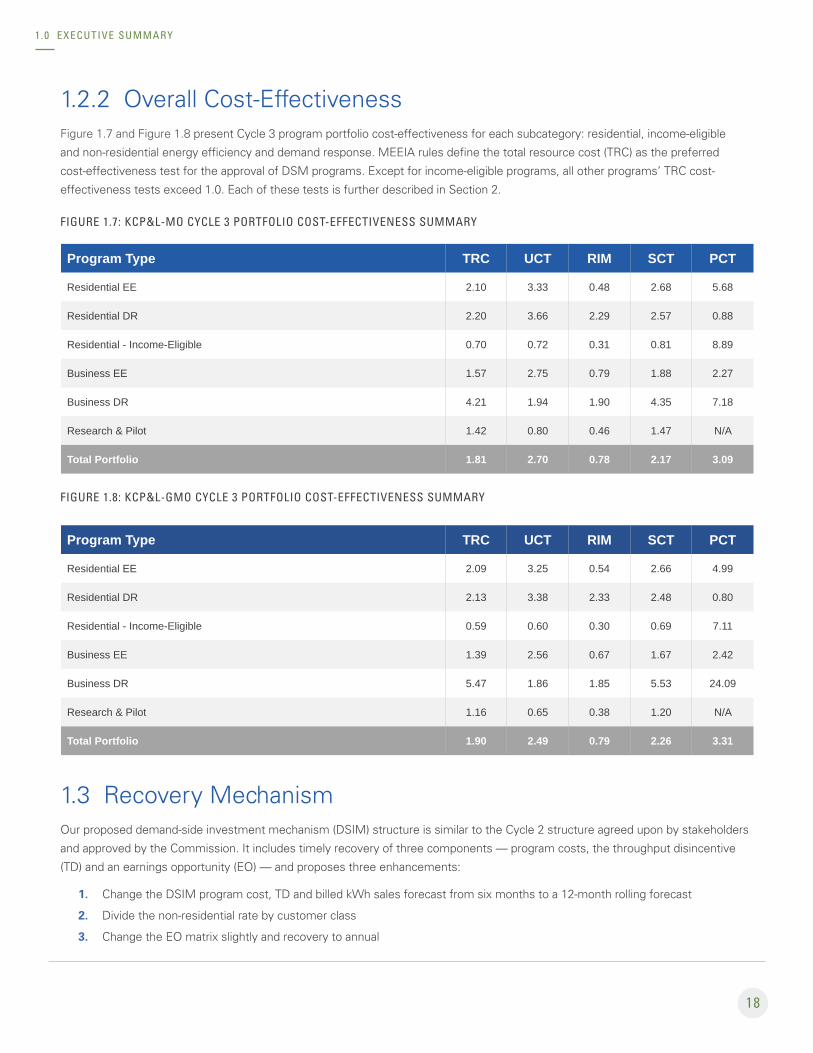
1.2.2 Overall Cost-EffectivenessFigure 1.7 and Figure 1.8 present Cycle 3 program portfolio cost-effectiveness for each subcategory: residential, income-eligible
and non-residential energy efficiency and demand response. MEEIA rules define the total resource cost (TRC) as the preferred
cost-effectiveness test for the approval of DSM programs. Except for income-eligible programs, all other programs’ TRC cost-
effectiveness tests exceed 1.0. Each of these tests is further described in Section 2.
FIGURE 1.7: KCP&L-MO CYCLE 3 PORTFOLIO COST-EFFECTIVENESS SUMMARY
Program Type TRC UCT RIM SCT PCT
Residential EE 2.10 3.33 0.48 2.68 5.68
Residential DR 2.20 3.66 2.29 2.57 0.88
Residential - Income-Eligible 0.70 0.72 0.31 0.81 8.89
Business EE 1.57 2.75 0.79 1.88 2.27
Business DR 4.21 1.94 1.90 4.35 7.18
Research & Pilot 1.42 0.80 0.46 1.47 N/A
Total Portfolio 1.81 2.70 0.78 2.17 3.09
FIGURE 1.8: KCP&L-GMO CYCLE 3 PORTFOLIO COST-EFFECTIVENESS SUMMARY
Program Type TRC UCT RIM SCT PCT
Residential EE 2.09 3.25 0.54 2.66 4.99
Residential DR 2.13 3.38 2.33 2.48 0.80
Residential - Income-Eligible 0.59 0.60 0.30 0.69 7.11
Business EE 1.39 2.56 0.67 1.67 2.42
Business DR 5.47 1.86 1.85 5.53 24.09
Research & Pilot 1.16 0.65 0.38 1.20 N/A
Total Portfolio 1.90 2.49 0.79 2.26 3.31
1.3 Recovery MechanismOur proposed demand-side investment mechanism (DSIM) structure is similar to the Cycle 2 structure agreed upon by stakeholders
and approved by the Commission. It includes timely recovery of three components — program costs, the throughput disincentive
(TD) and an earnings opportunity (EO) — and proposes three enhancements:
1. Change the DSIM program cost, TD and billed kWh sales forecast from six months to a 12-month rolling forecast
2. Divide the non-residential rate by customer class
3. Change the EO matrix slightly and recovery to annual
19
These enhancements are discussed in more depth in Section 4.
Our analysis shows successful implementation of DSM programs could bring gross benefits from energy and capacity over
anticipated program life on a net present value (NPV) basis of approximately $118.4 million for KCP&L-MO and $130.7 million
for KCP&L-GMO. Benefits less program costs are $74 million and $78 million (net benefits) for KCP&L-MO and KCP&L-GMO,
respectively. Based on this analysis, these benefits greatly exceed costs and support our preferred plan¹, demonstrate positive
financial benefits to customers and support the spirit and intention of the MEEIA rules.
The financials comprised of the three recovery components are outlined below.
• Projected program costs for this plan period are:
» $43.9 million for KCP&L-MO
» $52.4 million for KCP&L-GMO
• The TD represents the financial disincentive imposed on the utility for each kWh saved because of successful
implementation of energy efficiency and helps ensure we are kept whole and not financially harmed or dis-incentivized from
promoting energy efficiency. The estimated value of TD for this plan period is:
» $23.2 million for KCP&L-MO
» $19.5 million for KCP&L-GMO
• The DSIM for Cycle 3 also provides us an opportunity to earn a financial incentive based on performance toward established
savings goals. The allowance of this opportunity is necessary to value demand-side investments equally with supply-side
investments, consistent with the MEEIA state policy.
» For KCP&L-MO, we request an EO incentive of up to $11.3 million or $7.9 million if 100 percent of planned
energy and demand targets are met.
» For KCP&L-GMO, we request an EO incentive of up to $14.4 million or $10.1 million if 100 percent of planned
energy and demand targets are met.
» The delta between the two jurisdictions relates to the continued focus and increased value in KCP&L-GMO demand
savings based on the supply capacity position in that jurisdiction as compared to KCP&L-MO.
1.4 New Attributes this CycleWe’re always working to build upon our previous efforts for our customers’ benefit. We’ve implemented various demand reduction
and pricing programs since the 1990s — and the adoption of the Comprehensive Energy Plan in 2005 represented an unprecedented
commitment to demand-side management by a Missouri utility. In 2013, MEEIA Cycle 1 offered more than a dozen energy efficiency
and demand response programs to residential and business customers. In 2016, Cycle 2 of the MEEIA portfolio continued and
expanded upon these programs.
Best practices and knowledge earned over decades is a strong foundation for developing innovative, effective programs. We’ve
made additional improvements based on customer feedback; evaluation, measurement and verification (EM&V) results; potential
study reviews; secondary evaluations and research; baseline changes; program processes and stakeholder input.
In MEEIA Cycle 3, our proposed adjustments:
• Add new programs to offer more ways for customers to participate
• Improve current programs to offer more customer benefits for the same investment
• Provide more energy savings options for customers with the most need
• Make innovative, energy efficiency options available to a wider audience
1 .0 EXECUTIVE SUMMARY
1Per Integrated Resource Plan under EO-2018-0268
20
1 .0 EXECUTIVE SUMMARY
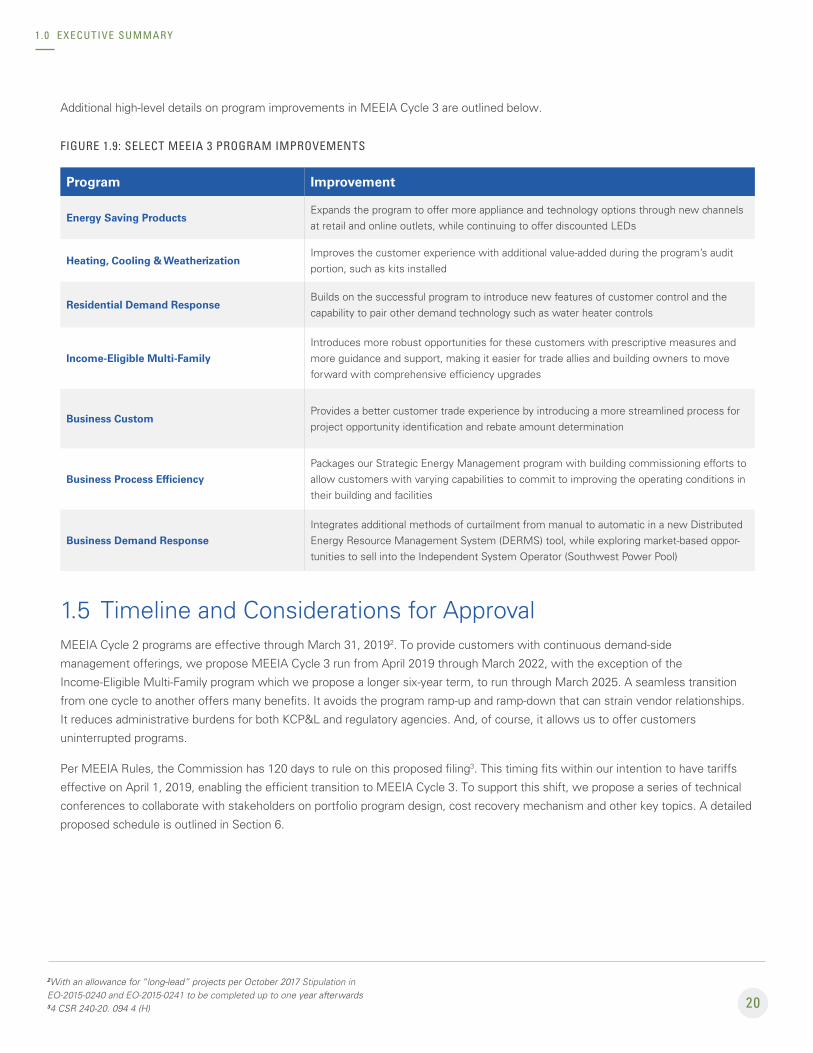
Additional high-level details on program improvements in MEEIA Cycle 3 are outlined below.
FIGURE 1.9: SELECT MEEIA 3 PROGRAM IMPROVEMENTS
Program Improvement
Energy Saving ProductsExpands the program to offer more appliance and technology options through new channels at retail and online outlets, while continuing to offer discounted LEDs
Heating, Cooling & WeatherizationImproves the customer experience with additional value-added during the program’s audit portion, such as kits installed
Residential Demand ResponseBuilds on the successful program to introduce new features of customer control and the capability to pair other demand technology such as water heater controls
Income-Eligible Multi-Family
Introduces more robust opportunities for these customers with prescriptive measures and more guidance and support, making it easier for trade allies and building owners to move forward with comprehensive efficiency upgrades
Business CustomProvides a better customer trade experience by introducing a more streamlined process for project opportunity identification and rebate amount determination
Business Process Efficiency
Packages our Strategic Energy Management program with building commissioning efforts to allow customers with varying capabilities to commit to improving the operating conditions in their building and facilities
Business Demand Response
Integrates additional methods of curtailment from manual to automatic in a new Distributed Energy Resource Management System (DERMS) tool, while exploring market-based oppor-tunities to sell into the Independent System Operator (Southwest Power Pool)
1.5 Timeline and Considerations for ApprovalMEEIA Cycle 2 programs are effective through March 31, 20192. To provide customers with continuous demand-side
management offerings, we propose MEEIA Cycle 3 run from April 2019 through March 2022, with the exception of the
Income-Eligible Multi-Family program which we propose a longer six-year term, to run through March 2025. A seamless transition
from one cycle to another offers many benefits. It avoids the program ramp-up and ramp-down that can strain vendor relationships.
It reduces administrative burdens for both KCP&L and regulatory agencies. And, of course, it allows us to offer customers
uninterrupted programs.
Per MEEIA Rules, the Commission has 120 days to rule on this proposed filing3. This timing fits within our intention to have tariffs
effective on April 1, 2019, enabling the efficient transition to MEEIA Cycle 3. To support this shift, we propose a series of technical
conferences to collaborate with stakeholders on portfolio program design, cost recovery mechanism and other key topics. A detailed
proposed schedule is outlined in Section 6.
2With an allowance for “long-lead” projects per October 2017 Stipulation in EO-2015-0240 and EO-2015-0241 to be completed up to one year afterwards 34 CSR 240-20. 094 4 (H)
21
1.5.1 Future Considerations The changing energy technology landscape and competitive forces — as well as our EM&V results for Cycle 2 — could also have
an impact on our ability to recover costs. Should any of these elements adversely impact the plan or the ability to recover its costs
as approved, we reserve the right to discontinue programs and/or its plan. If that would occur, we will file a notice with the PSC
and would honor all requests for the programs received within 30 days of the notice. We further address these actions within our
proposed program tariffs.
1.5.2 Alignment of Rules/Statute/Stakeholders/UtilityWith guidance from MEEIA, this filing demonstrates our commitment to DSM as a priority, understanding its importance to our
customers, the community, stakeholders and our company. The proposed plan outlines an implementation plan that will:
• Meet MEEIA’s intent by:
» Promoting energy efficiency and demand response programs in such a way that all customers benefit whether
participating or not
» Treat DSM investments like supply-side investments with a proposal for a DSIM that addresses the three
cost/financial components
• Comply with MEEIA rules for applying for and delivering DSM programs by:
» Adhering to filing and submission requirements 4 CSR 240 20.092 -.094. (See Section 7 for all rule references in report)
• Work with stakeholders to:
» Ensure all customers can participate and benefit from the programs
» Ensure customers are not burdened by utility investments in DSM
» Achieve high levels of DSM and strive to move Missouri into a comparable place regarding nationwide energy
efficiency gains
» Develop programs and target sectors based on best practices
» Provide opportunities to invest in energy efficiency to make businesses more efficient
» Allow for comprehensive opportunities to invest in energy efficiency while improving appropriate levels of spend
» Have clear, achievable business plan of energy efficiency investments that are fair to customers and meet
objectives of stakeholders
» Provide demand-side energy solutions that customers value while providing revenue opportunities equal to
supply-side investments
To allow us to accomplish all the above, we request the Commission support the state policy by:
• Providing timely cost recovery
• Ensuring that utility financial incentives are aligned with helping customers use energy more efficiently and in a manner that
sustains utility customers incentives to use energy more efficiently
• Providing timely earnings opportunities associated with cost-effective measurable and verifiable savings
1 .0 EXECUTIVE SUMMARY
22
2.0 Plan Overview
2.1 Program History, Progress and LearningsAs shown in Figure 2.1, KCP&L has invested $294 million in demand-side management (DSM) programs in Missouri since 2005.
KCP&L and its customers have realized considerable benefits from DSM programs. Not only do they provide for peak demand
reduction to offset traditional generation, they also offer us the opportunity to help customers better understand how to manage
their overall energy usage and lower their bills. All customers benefit in the long term through supply-side resource deferral and
participating customers benefit in the near term through their involvement in programs.
2.1.1 The Evolution of DSMDSM has continually evolved since our initial offerings. Not long ago, a programmable thermostat was limited in its communication
and software capabilities. Now, smart thermostats increase our ability to engage with customers and help us understand demand
reduction in real time — which could further our participation in the power market. Digital customer engagement is increasingly
important, and new tools such as marketing automation platforms and customer relationship management (CRM) software
enhances our ability to reach customers with the right products and better messaging. With these and other changes, our ability to
further DSM and provide value to customers has increased.
2.1.2 Our History of DSM ProgramsOur history of implementing DSM programs began with various demand reduction and pricing programs throughout the 1990s —
and most notably increased with the adoption of the Comprehensive Energy Plan (CEP) in 2005. Stemming from the Stipulation and
Agreement in Case No. EO-2005-0329 (0329 S&A), this plan gave us the opportunity to offer DSM programs.
We began partnering with customers, investing approximately $67.3 million into DSM programs in our KCP&L-MO service territory
as a result of the CEP. That portfolio of programs represented our initial significant commitment to promote energy efficiency and
demand response, ensuring all classes of customers had programs in which they could participate. This commitment to DSM by a
Missouri utility was unprecedented at the time. We remained committed to these programs even after the five-year conclusion
of the 0329 S&A.
The 2009 passage of MEEIA put regulations into place in 2011. KCP&L completed its MEEIA Cycle 1 on December 31, 2015 and will
complete its MEEIA Cycle 2 on March 31, 2019. This report addresses Cycle 3, a proposed three-year plan through March 31, 2022.
Figure 2.1 presents a summary of our investment for 2005 through September 30, 2018, which represents evaluated results
through this period.
2 .0 PLAN OVERVIEW

23
FIGURE 2.1: HISTORIC DSM PROGRAM SUMMARY (2005 – SEPTEMBER 30, 2018)
Ex-Ante Annual Energy Savings
(MWh)
Ex-Ante Peak Demand Savings
(MW)
Portfolio Investment ($)
KCP&L-MO
Pre-MEEIA 183,045 109.4 $67,343,349
MEEIA Cycle 1 188,993 54.3 $46,833,318
MEEIA Cycle 2* 207,345 69.6 $45,416,699
Total KCP&L-MO 579,383 233.3 $159,593,366
KCP&L-KS
DSM 81,809 64.3 $36,269,658
Total KCP&L-KS 81,809 64.3 $36,269,658
KCP&L-GMO
Pre-MEEIA 85,499 50.2 $26,276,088
MEEIA Cycle 1 214,411 68.3 $60,240,694
MEEIA Cycle 2* 179,302 89.2 $48,298,015
Total KCP&L-GMO 479,212 207.7 $134,814,798
Total 1,140,404 505.3 $330,677,822
*PY1 & PY2 results net of EM&V, PY3 not final.
2 .0 PLAN OVERVIEW
24
2.2 Impact Benefits and Cost-EffectivenessOur DSM program portfolio is MEEIA compliant because it offers benefits to all customers in a class regardless of whether the
programs are utilized by all customers.
• The Integrated Resource Plan (IRP) selects the level of demand-side resources using minimization of net present value of
revenue requirements (NPVRR) as the primary selection criteria.
• The portfolio and each individual program (excluding income-eligible programs) pass the total resource cost (TRC) test
prescribed by MEEIA and IRP rules.
• The demand-side portfolio is evaluated on an equivalent basis compared to supply-side and renewable resources.
• The diversity of offerings gives all customers the opportunity and option to participate.
• Viewing programs through the lenses of cost-effectiveness metrics allows all customers to understand that our DSM
investment is beneficial to them.
• The portfolio offers additional benefits including:
» Reduced emissions from local power plants
» Special programs targeted to income-eligible customers
» Increased economic activity in the service territory
» Direct and indirect jobs in the service territory
In this section, we address the cost-effectiveness and economic impacts that drive the overall benefit of our proposed portfolio.
2.2.1 Cost-EffectivenessDesigning cost-effective programs is essential to capturing the long-term resource potential. A program is cost-effective if the
total value of all future benefits is greater than the investment costs. Four industry standard cost-effectiveness tests — the TRC,
utility cost test (UCT), participant cost test (PCT) and ratepayer impact measure test (RIM) — gauge the economic merits of DSM
measures, programs or portfolios. Each test uses unique perspectives and definitions to compare the benefits of the DSM activities
to costs in terms of NPV of future cash flows.
MEEIA prescribes that “[t]he commission shall consider the total resource cost test a preferred cost-effectiveness test.”4 However,
it notes the exception to this that “[p]rograms targeted to low-income customers or general education campaigns do not need to
meet a cost-effectiveness test… .”5
The IRP rules also stipulate that the TRC test “…shall be used to evaluate the cost-effectiveness…6 of energy efficiency programs
— and require the calculation of the UCT test solely “…for purposes of comparison.”7 The IRP further evaluates and compares
demand-side programs on an equivalent basis8 to supply-side and renewable resources. It does this by using the minimization of the
NPV of long-run utility costs as the primary selection criteria,9 which serves the public interest and results in efficient and reasonable
rates.10 These cost-effectiveness metrics — in concert with the rigor of the IRP minimization of NPVRR — demonstrate how all
customers save money in the long run by investing in energy efficiency as opposed to other supply-side resource choices necessary
in the future to meet electricity demand.
Portfolio-level cost-effectiveness results are presented in Figure 1.7 and Figure 1.8. More detailed, program-level results are available
in Appendix 8.2.
2 .0 PLAN OVERVIEW
4§393.1075. 4., RSMo 20145Id.64 CSR 240-22.050(5)(B)
74 CSR 240-22.050(5)(C)84 CSR 240-22.050(2)(A)94 CSR 240-22.050(2)(B)
104 CSR 240-22.050(2)
25
2.2.2 Economic ImpactOverall economic activity and jobs in our service territories increase with the availability and promotion of DSM programs. According
to the American Coalition on Energy Efficient Economy, every $1 million invested in energy efficiency supports approximately 20
direct and indirect jobs in the construction space.11 Also, the reinvestment of energy savings year after year creates an incremental
seven jobs per year over spending the money on utility bills.
Trade allies — including several hundred contractors in the residential, commercial and industrial (C&I) sectors — see a positive
impact from our DSM portfolio with additional incentives for customers to use energy more efficiently. Our programs help spur
demand for trade allies to promote existing and new technologies that benefit customers.
Steve Studer with Lee’s Summit Heating and Cooling, a residential HVAC contractor, said, “The rebate program has been a terrific
way to encourage customers to buy more efficient equipment. Many times, the rebate covers the additional cost for moving up
in efficiency, so it has been beneficial to both the customerss and our company.” A commercial firm, Managed Energy Systems,
reports their workforce has increased by two to three full-time equivalent (FTE) employees as a function of participating in our
business rebate programs. Their overall business has grown more than 500 percent since 2015.
According to the “Clean Jobs Midwest” report12, nearly 16,000 people in the Kansas City area work in the clean energy industry.
Clean energy jobs include employees in renewable energy, energy efficiency, advanced transportation, greenhouse gas emission
management and accounting. The energy efficiency sector accounts for more than 70 percent of all clean energy jobs in Kansas City.
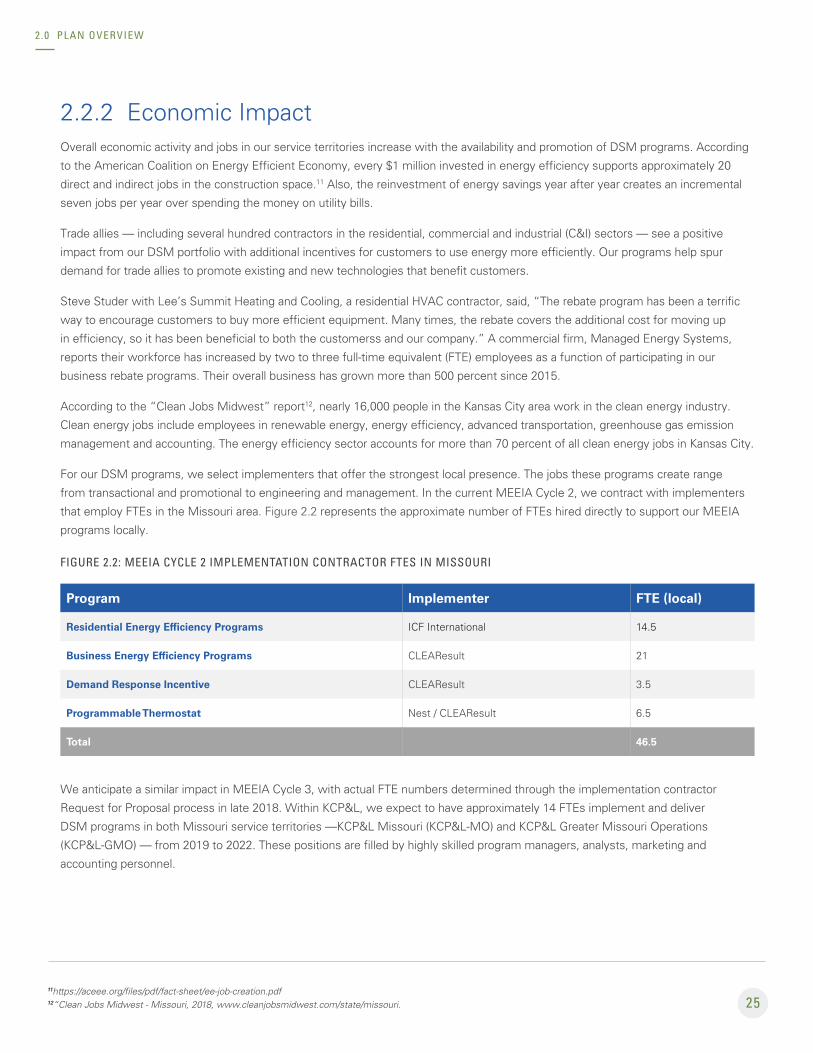
For our DSM programs, we select implementers that offer the strongest local presence. The jobs these programs create range
from transactional and promotional to engineering and management. In the current MEEIA Cycle 2, we contract with implementers
that employ FTEs in the Missouri area. Figure 2.2 represents the approximate number of FTEs hired directly to support our MEEIA
programs locally.
FIGURE 2.2: MEEIA CYCLE 2 IMPLEMENTATION CONTRACTOR FTES IN MISSOURI
Program Implementer FTE (local)
Residential Energy Efficiency Programs ICF International 14.5
Business Energy Efficiency Programs CLEAResult 21
Demand Response Incentive CLEAResult 3.5
Programmable Thermostat Nest / CLEAResult 6.5
Total 46.5
We anticipate a similar impact in MEEIA Cycle 3, with actual FTE numbers determined through the implementation contractor
Request for Proposal process in late 2018. Within KCP&L, we expect to have approximately 14 FTEs implement and deliver
DSM programs in both Missouri service territories —KCP&L Missouri (KCP&L-MO) and KCP&L Greater Missouri Operations
(KCP&L-GMO) — from 2019 to 2022. These positions are filled by highly skilled program managers, analysts, marketing and
accounting personnel.
2 .0 PLAN OVERVIEW
11https://aceee.org/files/pdf/fact-sheet/ee-job-creation.pdf12“Clean Jobs Midwest - Missouri, 2018, www.cleanjobsmidwest.com/state/missouri.
26
In addition, while DSM programs target electricity savings, they also provide supplementary benefits for non-electric consumption
— such as water and natural gas savings — as well as spillover effects on conservation that benefit neighboring jurisdictions. For
example, when low-flow fixtures are installed to reduce the energy consumption of electric water heaters, they also reduce the
corresponding water consumption. Natural gas savings would accrue any time building shell improvements are made in a facility that
uses natural gas for a portion of its space conditioning needs.
2.3 Market Potential and DSM TargetsDemand-side management targets for participation, savings and spend are triangulated on three primary inputs:
1. DSM Market Potential Study Realistic Achievable Potential (RAP)
We conducted a study with Applied Energy Group for the 2018 triennial IRP filing to determine and direct the potential
of demand-side electric energy efficiency and demand response programs. We refined the analysis plan in collaboration with
Missouri stakeholders, including establishing which components of demand-side management to address in the study. The
full report is available in Appendix 8.5.
2. IRP Preferred Resource Plan
In our recent triennial IRP13, the RAP modified level of DSM was selected for inclusion. This preferred plan provides the
most value for customers because it shows a sustainable plan to implement demand-side programs in the short- and
long-term when compared to supply-side resources on an equivalent basis. The IRP analysis demonstrates the net revenue
requirement with MEEIA Cycle 3 level of DSM is reduced over a plan without DSM programs. Section 5.1 and
Appendix 8.11 provide additional detail on the results of these and other analyses.
3. More than five years of experience with MEEIA DSM programs
With several EM&V processes completed, we’ve gleaned many additional insights into what make programs run well and
how various attributes can drive participation. For example, we’ve continuously gained valuable knowledge about the market
opportunity for residential heating and cooling equipment with customer sensitivities to price and contractor engagement
driving participation levels. We understand the expected turnover of the HVAC stock in our territory due to age and efficiency
levels and have incorporated these insights into expectations for participation.
In addition to these three key items, we gain insights from benchmarks with historical spend as well as nationwide utility targets
and spends at the portfolio and program levels. The spend and savings levels for MEEIA Cycle 3 place it in good standing among our
peer group of leading Midwestern DSM programs14.
We propose a realistic and achievable level of DSM programs investment and savings targets for the 2019 to 2022 period. Our
annual average planned DSM savings achieved as a percent of retail sales (0.81% and 0.89% for KCP&L-MO and KCP&L-GMO,
respectively) and spend as a percentage of retail revenue (1.17% and 2.11% for KCP&L-MO and KCP&L-GMO, respectively) in
MEEIA Cycle 3 will remain on the order of the same savings for generally less cost. Our planned savings and budgets represent
a continuation in DSM investment levels and reflect a refinement of program choices in a decreasing avoided cost environment
compared to previous cycles.
13KCP&L-MO Case No. EO-2018-0268 14Sources: ACEEE 2017 Utility Energy Efficiency Scorecard http://aceee.org/2017-utility-energy-efficiency-scorecard ; Savings and Spend from ESource DSM Insights database of public filings
2 .0 PLAN OVERVIEW
27
We’re always working to build on that connection, improving the experience by studying the way customers want to be
communicated, engaged and partnered with to provide positive outcomes. Over the course of our lengthy and strong history in
deploying DSM programs, we’ve significantly evolved customer offers. Key to this is our ability to adjust to customer preferences
and changing technology while driving efficiency and effectiveness. We’ve also gained knowledge about how best to engage
customers in DSM and interact with collaborators who help make this enterprise successful.
Our proposed portfolio is balanced to enable the flexibility to deliver a program that meets the needs of a subset of a customer
class (C&I data centers or residential customers who do most of their shopping online, for instance) with the need to manage
administrative costs with a multitude of subprograms.
We strive to provide easy ways for all customer types to engage with our programs to save energy and money. Historically, we’ve
seen that adoption of DSM programs can be fragmented, by one-off program offerings or technology type. To continually increase
efficiency with spend, we must be more strategic in how we present and promote our offerings. As technology evolves and we
become a more connected society, consumers require product journeys that are simple, align with their perceptions and integrates
with where and how they want to interact with their energy provider.
2 .0 PLAN OVERVIEW
2.4 Customer-Focused Portfolio Approach To design DSM programs that resonate with customer needs and drive action, we begin by gaining insights into customer
preferences and attitudes toward potential offers. We maintain a steady feedback loop with customers and, in preparing for MEEIA
Cycle 3, engaged with various customer groups via panels and other efforts to derive insights on program design. The feedback
received is summarized in Appendix 8.8 Customer Research.
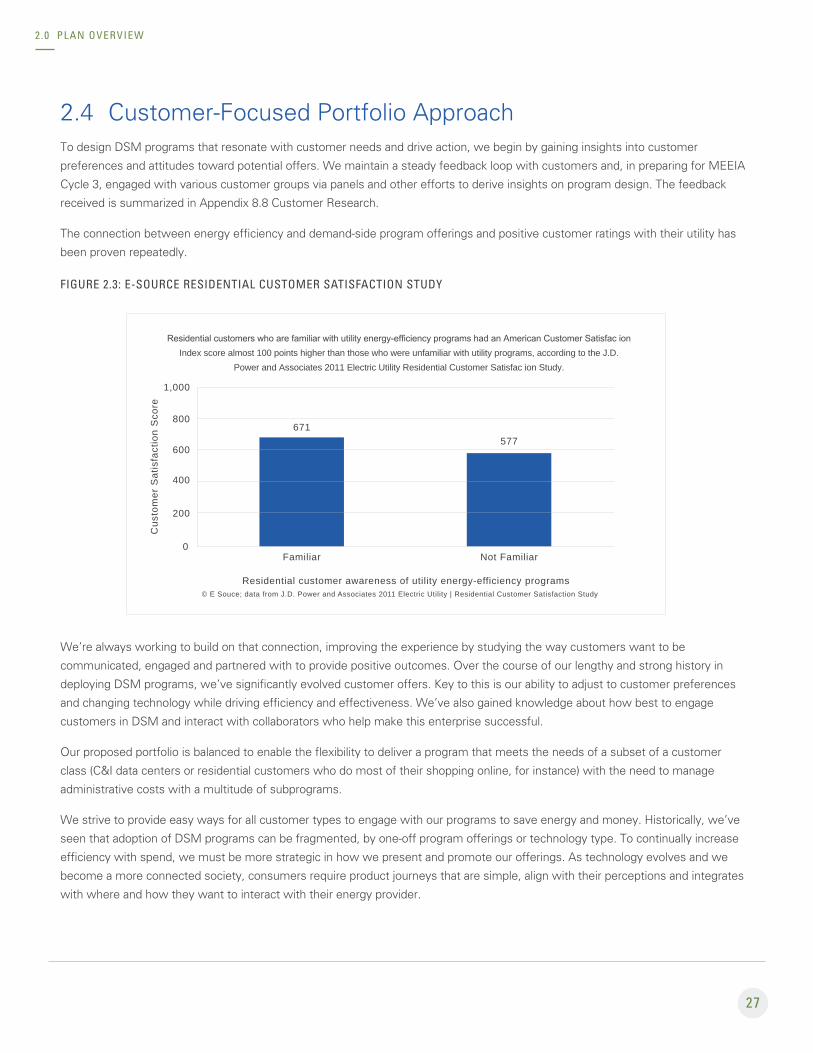
The connection between energy efficiency and demand-side program offerings and positive customer ratings with their utility has
been proven repeatedly.
FIGURE 2.3: E-SOURCE RESIDENTIAL CUSTOMER SATISFACTION STUDY
Residential customers who are familiar with utility energy-efficiency programs had an American Customer Satisfac ion Index score almost 100 points higher than those who were unfamiliar with utility programs, according to the J.D.
Power and Associates 2011 Electric Utility Residential Customer Satisfac ion Study.
671
0
200
400
600
800
1,000
Cus
tom
er S
atis
fact
ion
Sco
re
Familiar
Residential customer awareness of utility energy-efficiency programs © E Souce; data from J.D. Power and Associates 2011 Electric Utility | Residential Customer Satisfaction Study
Not Familiar
577
28
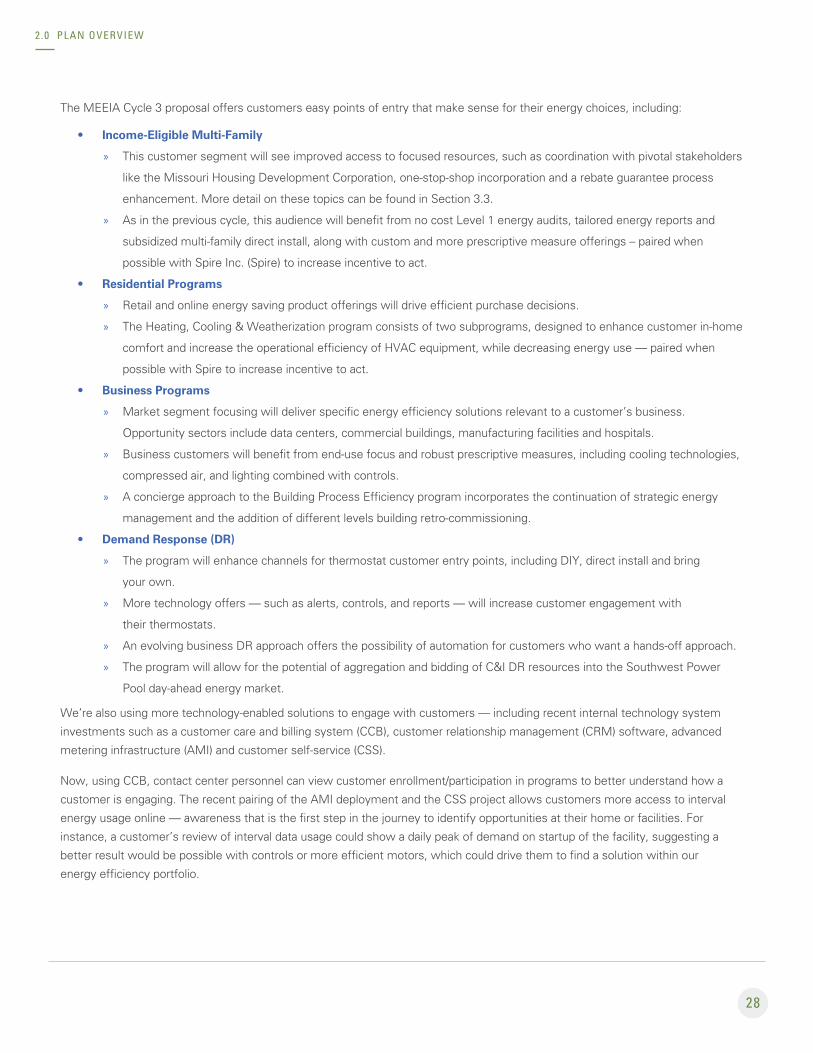
The MEEIA Cycle 3 proposal offers customers easy points of entry that make sense for their energy choices, including:
• Income-Eligible Multi-Family
» This customer segment will see improved access to focused resources, such as coordination with pivotal stakeholders
like the Missouri Housing Development Corporation, one-stop-shop incorporation and a rebate guarantee process
enhancement. More detail on these topics can be found in Section 3.3.
» As in the previous cycle, this audience will benefit from no cost Level 1 energy audits, tailored energy reports and
subsidized multi-family direct install, along with custom and more prescriptive measure offerings – paired when
possible with Spire Inc. (Spire) to increase incentive to act.
• Residential Programs
» Retail and online energy saving product offerings will drive efficient purchase decisions.
» The Heating, Cooling & Weatherization program consists of two subprograms, designed to enhance customer in-home
comfort and increase the operational efficiency of HVAC equipment, while decreasing energy use — paired when
possible with Spire to increase incentive to act.
• Business Programs
» Market segment focusing will deliver specific energy efficiency solutions relevant to a customer’s business.
Opportunity sectors include data centers, commercial buildings, manufacturing facilities and hospitals.
» Business customers will benefit from end-use focus and robust prescriptive measures, including cooling technologies,
compressed air, and lighting combined with controls.
» A concierge approach to the Building Process Efficiency program incorporates the continuation of strategic energy
management and the addition of different levels building retro-commissioning.
• Demand Response (DR)
» The program will enhance channels for thermostat customer entry points, including DIY, direct install and bring
your own.
» More technology offers — such as alerts, controls, and reports — will increase customer engagement with
their thermostats.
» An evolving business DR approach offers the possibility of automation for customers who want a hands-off approach.
» The program will allow for the potential of aggregation and bidding of C&I DR resources into the Southwest Power
Pool day-ahead energy market.
We’re also using more technology-enabled solutions to engage with customers — including recent internal technology system
investments such as a customer care and billing system (CCB), customer relationship management (CRM) software, advanced
metering infrastructure (AMI) and customer self-service (CSS).
Now, using CCB, contact center personnel can view customer enrollment/participation in programs to better understand how a
customer is engaging. The recent pairing of the AMI deployment and the CSS project allows customers more access to interval
energy usage online — awareness that is the first step in the journey to identify opportunities at their home or facilities. For
instance, a customer’s review of interval data usage could show a daily peak of demand on startup of the facility, suggesting a
better result would be possible with controls or more efficient motors, which could drive them to find a solution within our
energy efficiency portfolio.
2 .0 PLAN OVERVIEW
29
3.0 Program Portfolio Details
Providing innovative, accessible and effective solutions to help our customers use less energy and save more is a key objective for
KCP&L. The primary objectives that shaped our design for the proposed demand-side management (DSM) portfolio in MEEIA Cycle
3 underscore that commitment:
• Create programs that benefit all by satisfying the total resource cost (TRC) test cost-effectiveness criterion by maintaining
a benefit-to-cost ratio greater than 1. 0 at the portfolio level, except for income-qualified initiatives that MEEIA rules permit to
bypass this criterion.
• Maintain linkage to the IRP by providing low-cost capacity reductions that require less capital outlay than traditional supply
side resources to provide grid relief at peak system times. Selected DSM programs and measures focus primarily on peak
demand impacts rather than annual energy impacts, while considering each territory’s unique needs.
• Increase customer satisfaction by delivering DSM programs that provide a positive experience and highlight our brand.
• Offer DSM program offerings appropriate for the unique service territories — considering climate, culture and market
conditions — while also providing consistency for all customers.
• Address internal and external stakeholder interests.
Stakeholder input is vital to our strategy. To help build this portfolio, we’ve consulted with a wide range of customer groups, partners
and other associates, including:
• Business customers
• Online residential panel
• Trade ally businesses
• Multi-family interest groups
• Program design consultants
• Program implementers
• Environmental focused stakeholders
• Income-eligible focused stakeholders
• DSM Advisory Group
• Company leadership
This section outlines energy efficiency and demand response programs for both residential and business customers —and offers
a brief look at potential new, innovative programs. We also discuss our marketing approach to provide insight into how we plan to
build awareness, educate and engage customers with DSM offerings.
3 .0 PROGRAM PORTFOLIO DETAILS
30
3.1 Energy EfficiencyEnergy efficiency is a cornerstone of our clean energy strategy. We help customers manage their energy consumption through a
balanced and diversified portfolio of cost-effective energy efficiency programs — promoted through multiple distribution channels
to customers from a broad range of socio-economic and geographic backgrounds within our service territory. Our DSM proposal
offers a strong, diverse portfolio of new and existing energy efficiency programs that provides savings opportunities for all
customer classes.
PLAN HIGHLIGHTS
• We’ve improved the top performing programs from our previous cycles to simplify processes, identify deeper
energy savings and improve the overall customer experience. The plan is grounded in preceding years’ most successful
approaches — and we’ve built upon them with improvements that reflect market shifts and integrate emerging
technologies. The plan includes new products and pilot programs, and the expansion of customer-preferred products.
• We’re focused on the most cost-effective energy efficiency programs to maximize savings and benefits, while
keeping energy prices affordable. This balanced plan allows us to meet challenging goals and manage bill impacts at a
time when costs are rising and energy saving impacts are shrinking in certain technologies. We recognize our responsibility
to be vigilant stewards of ratepayer funds and ensure programs are both cost competitive and highly effective.
• We’re supporting a wide range of energy efficiency choices to meet different customer needs and interests. The
plan outlines a broad, comprehensive portfolio of energy efficiency offerings to provide residential, business and six qualified
customers with opportunities to save energy.
From rebate programs, energy saving items directly installed, energy audits and new construction assistance, our award-winning
programs provide solutions that customers value. Our robust EM&V process ensures accountability, provides all key stakeholders
with verified energy savings and allows us to track ongoing effectiveness. The DSM plan illustrates our ability to manage customer
bill impacts responsibly, demonstrate environmental leadership and an ongoing commitment to providing a wide variety of choices to
meet the diverse needs of our Missouri customers.
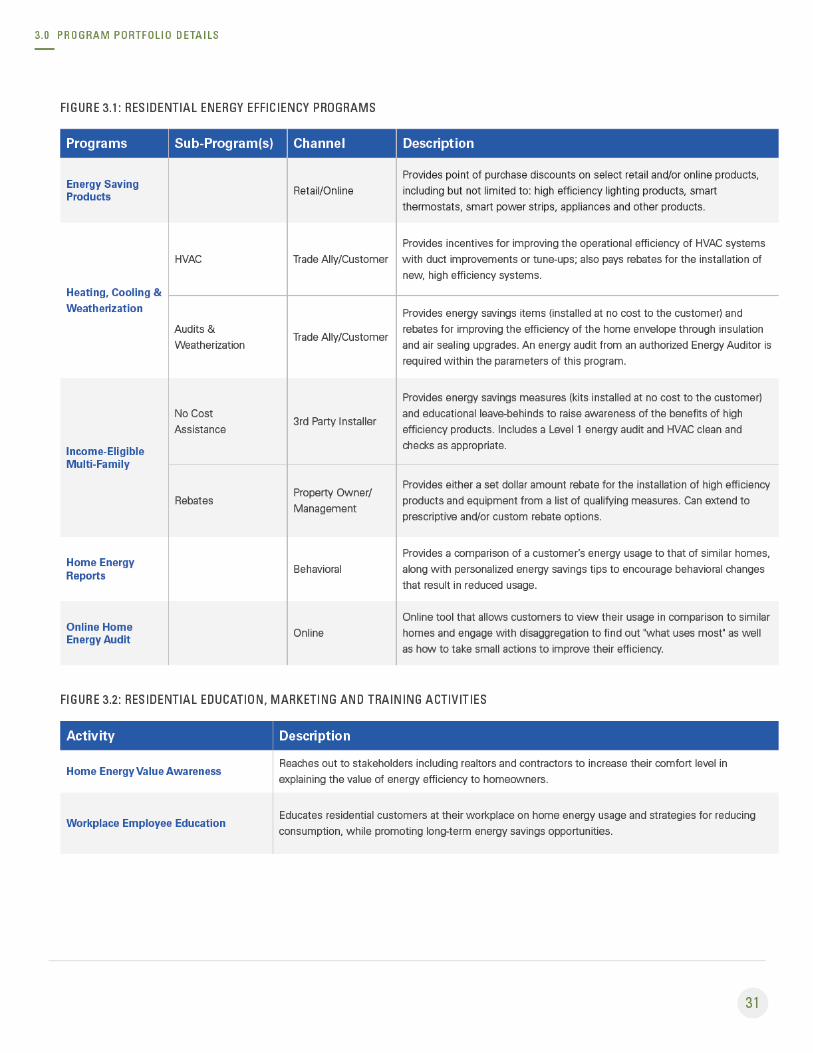
3.1.1 Residential ProgramsA. DESCRIPTION
Our strong portfolio of residential programs incentivizes customers to incorporate energy efficiency into their homes and increases
access to information about how to lower energy costs. Behavioral options enhance the energy efficiency offerings, while three
unique educational and training programs promote awareness using multiple channels. The portfolio provides customized solutions
that resonate with individuals and customer segments to drive holistic energy savings. The table below defines core residential
programs (Programs), their applicable program offers (Sub-Program(s)), the method at which the program/sub-program(s) are
delivered (Channel) and a high-level overview (Description).
3 .0 PROGRAM PORTFOLIO DETAILS
32
B. MARKET ANALYSIS
Our residential programs build on the success of proven, traditional energy efficiency concepts and programs — which we
continue to grow strategically based on lessons learned in delivering highly impactful and effective solutions into the marketplace.
At its core, our suite of offerings provides education, awareness, and financial incentives to offset the cost of energy efficient
products and energy saving solutions. We’ll continue to leverage relationships and strategies to deliver cost-effective options,
such as programs that:
• Advance energy efficient product customer adoption.
• Promote high impact energy saving technologies, such as heating and cooling equipment, through a network of authorized
and trained professionals (trade allies).
• Deliver and/or install products as an entry to educating customers on energy efficiency.
• Co-deliver, partner and collaborate to reach customers in the most cost-effective way, including but not limited to
coordination of energy saving products/equipment with gas utilities and other stakeholders with similar interests.
C. APPLICATION PROCESS
We will reduce barriers to entry by developing additional online tools and streamlined processes. Application intake processes vary
by program; please see individual program summaries following this overview for more information.
D. MARKET OBJECTIVES AND STRATEGIES
The primary drivers for realization of the residential portfolio’s planned achievements are a combination of our strategic program
managers, implementer(s), trade allies, customer call center, outreach representatives and marketing teams. We plan to provide
trade ally outreach, newsletters, customer events, direct mail, email communications and awareness advertising tactics to reach
customers.
We employ an integrated approach to marketing communications, where varied tactics work in concert and reinforce key messages
over time. Our energy efficiency communication strategy seeks to overcome several challenges:
• Lack of top-of-mind prominence in customers’ minds
• Focus on purchase price (or “first costs”) rather than lifetime costs and benefits
• Lack of awareness about energy efficient equipment options when purchasing needs arise
We follow the Awareness, Interest, Desire and Action process for encouraging participation in DSM programs.
1. Create awareness of electricity and/or natural gas impacts on bottom-line profits and quantify potential cost savings and
available rebates.
2. Promote interest in DSM programs by providing more information about the offerings, including payback examples and case
studies, through a variety of customer touchpoints.
3. Instill the desire for participation by quantifying the impacts of a bundle of potential energy savings technologies and
processes, tailored to each targeted market segment.
4. Move the customer toward action by offering a variety of program options with varying degrees of financial commitment
and/or long-term involvement.
We also market programs differently to the various customer segments and sub-populations, identified by key shared characteristics.
After analyzing and identifying the motivation of each target audience, we tailor key messages to meet the customers’ specific
needs. More information for the Income-Eligible Multi-Family program is below in section 3.3.
3 .0 PROGRAM PORTFOLIO DETAILS
33
E. PROGRAM-SPECIFIC POLICIES
We’ve adopted several general policies across all programs in the residential portfolio, though individual programs may have
additional, unique policies as noted in each of the following program summaries. While general policies provide guidelines,
they may be altered under specific circumstances and/or for specific periods of time when warranted for promotional events
or other purposes.
Program-level policies include:
• Proof of installation: All programs require documentation of installation, such as proof-of-purchase (invoices) and/or a
site verification.
• Payback requirements: For custom conservation programs, payback requirements vary by program. Project payback must be
less than the project lifetime, which varies by program and technology.
F. REBATES AND INCENTIVES
Residential rebates are offered to promote high-efficiency energy solutions. Rebates and incentives vary by program and can be
offered to customers, vendors, trade allies, distributors or manufacturers. If program performance lags and budget allows, bonus
rebates may be offered to boost participation.
3.1.2 Business ProgramsA. DESCRIPTION
Our business efficiency portfolio provides customers with increased awareness and understanding of how they use energy. We’re
moving forward with expanded and streamlined offerings that strengthen the focus on energy education and deliver solutions that
align with our customers’ business needs while driving long-term energy savings. We plan to continue our Business Standard and
Business Custom programs. We’ll also offer a Business Process Efficiency Program, including Retro-Commissioning, Strategic
Energy Management, Express Tune-Up and a Monitoring Based Commissioning option.
We’ll further address marketplace barriers with:
• A concierge-customer driven approach
• Benchmarking and energy usage to identify savings opportunities
• Targeted vertical segments
• Initiatives to connect businesses with design professionals, engineers and trade allies
• Simplified application intake portals and market facing calculators
• Energy efficiency project finance options for customers
• An improved overall customer experience and program process journey
• Grass roots energy market development
New marketing strategies will align customer segments with bundled measures and technologies for specific industries. This longer-
view, strategic customer-centric approach delivers a more streamlined approach for customers to connect our energy solutions
with their business solutions. The table below defines core business programs (Programs), their applicable program offers (Sub-
Program(s)), the method at which the program/sub-program(s) are delivered (Channel) and a high-level overview (Description).
3 .0 PROGRAM PORTFOLIO DETAILS
35
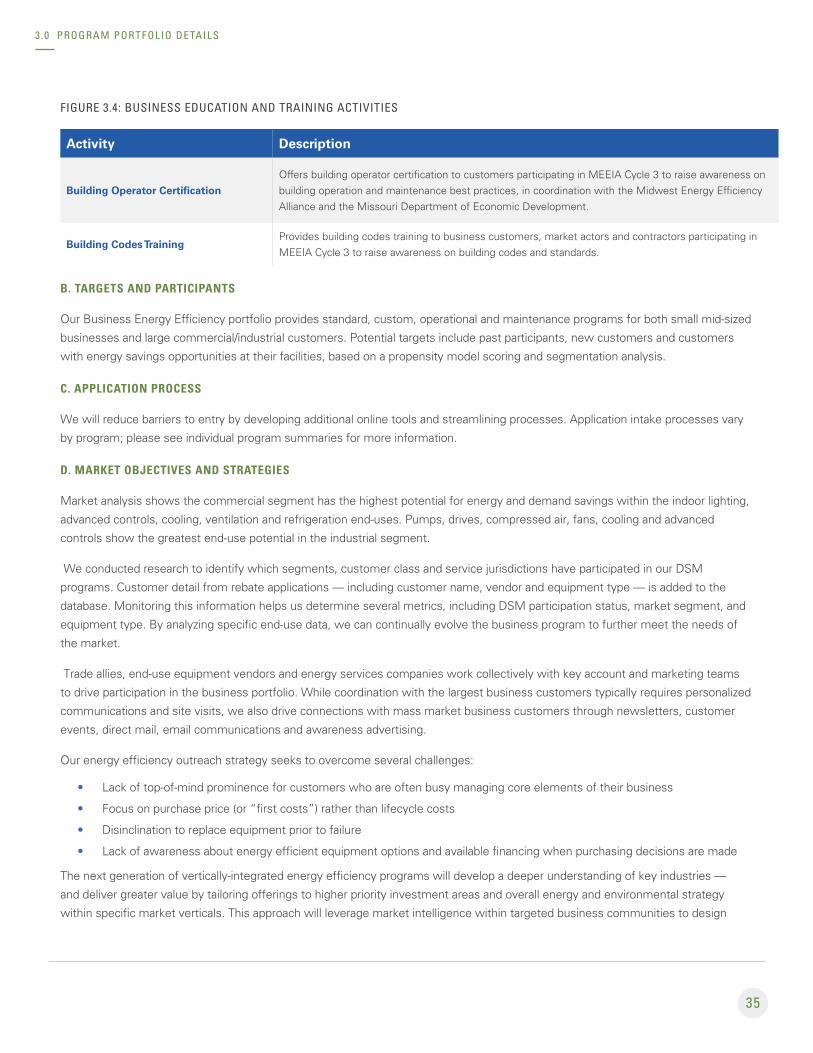
FIGURE 3.4: BUSINESS EDUCATION AND TRAINING ACTIVITIES
Activity Description
Building Operator Certification
Offers building operator certification to customers participating in MEEIA Cycle 3 to raise awareness on building operation and maintenance best practices, in coordination with the Midwest Energy Efficiency Alliance and the Missouri Department of Economic Development.
Building Codes TrainingProvides building codes training to business customers, market actors and contractors participating in MEEIA Cycle 3 to raise awareness on building codes and standards.
B. TARGETS AND PARTICIPANTS
Our Business Energy Efficiency portfolio provides standard, custom, operational and maintenance programs for both small mid-sized
businesses and large commercial/industrial customers. Potential targets include past participants, new customers and customers
with energy savings opportunities at their facilities, based on a propensity model scoring and segmentation analysis.
C. APPLICATION PROCESS
We will reduce barriers to entry by developing additional online tools and streamlining processes. Application intake processes vary
by program; please see individual program summaries for more information.
D. MARKET OBJECTIVES AND STRATEGIES
Market analysis shows the commercial segment has the highest potential for energy and demand savings within the indoor lighting,
advanced controls, cooling, ventilation and refrigeration end-uses. Pumps, drives, compressed air, fans, cooling and advanced
controls show the greatest end-use potential in the industrial segment.
We conducted research to identify which segments, customer class and service jurisdictions have participated in our DSM
programs. Customer detail from rebate applications — including customer name, vendor and equipment type — is added to the
database. Monitoring this information helps us determine several metrics, including DSM participation status, market segment, and
equipment type. By analyzing specific end-use data, we can continually evolve the business program to further meet the needs of
the market.
Trade allies, end-use equipment vendors and energy services companies work collectively with key account and marketing teams
to drive participation in the business portfolio. While coordination with the largest business customers typically requires personalized
communications and site visits, we also drive connections with mass market business customers through newsletters, customer
events, direct mail, email communications and awareness advertising.
Our energy efficiency outreach strategy seeks to overcome several challenges:
• Lack of top-of-mind prominence for customers who are often busy managing core elements of their business
• Focus on purchase price (or “first costs”) rather than lifecycle costs
• Disinclination to replace equipment prior to failure
• Lack of awareness about energy efficient equipment options and available financing when purchasing decisions are made
The next generation of vertically-integrated energy efficiency programs will develop a deeper understanding of key industries —
and deliver greater value by tailoring offerings to higher priority investment areas and overall energy and environmental strategy
within specific market verticals. This approach will leverage market intelligence within targeted business communities to design
3 .0 PROGRAM PORTFOLIO DETAILS
36
enhancements to the Standard and Custom Business Programs. New technologies, incentive structures and approaches to
customer education will help spur greater investment in energy efficiency.
To deliver program services, we’ll identify and train organizations within our service territory that offer industry specific expertise
and trusted relationships with targeted customers. Modified administrative processes and systems will accommodate greater
customization and diversity in program offerings. By taking a longer-term, strategic approach and creating true partnerships with
customers and their service providers, we’ll realize more sustainable improvements in the market for energy efficient products and
increased economic development value resulting from its programs.
E. PROGRAM-SPECIFIC POLICIES
We’ve adopted several general policies across all programs in the business portfolio, though individual programs may have
additional, unique policies as noted in each of the following program summaries. While general policies provide guidelines,
they may be altered under specific circumstances and/or for specific periods of time when warranted for promotional events
or other purposes.
Program-level policies include:
• Proof of installation: All programs require documentation of installation, such as proof-of-purchase (invoices) or a
site verification.
• Installation date: Rebates are provided for qualifying equipment installed within a 12-month period.
• Payback requirements: Rebates may be paid on projects with payback of at least 1. 5 years. Project payback must be less
than the project lifetime, which varies by program and technology.
• Studies: Funding cannot exceed 75 percent of the study cost and studies must be completed within three months.
• Study-driven savings: Customers will not receive a rebate if they implement measures with less than a one-year payback,
but we’ll still claim the study-driven savings. We believe our financial and technical help in identifying and/or analyzing energy
efficiency measures provides enough influence on the customer’s decision to implement those measures.
F. REBATES AND INCENTIVES
Business rebates are offered for custom, standard and small business programs to promote high efficiency technology
implementation. Rebates are offered for operational and maintenance savings derived through participation in the Business
Process Efficiency program. Rebates and incentives vary by program and can be offered to customers, vendors, distributors and
manufacturers. If implementation lags and budget allows, bonus rebates may be offered to customers and/or trade partners
to boost participation.
Indirect offerings, such as business energy assessments, trainings and education support, are offered in conjunction with
program offerings.
3 .0 PROGRAM PORTFOLIO DETAILS
37
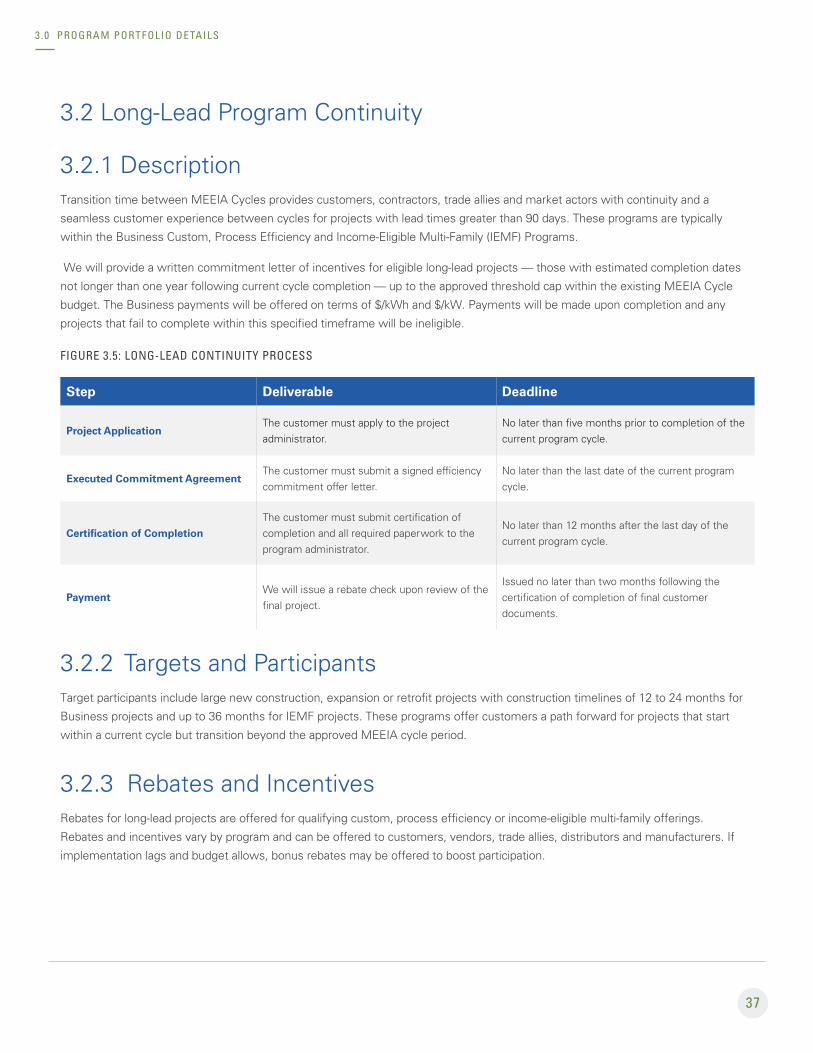
3.2 Long-Lead Program Continuity
3.2.1 Description Transition time between MEEIA Cycles provides customers, contractors, trade allies and market actors with continuity and a
seamless customer experience between cycles for projects with lead times greater than 90 days. These programs are typically
within the Business Custom, Process Efficiency and Income-Eligible Multi-Family (IEMF) Programs.
We will provide a written commitment letter of incentives for eligible long-lead projects — those with estimated completion dates
not longer than one year following current cycle completion — up to the approved threshold cap within the existing MEEIA Cycle
budget. The Business payments will be offered on terms of $/kWh and $/kW. Payments will be made upon completion and any
projects that fail to complete within this specified timeframe will be ineligible.
FIGURE 3.5: LONG-LEAD CONTINUITY PROCESS
Step Deliverable Deadline
Project ApplicationThe customer must apply to the project administrator.
No later than five months prior to completion of the current program cycle.
Executed Commitment AgreementThe customer must submit a signed efficiency commitment offer letter.
No later than the last date of the current program cycle.
Certification of Completion
The customer must submit certification of completion and all required paperwork to the program administrator.
No later than 12 months after the last day of the current program cycle.
PaymentWe will issue a rebate check upon review of the final project.
Issued no later than two months following the certification of completion of final customer documents.
3.2.2 Targets and ParticipantsTarget participants include large new construction, expansion or retrofit projects with construction timelines of 12 to 24 months for
Business projects and up to 36 months for IEMF projects. These programs offer customers a path forward for projects that start
within a current cycle but transition beyond the approved MEEIA cycle period.
3.2.3 Rebates and IncentivesRebates for long-lead projects are offered for qualifying custom, process efficiency or income-eligible multi-family offerings.
Rebates and incentives vary by program and can be offered to customers, vendors, trade allies, distributors and manufacturers. If
implementation lags and budget allows, bonus rebates may be offered to boost participation.
3 .0 PROGRAM PORTFOLIO DETAILS
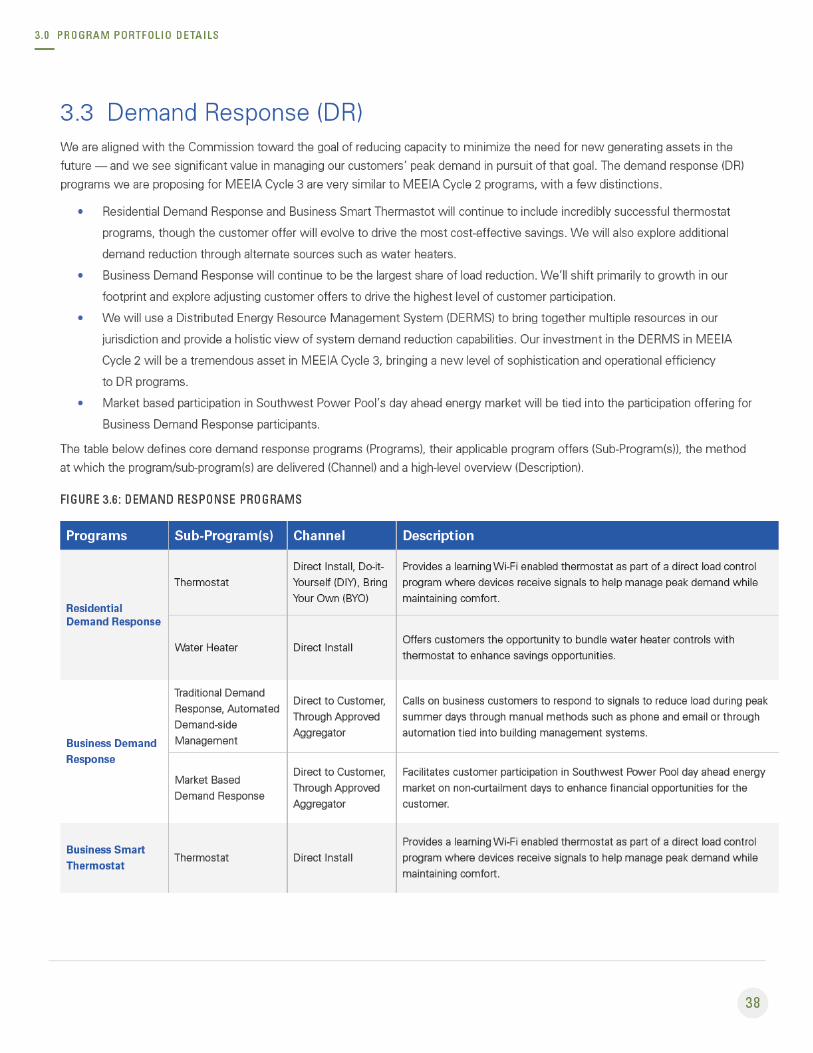
39
3.3.1 Residential Demand ResponseThe participation and evaluated savings results from the programmable thermostat program in MEEIA Cycle 2 has proven the
residential customer is hungry for smart thermostats and reducing summer demand. In MEEIA Cycle 3, we’ll build on that success
— demonstrated by multiple industry awards15 — to refine customer offers and participation opportunities. One example is an
increased focus on the Bring Your Own (BYO) thermostat channel to harvest the potential for smart thermostats already in the
market, bringing additional demand reduction to the grid with an individual financial benefit for the customer.
Residential thermostat demand reduction algorithms are also evolving. The traditional model from five to 10 years ago of cycling
the compressor every 15 minutes during an event has given way to more sophisticated, analytics and physics-based DR approach
models16. These models use pre-cooling and ride-through sensors to help manage customer comfort with efficient demand
reduction on a per home basis. For example, we’ve utilized the Nest Rush Hour Rewards algorithm for demand reduction in MEEIA
Cycle 2 with remarkable success, as evidenced by customer feedback and overall program satisfaction.
As the connected home space develops, we’ll continue to evaluate other control technologies that help manage peak demand. The
addition of water heater direct load control to our Technical Resource Manual is an example of this expansion. The water heater
has long been known as a source of variable loads that could easily shift with minimal customer impact. As more companies have
developed solutions to provide control and access to water heater usage, we’ve integrated these advances into our resources.
These connected devices can most likely be used in concert with thermostat activities to help reduce demand during peak times.
3.3.2 Business Demand ResponseThe Demand Response Incentive (DRI) program saw significant growth in MEEIA Cycle 2 — specifically in the KCP&L Greater
Missouri Operations (KCP&L-GMO) service territory — from around 20 MW to more than 55 MW of contracted capacity.
It’s important to note that while our 2018 program is fairly robust — engaging 140-plus unique customers encompassing more
than 340 service points across the KCP&L-MO and KCP&L-GMO territories — all contracts expire at Cycle 2 end and will require
re-evaluation and re-engagement for participation in MEEIA Cycle 3. This will require significant effort from relevant team members
to work through the large volume of participants, while concurrently recruiting and enrolling new customers for participation by the
June 1, 2019 curtailment season start date.
Evaluation, measurement and verification (EM&V) challenges identified in MEEIA Cycle 2 include customer understanding of the
connection between customer baselines and actual usage, along with lack of full cooperation in curtailment events. In MEEIA Cycle
3, we’ll work to overcome these issues by incorporating additional features to help improve baselines and promote performance
during events.
• Updated baseline methodologies will use a more sophisticated model of forecasting the potential load on the day of a
curtailment event in absence of the program. This forecasted baseline load can then be compared against a participant’s
actual load during an event. Improved visibility and access to customer data supports the updated methodologies.
• We’ll evaluate how communicating participation and event payments to the customer helps encourage better performance
during events. We’ll also evaluate the other side of the equation: how the penalty for non-compliance impacts performance.
To reach optimum efficiency for our incentive structure, we’ll consult with national subject matter experts on best practices
and solicit customer insights and motivations regarding prioritization of program attributes.
3 .0 PROGRAM PORTFOLIO DETAILS
16Smart Thermostats: The Killer DER, Tendril Networks, Melanson, 2017
152016 Peak Load Management Alliance (PLMA) – Thought Leadership Award; SEPA/DistribuTECH – Demand Response Project of the Year 2018
40
During Cycle 2, we incorporated new tariff language to allow for automated demand-side management (ADSM), welcoming an
additional customer segment into the program. This offering will continue in Cycle 3. This customer profile prefers a hands-off
approach to performing during events, without the need for manual intervention by facility staff. They have integrated ties to
automated building systems, building management systems or energy management systems at their sites and — because they are
often in the retail space — are sensitive to customer impact. The key attribute for this audience is peak reduction algorithms that
allow for a light touch to DR.
We’ll explore automation for larger commercial and industrial (C&I) customers with the capability to use controls technology. As
discussed below in Section 3. 2. 4, we’ve also developed a provision for optional market-based demand response participation for
qualified Business Demand Response customers, allowing participation in the Southwest Power Pool (SPP) energy market on days
when a curtailment event isn’t scheduled.
3.3.3 Distributed Energy Resource Management System (DERMS) Impact in MEEIA Cycle 3As a way to continue centralizing management of existing, new and future DR programs, we are implementing a DERMS. This
system will manage the portfolio of existing and future DR and we anticipate continuing to explore and develop the deeper, broader
company value of a DERMS.
A key technology platform with significant potential impact on our growing DR program portfolio, the DERMS will help meet the
increasing importance of DR in the DSM component of our Integrated Resource Plan (IRP). It allows us to more effectively manage
our legacy thermostat programs, grow current DR programs and implement new MEEIA Cycle 3 programs that appeal to a wider
variety of residential and business customers.
To further enhance the growth and effectiveness of our DSM portfolio of DR programs and through future development, the DERMS
is expected to:
• Support an increasing variety of DR programs, including expanded measures (water heaters, smart appliances, etc.),
program participation models (direct install, DIY and BYO) and self-enrollment. It also enhances management of program
un-enrollment and re-enrollment, as well as participation payments resulting from customer changes (move in/outs etc.).
• Record operating and response characteristics of DR resources and provide forecasting capabilities to predict near-term and
long-term performance capabilities.
• Include a customer portal that provides relevant program, event and settlement information, as well as offering self-service
functionality for customers to manage participation in DR events.
• Provide comprehensive capabilities to group and aggregate DR resources into dispatchable resources for use in response
prediction, event planning, event dispatch and reporting. Event dispatch capabilities support grid capacity relief on a system
wide or localized basis.
• Offer capabilities to enhance commercial customer participation in C&I DR events, including calculation of daily baseline
usage, near real-time visualization of event participation, and event notifications through direct ADSM integration with
building management systems.
• Support future dynamic pricing rate programs, price incentivized and bid based (offer/accept) load curtailment programs,
and energy service bidding programs. The system supports wholesale market integration and can be used to manage a retail
customer’s DR resource participation in the wholesale market (like the “Indiana model” market-based program).
3 .0 PROGRAM PORTFOLIO DETAILS
41
3.3.4 DR Aggregation and Southwest Power Pool Market ParticipationIn the most recent rate cases and exploration dockets, the Commission asked us to explore ideas to engage our demand response
and other distributed resources with the real time Independent System Operator (ISO) markets. The Southwest Power Pool (SPP) —
the regional ISO in which KCP&L-MO and KCP&L-GMO are members — currently allows for bidding energy, but not capacity, into
the market. The results of the ongoing discussion on DER, aggregation of load and the Indiana model has been considered deeply
on how to best move forward. The outcome of the recent rate case was to file a tariff to allow for implementation of a market-
based demand response type product, which would allow for bidding into the day ahead energy market of SPP. Participating in
MEEIA Business Demand Response is a pre-requisite for participating in the market-based tariff. More information on the product’s
integration with our existing Business Demand Response programs is available in our program description and associated tariff.
3.4 Income-Eligible Multi-Family Program
3.4.1 Overview Our Income-Eligible Multi-Family program promotes awareness and education to multi-family property managers and owners
about their buildings’ energy usage, including how to use no-cost direct install measures to achieve immediate energy savings. The
program also motivates managers and owners to realize deeper energy savings by investing in prescriptive and/or custom measures
for common areas, in-unit and whole-building systems.
Owners and managers can establish program qualification in the following ways:
• Participation in an affordable housing program - Documented participation in a federal, state or local affordable housing
program, including Low-Income Housing Tax Credit (LIHTC), HUD, USDA, State HFA and local tax abatement for
low-income properties.
• Location in a low-income census tract - Location in a census tract we identify as low-income, using HUD’s annually published
“Qualified Census Tracts” as a starting point.
• Rent roll documentation - Where at least 50 percent of units have rents affordable to households at or below 80 percent of
area median income, as published annually by HUD.
• Tenant income information* - Documented tenant income information demonstrating at least 50 percent of units are rented
to households meeting one of these criteria: at or below 200 percent of the Federal poverty level or at or below 80 percent
of area median income.
• Participation in the Weatherization Assistance Program - Documented information demonstrating the property is on the
waiting list for, currently participating in, or has in the last five years participated in the Weatherization Assistance Program.
*As the most administratively burdensome of these eligibility pathways, this option will only be used if the other approaches are not
applicable.
3 .0 PROGRAM PORTFOLIO DETAILS
42
DESCRIPTION
In addition to helping this customer segment achieve deep utility savings, the program provides whole building energy analysis,
recommendations for improvements with technical and process assistance, and incentives to motivate action regarding upgrades.
Offerings — applicable to both in-unit and common areas — are integrated into an overarching energy efficiency strategy that is
presented to property management and ownership.
Our support can extend to direct install and prescriptive and/or custom rebate options.
• Direct install may include but is not limited to: faucet aerators, low-flow showerheads, HVAC clean and checks, advanced
power strips, hot water pipe insulation and LEDs.
• Other measures may include but are not limited to: in-unit refrigerators, LED exit signs, smart thermostats, tracking/
adjustment of hot water heater set temps, shower start valves and refrigerator coil cleaning.
• Rebates for prescriptive and/or custom measures may include but are not limited to: lighting measures, controls, insulation
and air sealing, HVAC systems, HVAC tune-ups and appliances (including common area laundry equipment).
3.4.2 Implementation Strategy To execute the program, we identify and establish relationships with multi-family building owners of income eligible facilities. We
use direct outreach and marketing to inform high usage/targeted eligible property owners and managers of the many benefits of
energy efficiency at their properties. Collaboration and partnership with Spire and the Missouri Housing Development Commission
(MHDC) increases opportunities, and we continually evaluate other potential synergies.
We’ll partner with MHDC to create a process flow document, ensuring efficient communication during pivotal milestones for
properties undergoing refinancing. For MHDC, LIHTC and other large-scale retrofit projects, we’ll create a Rebate Commitment Note
to help property management lock-in rebate funding. As noted in the 3.2 Long-Lead Program Continuity section, this program will
allow for transition time between MEEIA Cycles to provide continuity and a seamless customer experience for projects with lead
times greater than 90 days.
In complement to these offers, we’ve realized great synergies through partnership and co-delivery with Spire. Our successful
collaboration will continue and expand as we seek more opportunities to reduce program costs and provide mutual customers with
comprehensive energy efficiency solutions.
3.4.3 Program StrategyWe’ll offer no-cost Level 1 energy assessments to eligible properties and provide a report to property management with the
following information:
• Recommended upgrade measures
• Estimated energy savings
• Estimated cost savings
• Estimated cost for equipment and installations
• Simple payback analysis
3 .0 PROGRAM PORTFOLIO DETAILS
43
There will be exceptions for this Level 1 assessment offer for those that have completed a recent, similar energy report assessment.
• Deeper audits, ASHRAE Level 2, to those interested
• Scope of work, including securing qualified program partners to perform energy efficiency upgrades as applicable
• Overview of applicable incentives and/or rebates
• Assistance with retrofit scheduling and completion as applicable
• Verification of quality installation
• Historical (12 months) energy usage and technical assistance to begin benchmarking buildings using Energy Star Portfolio
Manager (or similar) for eligible participants
• Exploration of best practices financing options
A seamless ‘one-stop-shop’ approach will provide owners, managers and operators of multi-family low-income properties integrated
support before, throughout and after the retrofit process. We’ll provide a single point of contact to ease communication and offer to
assist with applications for financing and technical support. We’ll also provide incentives to help overcome the upfront expense of
upgrading and incorporate an Energy Efficiency Project Intake Form (EEPIF) to lower barriers around the program entry. Our Connect
Center will serve as ‘shop’ location for support and outreach, increasing awareness of energy efficiency habits and measures while
encouraging market transformation.
The driving force behind this initiative is to promote, establish and integrate energy efficiency in all aspects of a project before design
development completes. Below is a potential draft outline of the process:
1. Complete project intake form (EEPIF), capturing basic information such contact, location, building code jurisdiction and
brief project description.
2. Review and schedule meeting time and location.
3. Identify key team members, including property design decision-makers, affordability consultants, architects, developers,
owner or owner reps, utility representatives and MHDC as deemed appropriate.
4. Develop an agenda based on a template we’ll provide that addresses major energy components, including site
characteristics, envelope, lighting, plug loads, HVAC, interactive effects, IAQ and other elements. The agenda will also
provide an overview of rebates and incentives.
5. Conduct meeting.
6. Provide deliverables.
3.4.4 Rebates & IncentivesRebates and incentives are provided in the form of direct install kits and rebates for prescriptive and custom projects. We’ll increase
incentive/rebate levels and encourage property owners and managers to achieve maximum savings by offering additional assistance
in overcoming financial barriers to more robust energy efficiency upgrades. The program’s foodbank portion is being removed,
resulting in more significant incentives to encourage action from owners. This adjustment — and the additional process increases —
will allow for deeper and more complex project retrofits.
This customer segment also benefits from Energy Analyzer, a robust online tool that enables customers to track energy
consumption and understand how their energy is being used; while offering tips for DIY and behavioral improvements. We also
provide resources in situations where bill payment assistance is needed.
3 .0 PROGRAM PORTFOLIO DETAILS
44
3.5 Innovative ProgramsTechnology and innovation drives evolution of DSM programs. Mindful of this inevitability, we’ve included a budget allowance for
the research and pilot programs that help utilities understand what customers seek in energy efficiency and demand response
programs. The entirety of MEEIA Cycle 2 was focused on research activities, primarily due to a few barriers with the categorization
and process for “pilot” programs. To improve the process, we’re proposing a methodology that eases the ability to communicate
the intent, process and results of these pilot initiatives. This proposal is detailed further in Section 5.
3.5.1 Proposed and Potential Residential Research and Pilot OfferingsAs the industry evolves — and technology and standards along with it — utilities nationwide must focus on innovation, both
in offering new programs and improving current programs to drive better results. We are continually working to improve our
performance on energy efficiency initiatives, maximizing our ability to help customers use less energy and save more through
MEEIA. These efforts provide considerable benefits, allowing customers to manage energy costs, providing customer choice,
improving the environment and supporting our communities.
Our current research and pilot program offerings fall into one of three status levels:
1. Proposed to pilot or study upon approval in 2019
a. Electric vehicle charging research
b. Circuit rider building codes program
2. Evaluated ideas that may be ready to deploy but are not yet proposed
a. On-bill financing and Pay As You Save (PAYS)
b. HVAC diagnostic services
c. Energy equity research
d. Tree-based energy savings
3. Burgeoning ideas that require more evaluation
a. Listed directly below
We’ll continue to evaluate opportunities for innovative program design that both meets the needs of the residential customer and
provides sufficient energy and demand savings. We’re incubating and evaluation several ideas — some of which are detailed below
— that are not yet ready for presentation of full plans and tariffs. The potential offerings span a wide and evolving range of options,
though we may also propose additional options during the MEEIA Cycle 3.
1. Research
a. Energy equity research to explore the relationship between program participation, geographic location, income
levels, ethnicity, education and others
2. Income Qualified/Eligible
a. Energy efficiency for trailers and mobile homes
b. Energy efficiency for single-family, low- to -mid-income customers
c. Energy efficiency for low-income assisting businesses such as shelters
3 .0 PROGRAM PORTFOLIO DETAILS
45
3. Market Rate Residential
a. Single-Family
i. Tree energy efficiency is a high-priority collaboration with the City of Kansas City and Bridging the Gap
ii. Remote assisted DIY home assessments and direct installs
iii. Connected homes and smart home solutions, including HVAC fault detection devices, energy efficient lighting
controls, demand response lighting controls and battery energy storage
iv. Midstream offerings including HVAC, heat pumps, hot water heaters, windows and insulation
v. Community geothermal heat pumps
b. Multi-Family
i. Kits and HVAC tune-ups
c. Elementary Schools
i. Kits and curriculum for children, offered through elementary schools
ELECTRIC VEHICLE CHARGING
Our investment in electric vehicle (EV) charging infrastructure — we’ve installed more than 1,000 stations in our service area since
2015 — has helped transform our region into an EV hotspot. Starting in the fourth quarter of 2016 and continuing throughout 2017,
Kansas City topped the nation in electric vehicle growth according to IHS Automotive and the Electric Power Research Institute
(EPRI).
This dramatic growth — and national awards from Chartwell, E-Source and others — have solidified our position as a thought leader
in EV charging infrastructure. Building on this success, we’re exploring ways to integrate EV efforts in our MEEIA programs going
forward.
• To incentivize efficient charging solutions at home, we’re researching options for an EV home charger program. Charging
with a 240-volt Level 2 (L2) home charger is faster and more efficient than a 110-volt Level 1 (L1) outlet. We’re monitoring
ongoing research from EPRI, Idaho National Labs and Vermont Energy Investment Corporation for guidance on best
practices for DSM programs.
• To better understand demand response capabilities with home and public chargers, possibilities exist to explore the
potential for maximizing technology platforms, such as DERMS.
CIRCUIT RIDER – BUILDING CODES EDUCATION PROGRAM
An estimated 75 percent of buildings in the United States will be new or renovated by 2035. Outreach and education about energy
codes ensures structures are built to the proper standards for efficient energy usage. The State of Missouri is part of a recent study
outlining the impact of building efficiency through codes education and compliance. The Building Codes Education program supports
the development and implementation of residential and commercial building codes by providing local municipalities, builders and
stakeholders with technical assistance for code adoption and compliance.
Elements of the codes program include:
• Training seminars on the latest codes adopted by county.
• Education and technical assistance on utility rebates and incentives to help offset high efficiency upgrades above code.
• Savings impact assessments for projects designed above energy codes.
3 .0 PROGRAM PORTFOLIO DETAILS
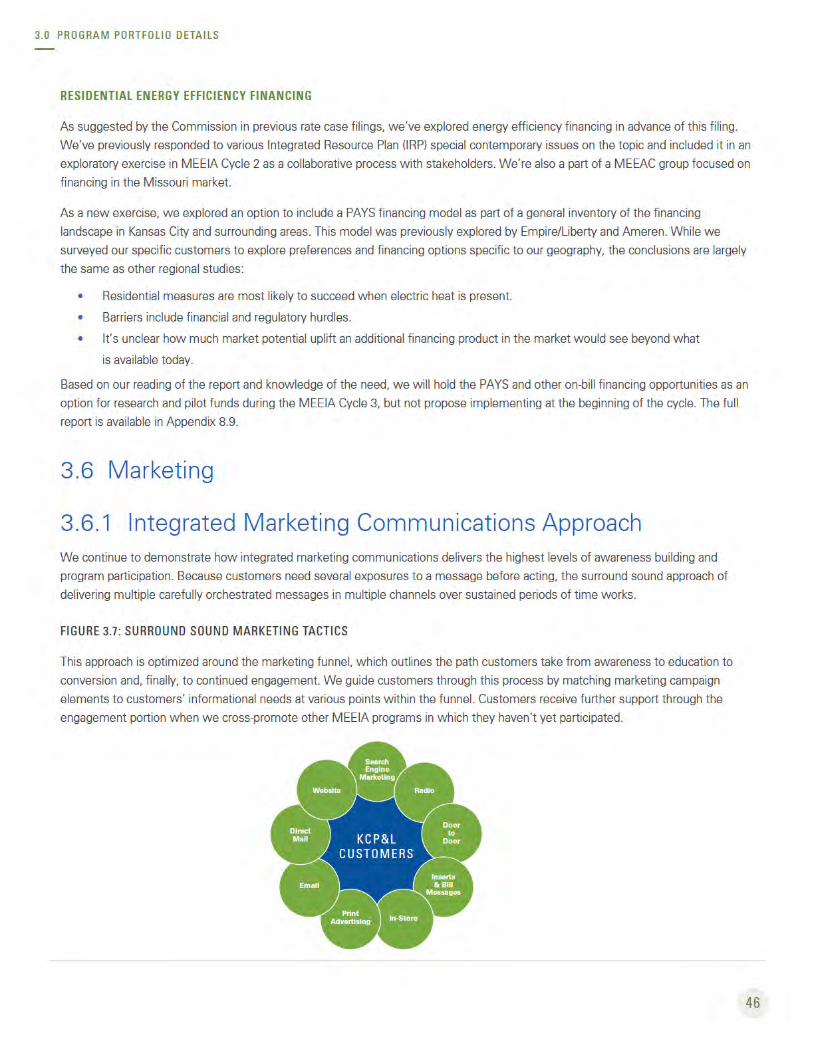
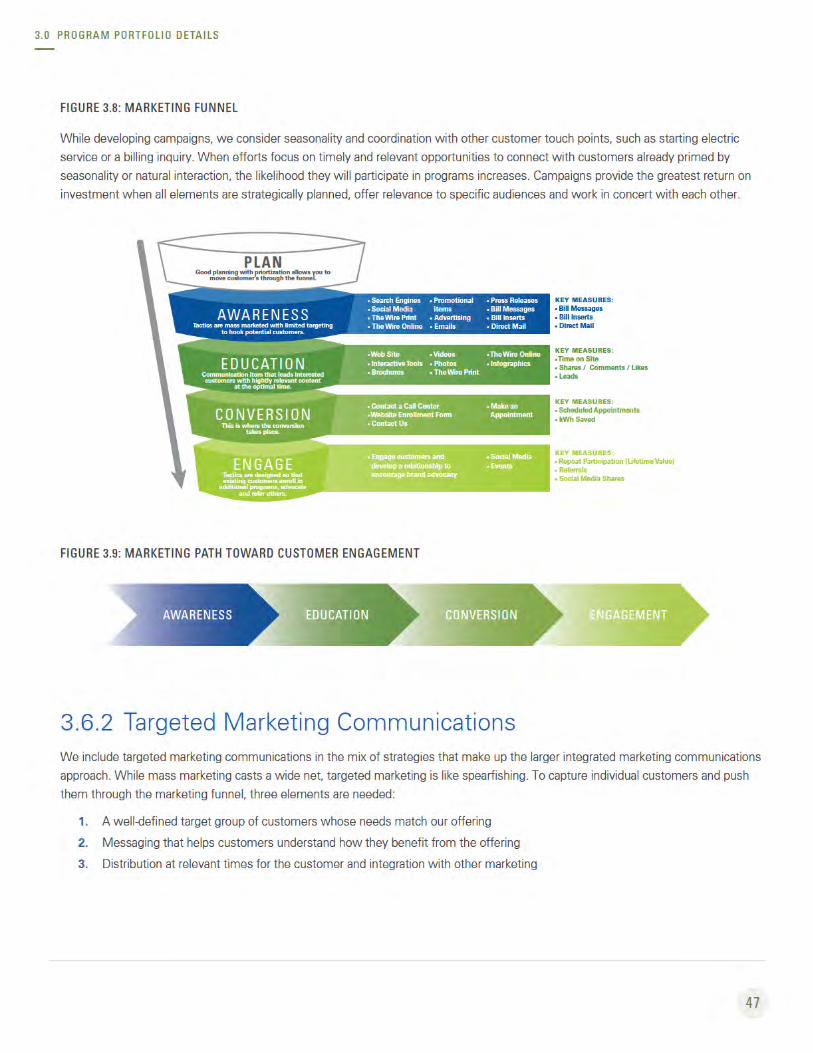
48
DETERMINING TARGET GROUP OF CUSTOMERS
While all eligible customers may participate in programs (and are reached via mass marketing tactics), some customers are
more likely to participate. Our capability to leverage internal data sources and new platforms — such as customer relationship
management (CRM) and marketing automation system — to develop customer profiles is steadily increasing. For example, modeling
on current participants, attribute appends, Nielsen and Acxiom segmentation, usage patterns and digital body language can be
stitched together, revealing a set of customers who will likely participate if contacted through targeted marketing communications.
MESSAGE DEVELOPMENT
Once a target group of customers is defined, it’s vital to develop messages they will pay attention to. Over the past six years, we’ve
learned how residential and business customers understand, receive and use our programs. In preparation for MEEIA Cycle 3, we’ll
use primary and secondary research to dig deeper and more fully analyze how proposed and continuing programs are perceived and
used, and further explore customers’ decision-making process and the benefits they find most motivating. These insights support
the continued creation of tailored messaging that educates customers and causes them to enroll in programs.
Overarching key messages for our residential programs may include:
• Energy efficiency reduces monthly energy bills due to lower operating costs.
• We help lower energy bills by offering rebates and incentives for installing highly efficient equipment.
• Energy efficiency helps reduce environmental impacts.
Overarching key messages for our business programs may include:
• Energy savings contribute directly to increased profits.
• Partnering with the property manager (when applicable) to employ energy savings can lower energy costs, improve
ambiance and increase property value.
• Because energy costs are a sizable portion of an operating budget, investing in energy efficiency is a smart decision
with major impact.
• Rebates help reduce upfront costs, shorten payback periods, and provide ongoing savings.
• Energy-efficient equipment and systems increase reliability while decreasing maintenance costs.
• Saving energy helps reduce environment impacts and meet sustainability goals.
PROGRAM-SPECIFIC AND SOLUTIONS-BASED MARKETING TACTICS
Marketing tactics center on program-specific promotions, solutions-based marketing and a wide range of communications vehicles.
Program-specific marketing ties back to the overriding message, offering concrete ways to do more. These examples show
customers and trade partners the direct impact of their efforts, providing examples of energy savings, paybacks, lifetime savings and
other personal rewards. Solutions-based marketing focuses on program combinations that offer solutions for a specific customer
segment (such as schools) or address common customer concerns (such as weather, costs and environmental) rather than
marketing a single program.
DISTRIBUTION AND INTEGRATED MARKETING
Direct, targeted marketing is most successful when customers are already exposed to messaging through mass marketing
awareness tactics as part of a larger integrated strategy. The targeted message must also reach them at a time when they are
already primed by either seasonality or a need MEEIA programs can fulfill.
3 .0 PROGRAM PORTFOLIO DETAILS
49
For instance, we run email campaigns that are automatically triggered when customers take certain actions. When customers
start service and opt to receive email communications, they receive a series of welcome emails with helpful tips and information,
including well-crafted messages about MEEIA programs. These emails generate higher-than-average open and click-through rates,
indicating this content is helpful to them.
Triggered campaigns can also encourage customers to complete the program participation process. For example, an air conditioner
checkup is the first of several steps in the process for the Air Conditioning Upgrade Rebate. When customers complete that step,
they should receive an email reminding them of the benefits of replacing their unit and recapping the next steps in the process.
PROGRAM NAMES
We rely on a surround sound “branded house” marketing strategy to build awareness of energy efficiency opportunities while
leveraging the brand. Program names are comprised of straightforward key words that describe literally what customers receive or
experience when they participate. This approach provides cost efficiency by eliminating the need to educate customers about what a
disparate variety of “named” programs mean.
When the program names are preceded by the brand name, our brand’s credibility transfers to individual programs, increasing
the customer’s trust in the offering. This naming construct also ties diverse programming into one cohesive portfolio. During our
upcoming rebranding as a result of our recent merger, we’ll have the opportunity to spotlight our MEEIA programs to a
wide audience.
3.6.3 Marketing CollaboratorsOutreach, marketing and communications are critical mechanisms for ensuring customers and trade allies are aware of — and
participate in — the portfolio of programs. A portion of the education and marketing budget from each individual DSM program is
directed toward coordinating the overall strategy in a concerted way that reinforces the overall DSM brand.
3.6.4 Filing and Stakeholder CommunicationWe will provide our customers with information about MEEIA Cycle 3 over the next several months, including a customer
notification in the January billing statement.
3 .0 PROGRAM PORTFOLIO DETAILS
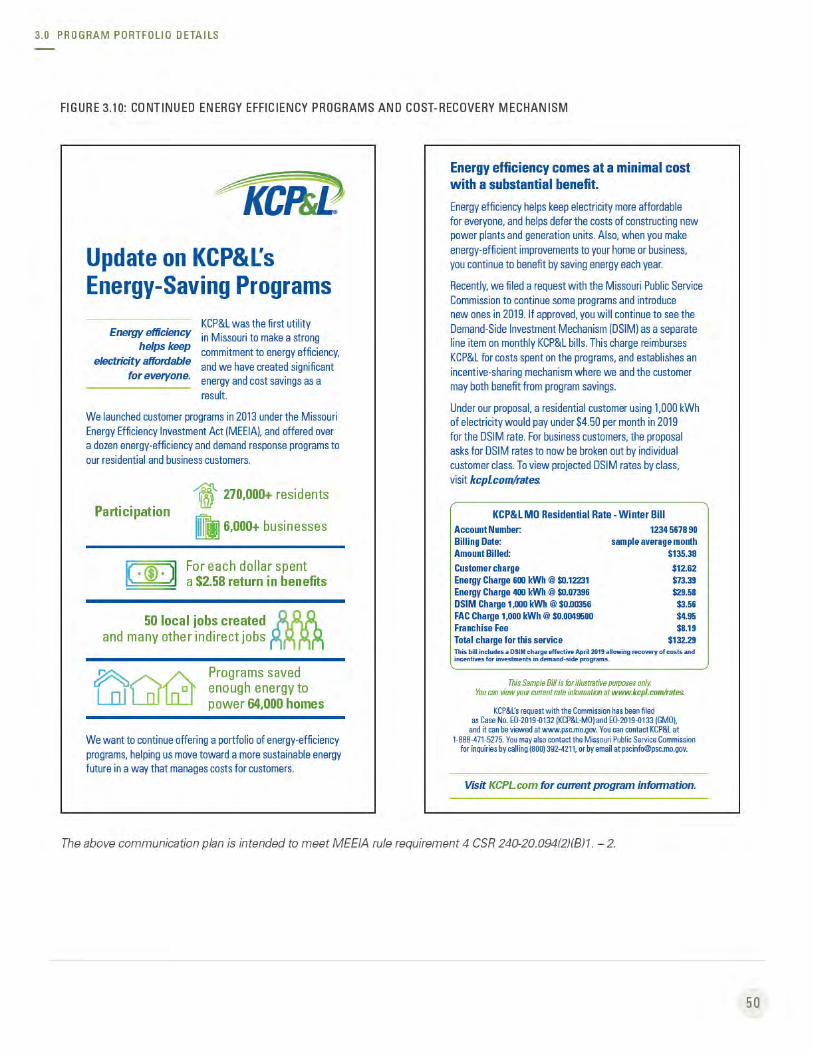
51
4.0 Recovery Mechanism
4.1 Overall Explanation of MechanismMEEIA establishes a state policy allowing for recovery of all reasonable and prudent costs of delivering cost-effective demand-side
programs. In support of that goal, MEEIA requires the Commission to:
• Provide timely cost recovery for utilities;
• Ensure utility financial incentives are aligned with helping customers use energy more efficiently and in a manner that
sustains or enhances customers’ incentives to use energy more efficiently; and
• Provide timely earnings opportunities associated with cost-effective, measurable and verifiable efficiency savings.
We value the results of the collaborative efforts of the Commission, Commission staff and other stakeholders in developing and
improving the effectiveness of the demand-side investment mechanism (DSIM) Rider in Cycle 1 and Cycle 2. We believe these
efforts have resulted in recovery mechanisms which have met MEEIA policy goals. Therefore, we propose continuing the DSIM
recovery mechanism with the following components.
4.1.1 Direct Program Costs Recovery ComponentThis component includes recovery of the direct costs associated with program administration (including evaluation), implementation
and rebates to program participants — all of which are necessary to reap the benefits demand-side management (DSM) can provide.
Timely recovery is also required for the impact of reduced sales on the utility.
4.1.2 Throughput Disincentive (TD) Recovery ComponentRecovery of the impact of reduced sales on utility financial performance is not intended to provide KCP&L with additional earnings,
but rather to keep it whole, consistent with its existing regulatory framework and as required by MEEIA. Without proper alignment
of financial incentives, energy efficiency (EE) causes negative effects to financial performance as both earnings and cash flow suffer.
Providing recovery, dollar-for-dollar, for fixed costs normally recovered in volumetric rates reverses the negative financial effects —
known as the throughput disincentive (TD) — associated with EE.
For TD recovery to be recognized beginning in the month of savings, the recovery amount must be objectively determinable at that
time. To meet this requirement, we propose to continue using a TD model to calculate the effect of deemed kWh savings resulting
from EE measures installed on kWh sales and revenues. To balance this interest in recognizing and recovering the TD in the period
when revenues are impacted against MEEIA’s requirement that demand-side programs are subject to independent evaluation,
we propose adjustments be included in the earnings opportunity (EO) for the effect of the difference in evaluated kWh savings
compared to deemed savings used in calculating the TD.
4 .0 RECOVERY MECHANISM
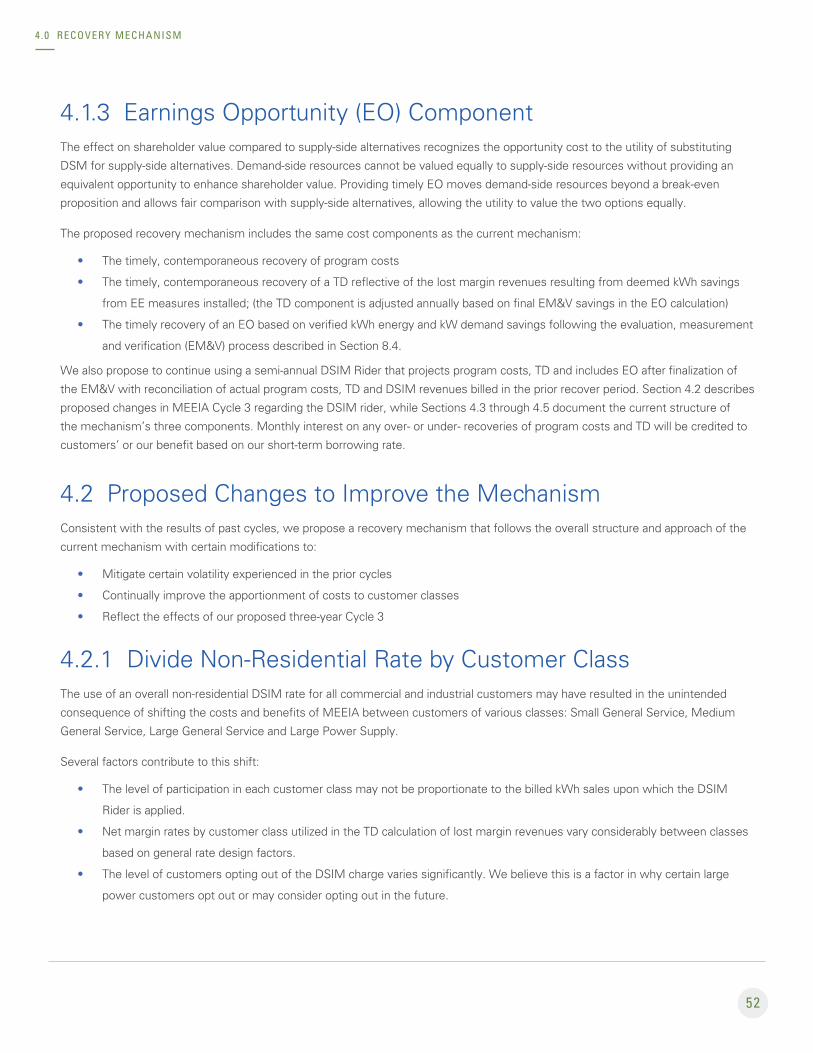
52
4.1.3 Earnings Opportunity (EO) ComponentThe effect on shareholder value compared to supply-side alternatives recognizes the opportunity cost to the utility of substituting
DSM for supply-side alternatives. Demand-side resources cannot be valued equally to supply-side resources without providing an
equivalent opportunity to enhance shareholder value. Providing timely EO moves demand-side resources beyond a break-even
proposition and allows fair comparison with supply-side alternatives, allowing the utility to value the two options equally.
The proposed recovery mechanism includes the same cost components as the current mechanism:
• The timely, contemporaneous recovery of program costs
• The timely, contemporaneous recovery of a TD reflective of the lost margin revenues resulting from deemed kWh savings
from EE measures installed; (the TD component is adjusted annually based on final EM&V savings in the EO calculation)
• The timely recovery of an EO based on verified kWh energy and kW demand savings following the evaluation, measurement
and verification (EM&V) process described in Section 8.4.
We also propose to continue using a semi-annual DSIM Rider that projects program costs, TD and includes EO after finalization of
the EM&V with reconciliation of actual program costs, TD and DSIM revenues billed in the prior recover period. Section 4.2 describes
proposed changes in MEEIA Cycle 3 regarding the DSIM rider, while Sections 4.3 through 4.5 document the current structure of
the mechanism’s three components. Monthly interest on any over- or under- recoveries of program costs and TD will be credited to
customers’ or our benefit based on our short-term borrowing rate.
4.2 Proposed Changes to Improve the MechanismConsistent with the results of past cycles, we propose a recovery mechanism that follows the overall structure and approach of the
current mechanism with certain modifications to:
• Mitigate certain volatility experienced in the prior cycles
• Continually improve the apportionment of costs to customer classes
• Reflect the effects of our proposed three-year Cycle 3
4.2.1 Divide Non-Residential Rate by Customer ClassThe use of an overall non-residential DSIM rate for all commercial and industrial customers may have resulted in the unintended
consequence of shifting the costs and benefits of MEEIA between customers of various classes: Small General Service, Medium
General Service, Large General Service and Large Power Supply.
Several factors contribute to this shift:
• The level of participation in each customer class may not be proportionate to the billed kWh sales upon which the DSIM
Rider is applied.
• Net margin rates by customer class utilized in the TD calculation of lost margin revenues vary considerably between classes
based on general rate design factors.
• The level of customers opting out of the DSIM charge varies significantly. We believe this is a factor in why certain large
power customers opt out or may consider opting out in the future.
4 .0 RECOVERY MECHANISM
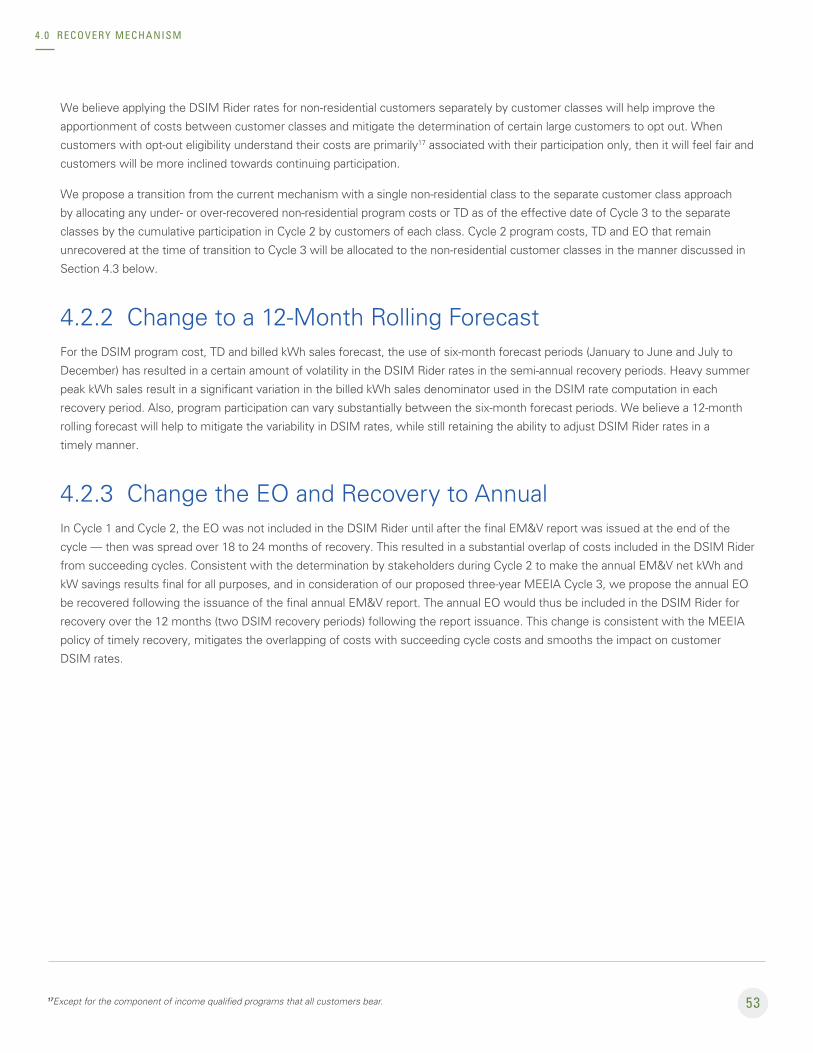
53
We believe applying the DSIM Rider rates for non-residential customers separately by customer classes will help improve the
apportionment of costs between customer classes and mitigate the determination of certain large customers to opt out. When
customers with opt-out eligibility understand their costs are primarily17 associated with their participation only, then it will feel fair and
customers will be more inclined towards continuing participation.
We propose a transition from the current mechanism with a single non-residential class to the separate customer class approach
by allocating any under- or over-recovered non-residential program costs or TD as of the effective date of Cycle 3 to the separate
classes by the cumulative participation in Cycle 2 by customers of each class. Cycle 2 program costs, TD and EO that remain
unrecovered at the time of transition to Cycle 3 will be allocated to the non-residential customer classes in the manner discussed in
Section 4.3 below.
4.2.2 Change to a 12-Month Rolling ForecastFor the DSIM program cost, TD and billed kWh sales forecast, the use of six-month forecast periods (January to June and July to
December) has resulted in a certain amount of volatility in the DSIM Rider rates in the semi-annual recovery periods. Heavy summer
peak kWh sales result in a significant variation in the billed kWh sales denominator used in the DSIM rate computation in each
recovery period. Also, program participation can vary substantially between the six-month forecast periods. We believe a 12-month
rolling forecast will help to mitigate the variability in DSIM rates, while still retaining the ability to adjust DSIM Rider rates in a
timely manner.
4.2.3 Change the EO and Recovery to AnnualIn Cycle 1 and Cycle 2, the EO was not included in the DSIM Rider until after the final EM&V report was issued at the end of the
cycle — then was spread over 18 to 24 months of recovery. This resulted in a substantial overlap of costs included in the DSIM Rider
from succeeding cycles. Consistent with the determination by stakeholders during Cycle 2 to make the annual EM&V net kWh and
kW savings results final for all purposes, and in consideration of our proposed three-year MEEIA Cycle 3, we propose the annual EO
be recovered following the issuance of the final annual EM&V report. The annual EO would thus be included in the DSIM Rider for
recovery over the 12 months (two DSIM recovery periods) following the report issuance. This change is consistent with the MEEIA
policy of timely recovery, mitigates the overlapping of costs with succeeding cycle costs and smooths the impact on customer
DSIM rates.
4 .0 RECOVERY MECHANISM
17Except for the component of income qualified programs that all customers bear.
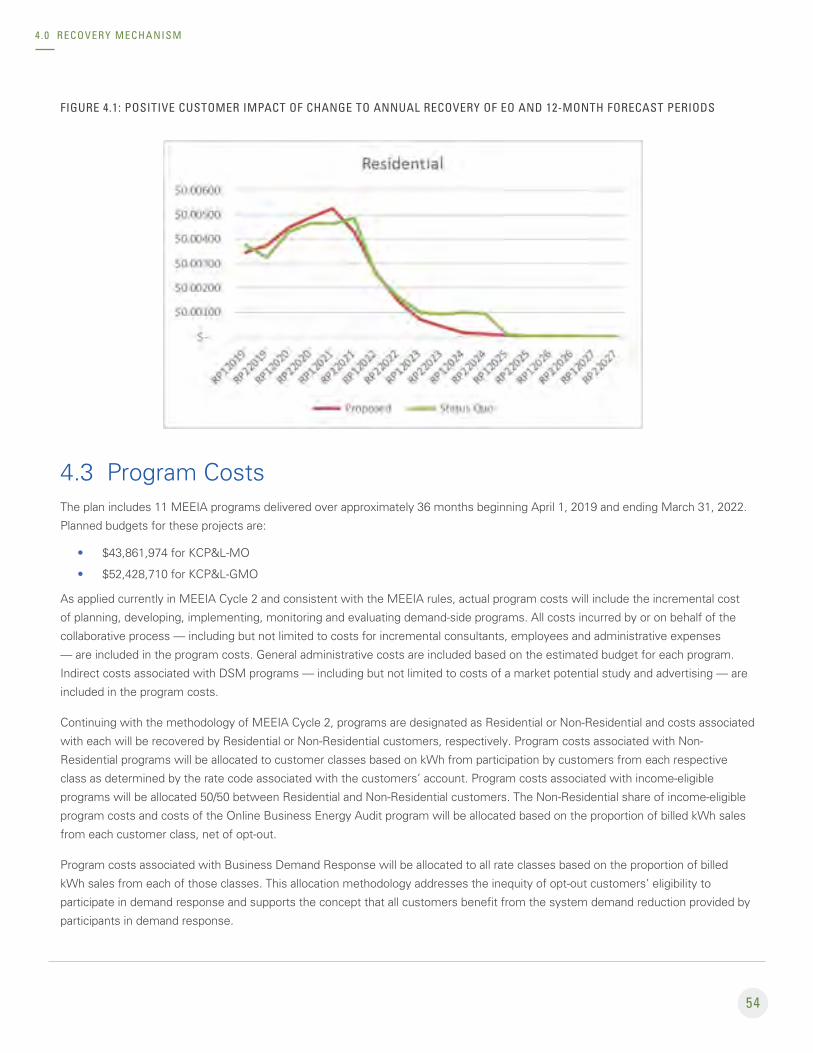
54
FIGURE 4.1: POSITIVE CUSTOMER IMPACT OF CHANGE TO ANNUAL RECOVERY OF EO AND 12-MONTH FORECAST PERIODS
4.3 Program CostsThe plan includes 11 MEEIA programs delivered over approximately 36 months beginning April 1, 2019 and ending March 31, 2022.
Planned budgets for these projects are:
• $43,861,974 for KCP&L-MO
• $52,428,710 for KCP&L-GMO
As applied currently in MEEIA Cycle 2 and consistent with the MEEIA rules, actual program costs will include the incremental cost
of planning, developing, implementing, monitoring and evaluating demand-side programs. All costs incurred by or on behalf of the
collaborative process — including but not limited to costs for incremental consultants, employees and administrative expenses
— are included in the program costs. General administrative costs are included based on the estimated budget for each program.
Indirect costs associated with DSM programs — including but not limited to costs of a market potential study and advertising — are
included in the program costs.
Continuing with the methodology of MEEIA Cycle 2, programs are designated as Residential or Non-Residential and costs associated
with each will be recovered by Residential or Non-Residential customers, respectively. Program costs associated with Non-
Residential programs will be allocated to customer classes based on kWh from participation by customers from each respective
class as determined by the rate code associated with the customers’ account. Program costs associated with income-eligible
programs will be allocated 50/50 between Residential and Non-Residential customers. The Non-Residential share of income-eligible
program costs and costs of the Online Business Energy Audit program will be allocated based on the proportion of billed kWh sales
from each customer class, net of opt-out.
Program costs associated with Business Demand Response will be allocated to all rate classes based on the proportion of billed
kWh sales from each of those classes. This allocation methodology addresses the inequity of opt-out customers’ eligibility to
participate in demand response and supports the concept that all customers benefit from the system demand reduction provided by
participants in demand response.
4 .0 RECOVERY MECHANISM
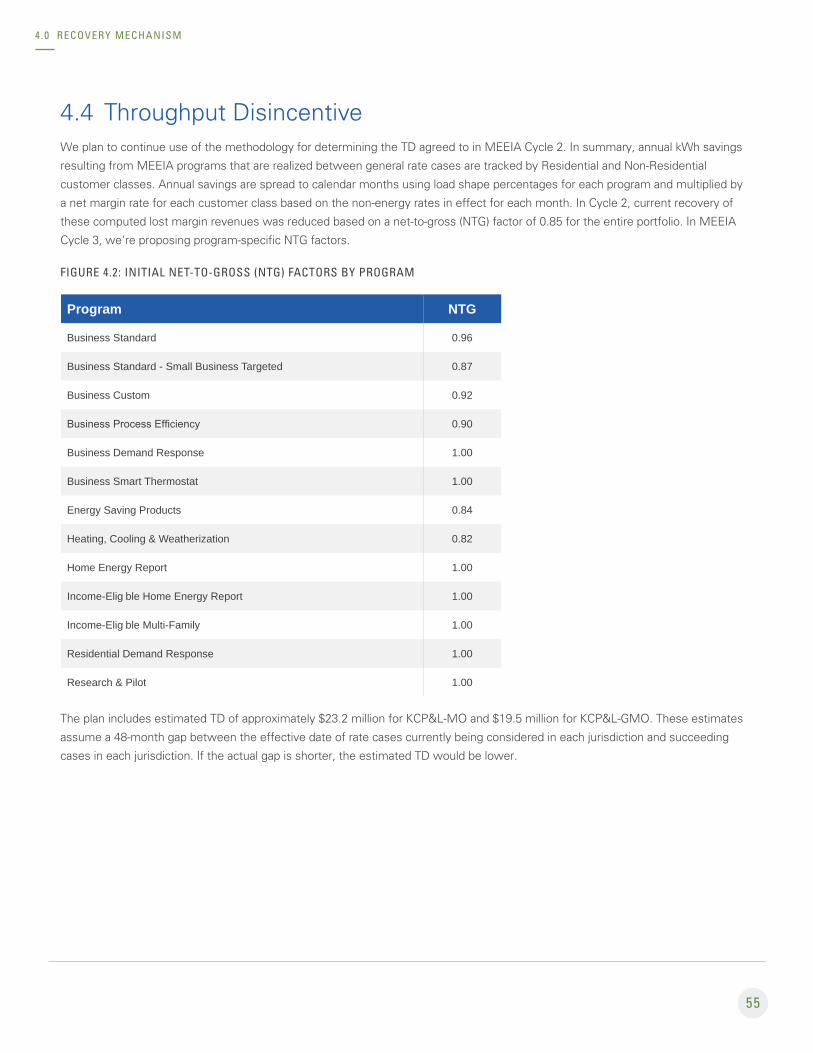
55
4.4 Throughput DisincentiveWe plan to continue use of the methodology for determining the TD agreed to in MEEIA Cycle 2. In summary, annual kWh savings
resulting from MEEIA programs that are realized between general rate cases are tracked by Residential and Non-Residential
customer classes. Annual savings are spread to calendar months using load shape percentages for each program and multiplied by
a net margin rate for each customer class based on the non-energy rates in effect for each month. In Cycle 2, current recovery of
these computed lost margin revenues was reduced based on a net-to-gross (NTG) factor of 0.85 for the entire portfolio. In MEEIA
Cycle 3, we’re proposing program-specific NTG factors.
FIGURE 4.2: INITIAL NET-TO-GROSS (NTG) FACTORS BY PROGRAM
Program NTG
Business Standard 0.96
Business Standard - Small Business Targeted 0.87
Business Custom 0.92
Business Process Efficiency 0.90
Business Demand Response 1.00
Business Smart Thermostat 1.00
Energy Saving Products 0.84
Heating, Cooling & Weatherization 0.82
Home Energy Report 1.00
Income-Elig ble Home Energy Report 1.00
Income-Elig ble Multi-Family 1.00
Residential Demand Response 1.00
Research & Pilot 1.00
The plan includes estimated TD of approximately $23.2 million for KCP&L-MO and $19.5 million for KCP&L-GMO. These estimates
assume a 48-month gap between the effective date of rate cases currently being considered in each jurisdiction and succeeding
cases in each jurisdiction. If the actual gap is shorter, the estimated TD would be lower.
4 .0 RECOVERY MECHANISM
56
4.4.1 Throughput Disincentive (TD) CalculationTD will be computed monthly in the following manner:
• kWh savings are reflected in the TD by multiplying the estimated kWh savings times the incremental rate for the
respective class.
• If a rate case occurs during the program period, the cumulative kWh and kW savings are included in the test period to
reflect actual energy and demand savings in the weather-normalized/customer-annualized unit sales and sales revenues
used in setting the case’s revenue requirements.
• This establishes a rebased level to restart kWh and kW savings for the TD to be included through the remainder of the
program period.
• We will use billing determinants from the last rate cases to establish incremental rates.
Estimated kWh savings by month by program will be determined as follows:
1. The number of standard measures installed each month — for programs with standard measures in the Technical Resource
Manual (TRM) attached as Appendix 8.3 — is multiplied by the defined annual kWh savings per measure. This determines
the savings for measures installed by month aggregated by program to which such measures belong. Annual kWh savings
for custom measures installed are calculated and reported monthly by the program implementers and aggregated by
program and by customer class.
2. Total kWh savings for the current month aggregated by program in 1 above are multiplied by 50 percent to reflect an
assumed mid-month installation.
3. Each month, total kWh savings by program are accumulated from the beginning of the cycle through the preceding month.
4. The sum of items 2 and 3 above is multiplied by the monthly load shape percentage for the applicable month by program, in
a spreadsheet to be provided as a workpaper, to determine monthly kWh savings.
5. Monthly kWh savings resulting from the Home Energy Report programs are reported monthly by the implementer.
6. The sum of the monthly kWh savings determined in 4 and 5 above will be multiplied by the incremental rate by customer
class to determine monthly TD.
The applicable accounting standard which most directly addresses the requirements for the recognition of revenues under such
alternative revenue programs is Financial Accounting Standards Board Accounting Standards Codification (ASC) 980-605-25
“Alternative Revenue Programs.” ASC 980-605-25 sets three conditions for revenues resulting from alternative revenue programs
such as the DSIM.
• The program must be established by order of the regulatory commission allowing for automatic adjustment of future rates.
• The amount of revenue for the period must be objectively determinable and probable of recovery.
• Revenues must be collected within 24 months of the period in which they are recognized. If the TD is subjected to
subsequent recalculation, we could not recognize the revenue in the periods that sales were reduced, resulting in temporary
reductions in earnings which would adversely impact our market value and cause a misalignment of utility financial
incentives to promote energy efficiency.
4 .0 RECOVERY MECHANISM
57
4.4.2 Rate Case AnnualizationFor the general rate case annualization adjustments, we propose continuing the agreed-upon methodology used in MEEIA Cycle 2.
Upon filing a general rate case, the cumulative, annualized, normalized kWh and kW savings are included in the unit sales and sales
revenues used in setting rates as of an appropriate time where actual results are known prior to the true-up period, to reflect energy
and demand savings in the billing determinants and sales revenues used in setting the revenue requirements and tariffed rates in the
case. Upon the adjustment for kWh and kW savings in a rate case, the collection of TD is re-based.
Test period weather-normalized kWh usage for each customer class by billing month is adjusted by:
• Adding back the impact of monthly kWh energy savings by customer class incurred during the test period from all
active MEEIA programs (Cycle 2 and Cycle 3), excluding programs with a one-year measure life. This is determined using
the methodology described in the DSIM Rider, except calendar month load shape percentages by program and by month
are converted to reflect billing month load shape percentages by program by computing a weighted average of the current
and succeeding month percentages.
Adjusted test period sales from above will be annualized for customers and adjusted further by:
• Subtracting the impact of cumulative annual kWh energy savings from the first month of the test period through the true-up
date by customer class from all active MEEIA programs (Cycle 2 and Cycle 3), excluding programs with a one-year measure
life. This is determined using the methodology described in the DSIM Rider, except calendar month load shape percentages
by program and by month are converted to reflect billing month load shape percentages by program by computing a
weighted average of the current and succeeding month percentages.
Test period kW demand for each customer class will be adjusted by:
• Adding back the monthly kW demand savings by customer class incurred during the test period from all active MEEIA
programs (Cycle 2 and Cycle 3), excluding programs with a one-year measure life. This is determined using the methodology
described for kWh savings in the DSIM Rider — then subtracting the cumulative annual kW demand savings from the first
month of the test period through the true-up date by customer class from all active MEEIA programs (Cycle 2 and Cycle 3),
excluding programs with a one-year measure life.
TD will continue to be calculated and recovered until a rate case is filed after the end of MEEIA Cycle 3 with a test period ending at
or after the end of Cycle 3.
4.5 Earnings Opportunity (EO)
We propose that — consistent with Cycle 2 — the earnings opportunity (EO) be determined for each program year using an EO
matrix (Appendix 8.7) and the same $ per MWh and $ per MW values used in Cycle 2. The only modifications to this matrix are to
compute the EO amounts annually, rather than the entire cycle, for the Income-Eligible Multi-Family (IEMF) and the Home Energy
Reports (HER) programs, as well as an annual $ per MW award rate for the Business Demand Response (BDR) program. We
propose having the opportunity for additional EO amounts under the updated IEMF program framework, as noted below, to increase
this programs annual Cap to 130%. These changes help drive focus for these programs that have a one-year measure life (BDR,
HER) or have increased in scale (IEMF) and are necessary to calculate the EO on an annual basis.
4 .0 RECOVERY MECHANISM
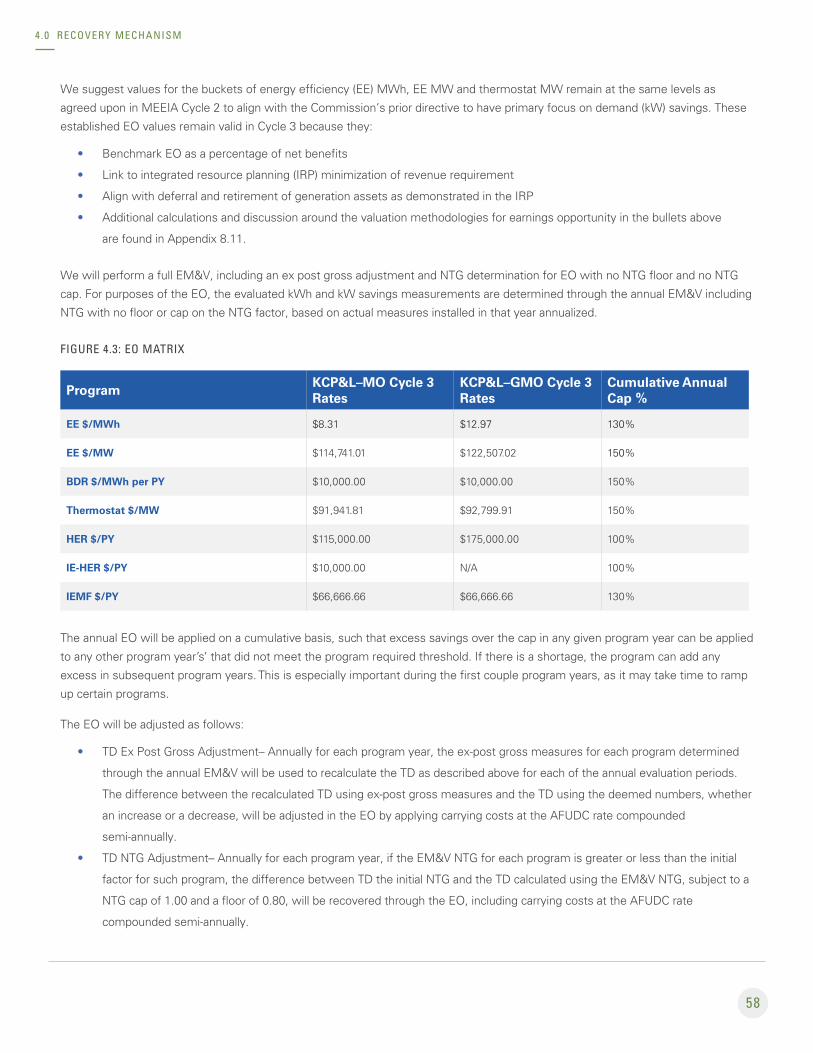
58
We suggest values for the buckets of energy efficiency (EE) MWh, EE MW and thermostat MW remain at the same levels as
agreed upon in MEEIA Cycle 2 to align with the Commission’s prior directive to have primary focus on demand (kW) savings. These
established EO values remain valid in Cycle 3 because they:
• Benchmark EO as a percentage of net benefits
• Link to integrated resource planning (IRP) minimization of revenue requirement
• Align with deferral and retirement of generation assets as demonstrated in the IRP
• Additional calculations and discussion around the valuation methodologies for earnings opportunity in the bullets above
are found in Appendix 8.11.
We will perform a full EM&V, including an ex post gross adjustment and NTG determination for EO with no NTG floor and no NTG
cap. For purposes of the EO, the evaluated kWh and kW savings measurements are determined through the annual EM&V including
NTG with no floor or cap on the NTG factor, based on actual measures installed in that year annualized.
FIGURE 4.3: EO MATRIX
ProgramKCP&L–MO Cycle 3 Rates
KCP&L–GMO Cycle 3 Rates
Cumulative Annual Cap %
EE $/MWh $8.31 $12.97 130%
EE $/MW $114,741.01 $122,507.02 150%
BDR $/MWh per PY $10,000.00 $10,000.00 150%
Thermostat $/MW $91,941.81 $92,799.91 150%
HER $/PY $115,000.00 $175,000.00 100%
IE-HER $/PY $10,000.00 N/A 100%
IEMF $/PY $66,666.66 $66,666.66 130%
The annual EO will be applied on a cumulative basis, such that excess savings over the cap in any given program year can be applied
to any other program year’s’ that did not meet the program required threshold. If there is a shortage, the program can add any
excess in subsequent program years. This is especially important during the first couple program years, as it may take time to ramp
up certain programs.
The EO will be adjusted as follows:
• TD Ex Post Gross Adjustment– Annually for each program year, the ex-post gross measures for each program determined
through the annual EM&V will be used to recalculate the TD as described above for each of the annual evaluation periods.
The difference between the recalculated TD using ex-post gross measures and the TD using the deemed numbers, whether
an increase or a decrease, will be adjusted in the EO by applying carrying costs at the AFUDC rate compounded
semi-annually.
• TD NTG Adjustment– Annually for each program year, if the EM&V NTG for each program is greater or less than the initial
factor for such program, the difference between TD the initial NTG and the TD calculated using the EM&V NTG, subject to a
NTG cap of 1.00 and a floor of 0.80, will be recovered through the EO, including carrying costs at the AFUDC rate
compounded semi-annually.
4 .0 RECOVERY MECHANISM

59
• We propose that the adjusted EO cannot go below zero. The EO target at 100 percent is $7,909,523 for KCP&L-MO and
$10,055,885 for KCP&L-GMO. The EO (before adjustments reflecting TD EM&V including NTG) cannot go above
$11,337,723 for KCP&L-MO and $14,373,509 for KCP&L-GMO.
4.5.1 Income-Eligible Multi-Family EO Performance MetricsThe annual performance metric will consist of two elements and has an annual cap of 130 percent performance compared to the
annual target.
1. Average Percent Energy Savings Per Project
2. Spend of at least 85 percent of Budget
DEFINITION OF METRICS
1. The Average Percent Energy Savings Per Project performance element will be calculated using a pre-project property energy
benchmarking tool to identify each project's energy usage and the TRM’s deemed energy savings values. Each Program
Year, the total number of projects will be divided by the total number of kWh’s saved for a project average.
2. The Spend of at least 85 percent of Budget performance element will create a threshold criterion that ensures at least
85 percent of the Commission-approved annual budget (administrative cost, plus customer incentive cost) for the program
year is spent. The actual spend will be reported directly out of the Company’s accounting system and included in the
EM&V report. The Company will also provide a list of ‘lock-in projects’ and their locked-in date for inclusion for the
program year spend.
PROGRAM YEAR DETAILS FOR PERFORMANCE EVALUATION
Each Program year the Spend of the spending of at least 85 percent of Budget performance element will be in place, which may
include ‘locked-in projects’ allocated budget.
• PY1 –No requirement for PY1 Average Percent Energy Savings Per Project; to allow for program evaluation and adjustments
• PY2 – Average Project kWh Savings of 4% - 10%
• PY3 – Average Project kWh Savings of 6% - 12%
• PY4 – Average Project kWh Savings of 8% - 14%
• PY5 – Average Project kWh Savings of 10% - 16%
• PY6 – Average Project kWh Savings of 12% - 18%
ADDITIONAL PROGRAM YEAR EO
Each additional percentage saved within the applicable program year range, above the minimum, will receive a bonus of 5 percent,
up to a cap of 130 percent.
4 .0 RECOVERY MECHANISM
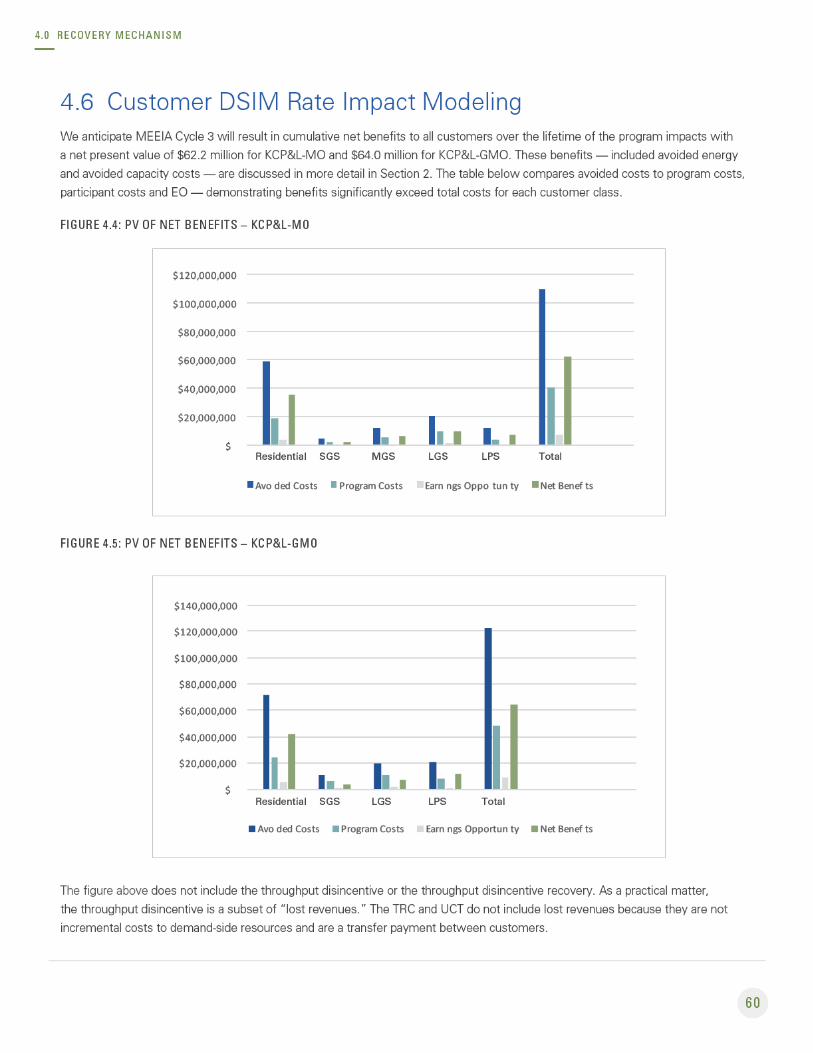
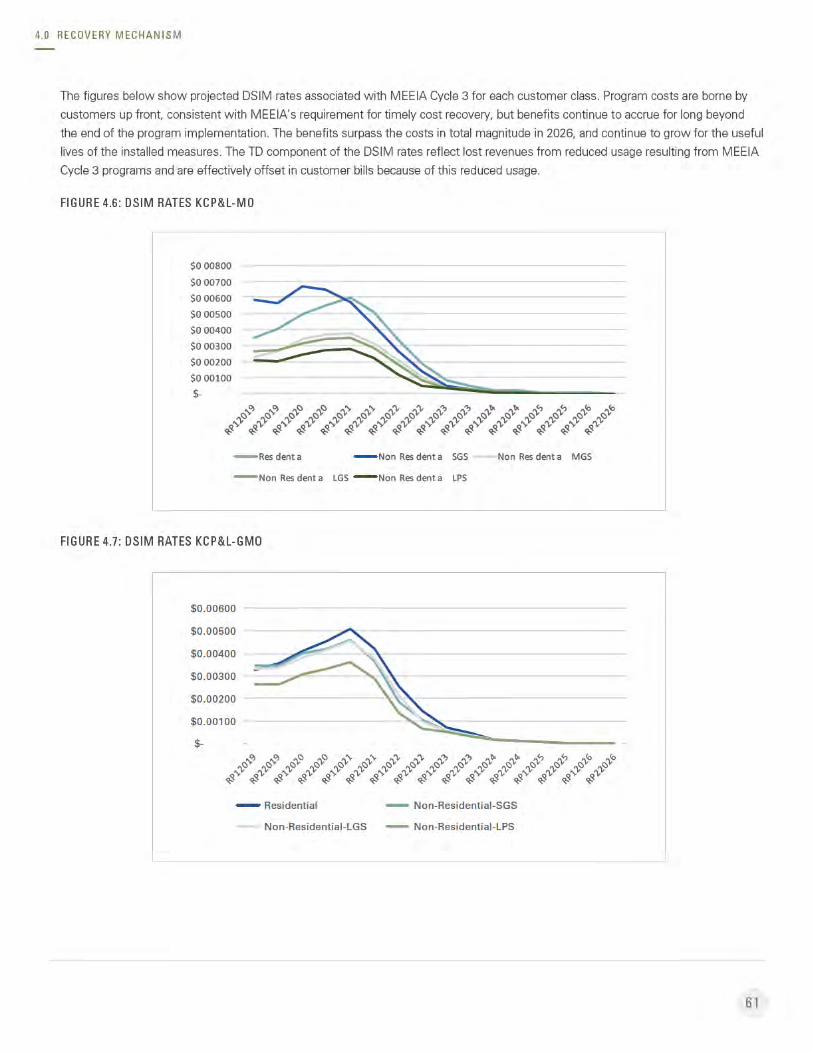
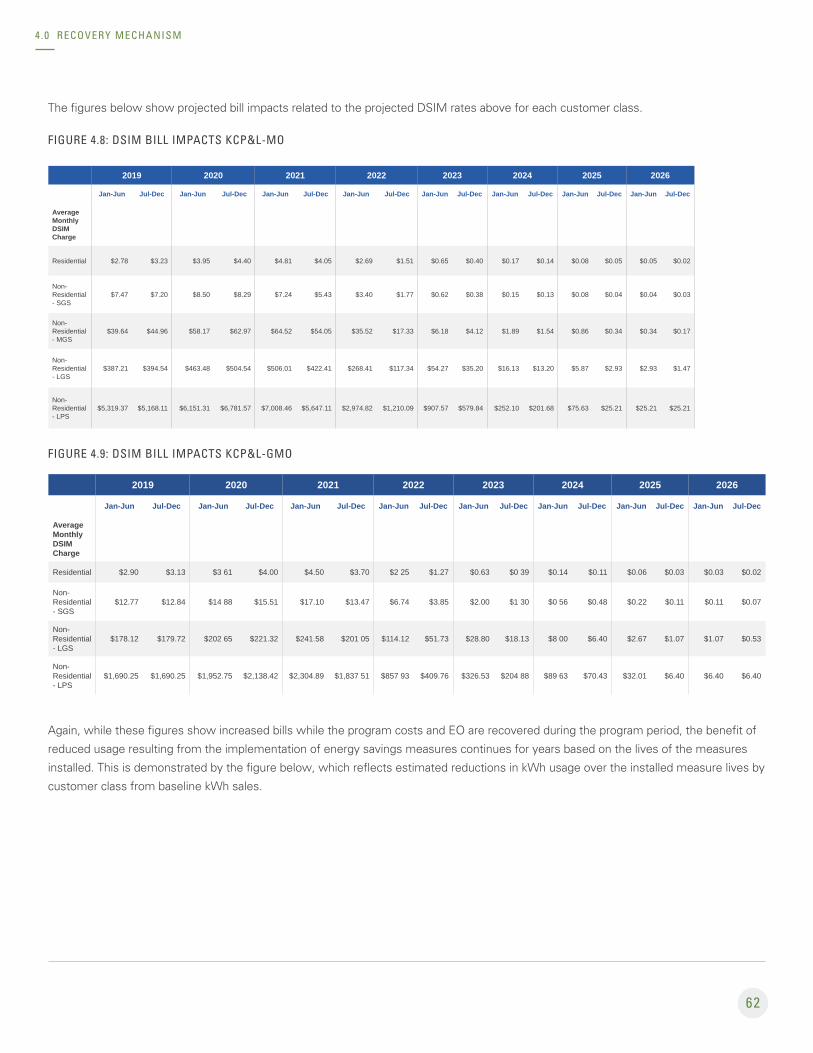
62
The figures below show projected bill impacts related to the projected DSIM rates above for each customer class.
FIGURE 4.8: DSIM BILL IMPACTS KCP&L-MO
2019 2020 2021 2022 2023 2024 2025 2026
Jan-Jun Jul-Dec Jan-Jun Jul-Dec Jan-Jun Jul-Dec Jan-Jun Jul-Dec Jan-Jun Jul-Dec Jan-Jun Jul-Dec Jan-Jun Jul-Dec Jan-Jun Jul-Dec
Average Monthly DSIM Charge
Residential $2.78 $3.23 $3.95 $4.40 $4.81 $4.05 $2.69 $1.51 $0.65 $0.40 $0.17 $0.14 $0.08 $0.05 $0.05 $0.02
Non- Residential - SGS
$7.47 $7.20 $8.50 $8.29 $7.24 $5.43 $3.40 $1.77 $0.62 $0.38 $0.15 $0.13 $0.08 $0.04 $0.04 $0.03
Non- Residential - MGS
$39.64 $44.96 $58.17 $62.97 $64.52 $54.05 $35.52 $17.33 $6.18 $4.12 $1.89 $1.54 $0.86 $0.34 $0.34 $0.17
Non- Residential - LGS
$387.21 $394.54 $463.48 $504.54 $506.01 $422.41 $268.41 $117.34 $54.27 $35.20 $16.13 $13.20 $5.87 $2.93 $2.93 $1.47
Non- Residential - LPS
$5,319.37 $5,168.11 $6,151.31 $6,781.57 $7,008.46 $5,647.11 $2,974.82 $1,210.09 $907.57 $579.84 $252.10 $201.68 $75.63 $25.21 $25.21 $25.21
FIGURE 4.9: DSIM BILL IMPACTS KCP&L-GMO
2019 2020 2021 2022 2023 2024 2025 2026
Jan-Jun Jul-Dec Jan-Jun Jul-Dec Jan-Jun Jul-Dec Jan-Jun Jul-Dec Jan-Jun Jul-Dec Jan-Jun Jul-Dec Jan-Jun Jul-Dec Jan-Jun Jul-Dec
Average Monthly DSIM Charge
Residential $2.90 $3.13 $3 61 $4.00 $4.50 $3.70 $2 25 $1.27 $0.63 $0 39 $0.14 $0.11 $0.06 $0.03 $0.03 $0.02
Non- Residential - SGS
$12.77 $12.84 $14 88 $15.51 $17.10 $13.47 $6.74 $3.85 $2.00 $1 30 $0 56 $0.48 $0.22 $0.11 $0.11 $0.07
Non- Residential - LGS
$178.12 $179.72 $202 65 $221.32 $241.58 $201 05 $114.12 $51.73 $28.80 $18.13 $8 00 $6.40 $2.67 $1.07 $1.07 $0.53
Non- Residential - LPS
$1,690.25 $1,690.25 $1,952.75 $2,138.42 $2,304.89 $1,837 51 $857 93 $409.76 $326.53 $204 88 $89 63 $70.43 $32.01 $6.40 $6.40 $6.40
Again, while these figures show increased bills while the program costs and EO are recovered during the program period, the benefit of
reduced usage resulting from the implementation of energy savings measures continues for years based on the lives of the measures
installed. This is demonstrated by the figure below, which reflects estimated reductions in kWh usage over the installed measure lives by
customer class from baseline kWh sales.
4 .0 RECOVERY MECHANISM
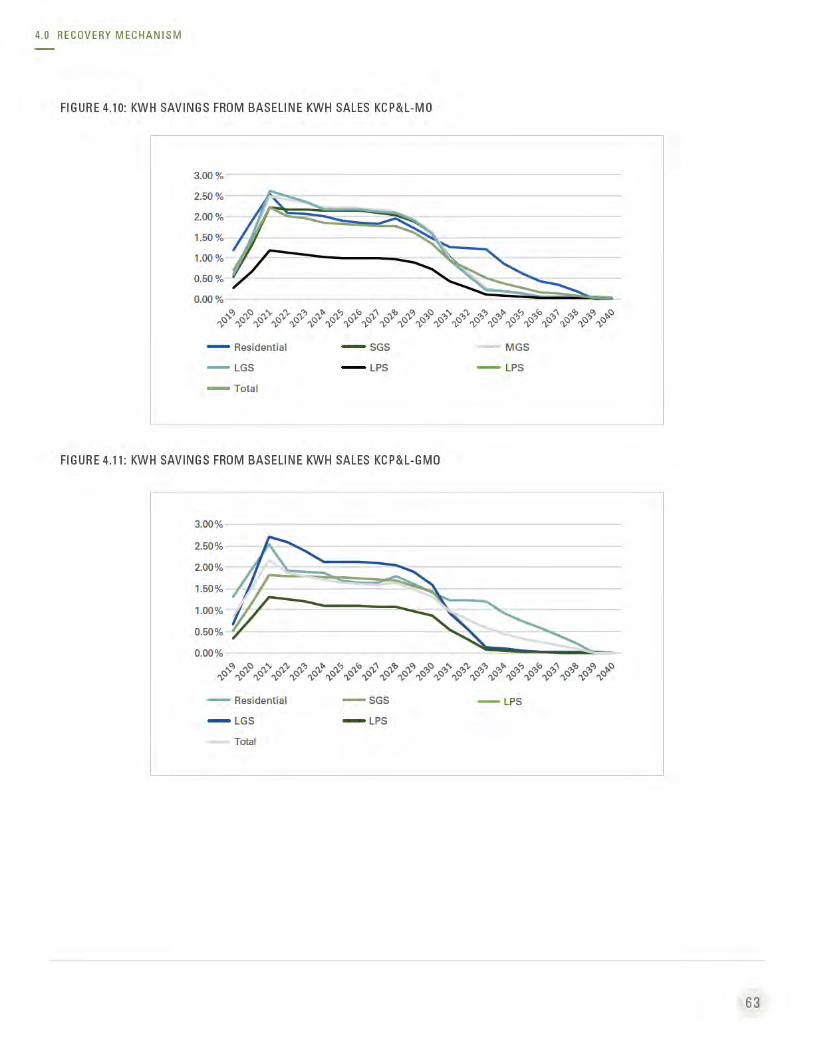
64
DSIM ACCOUNTING PRACTICES
We follow Generally Accepted Accounting Principles (GAAP) for financial accounting. GAAP encompasses the conventions, rules and
procedures necessary to define accepted accounting practices at a particular time. We also maintain our books and records in accordance
with the Federal Energy Regulatory Commission’s Uniform System of Accounts.
As in previous cycles, we’ll use FERC Account 908 Customer Assistance Expenses to track direct MEEIA-related program costs. Payroll
taxes and benefits loadings on direct labor incurred in support of MEEIA programs will be charged to FERC Account 408.1 Taxes Other
Than Income Taxes, Utility Operating Income and FERC Account 926 Employee Pensions and Benefits, respectively.
We’ve established an accounting distribution coding system for the proper classification of program costs for MEEIA-related DSM
programs, including:
• The prescribed accounts mandated by FERC in the Code of Federal Regulations for the classification of assets, liabilities,
revenues and expenses
• A department code for specific operational areas, identifying the group responsible for the cost
• The operating unit, identifying the jurisdiction associated with the cost
• The project code, identifying the MEEIA program associated with the cost
• Additional codes to further specify the type of work or specific purpose for the cost
• A resource code, identifying types of costs used to complete projects, or what was used to get the work done
(for example, labor vs. non-labor items)
The combination of codes above allows for the proper classification and clear delineation of costs. These codes will be expanded as
needed to accommodate the programs included in this filing.
We will use FERC Accounts 440 Residential Sales, 442 Commercial and Industrial Sales and 445 Other Sales to Public Authorities based
on the customer class of customers billed DSIM sales. The amount of DSIM sales billed to customers for program costs and TD will be
compared with the actual amount of program costs incurred and TD earned, with the differences recognized as a debit (over-collection) or
credit (under-collection) to sales in the FERC Accounts referenced above and the corresponding credit (over-collection) or debit (under-
collection) recorded in FERC Account 254 Other Regulatory Liabilities or FERC Account 182.5 Other Regulatory Assets, as appropriate.
Monthly interest calculated for the monthly cumulative balances of over- and under-collection of balances for program costs, TD and any
earned EO will be recognized as a debit (over-collection) or credit (under-collection) to FERC Account 431 Other Interest Expense and
the corresponding credit (over-collection) or debit (under-collection) recorded in FERC Account 254 Other Regulatory Liabilities or FERC
Account 182.5 Other Regulatory Assets as appropriate.
IMPACT ON FINANCIALS/CREDIT RATINGS
The below tables present the projected impacts of the proposed programs costs and lost margins and DSIM recoveries of program
costs, TD and EOs, over 2019 to 2026 on projected earnings. This analysis assumes 100 percent achievement of kWh and kW savings,
program cost budgets and EOs.
4 .0 RECOVERY MECHANISM

65
FIGURE 4.12: MEEIA CYCLE 3 PLAN IMPACTS ON KCP&L-MO EARNINGS **CONFIDENTIAL**
4.0 RECOVERY MECHANISM

66
FIGURE 4.13: MEEIA CYCLE 3 PLAN IMPACTS ON KCP&L-GMO EARNINGS **CONFIDENTIAL**
4.0 RECOVERY MECHANISM

67
The below tables reflect the projected impacts of the MEEIA Cycle 3 Plan, including EO at target, on certain KCP&L-MO and KCP&L-
GMO key credit metrics: Debt/EBITDA and Funds from Operations (FFO)/Debt. Our current forecast covers the years 2019 to 2022.
The 2022 baseline metrics are used for 2023 in the following analysis solely to show the impact of the MEEIA Cycle 3 Plan.
FIGURE 4.14: MEEIA CYCLE 3 PLAN IMPACT ON KCP&L-MO KEY CREDIT METRICS **CONFIDENTIAL**
FIGURE 4.15: MEEIA CYCLE 3 PLAN IMPACT ON KCP&L-GMO KEY CREDIT METRICS **CONFIDENTIAL**
The results of these analyses demonstrate the overall impacts of the MEEIA Cycle 3 with DSIM are small but generally positive and
supportive of credit quality. The analyses above support the conclusion that the DSIM as proposed aligns with our incentives.
4 .0 RECOVERY MECHANISM

68
5.0 Sustaining SuccessKCP&L views demand-side management (DSM) programs as a resource in a changing energy landscape and an opportunity to
provide long term value in the region. Customers in our KCP&L-MO and KCP&L-GMO service territories are increasingly familiar with
our offerings and support in the energy efficiency space.
This section outlines why DSM as a resource makes sense — and defines how to sustain success with engagement from regulatory
stakeholders and customers, including:
• Updated Integrated Resource Plan (IRP) scenarios for the combined company
• A focus on long-lived measures to drive energy and demand savings over longer periods
• Program flexibility to deliver customer offers in changing markets
• Ongoing stakeholder communication and engagement
• Evaluation, measurement and verification (EM&V) planning to improve feedback and insights
• Managing opt-out levels by engaging business customers through a customer-centric approach
5.1 Missouri DSM Policy and KCP&L Resource Selection Process POLICY BACKGROUND
In Missouri, the MEEIA statute18 and the IRP process are built to expand resource options and facilitate a robust analysis for the
utility and regulators to adhere to when evaluating resource investment decisions. However, MEEIA and the IRP process have
inherent conflicting primary objective functions, presenting a quandary concerning how to achieve the intentions of both. While
the goal of MEEIA is to achieve “all cost-effective demand-side savings,” the IRP rules require using minimization of NPVRR
as the primary selection criteria. Said another way, solving for one doesn’t necessarily satisfy the other. By investing in all cost-
effective demand-side savings, revenue requirements for customers may fluctuate. Conversely, optimizing (i.e. minimizing) revenue
requirements may cause demand-side investment levels to fluctuate.
We strive to find the right balance for both the IRP requirement while achieving MEEIA's goals. As discussed below and as a first
step toward dynamically optimizing the DSM portfolio, we’ve performed an additional iteration of the IRP analysis with the evaluation
of 11 additional ARPs for both the joint company and KCP&L-MO standalone.
The two principle concepts to consider from the MEEIA statute are that it is “...the policy of the state to value demand-side
investments equal to traditional investments in supply and delivery infrastructure...”19 and that the Commission shall permit utilities
to "implement commission approved demand side programs… with a goal of achieving all cost-effective demand-side savings.”20
The MEEIA statute also provides that Commission shall consider the TRC test a preferred cost effectiveness test.21 However, it does
not stipulate that the TRC test is the sole test, but a preferred metric in evaluating the outcomes of other analyses, including UCT,
PCT, SCT and minimization of net present value of revenue requirements (NPVRR).
The policy objective in the IRP rules defines the criteria by which to analyze demand-side and supply-side resources on an equivalent
basis. This objective is to use “minimization of the present worth of long-run utility costs as the primary selection criterion” (i.e.
minimization of NPVRR). The IRP rule regarding the analysis of differing resources is not contingent on having a need for capacity,
but having costs and characteristics of each option to model.
In evaluating the resource options, it’s important to understand that it’s not necessary to avoid an investment in a supply-side resource to avoid a cost associated with meeting the total demand for capacity and energy.
5 .0 SUSTAINING SUCCESS
18 393.1075 (RS MO) 19 393.1075.3
20 393.1075.421 Id.
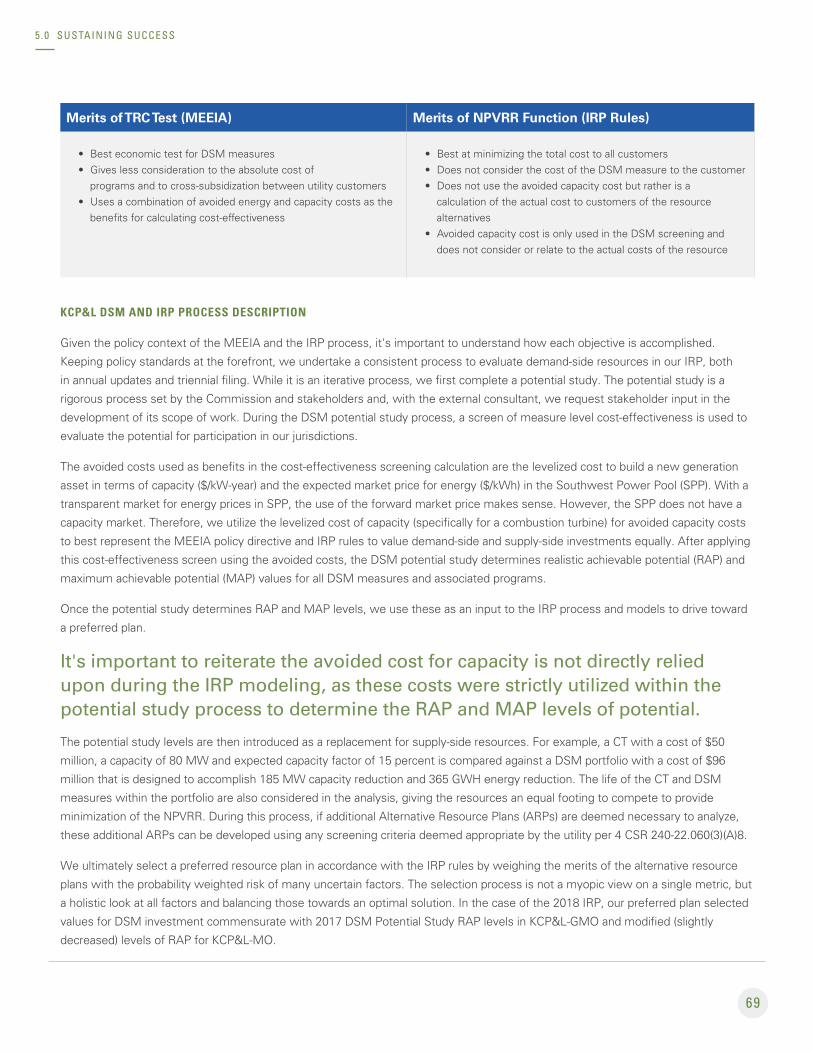
69
Merits of TRC Test (MEEIA) Merits of NPVRR Function (IRP Rules)
• Best economic test for DSM measures• Gives less consideration to the absolute cost of
programs and to cross-subsidization between utility customers• Uses a combination of avoided energy and capacity costs as the
benefits for calculating cost-effectiveness
• Best at minimizing the total cost to all customers• Does not consider the cost of the DSM measure to the customer• Does not use the avoided capacity cost but rather is a
calculation of the actual cost to customers of the resource alternatives
• Avoided capacity cost is only used in the DSM screening and does not consider or relate to the actual costs of the resource
KCP&L DSM AND IRP PROCESS DESCRIPTION
Given the policy context of the MEEIA and the IRP process, it's important to understand how each objective is accomplished.
Keeping policy standards at the forefront, we undertake a consistent process to evaluate demand-side resources in our IRP, both
in annual updates and triennial filing. While it is an iterative process, we first complete a potential study. The potential study is a
rigorous process set by the Commission and stakeholders and, with the external consultant, we request stakeholder input in the
development of its scope of work. During the DSM potential study process, a screen of measure level cost-effectiveness is used to
evaluate the potential for participation in our jurisdictions.
The avoided costs used as benefits in the cost-effectiveness screening calculation are the levelized cost to build a new generation
asset in terms of capacity ($/kW-year) and the expected market price for energy ($/kWh) in the Southwest Power Pool (SPP). With a
transparent market for energy prices in SPP, the use of the forward market price makes sense. However, the SPP does not have a
capacity market. Therefore, we utilize the levelized cost of capacity (specifically for a combustion turbine) for avoided capacity costs
to best represent the MEEIA policy directive and IRP rules to value demand-side and supply-side investments equally. After applying
this cost-effectiveness screen using the avoided costs, the DSM potential study determines realistic achievable potential (RAP) and
maximum achievable potential (MAP) values for all DSM measures and associated programs.
Once the potential study determines RAP and MAP levels, we use these as an input to the IRP process and models to drive toward
a preferred plan.
It's important to reiterate the avoided cost for capacity is not directly relied upon during the IRP modeling, as these costs were strictly utilized within the potential study process to determine the RAP and MAP levels of potential.
The potential study levels are then introduced as a replacement for supply-side resources. For example, a CT with a cost of $50
million, a capacity of 80 MW and expected capacity factor of 15 percent is compared against a DSM portfolio with a cost of $96
million that is designed to accomplish 185 MW capacity reduction and 365 GWH energy reduction. The life of the CT and DSM
measures within the portfolio are also considered in the analysis, giving the resources an equal footing to compete to provide
minimization of the NPVRR. During this process, if additional Alternative Resource Plans (ARPs) are deemed necessary to analyze,
these additional ARPs can be developed using any screening criteria deemed appropriate by the utility per 4 CSR 240-22.060(3)(A)8.
We ultimately select a preferred resource plan in accordance with the IRP rules by weighing the merits of the alternative resource
plans with the probability weighted risk of many uncertain factors. The selection process is not a myopic view on a single metric, but
a holistic look at all factors and balancing those towards an optimal solution. In the case of the 2018 IRP, our preferred plan selected
values for DSM investment commensurate with 2017 DSM Potential Study RAP levels in KCP&L-GMO and modified (slightly
decreased) levels of RAP for KCP&L-MO.
5 .0 SUSTAINING SUCCESS
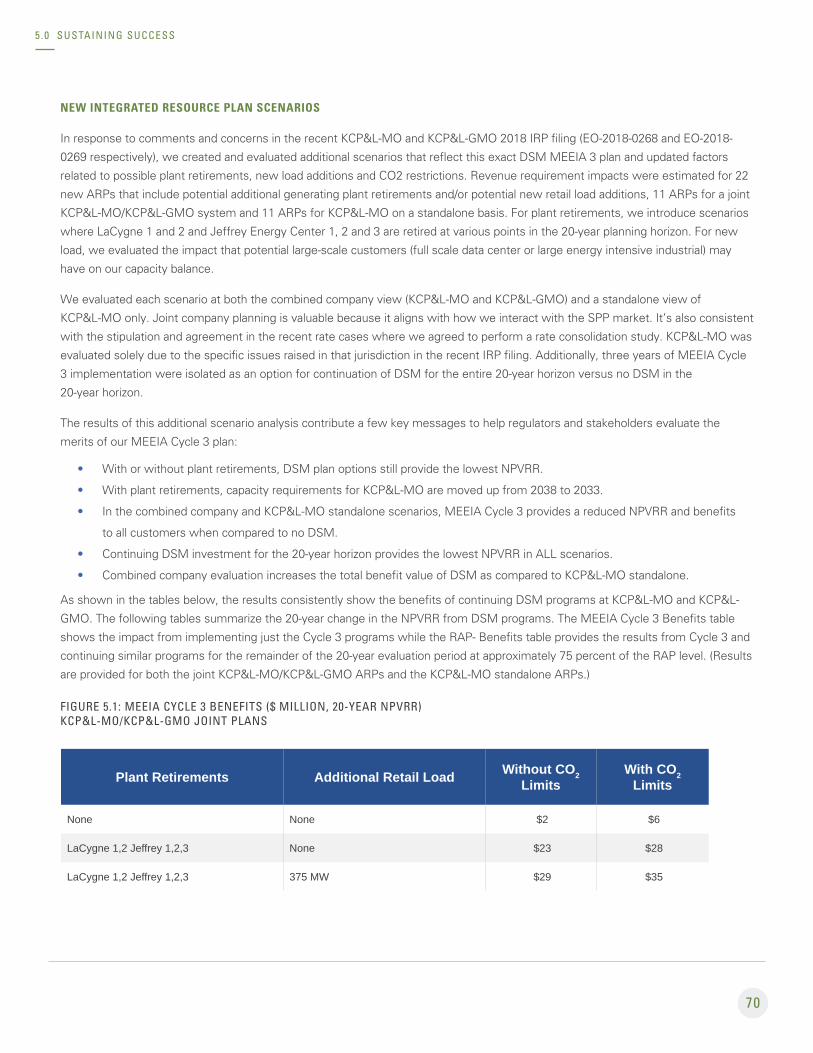
70
NEW INTEGRATED RESOURCE PLAN SCENARIOS
In response to comments and concerns in the recent KCP&L-MO and KCP&L-GMO 2018 IRP filing (EO-2018-0268 and EO-2018-
0269 respectively), we created and evaluated additional scenarios that reflect this exact DSM MEEIA 3 plan and updated factors
related to possible plant retirements, new load additions and CO2 restrictions. Revenue requirement impacts were estimated for 22
new ARPs that include potential additional generating plant retirements and/or potential new retail load additions, 11 ARPs for a joint
KCP&L-MO/KCP&L-GMO system and 11 ARPs for KCP&L-MO on a standalone basis. For plant retirements, we introduce scenarios
where LaCygne 1 and 2 and Jeffrey Energy Center 1, 2 and 3 are retired at various points in the 20-year planning horizon. For new
load, we evaluated the impact that potential large-scale customers (full scale data center or large energy intensive industrial) may
have on our capacity balance.
We evaluated each scenario at both the combined company view (KCP&L-MO and KCP&L-GMO) and a standalone view of
KCP&L-MO only. Joint company planning is valuable because it aligns with how we interact with the SPP market. It’s also consistent
with the stipulation and agreement in the recent rate cases where we agreed to perform a rate consolidation study. KCP&L-MO was
evaluated solely due to the specific issues raised in that jurisdiction in the recent IRP filing. Additionally, three years of MEEIA Cycle
3 implementation were isolated as an option for continuation of DSM for the entire 20-year horizon versus no DSM in the
20-year horizon.
The results of this additional scenario analysis contribute a few key messages to help regulators and stakeholders evaluate the
merits of our MEEIA Cycle 3 plan:
• With or without plant retirements, DSM plan options still provide the lowest NPVRR.
• With plant retirements, capacity requirements for KCP&L-MO are moved up from 2038 to 2033.
• In the combined company and KCP&L-MO standalone scenarios, MEEIA Cycle 3 provides a reduced NPVRR and benefits
to all customers when compared to no DSM.
• Continuing DSM investment for the 20-year horizon provides the lowest NPVRR in ALL scenarios.
• Combined company evaluation increases the total benefit value of DSM as compared to KCP&L-MO standalone.
As shown in the tables below, the results consistently show the benefits of continuing DSM programs at KCP&L-MO and KCP&L-
GMO. The following tables summarize the 20-year change in the NPVRR from DSM programs. The MEEIA Cycle 3 Benefits table
shows the impact from implementing just the Cycle 3 programs while the RAP- Benefits table provides the results from Cycle 3 and
continuing similar programs for the remainder of the 20-year evaluation period at approximately 75 percent of the RAP level. (Results
are provided for both the joint KCP&L-MO/KCP&L-GMO ARPs and the KCP&L-MO standalone ARPs.)
FIGURE 5.1: MEEIA CYCLE 3 BENEFITS ($ MILLION, 20-YEAR NPVRR) KCP&L-MO/KCP&L-GMO JOINT PLANS
Plant Retirements Additional Retail Load Without CO2 Limits
With CO2 Limits
None None $2 $6
LaCygne 1,2 Jeffrey 1,2,3 None $23 $28
LaCygne 1,2 Jeffrey 1,2,3 375 MW $29 $35
5 .0 SUSTAINING SUCCESS
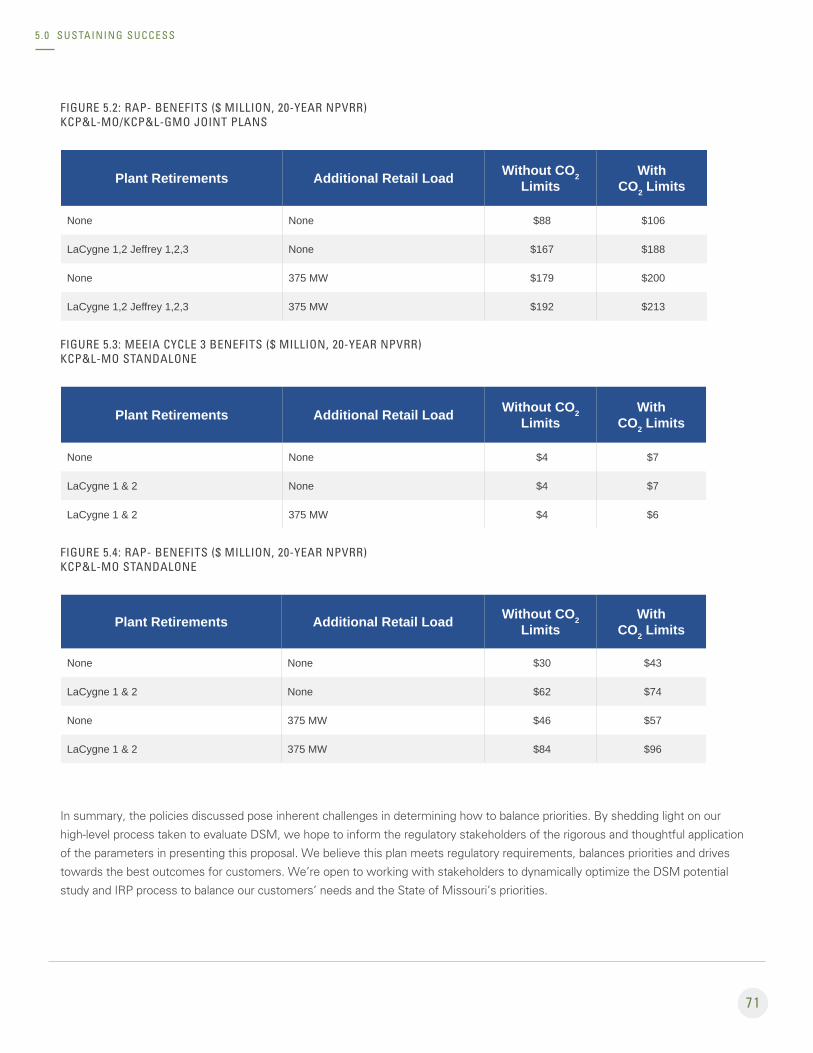
71
FIGURE 5.2: RAP- BENEFITS ($ MILLION, 20-YEAR NPVRR) KCP&L-MO/KCP&L-GMO JOINT PLANS
Plant Retirements Additional Retail Load Without CO2 Limits
With CO2 Limits
None None $88 $106
LaCygne 1,2 Jeffrey 1,2,3 None $167 $188
None 375 MW $179 $200
LaCygne 1,2 Jeffrey 1,2,3 375 MW $192 $213
FIGURE 5.3: MEEIA CYCLE 3 BENEFITS ($ MILLION, 20-YEAR NPVRR) KCP&L-MO STANDALONE
Plant Retirements Additional Retail Load Without CO2 Limits
With CO2 Limits
None None $4 $7
LaCygne 1 & 2 None $4 $7
LaCygne 1 & 2 375 MW $4 $6
FIGURE 5.4: RAP- BENEFITS ($ MILLION, 20-YEAR NPVRR) KCP&L-MO STANDALONE
Plant Retirements Additional Retail Load Without CO2 Limits
With CO2 Limits
None None $30 $43
LaCygne 1 & 2 None $62 $74
None 375 MW $46 $57
LaCygne 1 & 2 375 MW $84 $96
In summary, the policies discussed pose inherent challenges in determining how to balance priorities. By shedding light on our
high-level process taken to evaluate DSM, we hope to inform the regulatory stakeholders of the rigorous and thoughtful application
of the parameters in presenting this proposal. We believe this plan meets regulatory requirements, balances priorities and drives
towards the best outcomes for customers. We’re open to working with stakeholders to dynamically optimize the DSM potential
study and IRP process to balance our customers’ needs and the State of Missouri’s priorities.
5 .0 SUSTAINING SUCCESS
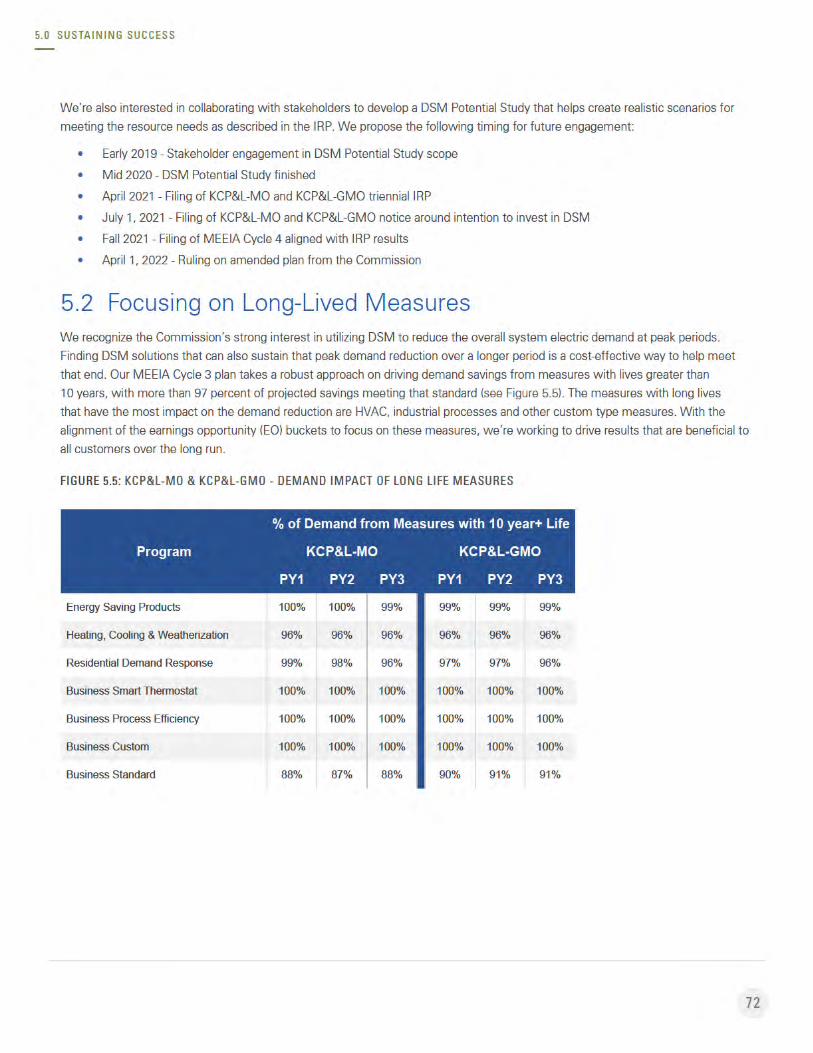
73
5.3 Flexibility in Programs During CycleWhile the MEEIA Cycle 3 programs are three years long, with the exception of IEMF, they still benefit from a measure of flexibility to
adapt to market changes. We propose the following avenues to provide the best flexibility for future success:
• Continuing the 11-step change process outlined in the program in Appendix 8.1.
• Continuing the MEEIA rules associated with modifying or discontinuing a program
» MEEIA 4 CSR 240-20.094 (5) & (6) shall apply if modifications are required during any period over the life of the program.
• Proposing a new and streamlined approval process for implementing pilot programs
» The process reflects a hybrid between the MEEIA rule for pilot programs and the 11-step process, with the 11 steps plus
an approval from the Commission for a tariff sheet.
» We’ll screen, research, evaluate and prioritize ideas for potential inclusion in the Research and Pilot program.
» Pilot programs will be evaluated on a variety of parameters, including: energy savings potential, cost of savings, customer
interest, market dynamics, development feasibility, ability to be brought to market and longevity of the offering.
» We’ll report on analysis and next steps for concepts at quarterly DSM Advisory Group meetings.
» Upon selection of a concept, we’ll develop parameters for a pilot program and create a program description outlining the
offering, objective, target segment(s) and need that the offering serves along with anticipated budget, goal(s)
and participants.
» We’ll offer to hold a meeting with interested stakeholders to discuss any new pilots that at least 30 days prior to deployment.
» Pilot programs serving 500 participants or less, or that have a program budget of $500,000 or less, are eligible for this process.
5.4 Ongoing Stakeholder EngagementTo keep communication open during the MEEIA cycle, we propose a simplified reporting process to keep stakeholders informed of
progress and structure meetings around clear objectives.
• The stakeholder group will provide program guidance and meet three times a year.
» During the program year wrap-up, they’ll review the annual report detailing results from the previous year, including
actual savings achieved, dollars spent and cost benefits.
» During the mid-program year status meeting, they’ll review year-to-date results and any mid-year adjustments to the
operating and marketing plans. They’ll also develop any new technologies and programs to consider for the next
operating year plan.
» During the next program year operating plan meeting, they’ll review proposed operating plan adjustments for the
coming year including technology changes, incentive changes, target marketing, administrative adjustments and
program adjustments.
• An Annual Report will provide the commission with information about achievements, energy and demand savings, actual
programs costs and evaluation reports.
The introduction of the Missouri Energy Efficiency Advisory Collaborative (MEEAC) in the 2017 round of MEEIA rules updates
will also enhance the ongoing communication among stakeholders around the needs of interested parties and changes in the
marketplace. To date, we’ve participated in multiple working groups to facilitate discussions on EM&V, low income programs
and DSM financing tools.
5 .0 SUSTAINING SUCCESS
74
5.5 EM&V PlanAn important component of a successful DSM program portfolio is the continual review of the process, procedures, satisfaction
and effectiveness of the efforts and investments. We propose investing five percent of the total budget to EM&V activities, totaling
nearly $4.8 million for the combined jurisdictions over three years. We’ll follow very similar protocols as previous cycles, with a few
enhancements:
• Streamlining the EM&V draft periods to help control costs for reviews
» Consolidate review periods from three to two
» Compress the time schedule from period end date to first draft from 120 to 30 days
• Clarifying the finalization process to final net savings for every program year for EO calculation
» Results from EM&V will be final every year including net to gross and realization rate for each program
• Delivering more real-time results to increase awareness of progress
» Fast feedback surveys to give quicker customer insight
» Quicker impact evaluations based on automated meter interface interval usage data
Appendix 8.4 offers additional details of the proposed EM&V plan and timing.
5.6 Opt-Out MitigationOpt-out mitigation is a vital factor in ensuring DSIM rate stability, portfolio goal attainment and overall customer satisfaction
with MEEIA programs. It’s imperative to develop a strong value proposition for large single site industrial and multi-site large
commercial customers that links energy solutions with business solutions through a seamless, transparent and cost-effective
customer experience.
The op-out percentages as of 2017 are 18.3 percent for KCP&L-MO and 26.6 percent for KCP&L-GMO, for customers that meet
eligibility criteria for opting out. Most opt-outs fall under the 4 CSR 240.094(7)(A)1. provision — industrial single site customers with
an annual load of 5 MW or greater. Based on annual kWh consumption, these customers represent the largest potential individual
contributors to MEEIA. However, these customers also carry the largest financial burden as DSIM rates are charged based on
monthly kWh consumption. Providing this customer segment with a more aligned rate mechanism — reflecting participation within
their rate class and an incentive mechanism that balances costs and benefits — is integral in ensuring they receive near-term and
long-term benefits from MEEIA.
We’ve been proactive in using large customer surveying and other outreach efforts to better understand participation barriers and
potential solutions. Common barriers identified include DSIM costs, rebate levels, ease of program use, and supporting technical
and financial resources. We’ve worked to better engage customers through prior programs such as Strategic Energy Management.
We’ve also introduced incentive and delivery modifications in parallel with a more proactive costs management strategy to lower
DSIM costs. While we’ve seen continued interest from large customers wanting to opt-out evidenced by an uptick in requests in the
2018 opt-out period, we expect to keep working with these customers to find the best solution to help drive efficiency savings in
their buildings and facilities.
5 .0 SUSTAINING SUCCESS
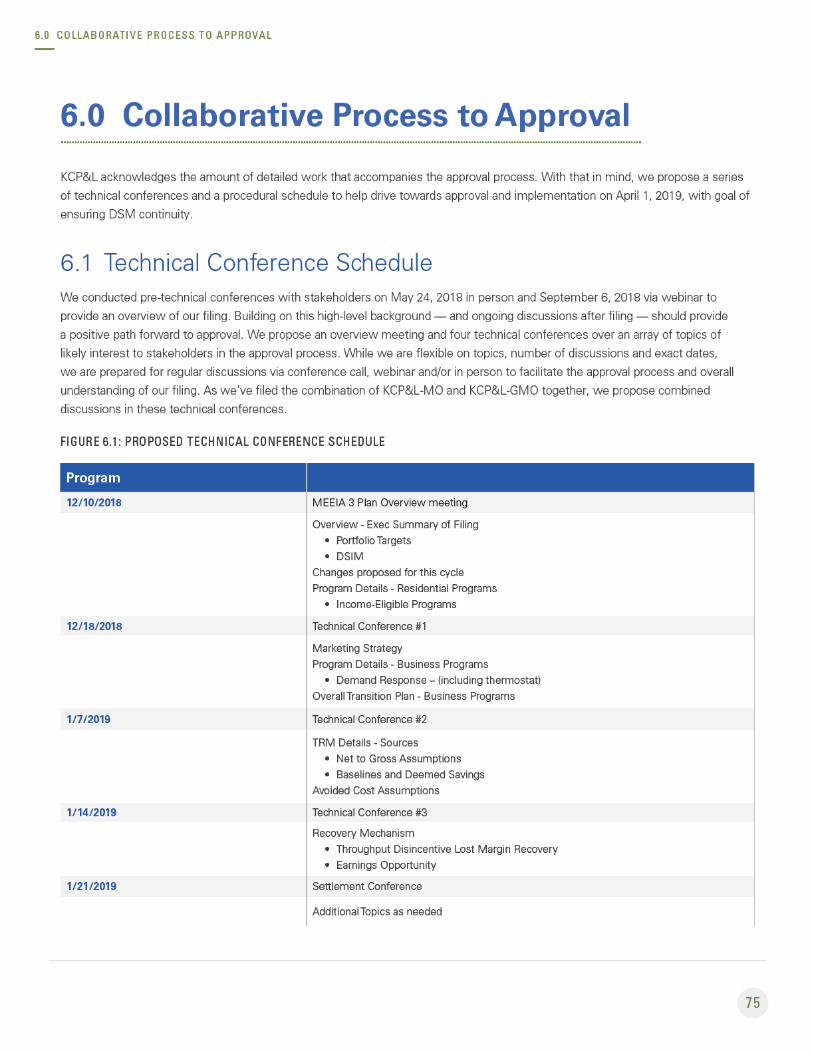
76
6.2 Stakeholder Access to InformationWe will provide work papers associated with the proposed MEEIA 3 filing in supplementary attachments to provide additional detail.
Per MEEIA rules, these are native files with links intact.
Appendices include:
• 8.1 Program Tariff Sheets
• 8.2 Detailed Program Descriptions
• 8.3 Technical Resource Manual
• 8.4 Detailed EM&V Plan
• 8.5 2017 DSM Potential Study conducted by Applied Energy Group (AEG)
• 8.6 Measure Incentive Ranges
• 8.7 Earnings Opportunity Matrix
• 8.8 Customer Research
• 8.9 Financing Research
• 8.10 DSIM Tariff Sheets
• 8.11 Additional Integrated Resource Plan Results
• 8.12 Witness Details
Work papers will include:
• 2016 KCP&L-MO and KCP&L-GMO Final Evaluation, Measurement & Verification Report
• DSMore Batch Tool and Template File
• Portfolio Analysis Tool Spreadsheets
6.3 Key Factors and Company Positions for ApprovalBUSINESS RISK IMPACT
The utility incentive related to the DSIM is intended to put the utility’s earnings ability on a level playing field with generation supply
resources. It’s not intended as a windfall profit to the utility, but a stabilizing factor to allow for growth in DSM applications that will
benefit all stakeholders.
If the current DSIM recovery mechanism is modified to preclude current recognition of TD revenues by making it subject to
retroactive determination, or if the earnings opportunity does not put the utility’s earnings ability on a level playing field with
generation supply resources, this would exacerbate regulatory lag and discourage potential investors — leading to a discount on our
stock price and an increase in the cost of equity capital.
In addition, rating agencies consider many quantitative and qualitative factors when reviewing a company’s credit ratings. If the
DSIM recovery mechanism does not balance the risk of both customers and KCP&L, the agencies may perceive this as a regulatory
environment that is less than supportive to the utility. In Moody’s Investors Service rating methodology, as much as half of the
weighting is based on the qualitative analysis of the company’s regulatory framework and ability to recover costs and earn returns.
Their view of relative credit supportiveness considers the prevalence of automatic cost recovery provisions and reduced regulatory
lag. Standard & Poor’s rating methodology also relies on qualitative analysis of the regulatory environment that includes an
assessment of the company’s ability to recover all operating and capital cost in full and the timeliness of cost recovery to avoid cash
flow volatility.
6 .0 COLLABORATIVE PROCESS TO APPROVAL
77
UTILITY INCENTIVES ALIGNMENT & POLICY CONTEXT
The Policy Goal of MEEIA is as follows:
• To encourage more efficient energy use and cost-effective demand-side programs with a goal of achieving all cost-
effective
demand-side savings;
• To value demand-side investments equal to traditional investments in supply and delivery infrastructure and allow recovery
of all reasonable and prudent costs of delivering cost-effective demand-side programs and, in support of those goals, the
Commission shall:
» Provide timely cost recovery for utilities;
» Ensure that utility financial incentives are aligned with helping customers use energy more efficiently and in a manner
that sustains or enhances utility customers’ incentives to use energy more efficiently; and
» Provide timely earnings opportunities associated with cost-effective, measurable and verifiable efficiency savings.
Our requested DSIM includes a request of recovery of estimated program costs, a portion of TD and any earned earnings
opportunity based on EM&V results. The recovery of TD proposed will help mitigate the negative financial impacts currently
present for utility investment in demand response (DR) and energy efficiency (EE) programs. The TD represents the financial
disincentive posed on the utility for each kWh saved as a result of successful implementation of EE and helps ensure that we are
kept whole and not financially harmed or dis-incentivized from promoting EE.
However, absent a DSIM that addresses and mitigates the financial TD that exists, we will be unable to continue the current
level of DR and EE programs or increase the level of funding for these programs. In addition, if the TD is subject to retrospective
recalculation, we will not be able to currently recognize the TD revenues — resulting in a negative impact on our earnings until
the final amount of TD is determined. As a result, it is essential that the TD be based on deemed savings and benefits in order to
objectively determine in the period in which it is calculated.
In this filing, we have demonstrated these programs meet the cost-effectiveness test and have been shown to be less costly to
customers than the alternative of no programs, and unmitigated peak demand and energy usage. The untapped potential for our
demand-side programs exists because it’s never easy to get customers to pay more today to save an even greater amount later.
This is true even under the best economic conditions and has always been the major impediment to sustainable, aggressive, cost-
effective, DR and EE program implementation.
6.4 Achievable Time Schedule We propose an achievable timeline to allow for continuation of programs, maintaining customer momentum and allowing for
ongoing synchronization of programs between our Missouri jurisdictions. The timeline is somewhat compressed from the MEEIA
rule of 120 days from filing to Commission order. As mentioned above though, KCP&L has been meeting with stakeholders to
preview the MEEIA plan multiple times over the last 3-6 months to gain feedback including specific additional discussions and
work in the last month to address the IRP-MEEIA interaction.
6 .0 COLLABORATIVE PROCESS TO APPROVAL
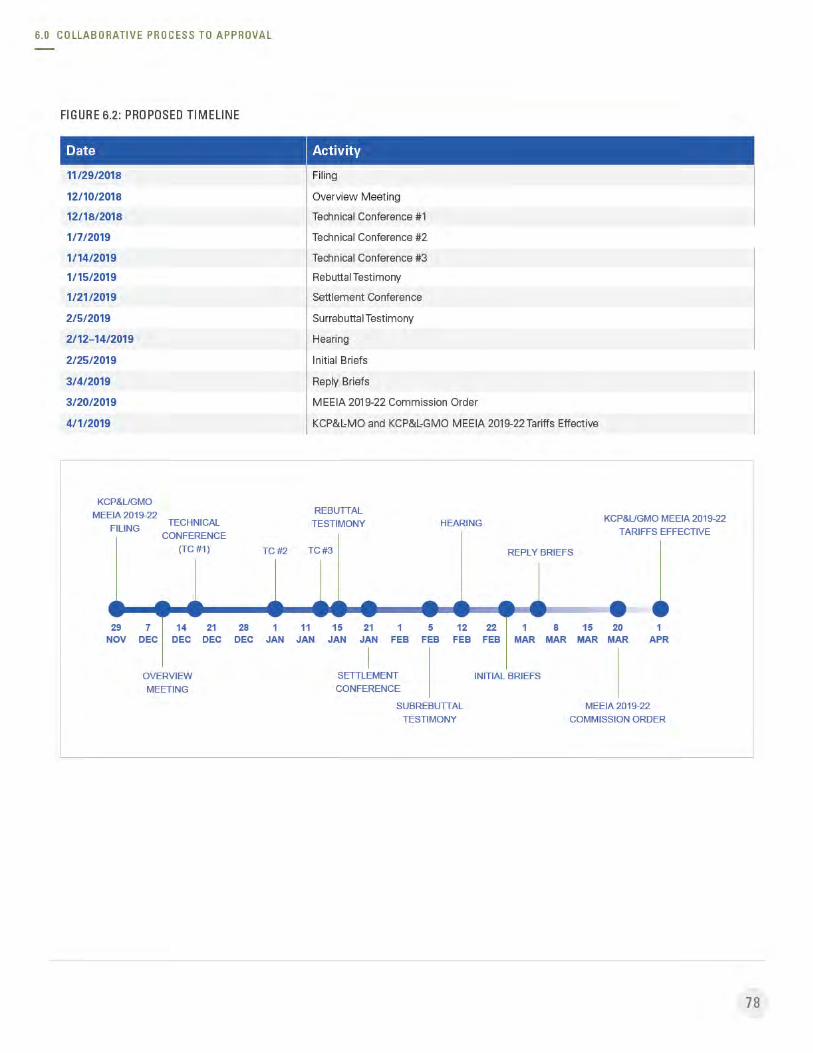
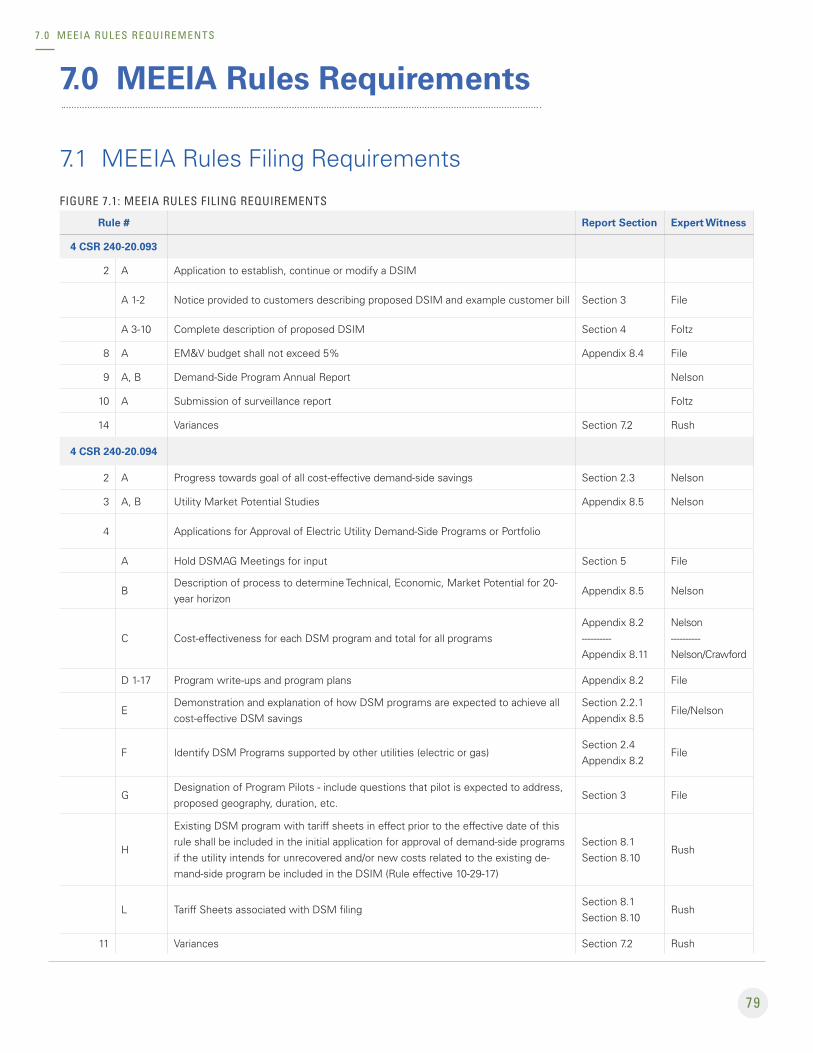
79
7.0 MEEIA Rules Requirements
7.1 MEEIA Rules Filing Requirements
FIGURE 7.1: MEEIA RULES FILING REQUIREMENTS
Rule # Report Section Expert Witness
4 CSR 240-20.093
2 A Application to establish, continue or modify a DSIM
A 1-2 Notice provided to customers describing proposed DSIM and example customer bill Section 3 File
A 3-10 Complete description of proposed DSIM Section 4 Foltz
8 A EM&V budget shall not exceed 5% Appendix 8.4 File
9 A, B Demand-Side Program Annual Report Nelson
10 A Submission of surveillance report Foltz
14 Variances Section 7.2 Rush
4 CSR 240-20.094
2 A Progress towards goal of all cost-effective demand-side savings Section 2.3 Nelson
3 A, B Utility Market Potential Studies Appendix 8.5 Nelson
4 Applications for Approval of Electric Utility Demand-Side Programs or Portfolio
A Hold DSMAG Meetings for input Section 5 File
BDescription of process to determine Technical, Economic, Market Potential for 20-year horizon
Appendix 8.5 Nelson
C Cost-effectiveness for each DSM program and total for all programsAppendix 8.2----------Appendix 8.11
Nelson---------- Nelson/Crawford
D 1-17 Program write-ups and program plans Appendix 8.2 File
EDemonstration and explanation of how DSM programs are expected to achieve all cost-effective DSM savings
Section 2.2.1Appendix 8.5
File/Nelson
F Identify DSM Programs supported by other utilities (electric or gas)Section 2.4 Appendix 8.2
File
GDesignation of Program Pilots - include questions that pilot is expected to address, proposed geography, duration, etc.
Section 3 File
H
Existing DSM program with tariff sheets in effect prior to the effective date of this rule shall be included in the initial application for approval of demand-side programs if the utility intends for unrecovered and/or new costs related to the existing de-mand-side program be included in the DSIM (Rule effective 10-29-17)
Section 8.1Section 8.10
Rush
L Tariff Sheets associated with DSM filingSection 8.1Section 8.10
Rush
11 Variances Section 7.2 Rush
7 .0 MEEIA RULES REQUIREMENTS
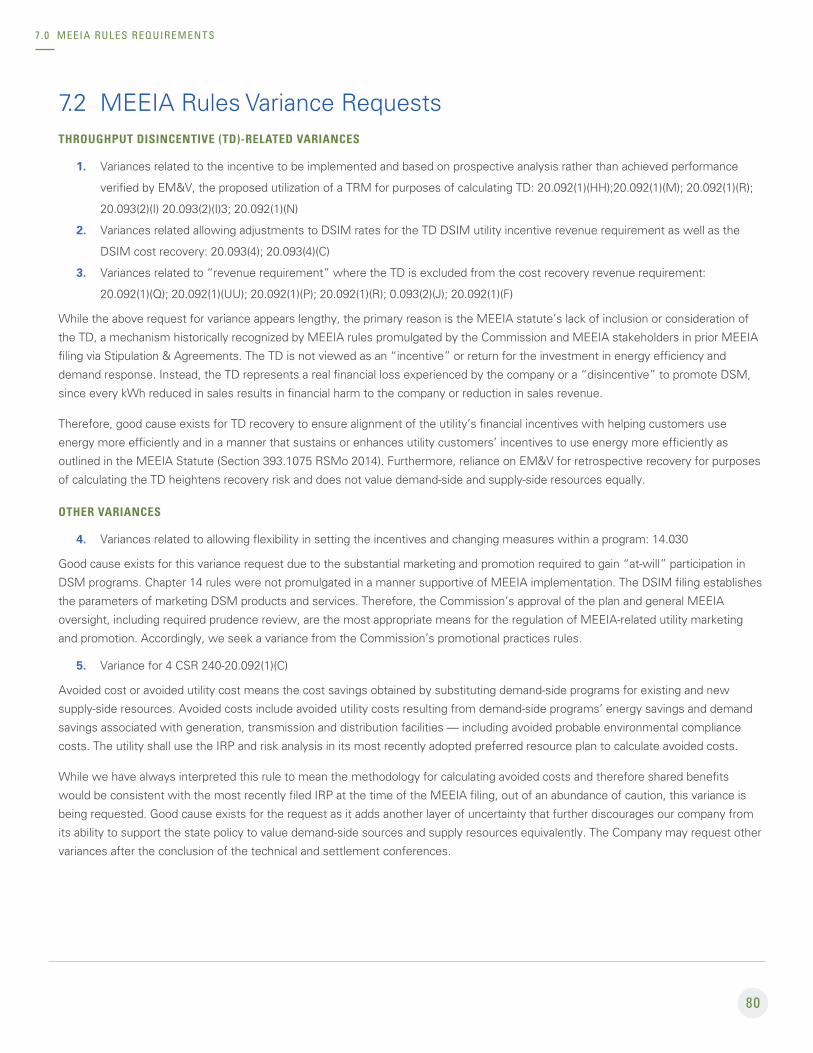
80
7.2 MEEIA Rules Variance RequestsTHROUGHPUT DISINCENTIVE (TD)-RELATED VARIANCES
1. Variances related to the incentive to be implemented and based on prospective analysis rather than achieved performance
verified by EM&V, the proposed utilization of a TRM for purposes of calculating TD: 20.092(1)(HH);20.092(1)(M); 20.092(1)(R);
20.093(2)(I) 20.093(2)(I)3; 20.092(1)(N)
2. Variances related allowing adjustments to DSIM rates for the TD DSIM utility incentive revenue requirement as well as the
DSIM cost recovery: 20.093(4); 20.093(4)(C)
3. Variances related to “revenue requirement” where the TD is excluded from the cost recovery revenue requirement:
20.092(1)(Q); 20.092(1)(UU); 20.092(1)(P); 20.092(1)(R); 0.093(2)(J); 20.092(1)(F)
While the above request for variance appears lengthy, the primary reason is the MEEIA statute’s lack of inclusion or consideration of
the TD, a mechanism historically recognized by MEEIA rules promulgated by the Commission and MEEIA stakeholders in prior MEEIA
filing via Stipulation & Agreements. The TD is not viewed as an “incentive” or return for the investment in energy efficiency and
demand response. Instead, the TD represents a real financial loss experienced by the company or a “disincentive” to promote DSM,
since every kWh reduced in sales results in financial harm to the company or reduction in sales revenue.
Therefore, good cause exists for TD recovery to ensure alignment of the utility’s financial incentives with helping customers use
energy more efficiently and in a manner that sustains or enhances utility customers’ incentives to use energy more efficiently as
outlined in the MEEIA Statute (Section 393.1075 RSMo 2014). Furthermore, reliance on EM&V for retrospective recovery for purposes
of calculating the TD heightens recovery risk and does not value demand-side and supply-side resources equally.
OTHER VARIANCES
4. Variances related to allowing flexibility in setting the incentives and changing measures within a program: 14.030
Good cause exists for this variance request due to the substantial marketing and promotion required to gain “at-will” participation in
DSM programs. Chapter 14 rules were not promulgated in a manner supportive of MEEIA implementation. The DSIM filing establishes
the parameters of marketing DSM products and services. Therefore, the Commission’s approval of the plan and general MEEIA
oversight, including required prudence review, are the most appropriate means for the regulation of MEEIA-related utility marketing
and promotion. Accordingly, we seek a variance from the Commission’s promotional practices rules.
5. Variance for 4 CSR 240-20.092(1)(C)
Avoided cost or avoided utility cost means the cost savings obtained by substituting demand-side programs for existing and new
supply-side resources. Avoided costs include avoided utility costs resulting from demand-side programs’ energy savings and demand
savings associated with generation, transmission and distribution facilities — including avoided probable environmental compliance
costs. The utility shall use the IRP and risk analysis in its most recently adopted preferred resource plan to calculate avoided costs.
While we have always interpreted this rule to mean the methodology for calculating avoided costs and therefore shared benefits
would be consistent with the most recently filed IRP at the time of the MEEIA filing, out of an abundance of caution, this variance is
being requested. Good cause exists for the request as it adds another layer of uncertainty that further discourages our company from
its ability to support the state policy to value demand-side sources and supply resources equivalently. The Company may request other
variances after the conclusion of the technical and settlement conferences.
7 .0 MEEIA RULES REQUIREMENTS