Embed Size (px)
Citation preview
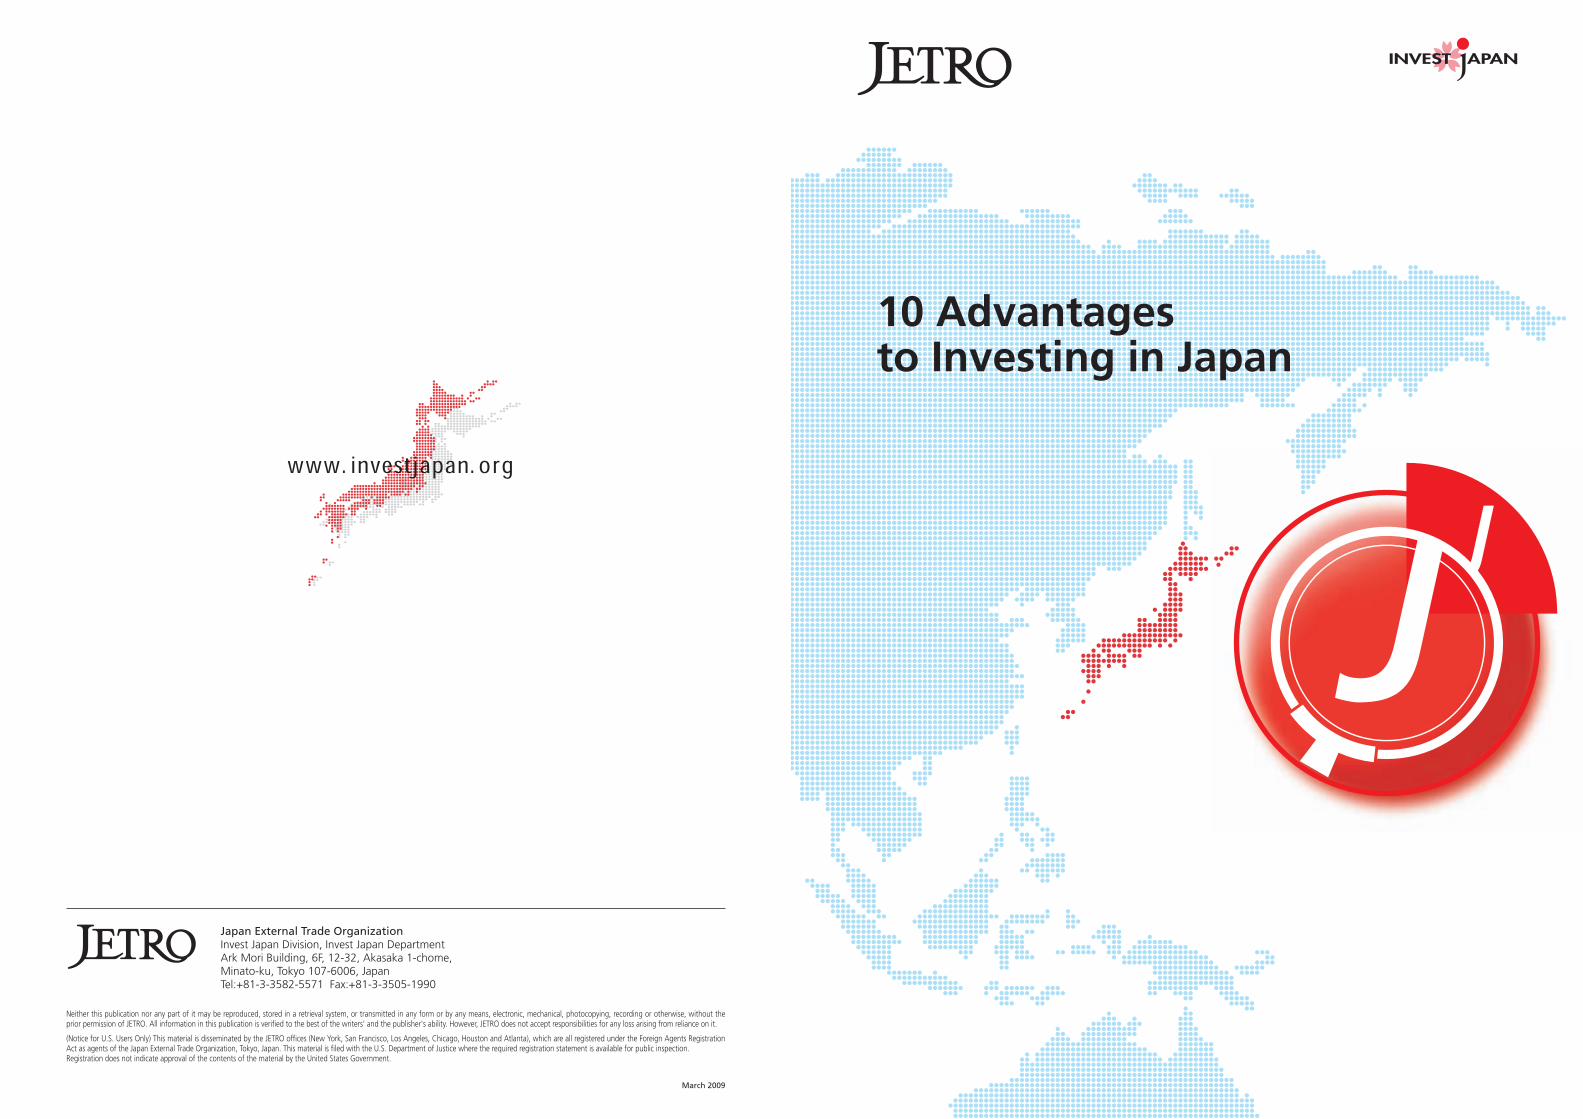
Japan External Trade OrganizationInvest Japan Division, Invest Japan DepartmentArk Mori Building, 6F, 12-32, Akasaka 1-chome,Minato-ku, Tokyo 107-6006, JapanTel:+81-3-3582-5571 Fax:+81-3-3505-1990
March 2009
Neither this publication nor any part of it may be reproduced, stored in a retrieval system, or transmitted in any form or by any means, electronic, mechanical, photocopying, recording or otherwise, without the prior permission of JETRO. All information in this publication is verified to the best of the writers' and the publisher's ability. However, JETRO does not accept responsibilities for any loss arising from reliance on it.
(Notice for U.S. Users Only) This material is disseminated by the JETRO offices (New York, San Francisco, Los Angeles, Chicago, Houston and Atlanta), which are all registered under the Foreign Agents Registration Act as agents of the Japan External Trade Organization, Tokyo, Japan. This material is filed with the U.S. Department of Justice where the required registration statement is available for public inspection.Registration does not indicate approval of the contents of the material by the United States Government.
10 Advantagesto Investing in Japan

Japan is the center of new trends and
creativity and is a coveted testing ground for
new products.
A survey of foreign-affiliated firms in Japan
conducted by JETRO in early 2008 indicated that
one in five of these companies sees Japan as a
center for research and development and as a
base for business activities in Asia. Today,
increasing numbers of companies around the
world are partnering with Japanese companies to
develop products and services, create innovative
technologies, and conduct R&D projects.
Explanatory Notes
1. Figures (As follows, unless otherwise indicated.)(1) In text, figures and tables, “year” indicates the period
January-December, and “fiscal year” indicates the period April-March.
(2) Figures for “rate of growth” are year-on-year figures. (3) Because figures are rounded, there may be discrepancies in total.
2. Country and region classifications (As follows, unless otherwise indicated.)
(1) ASEAN 5: Indonesia, Thailand, Philippines, Malaysia, Vietnam(2) Hong Kong and Taiwan are treated as independent economies(3) NIEs: Hong Kong, Taiwan, Singapore, Korea(4) EU27: Austria, Belgium, Denmark, Germany, Greece, Finland, France,
Ireland, Italy, Luxembourg, Portugal, Spain, Sweden, Netherlands, UK, Cyprus, Czech Republic, Estonia, Hungary, Latvia, Lithuania, Malta, Poland, Slovakia, Slovenia, Romania, Bulgaria
(5) NAFTA (North American Free Trade Agreement): US, Canada, Mexico(6) BRICs: Brazil, Russia, India, China
4-5
6-7
8-11
12-13
14-15
16-17
18-19
20-21
22-23
24-25
26-27
Japan – A Market of Enormous Potential
Sophisticated Consumers with High Purchasing Power and Discerning Tastes
Promising Markets and Industries
Home of the World’s Top Companies
SMEs Possess Unique Technologies
Innovation Ushering in the Future
A Gateway to the Asian Market
Foreign Companies Expanding Business in Japan
Mature Investment Infrastructure
A Secure, Comfortable Living Environment
Contents
3
4
5
6
7
8
9
10
2
1
Critical node forglobal market success
JETRO Support and Services
4 5
GDP comparison of Japan’s regions with some countries (US$ billion)
Japan4,384
NAFTA 16,169
US13,844
Canada1,432
EU27 16,830
East Asia 6,038
BRICs 6,954
UK2,773
ASEAN51,079
NIEs1,708
China3,251
Russia1,290
India1,099
Brazil1,314
France2,560
Germany3,322
Spain1,439 Italy
2,105Others4,631
Mexico893
GDP comparison of Japan with other major economic regions (US$ billion, 2007)
Source: Prepared based on “World Economic Outlook Database” (April, 2008), IMF
Hokkaidoregion
Singapore
168 161
Tohokuregion
Austria
362 374
Kantoregion
Canada India
1,724
1,432
1,099
Chuburegion
Netherlands
681769
Kinkiregion
Netherlands
688769
Chugokuregion
Thailand
254 246
Shikokuregion
New Zealand
115 128
Kyushuregion
Switzerland
410 424
Note: 2005 data is used for Japan; 2007 data is used for all other countries. Exchange rates based on IMF period-average rates.Source: “World Economic Outlook Database” (April, 2008), IMF; “Prefectural
Economic Almanac” (February, 2008), Economic and Social Research Institute, Cabinet Office
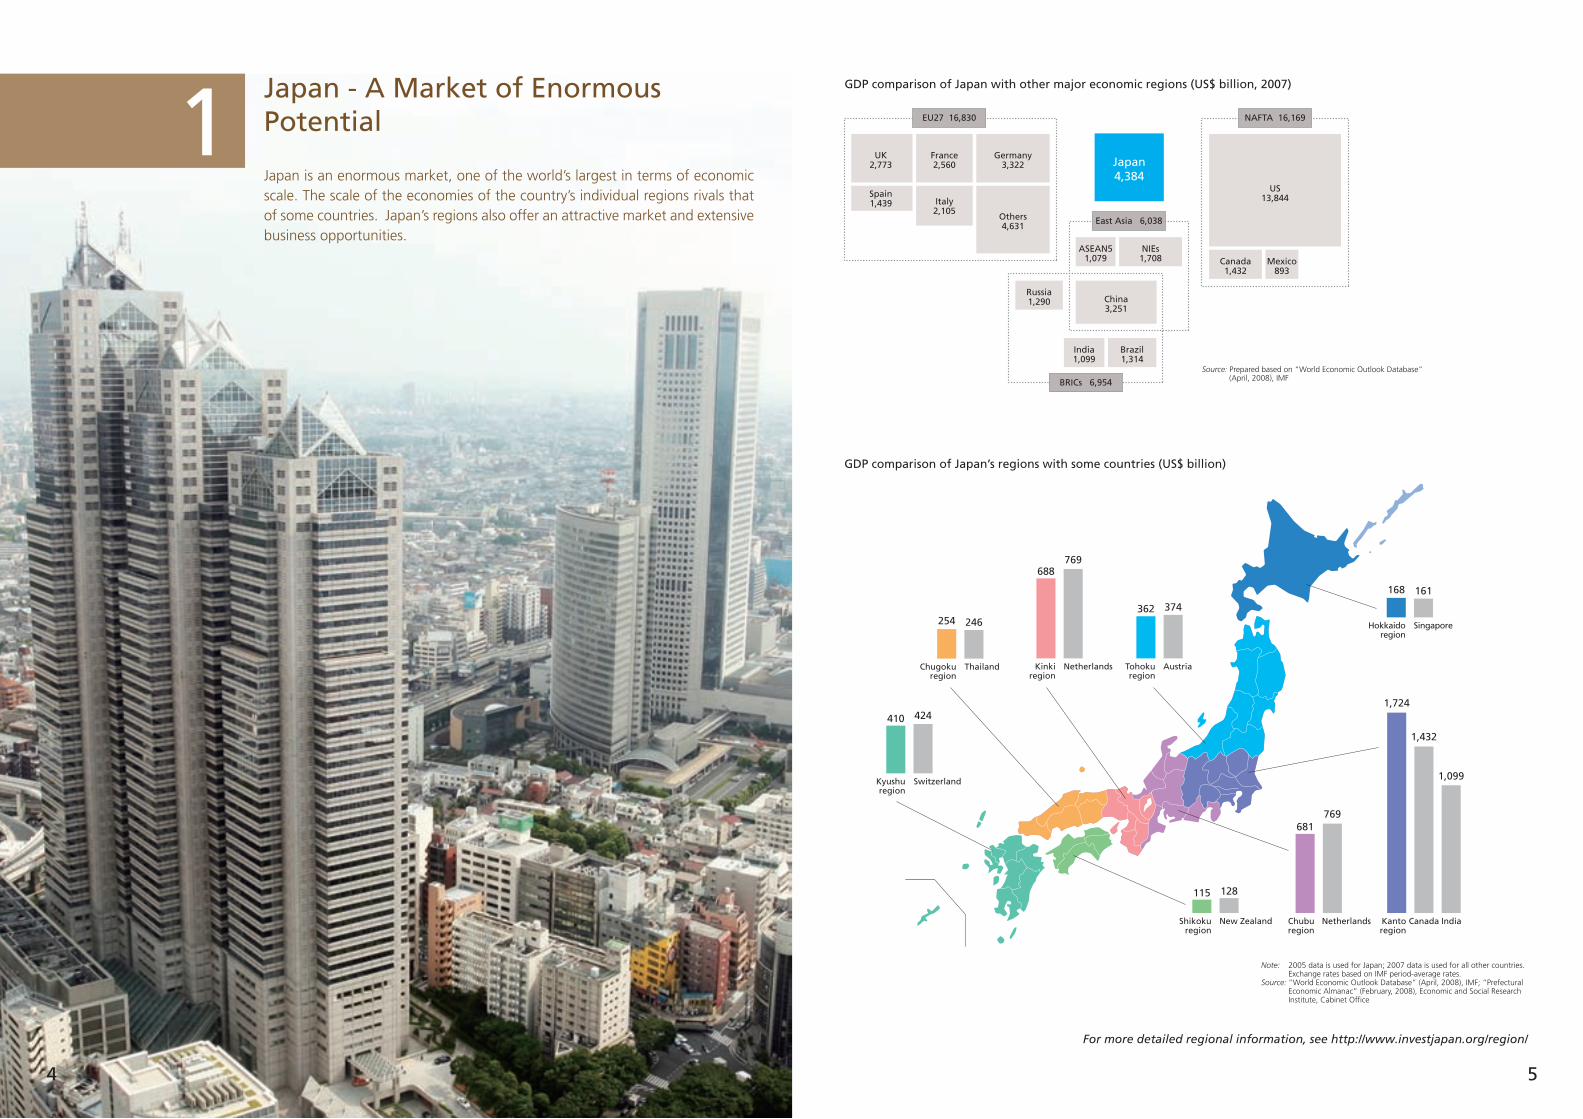
1Japan is an enormous market, one of the world’s largest in terms of economic scale. The scale of the economies of the country’s individual regions rivals that of some countries. Japan’s regions also offer an attractive market and extensive business opportunities.
Japan - A Market of Enormous Potential
For more detailed regional information, see http://www.investjapan.org/region/
6 7
Per capita household consumption expenditure
(US$)
0
10,000
20,000
30,000
US UK Japan France Germany Italy Canada
27,672
22,920
19,898 19,438 19,154
17,57216,521
Note: 2004 data used for the US, Germany and Canada; 2005 data used for all other countries.
Source: “World Statistics 2008,” Statistics Bureau, Ministry of Internal Affairs and Communications
Comparison of personal financial assets by country (As of end of 2007)
(trillion yen)
0
1,000
2,000
5,000
6,000
US Japan UK Germany France
5,136
1,544
919761
595
Conversion rates: $1=¥113.12, £1=¥227.90, €1=¥166.66.Source: Prepared by Dai-ichi Life Research Institute Inc., based on
Bank of Japan “Flow of Funds Accounts,” FRB “Flow of Funds Accounts,” ONS “National Statistics,” Deutsche Bundesbank “Germany Financial Flows,” Banque de France “National Financial Accounts”
“Japanese customers are very well educated, so they
understand the difference between a product that’s
high-performance and low-cost rather than the opposite.”
- Lars Petersson, President and CEO, IKEA Japan
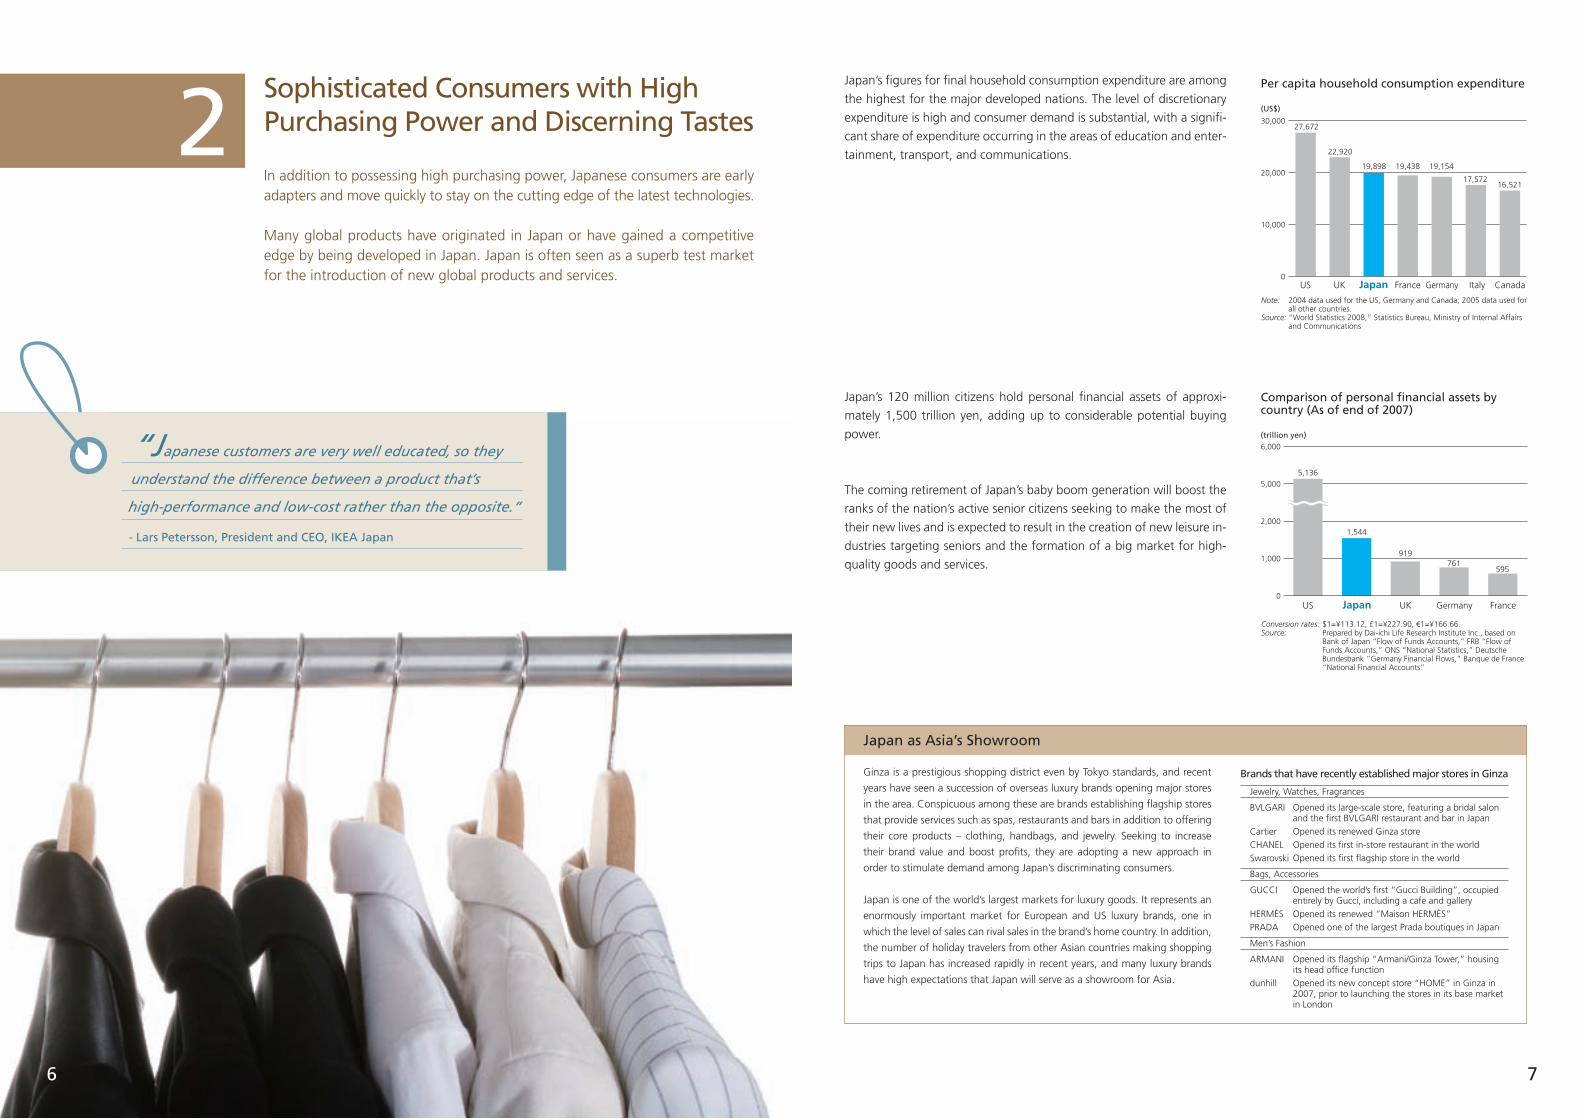
2In addition to possessing high purchasing power, Japanese consumers are early adapters and move quickly to stay on the cutting edge of the latest technologies.
Many global products have originated in Japan or have gained a competitive edge by being developed in Japan. Japan is often seen as a superb test market for the introduction of new global products and services.
Japan’s figures for final household consumption expenditure are among
the highest for the major developed nations. The level of discretionary
expenditure is high and consumer demand is substantial, with a signifi-
cant share of expenditure occurring in the areas of education and enter-
tainment, transport, and communications.
Japan’s 120 million citizens hold personal financial assets of approxi-
mately 1,500 trillion yen, adding up to considerable potential buying
power.
The coming retirement of Japan’s baby boom generation will boost the
ranks of the nation’s active senior citizens seeking to make the most of
their new lives and is expected to result in the creation of new leisure in-
dustries targeting seniors and the formation of a big market for high-
quality goods and services.
Ginza is a prestigious shopping district even by Tokyo standards, and recent
years have seen a succession of overseas luxury brands opening major stores
in the area. Conspicuous among these are brands establishing flagship stores
that provide services such as spas, restaurants and bars in addition to offering
their core products – clothing, handbags, and jewelry. Seeking to increase
their brand value and boost profits, they are adopting a new approach in
order to stimulate demand among Japan’s discriminating consumers.
Japan is one of the world’s largest markets for luxury goods. It represents an
enormously important market for European and US luxury brands, one in
which the level of sales can rival sales in the brand’s home country. In addition,
the number of holiday travelers from other Asian countries making shopping
trips to Japan has increased rapidly in recent years, and many luxury brands
have high expectations that Japan will serve as a showroom for Asia.
Sophisticated Consumers with High Purchasing Power and Discerning Tastes
Brands that have recently established major stores in Ginza
Japan as Asia’s Showroom
Jewelry, Watches, Fragrances
BVLGARI
Cartier
CHANEL
Swarovski
Bags, Accessories
GUCCI
HERMÈS
PRADA
Men’s Fashion
ARMANI
dunhill
Opened its large-scale store, featuring a bridal salon and the first BVLGARI restaurant and bar in Japan
Opened its renewed Ginza store
Opened its first in-store restaurant in the world
Opened its first flagship store in the world
Opened the world’s first “Gucci Building”, occupied entirely by Gucci, including a cafe and gallery
Opened its renewed “Maison HERMÈS”
Opened one of the largest Prada boutiques in Japan
Opened its flagship “Armani/Ginza Tower,” housing its head office function
Opened its new concept store “HOME” in Ginza in 2007, prior to launching the stores in its base market in London
8 9
High rate of growth in ICT industry (change in real GDP)
(trillion yen)
0
20
40
60
80
2000 2002 2004 2006
46.4
52.9
60.5
69.7
Source: “White Paper Information and Communications in Japan 2008,” Ministry of Internal Affairs and Communications
1,256.2581.6
6,225.5
575.2
222.0
369.2
13.1
Projected market scale of main ICT fields
FY2008
1,472.9922.8
11,715.3
841.3
456.2
548.7
382.6
FY2013(billion yen)
3.29.7
13.5
7.9
15.5
8.2
96.4
CAGR(%)*2Field
Note: *1: The forecast for Internet advertising is based on calendar years, rather than on fiscal years.
*2: CAGR (Compounded Annual Growth Rate) refers to the average annual growth rate during the period between fiscal 2008 and fiscal 2013.
Source: “Japan’s Major IT Markets: Scale and Trends through 2013” (December, 2008), Nomura Research Institute, Ltd.
Broadband lines Of the above, only optical fiber lines
BtoC EC
Internet advertising*1
Online billing/payments
Information security
Wireless broadband
Projected change of IT outsourcing services market
(100 million yen)
Source: “IT Outsourcing Market 2008” (April, 2008), MIC Research Institute Ltd.
0
10,000
20,000
30,000
40,000
2006
26,731
2008
29,5121,620
6,745
4,130
12,467
4,550
2010
32,6231,993
6,650
4,470
14,305
5,205 5,850
16,340
4,800
6,570
2,400
2012 (FY)
35,960
1,236
6,938
3,800
10,813
3,944
Business process outsourcingProcessing serviceApplication outsourcingData center outsourcingNetwork and desktop services
3Japan’s industries are globally competitive, and, as can be seen in the automo-tive sector, the nation’s industrial structure is extremely broad-based, with a large number of smaller companies functioning to support the world heavy-weights. For foreign companies, Japan is not just an attractive sales market; in all of its sectors, Japan offers foreign companies extensive opportunities. The following is a brief introduction to four sectors which are seen to have signifi-cant potential for future growth, and which have attracted considerable inter-est from companies in Japan and overseas.
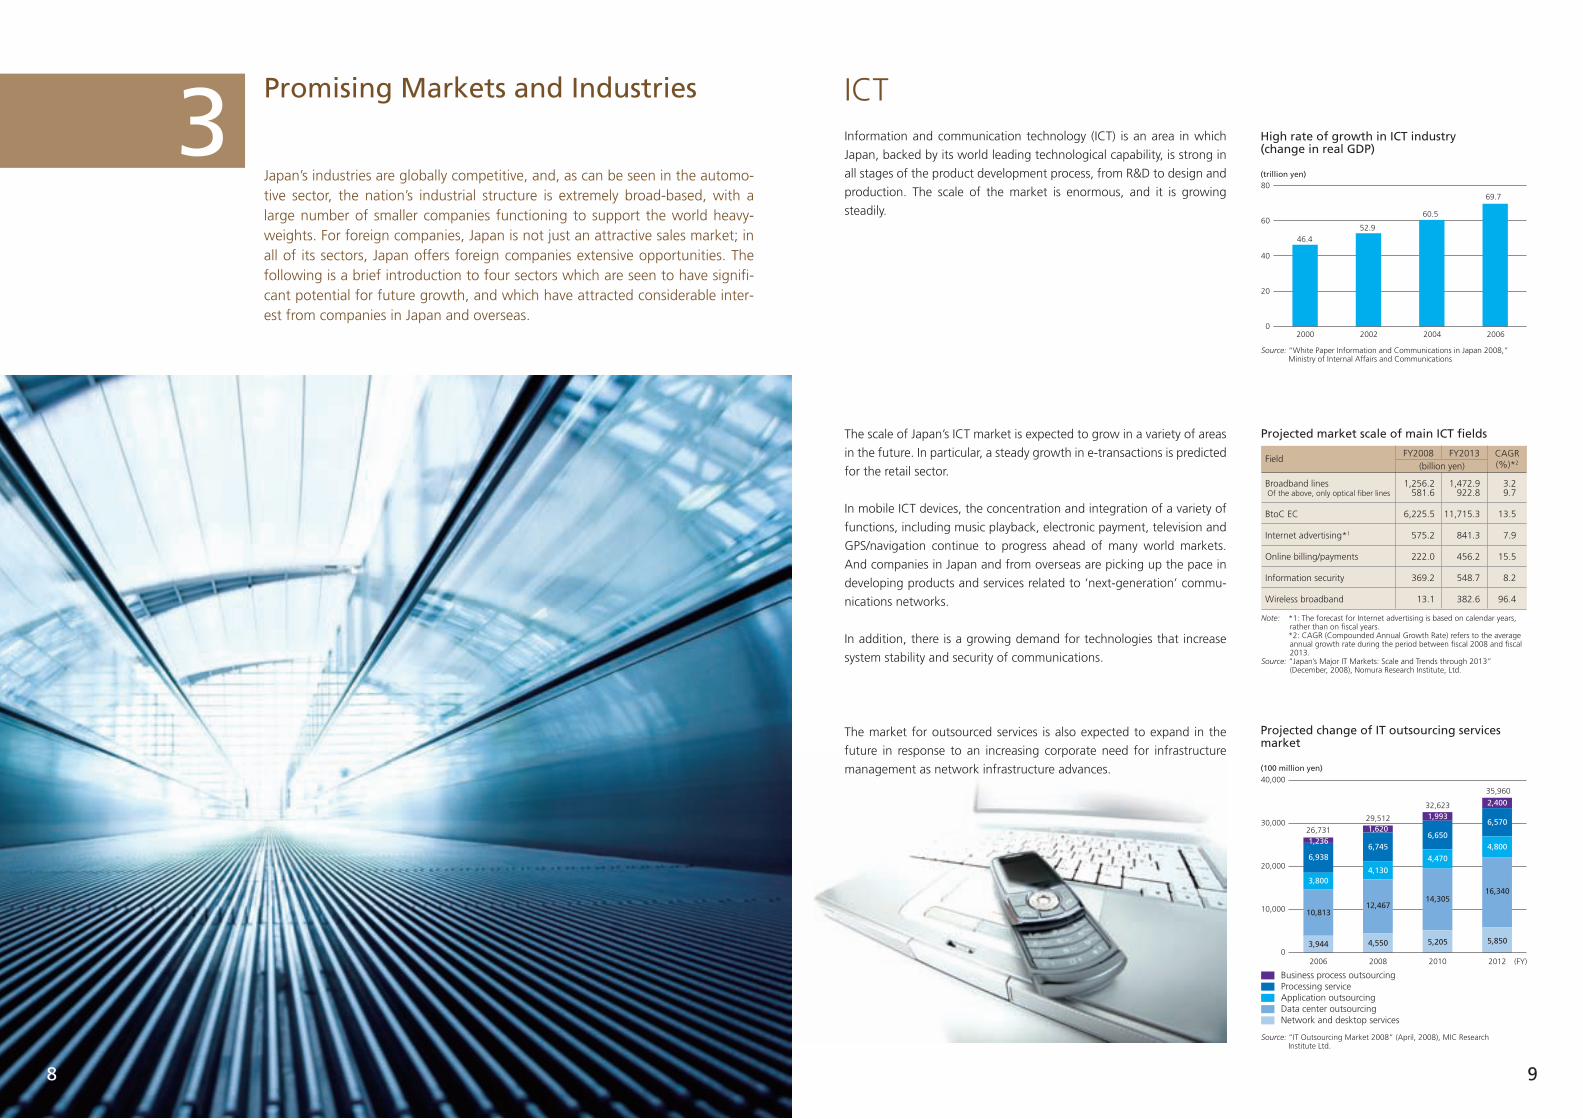
ICTInformation and communication technology (ICT) is an area in which
Japan, backed by its world leading technological capability, is strong in
all stages of the product development process, from R&D to design and
production. The scale of the market is enormous, and it is growing
steadily.
The scale of Japan’s ICT market is expected to grow in a variety of areas
in the future. In particular, a steady growth in e-transactions is predicted
for the retail sector.
In mobile ICT devices, the concentration and integration of a variety of
functions, including music playback, electronic payment, television and
GPS/navigation continue to progress ahead of many world markets.
And companies in Japan and from overseas are picking up the pace in
developing products and services related to ‘next-generation’ commu-
nications networks.
In addition, there is a growing demand for technologies that increase
system stability and security of communications.
The market for outsourced services is also expected to expand in the
future in response to an increasing corporate need for infrastructure
management as network infrastructure advances.
Promising Markets and Industries
10 11
Note: Actual figures used until 2005; figures for 2010 and after are projections. The rate of aging of the population and the percentage of the population 75
years and older are calculated as percentages of the total population.Source: “White Paper on the Aging of Society 2008,” Cabinet Office
1995 2000 2005 2010 2015 2020 2025 2030 2035
5.7
14.5
7.1
17.3
9.1
20.1
11.2
23.1
15.3
29.2
18.2
30.5
19.7
31.8
20.2 (%)
33.7 (%)
13.1
26.9
Domestic sales
Overseas sales
16%
84%
Japan’sautomotive parts
market:
20.4trillion yen/year
Top 5 automobile producing countries(2007)
(1,000 vehicles)
Number of low-emission vehicles in use in Japan
(1,000 vehicles)
Japan’s automotive parts market(FY2007)
Note: Figures for Germany include Belgian GM assembly. All figures are estimates. Source: Japan Automobile Manufacturers Association, Inc.
(JAMA), Organisation Internationale des Constructeurs d'Automobiles (OICA)
Notes: Certified high-fuel-efficiency and low-emission vehicles are excluded. For FY2006, fuel cell vehicles include vehicles using hydrogen as fuel.
Source: Japan Automobile Research Institute, The Japan Gas Association, Organization for the Promotion of Low-emission Vehicles
Source: Japan Auto Parts Industries Association (JAPIA)
0
5,000
10,000
15,000
Japan US China Germany France 2001 2002 2003 2004 2005 2006
91113
161
230
292
387
(FY)
11,59610,781
8,882
6,213
3,019
0
100
200
300
400
Changes in the scale of the environmental business market
Source: Ministry of the Environment
Environmental load reduction technology and products
Prevention of environmental pollution
Effective use of resources
769
1,1191,236 (Number of employees : 1,000 people)
30
47
2000 2010
58 (Market scale : trillion yen)
2020
Number of environment-related published patents
Source: Japan Patent Office
Japan
US
Europe2001 2003 2005 2007
0
2,000
4,000
6,000
8,000
10,000
12,000
8,661
490
1,885
9,588
2,0991,904
10,136
2,4331,937
9,424
2,6842,227
65-74 years(“Early-stage elderly”)
75 years and older(“Latter-stage elderly”)
Number of users of nursing care facilities and services
(1,000 people)
Source: “Survey of Nursing Care Facilities and Businesses” (May, 2006), Ministry of Health, Labor and Welfare
Elderly care welfare and nursing facilities
Daycare services
Visiting services0
1,000
2,000
3,000
2001 2002 2003 2004 2005
600
690
534
729
790
560
899
921
587
972
996
615
1,098
1,121
668
1,824
2,079
2,4072,583
2,887
Percentage of population 75 years and older
Rate of aging ofthe population
Changes in the elderly population and future projections
Electric vehicles
Natural-gas vehicles
Hybrid vehicles
Fuel-cell vehicles
Methanol vehicles
AUTOMOTIVE PARTSJapan’s automotive industry is a global leader in terms of number of
units manufactured and marketed, percentage of the world market,
technology implemented, etc. Japan is home to top global auto-
makers as well as a large number of smaller parts manufacturers,
who support the activities of these larger companies with their techno-
logical prowess.
In addition to representing an enormous market for their products,
Japan also offers foreign companies the chance to collaborate with
these Japanese companies, which can lead to further expansion of
their business overseas and provide considerable opportunities for in-
novation.
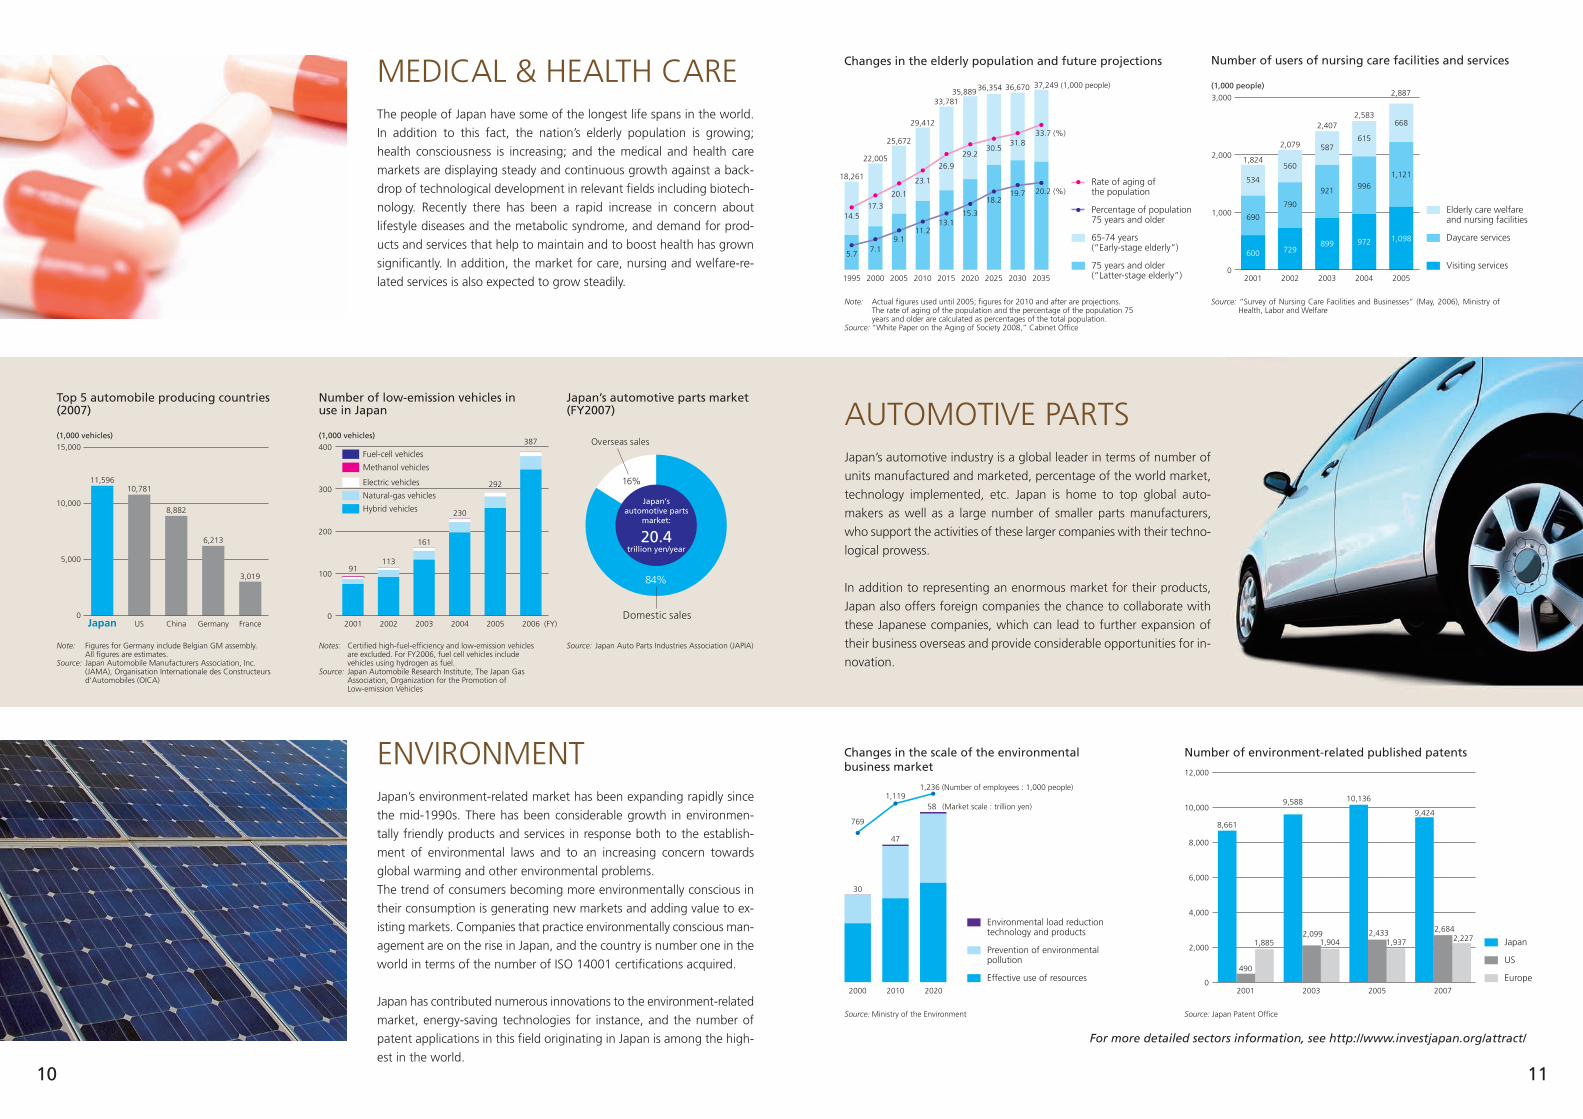
MEDICAL & HEALTH CAREThe people of Japan have some of the longest life spans in the world.
In addition to this fact, the nation’s elderly population is growing;
health consciousness is increasing; and the medical and health care
markets are displaying steady and continuous growth against a back-
drop of technological development in relevant fields including biotech-
nology. Recently there has been a rapid increase in concern about
lifestyle diseases and the metabolic syndrome, and demand for prod-
ucts and services that help to maintain and to boost health has grown
significantly. In addition, the market for care, nursing and welfare-re-
lated services is also expected to grow steadily.
ENVIRONMENTJapan’s environment-related market has been expanding rapidly since
the mid-1990s. There has been considerable growth in environmen-
tally friendly products and services in response both to the establish-
ment of environmental laws and to an increasing concern towards
global warming and other environmental problems.
The trend of consumers becoming more environmentally conscious in
their consumption is generating new markets and adding value to ex-
isting markets. Companies that practice environmentally conscious man-
agement are on the rise in Japan, and the country is number one in the
world in terms of the number of ISO 14001 certifications acquired.
Japan has contributed numerous innovations to the environment-related
market, energy-saving technologies for instance, and the number of
patent applications in this field originating in Japan is among the high-
est in the world.
For more detailed sectors information, see http://www.investjapan.org/attract/
18,261
22,005
25,672
29,412
33,78135,88936,354 36,670 37,249 (1,000 people)
12 13
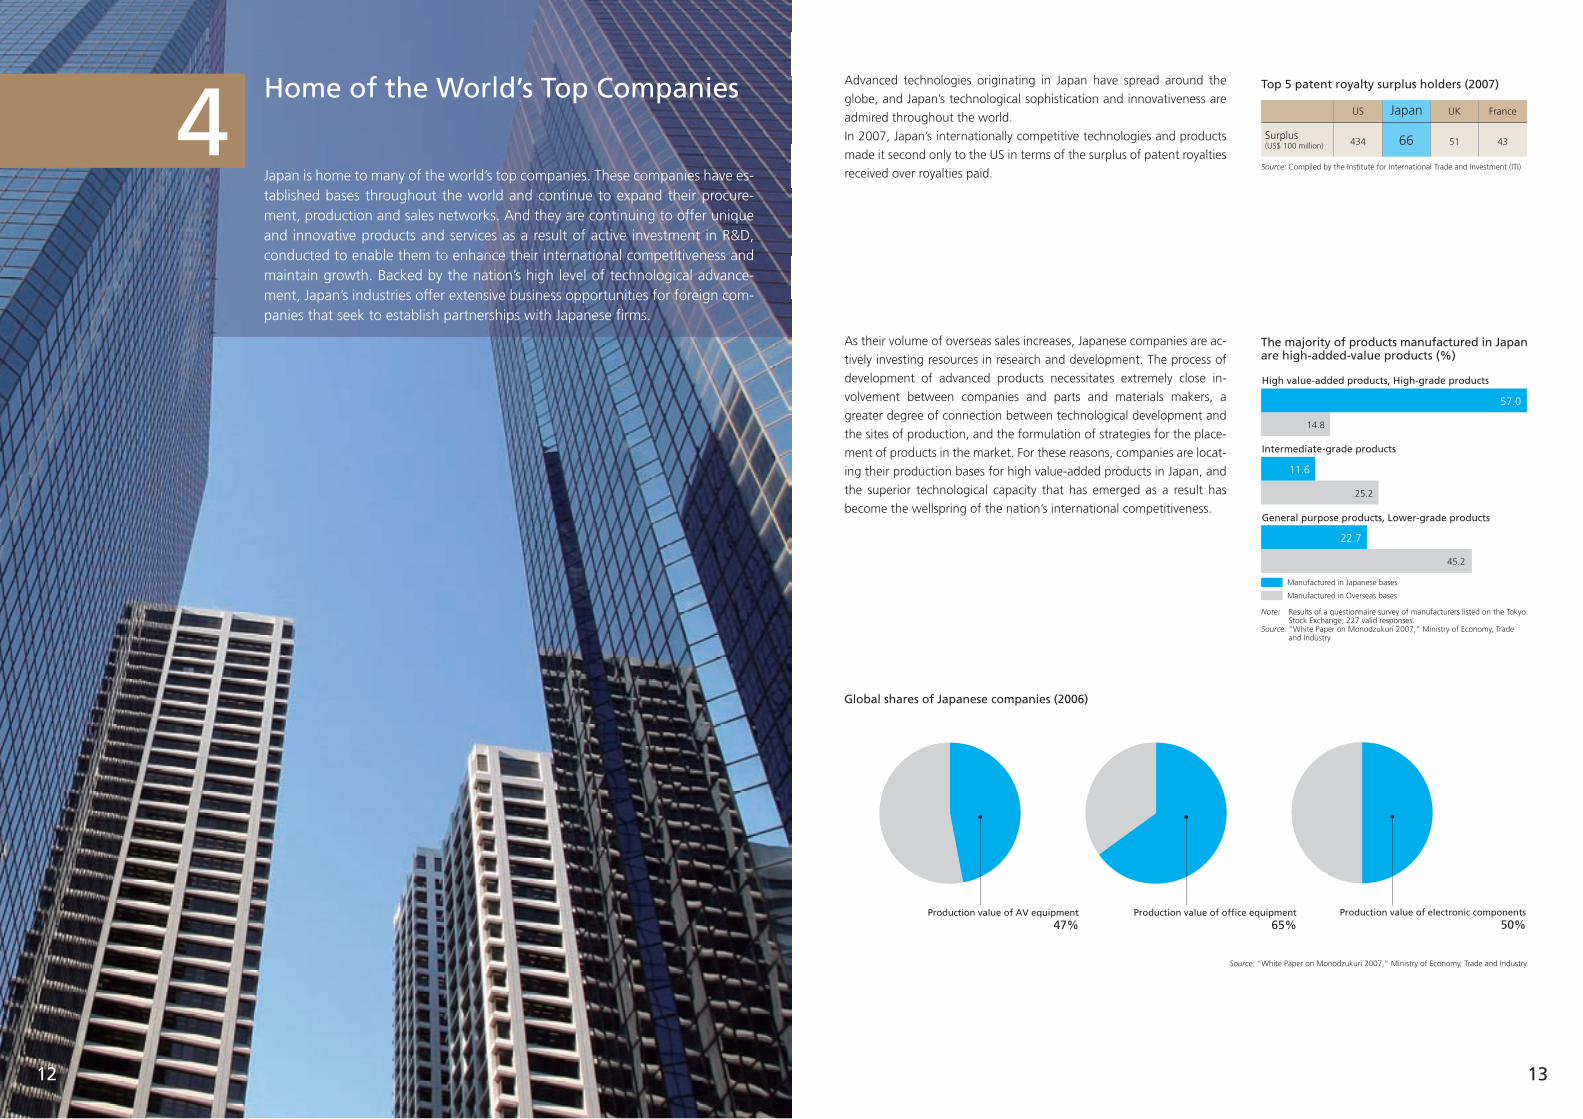
4Japan is home to many of the world’s top companies. These companies have es-tablished bases throughout the world and continue to expand their procure-ment, production and sales networks. And they are continuing to offer unique and innovative products and services as a result of active investment in R&D, conducted to enable them to enhance their international competitiveness and maintain growth. Backed by the nation’s high level of technological advance-ment, Japan’s industries offer extensive business opportunities for foreign com-panies that seek to establish partnerships with Japanese firms.
Advanced technologies originating in Japan have spread around the
globe, and Japan’s technological sophistication and innovativeness are
admired throughout the world.
In 2007, Japan’s internationally competitive technologies and products
made it second only to the US in terms of the surplus of patent royalties
received over royalties paid.
As their volume of overseas sales increases, Japanese companies are ac-
tively investing resources in research and development. The process of
development of advanced products necessitates extremely close in-
volvement between companies and parts and materials makers, a
greater degree of connection between technological development and
the sites of production, and the formulation of strategies for the place-
ment of products in the market. For these reasons, companies are locat-
ing their production bases for high value-added products in Japan, and
the superior technological capacity that has emerged as a result has
become the wellspring of the nation’s international competitiveness.
Home of the World’s Top Companies Top 5 patent royalty surplus holders (2007)
US Japan UK France
Surplus(US$ 100 million) 434 66 51 43
Production value of AV equipment47%
Production value of office equipment65%
Production value of electronic components50%
Global shares of Japanese companies (2006)
The majority of products manufactured in Japan are high-added-value products (%)
Manufactured in Japanese bases
Manufactured in Overseas bases
Intermediate-grade products
General purpose products, Lower-grade products
High value-added products, High-grade products
57.0
45.2
22.7
11.6
25.2
14.8
Source: “White Paper on Monodzukuri 2007,” Ministry of Economy, Trade and Industry
Source: Compiled by the Institute for International Trade and Investment (ITI)
Note: Results of a questionnaire survey of manufacturers listed on the Tokyo Stock Exchange; 227 valid responses.
Source: “White Paper on Monodzukuri 2007,” Ministry of Economy, Trade and Industry
14 15
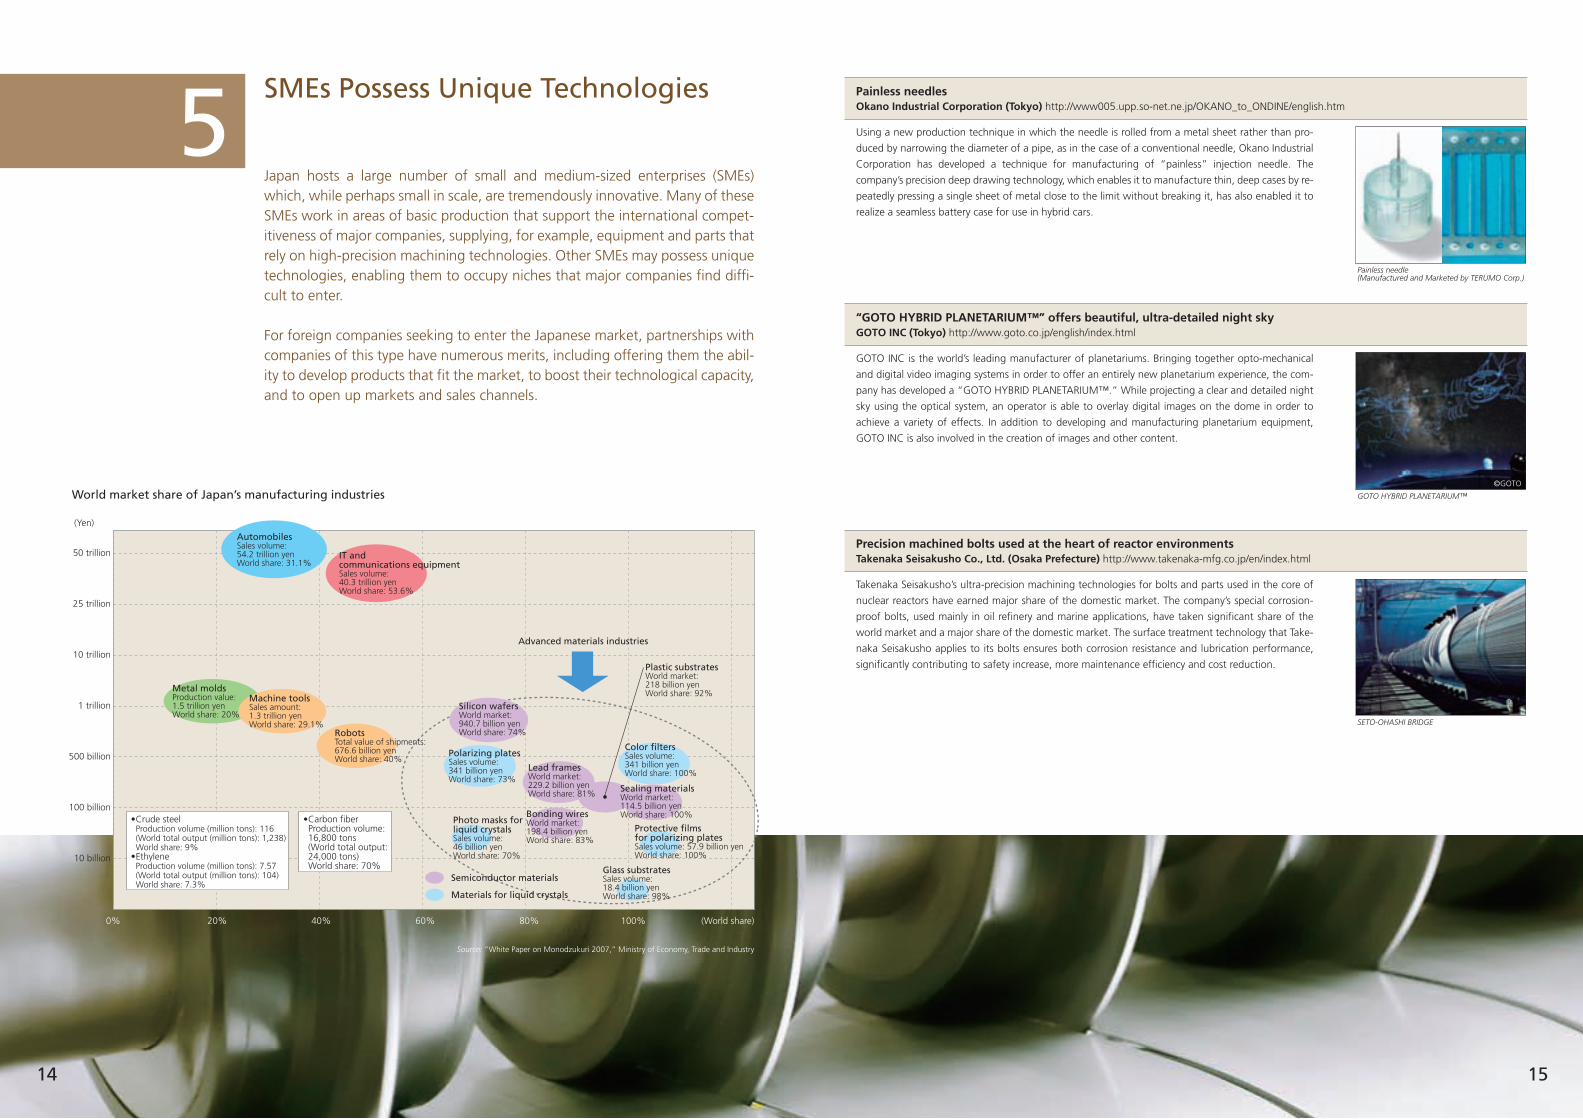
50 trillion
25 trillion
10 trillion
1 trillion
500 billion
100 billion
10 billion
(Yen)
0% 20% 40% 60% 80% 100% (World share)
Lead framesWorld market:229.2 billion yenWorld share: 81%
Color filtersSales volume:341 billion yenWorld share: 100%
Polarizing platesSales volume:341 billion yenWorld share: 73%
Photo masks forliquid crystalsSales volume:46 billion yenWorld share: 70%
Protective filmsfor polarizing platesSales volume: 57.9 billion yenWorld share: 100%
Glass substratesSales volume:18.4 billion yenWorld share: 98%
Bonding wiresWorld market:198.4 billion yenWorld share: 83%
Plastic substratesWorld market:218 billion yenWorld share: 92%
Sealing materialsWorld market:114.5 billion yenWorld share: 100%
IT andcommunications equipmentSales volume:40.3 trillion yenWorld share: 53.6%
Metal moldsProduction value:1.5 trillion yenWorld share: 20%
Advanced materials industries
Semiconductor materials
Materials for liquid crystals
AutomobilesSales volume:54.2 trillion yenWorld share: 31.1%
Machine toolsSales amount:1.3 trillion yenWorld share: 29.1%
RobotsTotal value of shipments:676.6 billion yenWorld share: 40%
Silicon wafersWorld market:940.7 billion yenWorld share: 74%
• Crude steel Production volume (million tons): 116 (World total output (million tons): 1,238) World share: 9% • Ethylene Production volume (million tons): 7.57 (World total output (million tons): 104) World share: 7.3%
• Carbon fiber Production volume: 16,800 tons (World total output: 24,000 tons) World share: 70%
Source: “White Paper on Monodzukuri 2007,” Ministry of Economy, Trade and Industry
5Japan hosts a large number of small and medium-sized enterprises (SMEs) which, while perhaps small in scale, are tremendously innovative. Many of these SMEs work in areas of basic production that support the international compet-itiveness of major companies, supplying, for example, equipment and parts that rely on high-precision machining technologies. Other SMEs may possess unique technologies, enabling them to occupy niches that major companies find diffi-cult to enter.
For foreign companies seeking to enter the Japanese market, partnerships with companies of this type have numerous merits, including offering them the abil-ity to develop products that fit the market, to boost their technological capacity, and to open up markets and sales channels.
Painless needlesOkano Industrial Corporation (Tokyo) http://www005.upp.so-net.ne.jp/OKANO_to_ONDINE/english.htm
World market share of Japan’s manufacturing industries
Using a new production technique in which the needle is rolled from a metal sheet rather than pro-
duced by narrowing the diameter of a pipe, as in the case of a conventional needle, Okano Industrial
Corporation has developed a technique for manufacturing of “painless” injection needle. The
company’s precision deep drawing technology, which enables it to manufacture thin, deep cases by re-
peatedly pressing a single sheet of metal close to the limit without breaking it, has also enabled it to
realize a seamless battery case for use in hybrid cars.
SMEs Possess Unique Technologies
Painless needle(Manufactured and Marketed by TERUMO Corp.)
“GOTO HYBRID PLANETARIUM™” offers beautiful, ultra-detailed night skyGOTO INC (Tokyo) http://www.goto.co.jp/english/index.html
GOTO INC is the world’s leading manufacturer of planetariums. Bringing together opto-mechanical
and digital video imaging systems in order to offer an entirely new planetarium experience, the com-
pany has developed a “GOTO HYBRID PLANETARIUM™.” While projecting a clear and detailed night
sky using the optical system, an operator is able to overlay digital images on the dome in order to
achieve a variety of effects. In addition to developing and manufacturing planetarium equipment,
GOTO INC is also involved in the creation of images and other content.
GOTO HYBRID PLANETARIUM™
SETO-OHASHI BRIDGE
©GOTO
Precision machined bolts used at the heart of reactor environmentsTakenaka Seisakusho Co., Ltd. (Osaka Prefecture) http://www.takenaka-mfg.co.jp/en/index.html
Takenaka Seisakusho’s ultra-precision machining technologies for bolts and parts used in the core of
nuclear reactors have earned major share of the domestic market. The company’s special corrosion-
proof bolts, used mainly in oil refinery and marine applications, have taken significant share of the
world market and a major share of the domestic market. The surface treatment technology that Take-
naka Seisakusho applies to its bolts ensures both corrosion resistance and lubrication performance,
significantly contributing to safety increase, more maintenance efficiency and cost reduction.
16 17
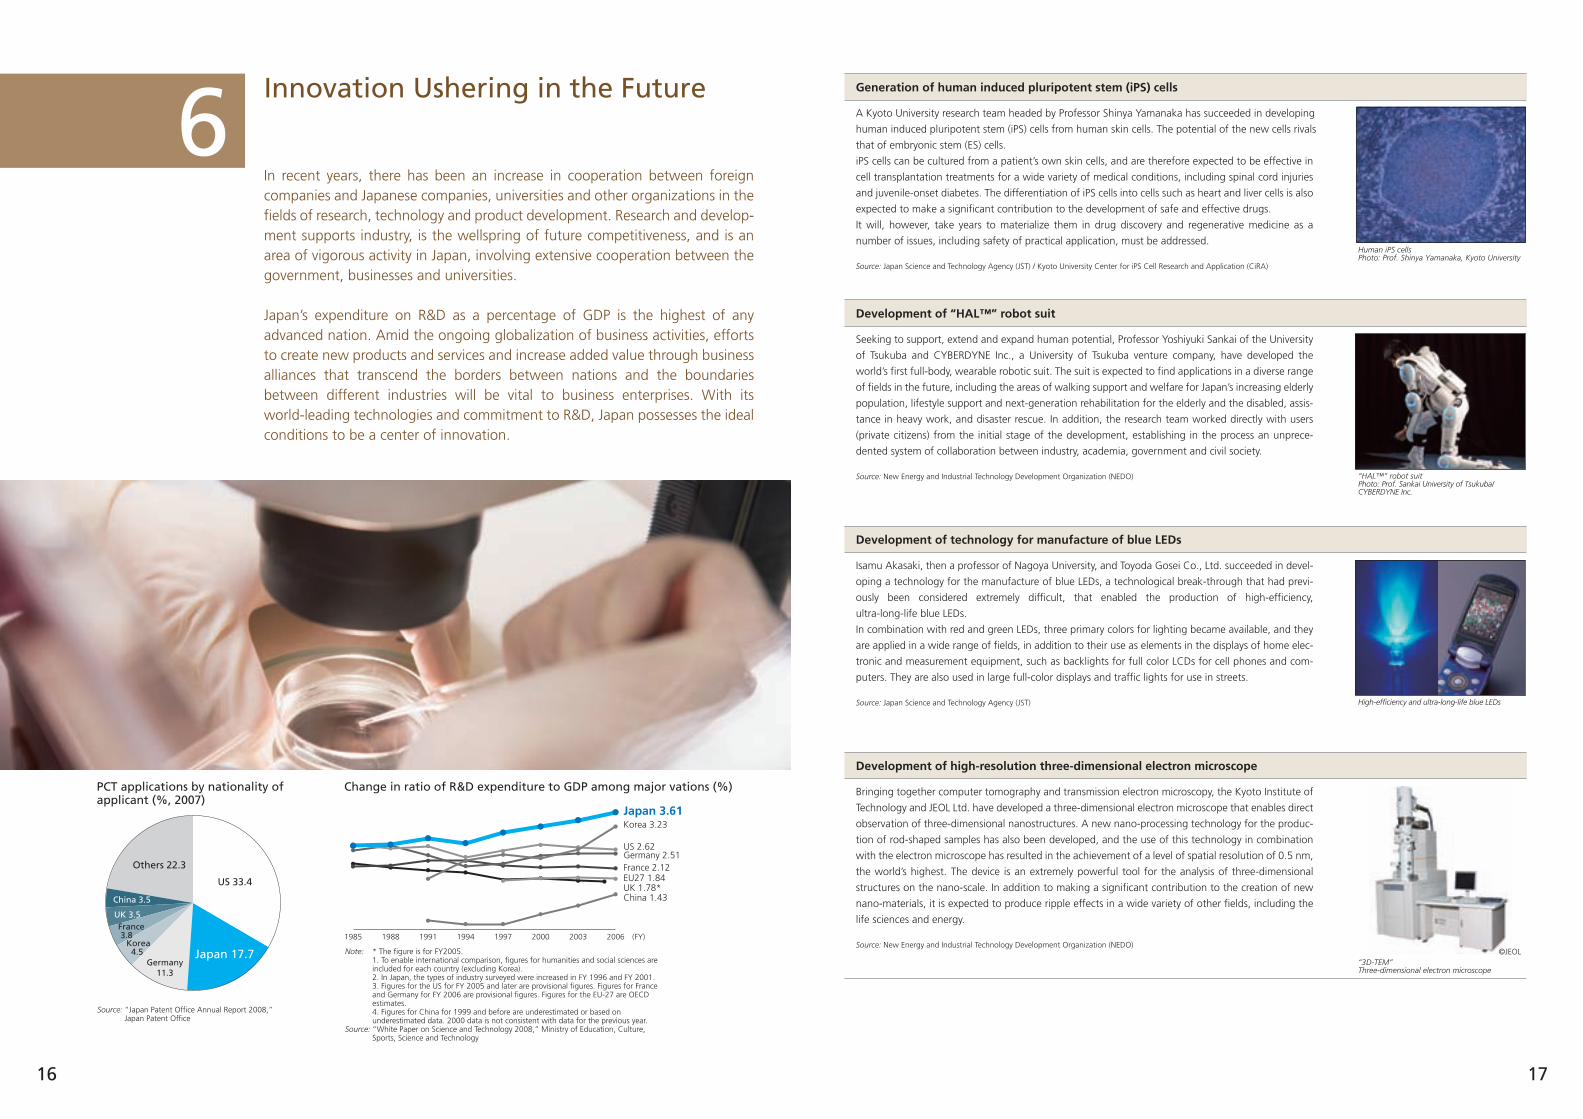
Japan 3.61Korea 3.23
US 2.62Germany 2.51France 2.12EU27 1.84UK 1.78*China 1.43
PCT applications by nationality of applicant (%, 2007)
Change in ratio of R&D expenditure to GDP among major vations (%)
Japan 17.7
US 33.4
Germany11.3
Korea 4.5
France 3.8
UK 3.5
China 3.5
Others 22.3
Note: * The figure is for FY2005. 1. To enable international comparison, figures for humanities and social sciences are
included for each country (excluding Korea). 2. In Japan, the types of industry surveyed were increased in FY 1996 and FY 2001. 3. Figures for the US for FY 2005 and later are provisional figures. Figures for France
and Germany for FY 2006 are provisional figures. Figures for the EU-27 are OECD estimates.
4. Figures for China for 1999 and before are underestimated or based on underestimated data. 2000 data is not consistent with data for the previous year.
Source: “White Paper on Science and Technology 2008,” Ministry of Education, Culture, Sports, Science and Technology
1985 1988 1991 1994 1997 2000 2003 2006 (FY)
Source: “Japan Patent Office Annual Report 2008,” Japan Patent Office
6In recent years, there has been an increase in cooperation between foreign companies and Japanese companies, universities and other organizations in the fields of research, technology and product development. Research and develop-ment supports industry, is the wellspring of future competitiveness, and is an area of vigorous activity in Japan, involving extensive cooperation between the government, businesses and universities.
Japan’s expenditure on R&D as a percentage of GDP is the highest of any advanced nation. Amid the ongoing globalization of business activities, efforts to create new products and services and increase added value through business alliances that transcend the borders between nations and the boundaries between different industries will be vital to business enterprises. With its world-leading technologies and commitment to R&D, Japan possesses the ideal conditions to be a center of innovation.
Innovation Ushering in the Future Generation of human induced pluripotent stem (iPS) cells
A Kyoto University research team headed by Professor Shinya Yamanaka has succeeded in developing
human induced pluripotent stem (iPS) cells from human skin cells. The potential of the new cells rivals
that of embryonic stem (ES) cells.
iPS cells can be cultured from a patient’s own skin cells, and are therefore expected to be effective in
cell transplantation treatments for a wide variety of medical conditions, including spinal cord injuries
and juvenile-onset diabetes. The differentiation of iPS cells into cells such as heart and liver cells is also
expected to make a significant contribution to the development of safe and effective drugs.
It will, however, take years to materialize them in drug discovery and regenerative medicine as a
number of issues, including safety of practical application, must be addressed.
Source: Japan Science and Technology Agency (JST) / Kyoto University Center for iPS Cell Research and Application (CiRA)
Human iPS cellsPhoto: Prof. Shinya Yamanaka, Kyoto University
Development of “HAL™” robot suit
Seeking to support, extend and expand human potential, Professor Yoshiyuki Sankai of the University
of Tsukuba and CYBERDYNE Inc., a University of Tsukuba venture company, have developed the
world’s first full-body, wearable robotic suit. The suit is expected to find applications in a diverse range
of fields in the future, including the areas of walking support and welfare for Japan’s increasing elderly
population, lifestyle support and next-generation rehabilitation for the elderly and the disabled, assis-
tance in heavy work, and disaster rescue. In addition, the research team worked directly with users
(private citizens) from the initial stage of the development, establishing in the process an unprece-
dented system of collaboration between industry, academia, government and civil society.
Source: New Energy and Industrial Technology Development Organization (NEDO) “HAL™” robot suitPhoto: Prof. Sankai University of Tsukuba/ CYBERDYNE Inc.
High-efficiency and ultra-long-life blue LEDs
Development of technology for manufacture of blue LEDs
Isamu Akasaki, then a professor of Nagoya University, and Toyoda Gosei Co., Ltd. succeeded in devel-
oping a technology for the manufacture of blue LEDs, a technological break-through that had previ-
ously been considered extremely difficult, that enabled the production of high-efficiency,
ultra-long-life blue LEDs.
In combination with red and green LEDs, three primary colors for lighting became available, and they
are applied in a wide range of fields, in addition to their use as elements in the displays of home elec-
tronic and measurement equipment, such as backlights for full color LCDs for cell phones and com-
puters. They are also used in large full-color displays and traffic lights for use in streets.
Source: Japan Science and Technology Agency (JST)
Development of high-resolution three-dimensional electron microscope
Bringing together computer tomography and transmission electron microscopy, the Kyoto Institute of
Technology and JEOL Ltd. have developed a three-dimensional electron microscope that enables direct
observation of three-dimensional nanostructures. A new nano-processing technology for the produc-
tion of rod-shaped samples has also been developed, and the use of this technology in combination
with the electron microscope has resulted in the achievement of a level of spatial resolution of 0.5 nm,
the world’s highest. The device is an extremely powerful tool for the analysis of three-dimensional
structures on the nano-scale. In addition to making a significant contribution to the creation of new
nano-materials, it is expected to produce ripple effects in a wide variety of other fields, including the
life sciences and energy.
Source: New Energy and Industrial Technology Development Organization (NEDO)
“3D-TEM”Three-dimensional electron microscope
©JEOL
18 19
20
30
40
50
60
707As the East Asian market grows rapidly, the economic integration between countries in the region continues to strengthen. The sustained high growth of the region is increasing its influence on the world economy, while regional ex-changes of personnel, goods and funds are intensifying and economic relation-ships grow closer at every level of industry. Against the backdrop of a rapidly growing East Asian region, Japan is becoming ever more important for compa-nies from around the world as a location for regional headquarters and R&D bases to support their push into Asia.
In the midst of this growth, the tastes and lifestyle of Japanese consum-
ers have influenced other markets within the region. Movies and anima-
tion, software for games, consumer goods such as clothes and
cosmetics, and even services that are popular in Japan or that originate
in Japan have in numerous cases become popular in other East Asian
countries, and more and more foreign enterprises are realizing that suc-
cess in Japan is a touchstone for success in the rest of the region.
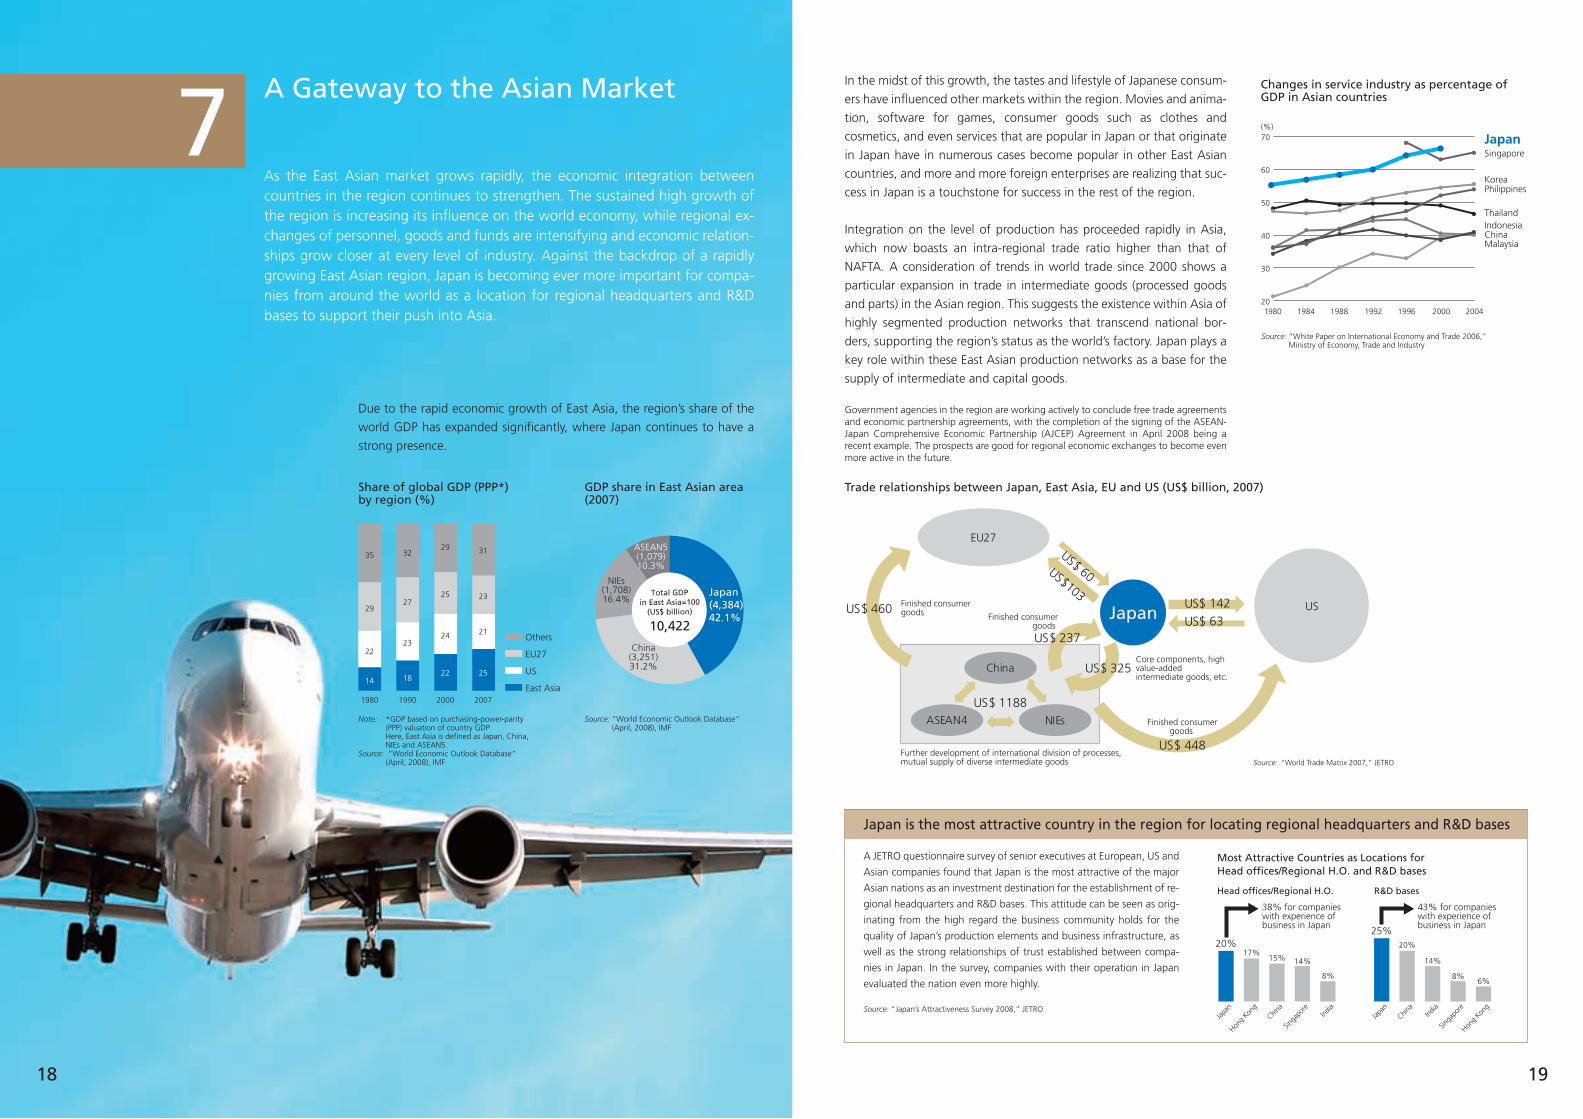
Integration on the level of production has proceeded rapidly in Asia,
which now boasts an intra-regional trade ratio higher than that of
NAFTA. A consideration of trends in world trade since 2000 shows a
particular expansion in trade in intermediate goods (processed goods
and parts) in the Asian region. This suggests the existence within Asia of
highly segmented production networks that transcend national bor-
ders, supporting the region’s status as the world’s factory. Japan plays a
key role within these East Asian production networks as a base for the
supply of intermediate and capital goods.
Government agencies in the region are working actively to conclude free trade agreements and economic partnership agreements, with the completion of the signing of the ASEAN-Japan Comprehensive Economic Partnership (AJCEP) Agreement in April 2008 being a recent example. The prospects are good for regional economic exchanges to become even more active in the future.
Due to the rapid economic growth of East Asia, the region’s share of the
world GDP has expanded significantly, where Japan continues to have a
strong presence.
A JETRO questionnaire survey of senior executives at European, US and
Asian companies found that Japan is the most attractive of the major
Asian nations as an investment destination for the establishment of re-
gional headquarters and R&D bases. This attitude can be seen as orig-
inating from the high regard the business community holds for the
quality of Japan’s production elements and business infrastructure, as
well as the strong relationships of trust established between compa-
nies in Japan. In the survey, companies with their operation in Japan
evaluated the nation even more highly.
Source: “Japan’s Attractiveness Survey 2008,” JETRO
A Gateway to the Asian Market Changes in service industry as percentage of GDP in Asian countries
Most Attractive Countries as Locations for Head offices/Regional H.O. and R&D bases
Japan is the most attractive country in the region for locating regional headquarters and R&D bases
Share of global GDP (PPP*) by region (%)
GDP share in East Asian area (2007)
Trade relationships between Japan, East Asia, EU and US (US$ billion, 2007)
Others
EU27
US
East Asia1980
14
22
29
35
1990
18
23
27
32
2000 2007
22
24
25
29
25
21
23
31
Total GDPin East Asia=100
(US$ billion)
10,422
Japan(4,384)42.1%
China(3,251)31.2%
NIEs(1,708)16.4%
ASEAN5(1,079)10.3%
1980 1984 1988 1992 1996 2000 2004
JapanSingapore
Philippines
ThailandIndonesia
Malaysia
Korea
China
(%)
Japan
EU27
US
US$ 60US$103US$ 142
US$ 63
China
ASEAN4 NIEs
US$ 1188
Core components, high value-addedintermediate goods, etc.
Further development of international division of processes, mutual supply of diverse intermediate goods
US$ 448
Finished consumergoods
US$ 325
US$ 237
Finished consumergoods
Finished consumergoods US$ 460
38% for companies with experience of business in Japan
Head offices/Regional H.O.
Japa
nHon
g Kon
g
China
Singa
pore
India
20%17%
15% 14%
8%
Source: “World Trade Matrix 2007,” JETRO
Note: *GDP based on purchasing-power-parity (PPP) valuation of country GDP
Here, East Asia is defined as Japan, China, NIEs and ASEAN5.
Source: “World Economic Outlook Database” (April, 2008), IMF
Source: “World Economic Outlook Database” (April, 2008), IMF
Source: “White Paper on International Economy and Trade 2006,” Ministry of Economy, Trade and Industry
43% for companies with experience of business in Japan
R&D bases
Japa
n
China
India
Singa
pore
Hong
Kong
25%20%
14%
8%6%
20 21
Japan offers highest profit yields for US firms —Profitability by country (2003-2007 average)—
All industries(%)
Manufacturing(%)
Japan Canada France Germany Italy UK0
5
10
15
20
16.1
8.5 8.4
10.0
8.17.2
Japan Canada France Germany Italy UK0
5
10
15
20
12.7
10.1 9.58.8 8.6
6.8
Note: The profitability is calculated by dividing the direct investment income by the direct investment position at the end of the previous year.
Source: Prepared based on U.S. Department of Commerce
Future Expansion of Business in Japan
2004
2005
2006
2007
(FY)
52.1
56.4
57.2
63.1
40.6
35.0
38.9
31.4
3.1
3.4
2.5
1.5
4.2
5.2
1.5
4.1
Intend to expand businessIntend to maintain present statusIntend to downsize businessNo Answer
8The value of foreign direct investment in Japan has grown steadily in recent years, and a large number of foreign companies have
successfully entered the Japanese market.
The following is a selection of comments made by representatives of leading foreign companies doing business in Japan.
“Japanese consumers value brand-name products and do not hesitate to buy them. The size of Japan’s econ-omy and market and the purchasing power of its consumers are considerable. These are important factors that led to our decision to enter the Japanese market.” (Shopping center developer)
“Take a hard look. Japan represents the world’s second largest economy. Other Asian nations also view Japan as a trendsetter, a leader in modernization, market reform, and global competition. If you can succeed here, the lessons learned can be extended to other Asian countries.” (Life insurance company)
“Japanese customers are renowned as highly discriminating trend-setters who are fashionable and sensitive to the trends. Moreover, Japan is accumulating unparalleled expertise in the emerging Asian markets in which it has long conducted business. As one of the ultimate testing grounds for new developments, Japan is becoming increasingly prominent in our plans.” (Manufacturer of industrial materials)
About Japanese MarketAbout Japanese Market
About Japan’s Business Innovation
About Japan’s Business Environment
“Doing business with Japanese companies, we have never had a bad debt. We also think that if we can develop a product that’s suitable for Japan and market it in the correct manner, we can boost our sales by several tens of percent.” (Pharmaceutical company)
“Japanese firms are not concerned about the fame of a company or its brands. They are genuinely interested in seeing a sample, making it easy to get right down to business.” (Software developer)
“One of the great things about dealing with Japanese companies is that they have a culture of basically work-ing together and working over a longer period of time. It’s a typical feature of Japanese business.” (Consulting company)
“The company’s decision to establish an R&D center in Japan was based on the fact that the country is home to a large number of world-leading home electronics manufacturers in the fields of telecommunications and entertainment, and it was essential to develop products and software with close attention to the demands of these clients.” (IC designer/manufacturer)
“Japan will be important in both innovation and in improving quality standards. That’s why Japan might emerge as the main location for reaching other parts of Asia.” (Package designer/supplier)
“Another thing that we have taken note of in Japan is the importance that clients place on quality. The com-pany believes that if it can make products that are accepted by Japanese clients, then these products will be able to distinguish themselves in a major way in global markets.” (Communications equipment developer/supplier)
“We decided to establish an operational base in Japan because by tailoring our services to meet the needs of these Japanese companies-with their superb technical knowledge and skills that they employ on a global basis-we can develop our own opportunities on a worldwide scale.” (Machinery and parts sales)
In a recent questionnaire survey of foreign companies in Japan conducted by JETRO, the
companies reported that their business results were consistently excellent, and 63.1%
of respondents answered that they intended to expand their business in the country.
The percentage of companies responding in this way to the survey has displayed a con-
sistent increase over the four-year period from 2004 to 2007. By contrast, only 1.5% of
companies surveyed indicated that they intended to downsize, the lowest level since
2000. It is clear that the number of foreign companies in Japan seeking to increase the
scale of their businesses is increasing, which falls in line with a relatively favorable out-
look for the Japanese economy and the markets for these businesses.
Source: “Survey on Attitudes of Foreign-affiliated Companies toward Direct Investment in Japan 2007,” JETRO
Foreign Companies Expanding Business in Japan
Foreign Companies in Japan Look toward Further Expansion
For examples of the success achieved by foreign companies entering the Japanese market, see http://www.investjapan.org/success_stories/
Japan is a business destination that offers abundant potential for foreign enter-prises to increase their profit. The number of firms seeking to expand their busi-nesses in Japan with a long-term investment strategy is steadily increasing.
22 23
0
Percentage of researchers in working population(%)
0.0
0.5
1.0
Japan US Korea France CanadaGermany UK
0.91
0.700.60 0.59 0.57 0.56
0.41
Note: 2004 data is used for France and Canada, 1998 data for the UK, and 2005 data for all other countries.
Source: Based on “Main Science and Technology Indicators Volume 2007/1,” OECD
Japan’s deviation value in terms of ICT infrastructure indicators
20
40
60
80
100
Rate of bot infections (1)
Broadband speed (1)
Basic telephone charges (4)
Rate of use of optic fiber (1)
Broadband charges (1)
Rate of use of 3G cellular
phones (2)
JapanAverage for 23 countries and regions
Note: Figures in parentheses indicate Japan’s position among 23 nations and regions
Source: Based on “Report of International Comparison of Japan’s ICT Infrastructure” (March, 2008), Ministry of Internal Affairs and Communications
Source: Ministry of Internal Affairs and Communications
Note: Indicates that Japan is considered as 100. Figures are affected by exchange rate fluctuations; fee structures, service quality, etc. vary between countries.
Source: Cabinet Office
Source: “The Global Competitiveness Report 2008-2009,” WEF
CountryRank
123456789
10
United StatesSwitzerlandJapanGermanyFinland SwedenDenmarkTaiwan, ChinaNetherlandsKorea, Rep.
Score
5.805.685.655.545.535.535.375.265.205.20
Innovation and sophistication factors
9Recent years have seen a steady increase in foreign investment in Japan. Japan’s industrial structure and business environment are similar to those of Europe and the US, and this makes it simpler for foreign companies to establish themselves here and to expand their businesses within the country than it is in other Asian countries. The Japanese government is also making considerable efforts to im-prove the investment environment.
FDI is flowing into Japan faster than ever before, and the number of M&As is also increasing rapidly. Japan offers a mature and stable business environment that makes it ideal as a base for global business.
Laws for the protection of intellectual property are essential to the de-
velopment of value-added business, and Japan has an established
system of such laws. In addition, there is a high degree of awareness in
the country of this issue. The government has increased its focus on this
area and is working to further promote the creation, use and protection
of intellectual property.
Since the 1990s, Japan has pushed ahead with efforts to make its ac-
counting standards and its associated legal system conform to interna-
tional standards. In 2006, a new Companies Law that reflects the
internationalization of business activities and changes in Japan’s econ-
omy and society was enacted, and in May 2007, triangular mergers, in
which the stock of a parent company can be used as compensation for
the acquisition of a third company by a subsidiary, were made possible.
The nation has set in place a system of investment rules nearly equal to
those established in other advanced countries.
Even by the standards of other advanced nations, Japan has an ex-
tremely high rate of progression to higher education. The mobility of
human resources in specialized fields continues to increase, and there is
growing potential for foreign companies expanding into the Japanese
market to make use of local talent. When asked why they selected
Japan as their central base in Asia, the majority of foreign companies
answer that it was precisely because it offered them access to superior
personnel.
Japan also possesses a highly developed infrastructure with costs that
are comparatively low. In Japan, a business can make use of a high-
quality communications network at broadband charges that are among
the world’s lowest. Japan’s information and communications infrastruc-
ture rivals that of any other major nation. The nation’s maturity as a
base for global business is constantly increasing. M&As of Japanese companies by foreign companies are on the rise. The
number of Out-In M&As in 2007 was a new record. With a series of
large-scale M&As, each over a billion dollars. Offering the advantage of
enabling existing business resources to be put to work, M&As are be-
coming increasingly common as a mode of investment in Japan.
The Global Competitiveness Report 2008-2009, published in October 2008 by the World Economic
Forum (WEF), rates Japan as 3rd in the world in terms of business sophistication and innovation.
The 2008-2009 report covered 134 countries and regions. The ranking quantifies a country’s
overall competitiveness based on data for 12 indicators, including infrastructure, market size,
technological readiness, higher education and training and macroeconomic stability, in addi-
tion to the results of a survey of more than 10,000 members of the World Economic Forum.
Japan’s pool of talented scientists and engineers, its expenditure on research and develop-
ment, and its capacity for innovation were particularly highly evaluated as factors in the
nation’s international competitiveness.
Mature Investment Infrastructure
Item
Comparison of utility rates (As of 2007)
Japan US UK France Germany
Unit price per ADSL 1Mbps (Yen)
Item Tokyo New York London Paris Dusseldorf
337
A Sophisticated Business Environment
2002
108
6,845
104
12,530
125
10,386
116
3,596
111
4,354
151 (numberof deals)
22,584 (US$ million)
2003 2004 2005 2006 20072002
4,795
1,159
-3,636
2,128
733
-1,395
3,506
846
-2,660
3,319
306
-3,013
5,304
-757
-5,341
2,655
-6,061
7,996 (billion yen)
2003 2004 2005 2006 2007
InflowOutflowNet
Japan’s inward FDI (Flow statistics) M&A towards Japan
Electricity (when using 290 kWh)
City gas (when using 550,000 kcal)
Water (when using 20 m3)
Subways (base fare)
Taxi (5 km, day)
59
100
100
100
100
100
1490
130
88
57
151
66
665
121
80
184
589
122
255
90
87
167
138
60
145
111
269
118
104
Note: Data as of July 7, 2008. Transaction completion basis.Source: Prepared based on Thomson Reuters data.
Source: “Balance of Payments,” Ministry of Finance and Bank of Japan
24 25
Note: Figures are weighted averages with the Tokyo consumer price index (CPI) as the weighting factor.
Source: “Survey of Retail Prices of Foodstuffs in Tokyo and Six Major Overseas Cities 2007,” Ministry of Agriculture, Forestry and Fisheries
Number of hospital beds per thousand people
0
5
10
15
Japan Germany France Italy UK Canada US
14.3
8.97.7
4.4 4.23.7 3.3
Note: Data for the most recent year that can be drawn from data for 2000-2005 has been used.
Source: “World Statistics 2008,” Ministry of Internal Affairs and Communications
Source: Economist Intelligence Unit
CountryRank
123456789
10
IcelandDenmarkNorwayNew Zealand JapanIrelandPortugalFinlandLuxembourgAustria
Score
1.1761.3331.3431.350
1.3581.4101.4121.4321.4461.449
Global Peace Index Rankings 2008*A lower score indicates a more peaceful country.
10While home to a very unique culture, Japan has also welcomed elements of many foreign cultures. This coexistence of what is uniquely Japanese with cul-tures from around the world makes life in Japan constantly fresh and exciting. The nation also possesses all the elements required for a comfortable life, in-cluding stable infrastructure, clean and safe urban environments, and efficient social systems. Japan welcomes its guests with a secure and comfortable life-style, rich with the potential to enjoy the diversity and beauty of nature in all its seasonal changes.
Cuisines from around the world can be enjoyed in Japan in addition to
famous Japanese dishes such as sushi and tempura. Tokyo is well served
with 160,000 restaurants, but even outside Tokyo cuisines from various
countries of the world can be found.
The Tokyo edition of the Michelin Guide, published in 2008, listed nine
three-star restaurants and 37 two-star restaurants. These were not lim-
ited to restaurants offering Japanese cuisine, but included French, Chi-
nese, Italian, and Spanish restaurants.
Food in Japan is also relatively inexpensive when compared with prices
in major cities around the world, and it is easy to find imported food-
stuffs and daily items.
Of course you will also find all the facilities that you might need in your
daily life, from convenience stores (CVS) to health clubs to cinemas.
The number of hospital beds per thousand people in Japan is very high
even by the standards of other advanced nations, and the nation’s hos-
pitals and clinics feature the latest equipment and technologies.
Japan boasts a public infrastructure and a level of public safety and
order that are unparalleled in most of Asia. The nation also provides an
outstanding living environment from the perspectives of health care,
education and leisure.
The Global Peace Index 2008, published in May 2008, ranked Japan fifth of 140
countries in terms of safety. The ranking is given by the Economist Intelligence
Unit, the survey division of the UK journal The Economist, based on an analysis of
24 factors, including the number of police, the number of murders and violent
crimes, the danger of internal conflict, the level of respect for human rights, the
potential for terrorist incidents, and the relationship with neighboring countries.
The result shows that Japan is among the world’s safest and most peaceful coun-
tries, with the lowest murder rate and the lowest potential for terrorist incidents
of any developed nation, in addition to a comparatively stable political situation
and a high level of education.
A Secure, Comfortable Living Environment Item
Differences in domestic and overseas food prices(With Tokyo prices as 100)
Tokyo New York London Paris Seoul
Grains
Fish and shellfish
Meat
Dairy products and eggs
Vegetables
100
100
100
100
100
159
85
92
110
179
56
126
118
96
112
98
117
120
112
128
88
93
99
163
131
Japan, the Safest Country in Asia and the Safest Country in the G8
26 27
JETRO Invest Japan Business Support Centers (IBSCs)
Consulting Service Facilities Service
We can help you start a business in Japan
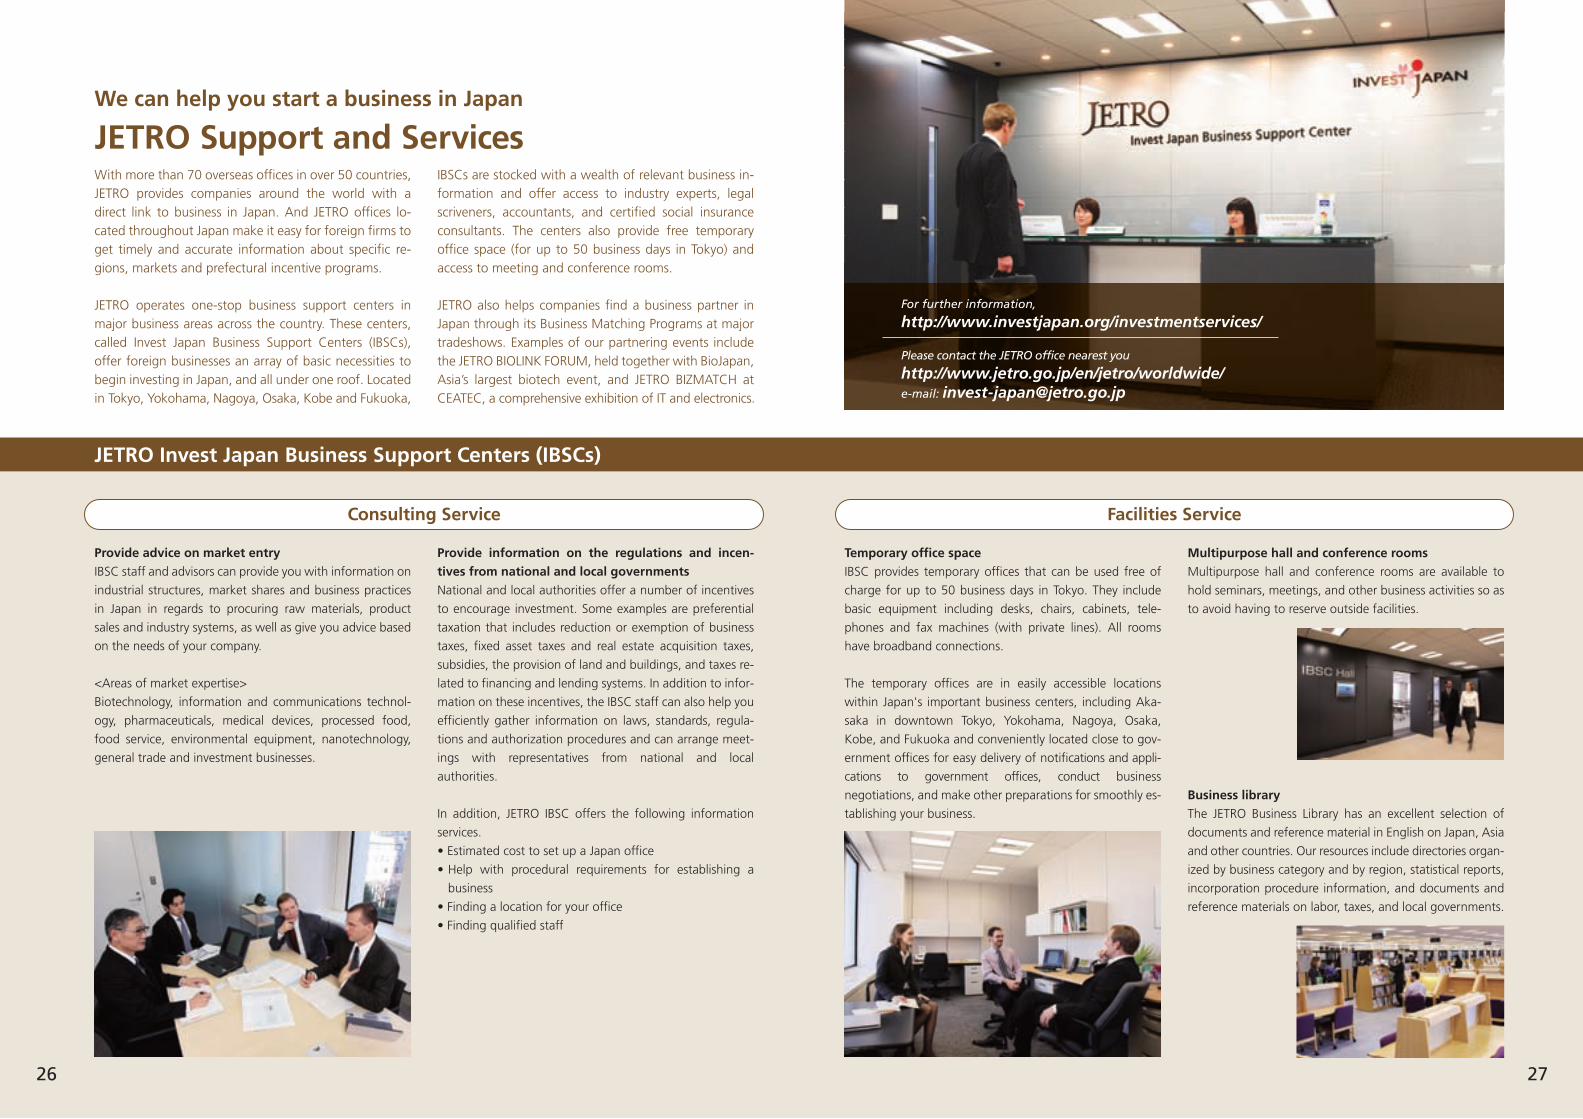
JETRO Support and ServicesWith more than 70 overseas offices in over 50 countries, JETRO provides companies around the world with a direct link to business in Japan. And JETRO offices lo-cated throughout Japan make it easy for foreign firms to get timely and accurate information about specific re-gions, markets and prefectural incentive programs.
JETRO operates one-stop business support centers in major business areas across the country. These centers, called Invest Japan Business Support Centers (IBSCs), offer foreign businesses an array of basic necessities to begin investing in Japan, and all under one roof. Located in Tokyo, Yokohama, Nagoya, Osaka, Kobe and Fukuoka,
IBSCs are stocked with a wealth of relevant business in-formation and offer access to industry experts, legal scriveners, accountants, and certified social insurance consultants. The centers also provide free temporary office space (for up to 50 business days in Tokyo) and access to meeting and conference rooms.
JETRO also helps companies find a business partner in Japan through its Business Matching Programs at major tradeshows. Examples of our partnering events include the JETRO BIOLINK FORUM, held together with BioJapan, Asia’s largest biotech event, and JETRO BIZMATCH at CEATEC, a comprehensive exhibition of IT and electronics.
Provide advice on market entry
IBSC staff and advisors can provide you with information on
industrial structures, market shares and business practices
in Japan in regards to procuring raw materials, product
sales and industry systems, as well as give you advice based
on the needs of your company.
<Areas of market expertise>
Biotechnology, information and communications technol-
ogy, pharmaceuticals, medical devices, processed food,
food service, environmental equipment, nanotechnology,
general trade and investment businesses.
Provide information on the regulations and incen-
tives from national and local governments
National and local authorities offer a number of incentives
to encourage investment. Some examples are preferential
taxation that includes reduction or exemption of business
taxes, fixed asset taxes and real estate acquisition taxes,
subsidies, the provision of land and buildings, and taxes re-
lated to financing and lending systems. In addition to infor-
mation on these incentives, the IBSC staff can also help you
efficiently gather information on laws, standards, regula-
tions and authorization procedures and can arrange meet-
ings with representatives from national and local
authorities.
In addition, JETRO IBSC offers the following information
services.
• Estimated cost to set up a Japan office
• Help with procedural requirements for establishing a
business
• Finding a location for your office
• Finding qualified staff
Temporary office space
IBSC provides temporary offices that can be used free of
charge for up to 50 business days in Tokyo. They include
basic equipment including desks, chairs, cabinets, tele-
phones and fax machines (with private lines). All rooms
have broadband connections.
The temporary offices are in easily accessible locations
within Japan's important business centers, including Aka-
saka in downtown Tokyo, Yokohama, Nagoya, Osaka,
Kobe, and Fukuoka and conveniently located close to gov-
ernment offices for easy delivery of notifications and appli-
cations to government offices, conduct business
negotiations, and make other preparations for smoothly es-
tablishing your business.
Multipurpose hall and conference rooms
Multipurpose hall and conference rooms are available to
hold seminars, meetings, and other business activities so as
to avoid having to reserve outside facilities.
Business library
The JETRO Business Library has an excellent selection of
documents and reference material in English on Japan, Asia
and other countries. Our resources include directories organ-
ized by business category and by region, statistical reports,
incorporation procedure information, and documents and
reference materials on labor, taxes, and local governments.
For further information,
http://www.investjapan.org/investmentservices/
Please contact the JETRO office nearest you
http://www.jetro.go.jp/en/jetro/worldwide/ e-mail: [email protected]