Embed Size (px)
Citation preview
10-1
Chapter 10Measurement and Scaling:
Noncomparative Scaling
Techniques
Copyright © 2011 Pearson Education, Inc.
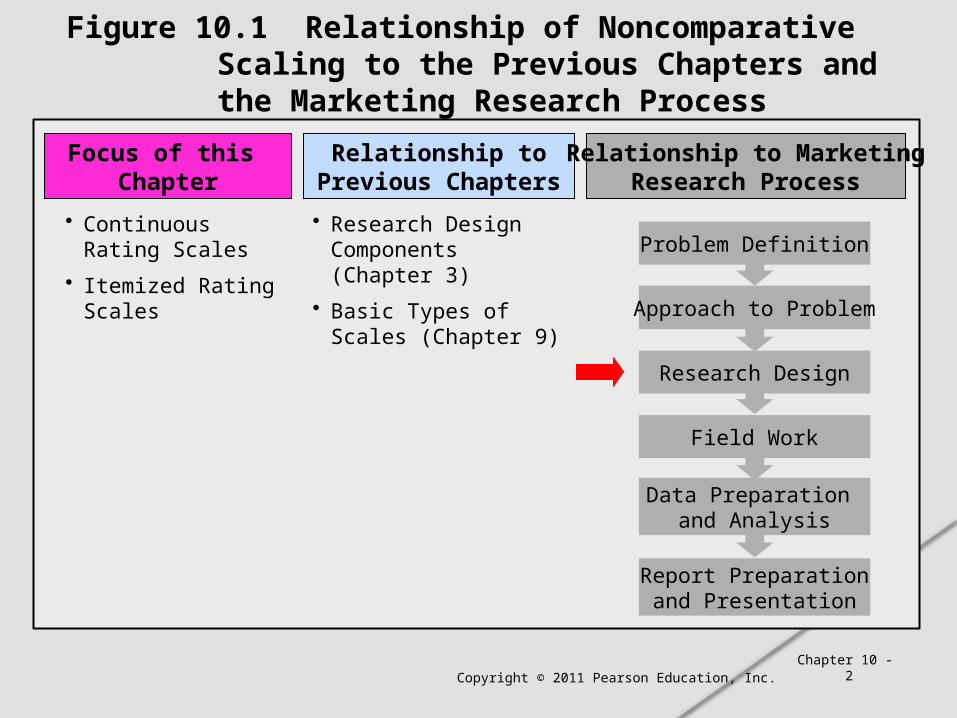
Figure 10.1 Relationship of Noncomparative Scaling to the Previous Chapters and the Marketing Research Process
Chapter 10 - 2
Focus of this Chapter
Relationship toPrevious Chapters
• Continuous Rating Scales
• Itemized Rating Scales
• Research Design Components (Chapter 3)
• Basic Types of Scales (Chapter 9)
Approach to Problem
Field Work
Data Preparation and Analysis
Report Preparationand Presentation
Research Design
Problem Definition
Relationship to MarketingResearch Process
Copyright © 2011 Pearson Education, Inc.
Figure 10.2 Noncomparative Scaling Techniques: An Overview
Copyright © 2011 Pearson Education, Inc.
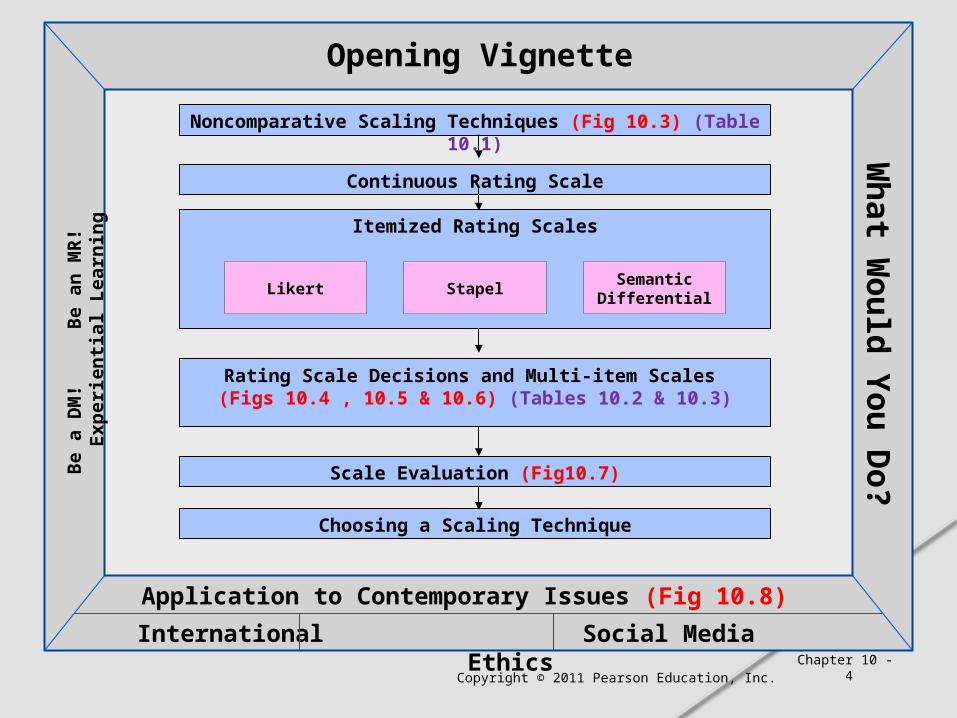
Noncomparative Scaling Techniques (Fig 10.3) (Table 10.1)
Continuous Rating Scale
Rating Scale Decisions and Multi-item Scales (Figs 10.4 , 10.5 & 10.6) (Tables 10.2 & 10.3)
Scale Evaluation (Fig10.7)
Choosing a Scaling TechniqueBe a
DM
!
B
e a
n M
R!
Exp
eri
en
tial
Learn
ing
Wh
at W
ou
ld Y
ou
Do?
Opening Vignette
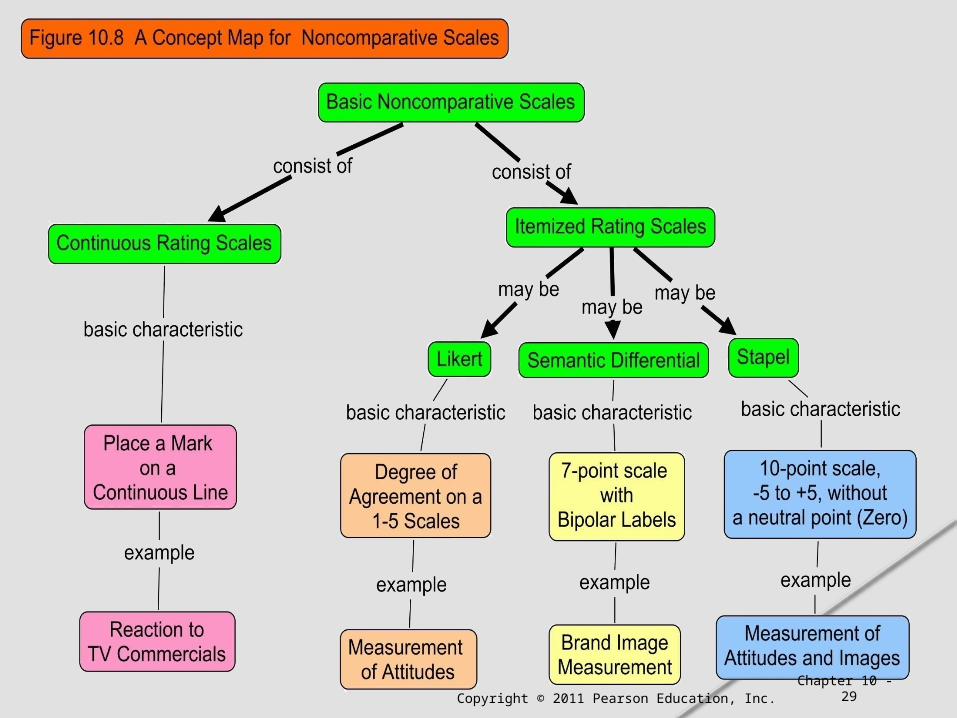
Application to Contemporary Issues (Fig 10.8)
International Social Media Ethics
Chapter 10 - 4
Itemized Rating Scales
Likert StapelSemantic
Differential
Copyright © 2011 Pearson Education, Inc. Chapter 10 - 5
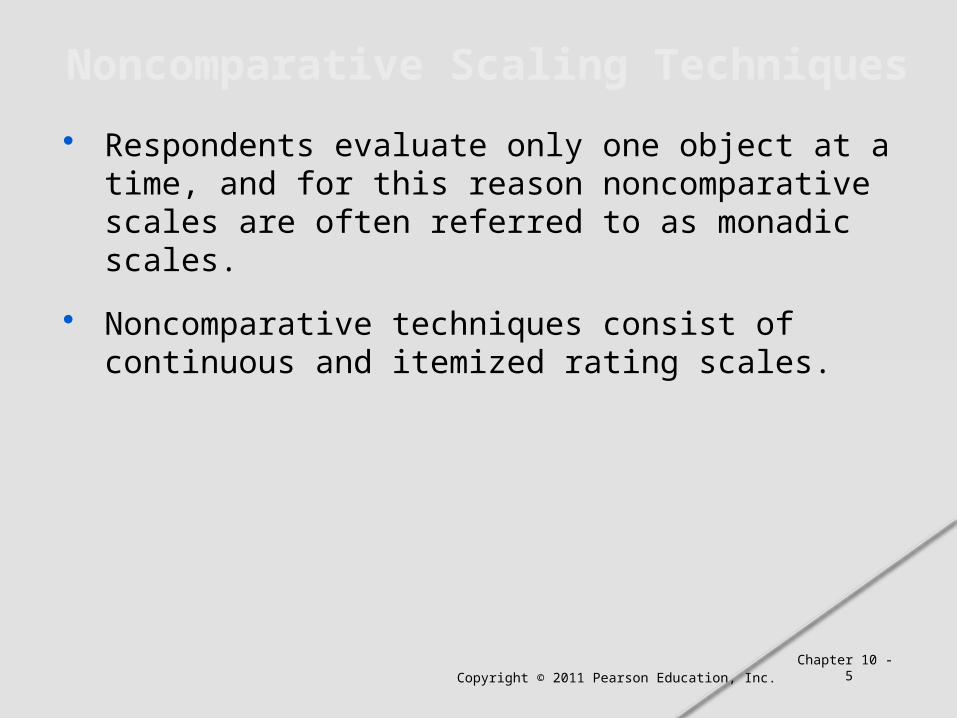
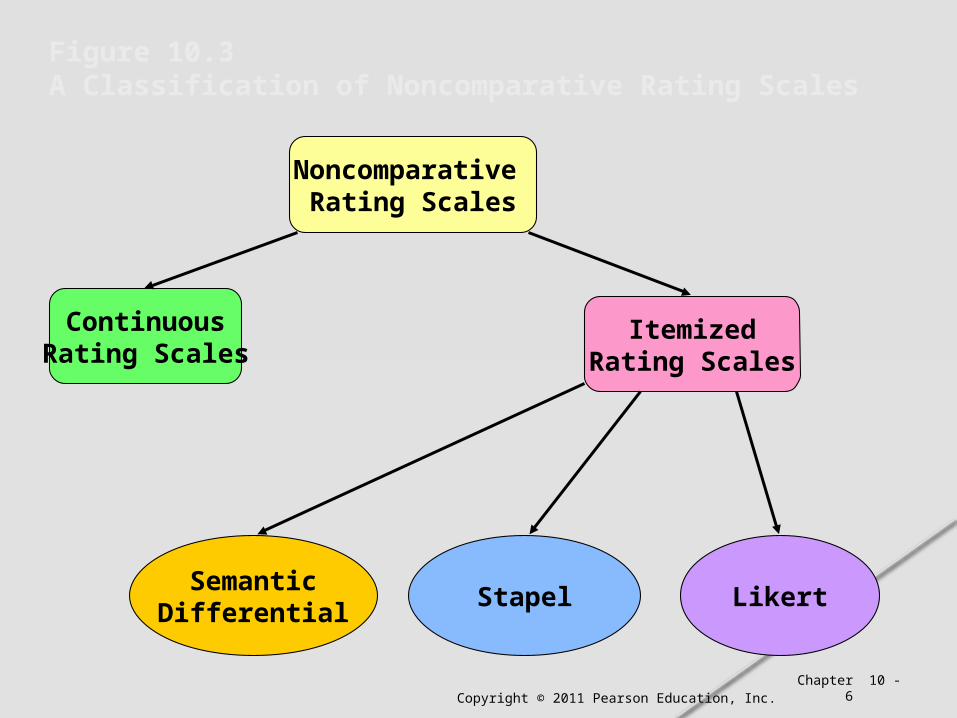
Noncomparative Scaling Techniques
Respondents evaluate only one object at a time, and for this reason noncomparative scales are often referred to as monadic scales.
Noncomparative techniques consist of continuous and itemized rating scales.
Copyright © 2011 Pearson Education, Inc.
Noncomparative Rating Scales
ContinuousRating Scales
ItemizedRating Scales
SemanticDifferential
Stapel Likert
Figure 10.3 A Classification of Noncomparative Rating Scales
Chapter 10 - 6
Copyright © 2011 Pearson Education, Inc.
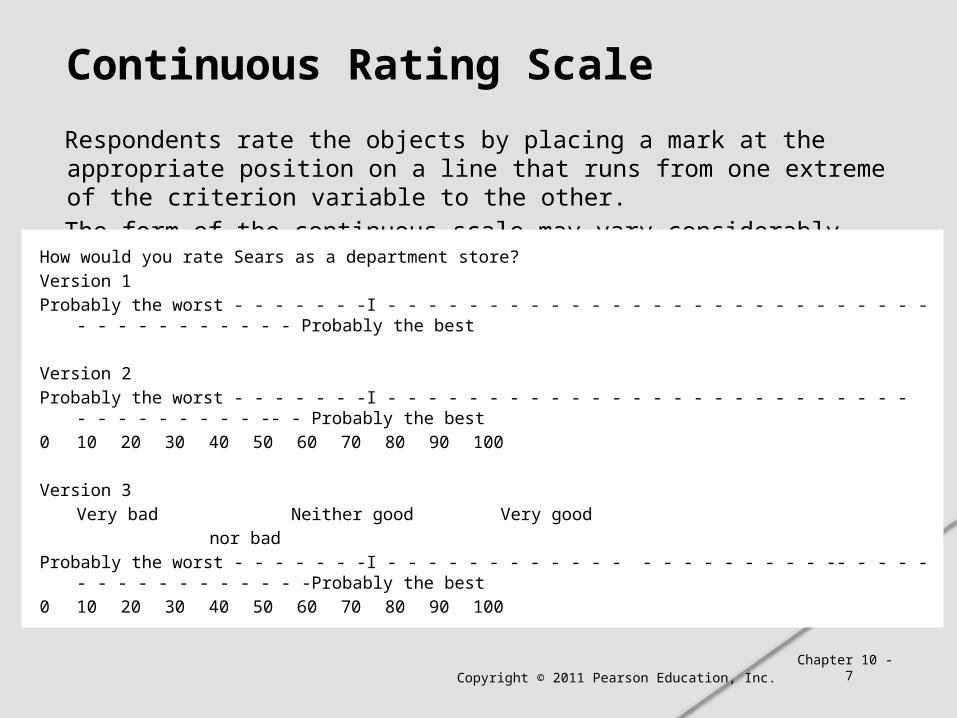
Respondents rate the objects by placing a mark at the appropriate position on a line that runs from one extreme of the criterion variable to the other.
The form of the continuous scale may vary considerably.
Chapter 10 - 7
Continuous Rating Scale
How would you rate Sears as a department store?
Version 1
Probably the worst - - - - - - -I - - - - - - - - - - - - - - - - - - - - - - - - - - - - - - - - - - - - - - Probably the best
Version 2
Probably the worst - - - - - - -I - - - - - - - - - - - - - - - - - - - - - - - - - - - - - - - - - - - -- - Probably the best
0 10 20 30 40 50 60 70 80 90100
Version 3
Very bad Neither good Very good
nor bad
Probably the worst - - - - - - -I - - - - - - - - - - - - - - - - - - - - - -- - - - - - - - - - - - - - - - -Probably the best
0 10 20 30 40 50 60 70 80 90100
Copyright © 2011 Pearson Education, Inc. Chapter 10 - 8
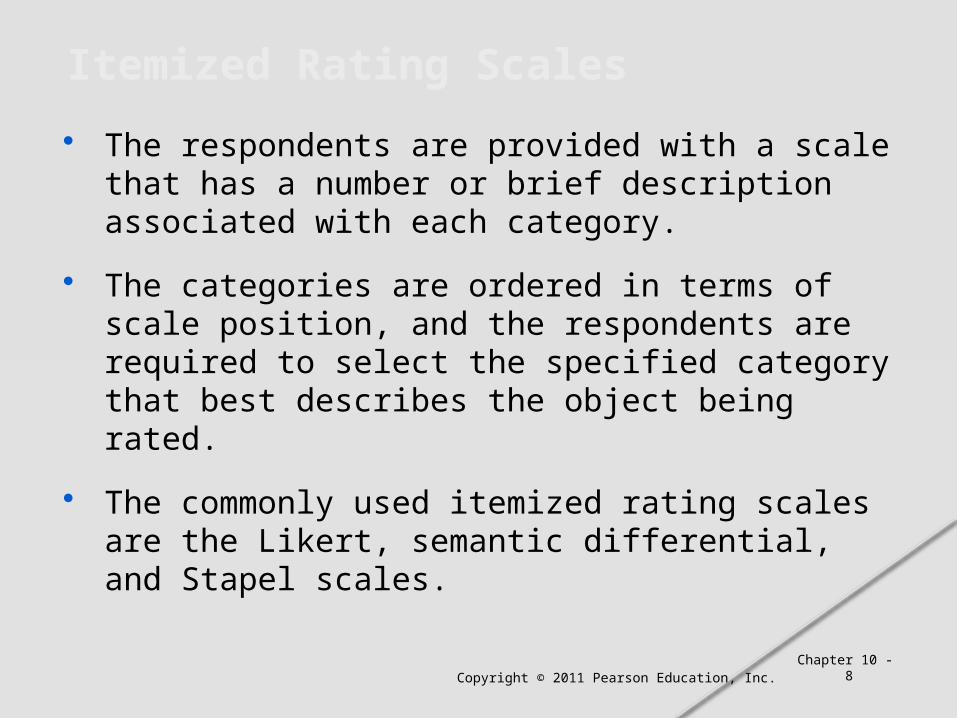
Itemized Rating Scales
The respondents are provided with a scale that has a number or brief description associated with each category.
The categories are ordered in terms of scale position, and the respondents are required to select the specified category that best describes the object being rated.
The commonly used itemized rating scales are the Likert, semantic differential, and Stapel scales.
Copyright © 2011 Pearson Education, Inc.
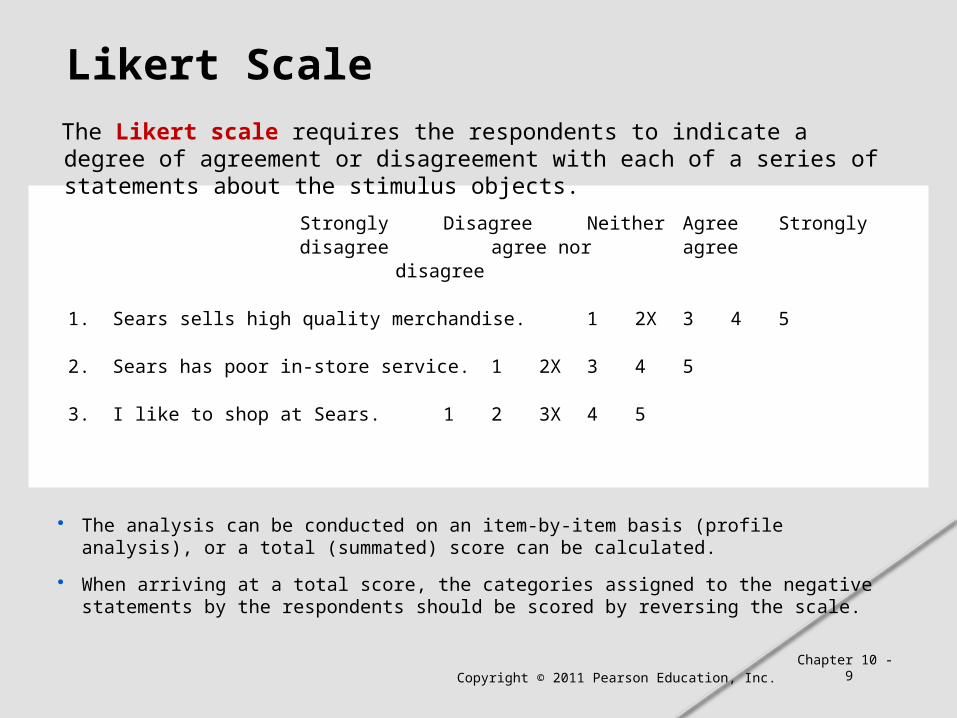
Likert Scale
The Likert scale requires the respondents to indicate a degree of agreement or disagreement with each of a series of statements about the stimulus objects.
Chapter 10 - 9
The analysis can be conducted on an item-by-item basis (profile analysis), or a total (summated) score can be calculated.
When arriving at a total score, the categories assigned to the negative statements by the respondents should be scored by reversing the scale.
Strongly Disagree Neither Agree Strongly disagree agree nor agree
disagree 1. Sears sells high quality merchandise. 1 2X 3 4 5 2. Sears has poor in-store service. 1 2X 3 4 5 3. I like to shop at Sears. 1 2 3X 4 5
Copyright © 2011 Pearson Education, Inc.
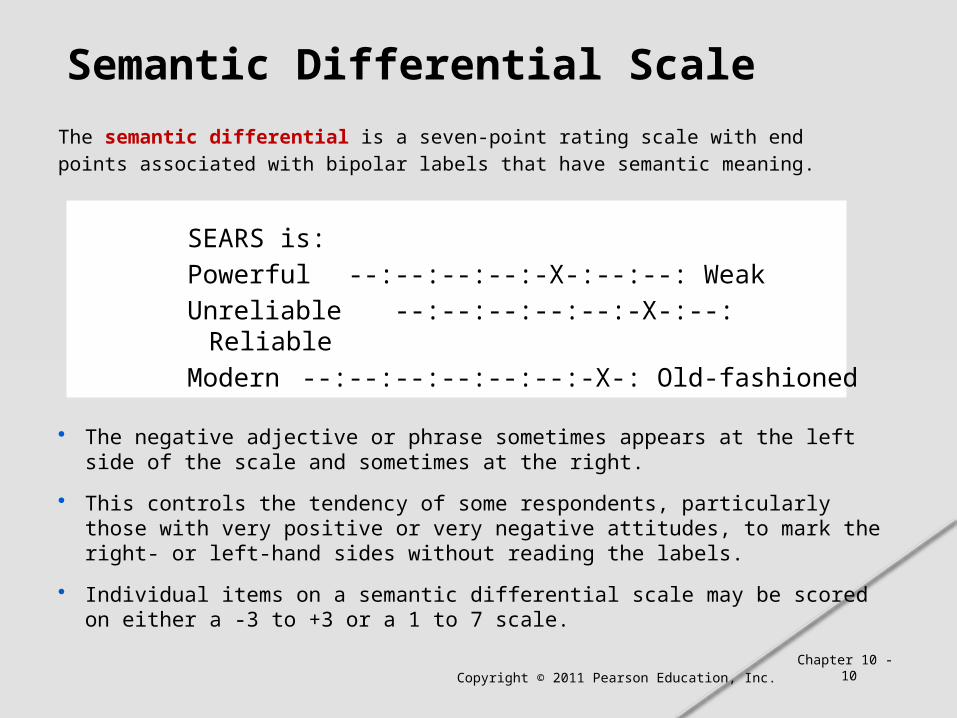
Semantic Differential Scale
The semantic differential is a seven-point rating scale with end
points associated with bipolar labels that have semantic meaning.
Chapter 10 - 10
The negative adjective or phrase sometimes appears at the left side of the scale and sometimes at the right.
This controls the tendency of some respondents, particularly those with very positive or very negative attitudes, to mark the right- or left-hand sides without reading the labels.
Individual items on a semantic differential scale may be scored on either a -3 to +3 or a 1 to 7 scale.
SEARS is:
Powerful --:--:--:--:-X-:--:--: Weak
Unreliable --:--:--:--:--:-X-:--: Reliable
Modern --:--:--:--:--:--:-X-: Old-fashioned
Copyright © 2011 Pearson Education, Inc.
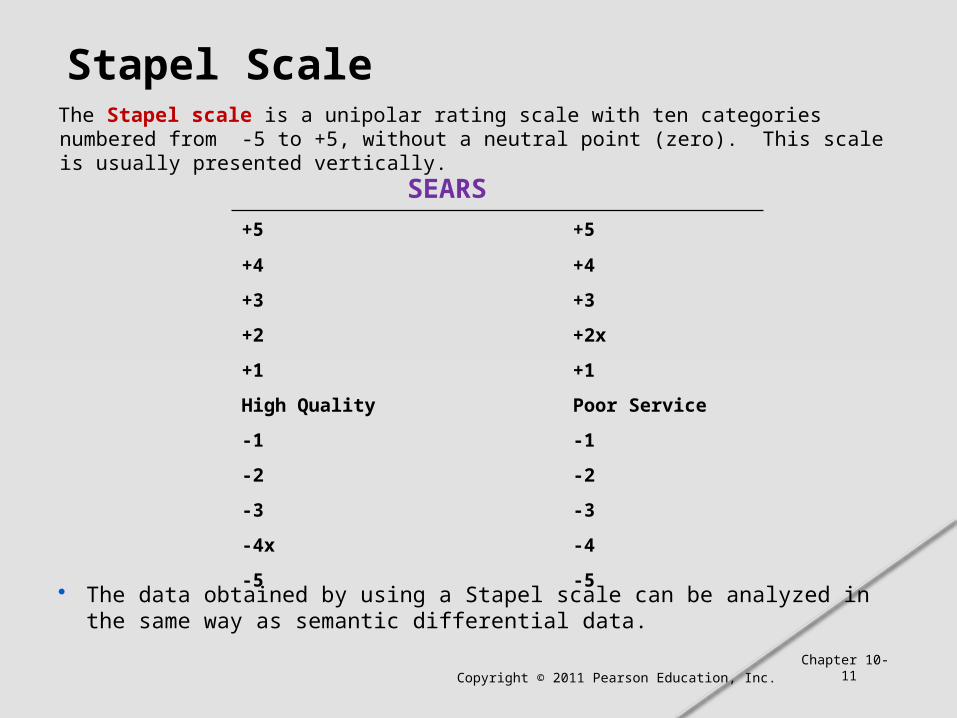
Stapel ScaleThe Stapel scale is a unipolar rating scale with ten categories numbered from -5 to +5, without a neutral point (zero). This scale is usually presented vertically.
Chapter 10- 11
The data obtained by using a Stapel scale can be analyzed in the same way as semantic differential data.
SEARS+5 +5
+4 +4
+3 +3
+2 +2x
+1 +1
High Quality Poor Service
-1 -1
-2 -2
-3 -3
-4x -4
-5 -5
Copyright © 2011 Pearson Education, Inc. Chapter 10 -12
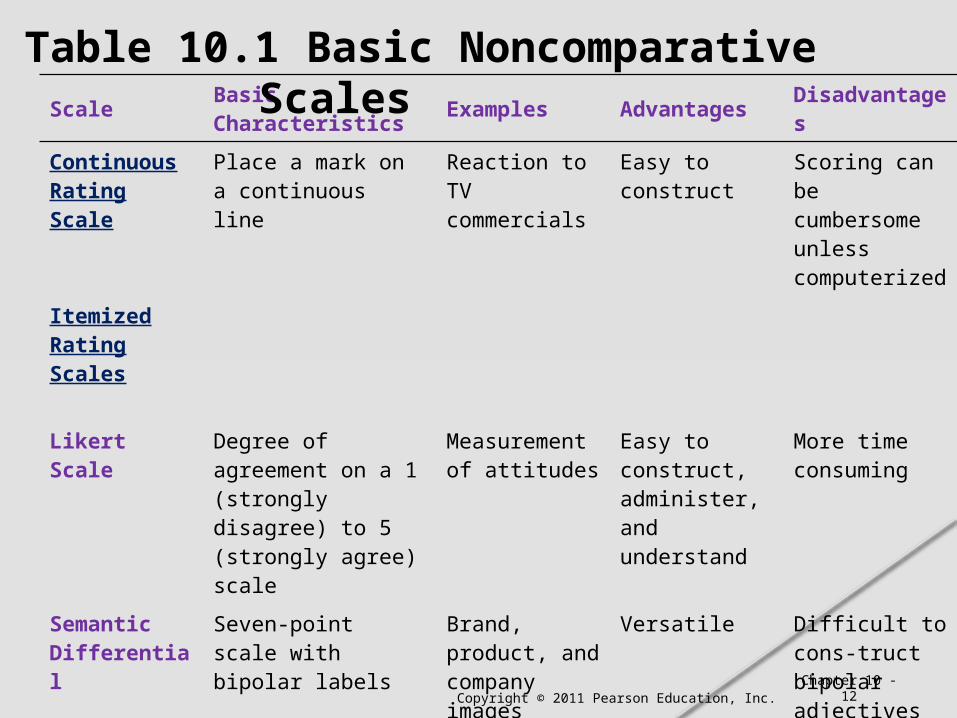
Scale Basic Characteris-tics Examples Advantages Disadvantages
Continuous Rating Scale
Place a mark on a continuous line
Reaction to TV commercials
Easy to con-struct
Scoring can be cumbersome unless comput-erized
ItemizedRating Scales
Likert Scale Degree of agreement on a 1 (strongly dis-agree) to 5 (strongly agree) scale
Measurement of attitudes
Easy to con-struct, adminis-ter, and under-stand
More time con-suming
Semantic Dif-ferential
Seven-point scale withbipolar labels
Brand, product, and company images
Versatile Difficult to cons-truct bipolar ad-jectives
Stapel Scale Unipolar ten-point scale, -5 to +5, without a neutral point (zero)
Measurement of attitudes and images
Easy to con-struct and ad-minister over telephone
Confusing and difficult to apply
Table 10.1 Basic Noncomparative Scales
Copyright © 2011 Pearson Education, Inc.
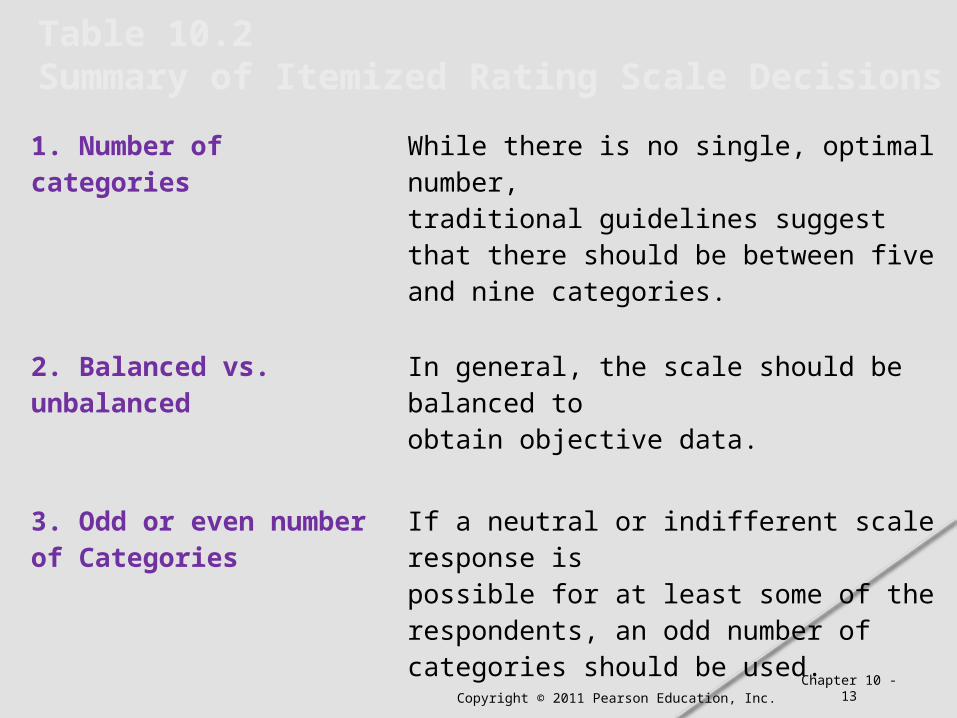
1. Number of categories While there is no single, optimal number, traditional guidelines suggest that there should be between five and nine categories.
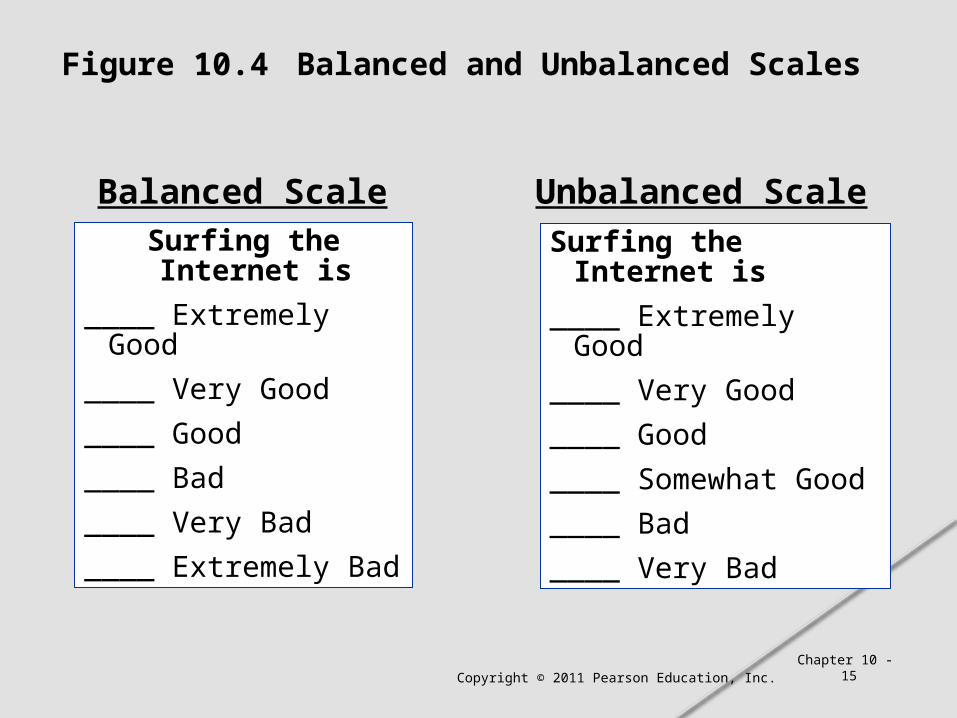
2. Balanced vs. unbalanced In general, the scale should be balanced to obtain objective data.
3. Odd or even number of Categories
If a neutral or indifferent scale response ispossible for at least some of the respondents, an odd number of categories should be used.
Chapter 10 -13
Table 10.2Summary of Itemized Rating Scale Decisions
Copyright © 2011 Pearson Education, Inc.
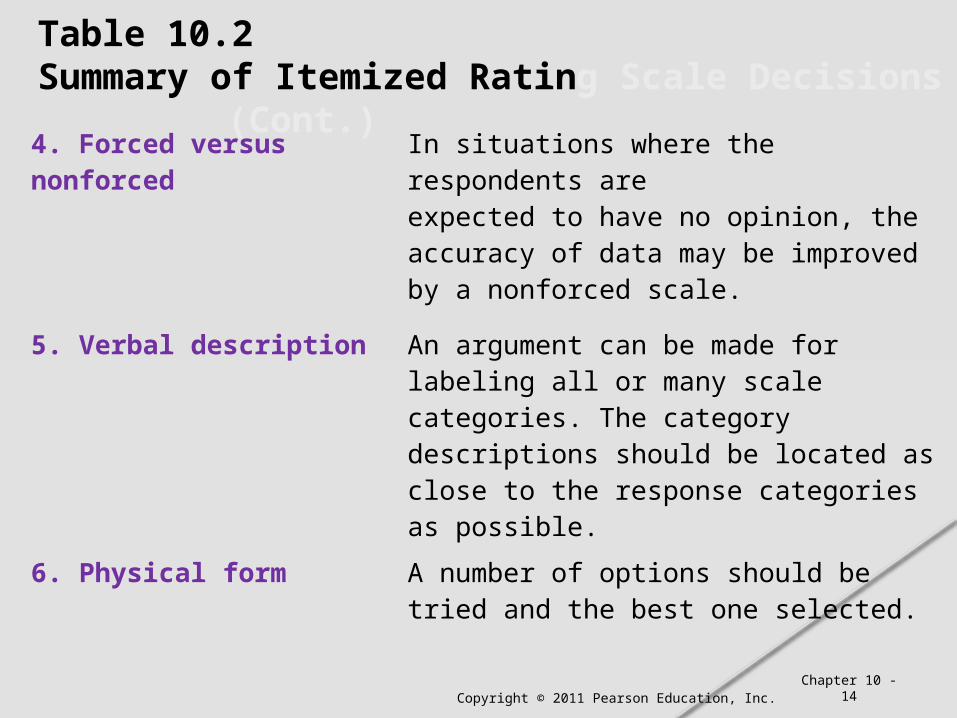
4. Forced versus nonforced In situations where the respondents areexpected to have no opinion, the accuracy of data may be improved by a nonforced scale.
5. Verbal description An argument can be made for labeling all or many scale categories. The categorydescriptions should be located as close to the response categories as possible.
6. Physical form A number of options should be tried and the best one selected.
Chapter 10 -14
Table 10.2Summary of Itemized Rating Scale Decisions (Cont.)
Copyright © 2011 Pearson Education, Inc.
Figure 10.4 Balanced and Unbalanced Scales
Chapter 10 - 15
Surfing the Internet is
____ Extremely Good
____ Very Good
____ Good
____ Bad
____ Very Bad
____ Extremely Bad
Surfing the Internet is
____ Extremely Good
____ Very Good
____ Good
____ Somewhat Good
____ Bad
____ Very Bad
Balanced Scale Unbalanced Scale
Copyright © 2011 Pearson Education, Inc.
Figure 10.5 Rating Scale Configurations
Chapter 10 - 16
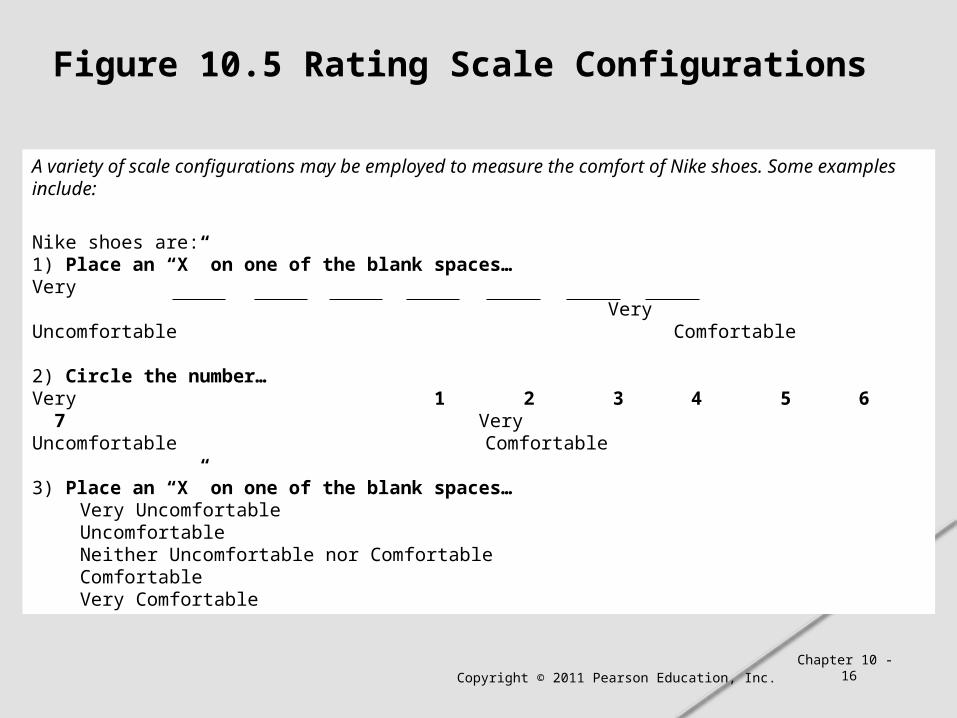
A variety of scale configurations may be employed to measure the comfort of Nike shoes. Some examples include:
Nike shoes are:1) Place an “X” on one of the blank spaces…Very Very Uncomfortable Comfortable
2) Circle the number…Very 1 2 3 4 5 6 7 Very Uncomfortable Comfortable
3) Place an “X” on one of the blank spaces…Very UncomfortableUncomfortableNeither Uncomfortable nor ComfortableComfortableVery Comfortable
Copyright © 2011 Pearson Education, Inc.
Figure 10.5 Rating Scale Configurations (Cont.)
Chapter 10 - 17
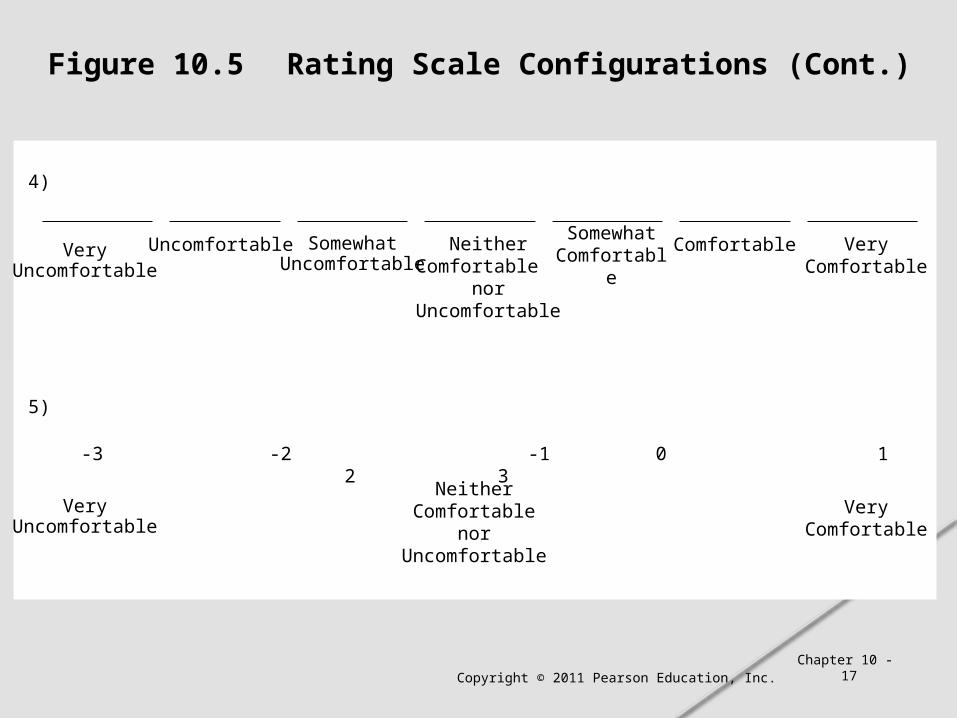
VeryUncomfortable
Uncomfortable SomewhatUncomfortable
Neither Comfortable
nor Uncomfortable
Somewhat Comfortable
Comfortable Very Comfortable
4)
-3 -2 -1 0 1 2 3
VeryUncomfortable
Neither Comfortable nor Uncomfortable
Very Comfortable
5)
Copyright © 2011 Pearson Education, Inc.
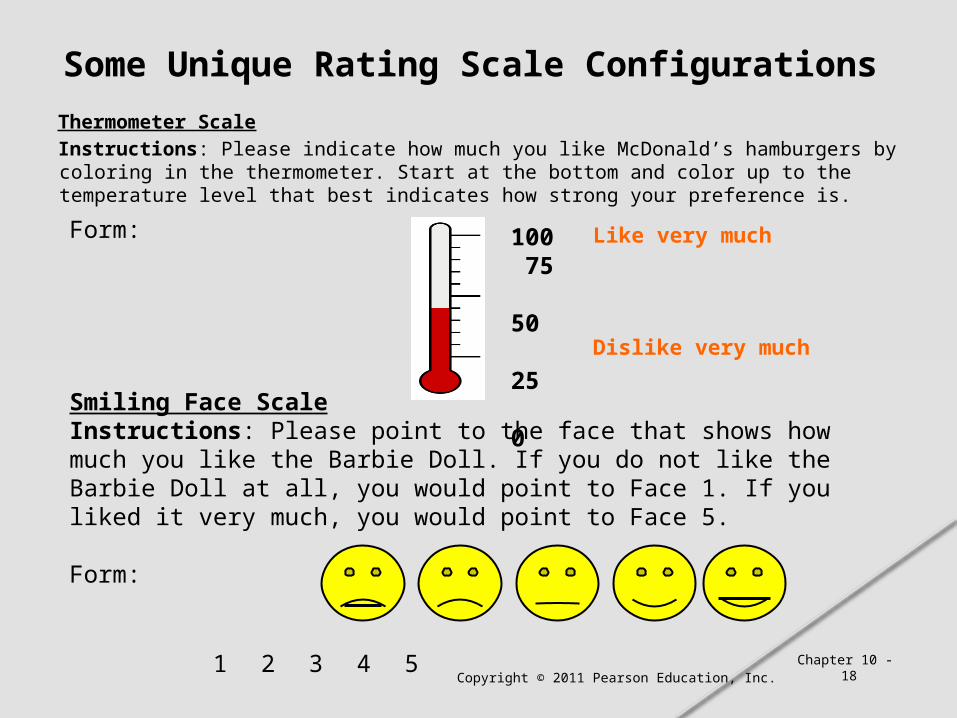
Some Unique Rating Scale Configurations
Thermometer ScaleInstructions: Please indicate how much you like McDonald’s hamburgers by coloring in the thermometer. Start at the bottom and color up to the temperature level that best indicates how strong your preference is.
Chapter 10 - 18
Form:
Smiling Face Scale Instructions: Please point to the face that shows how much you like the Barbie Doll. If you do not like the Barbie Doll at all, you would point to Face 1. If you liked it very much, you would point to Face 5.
Form:
1 2 3 4 5
100 75 50 25 0
Like very much
Dislike very much
Copyright © 2011 Pearson Education, Inc.
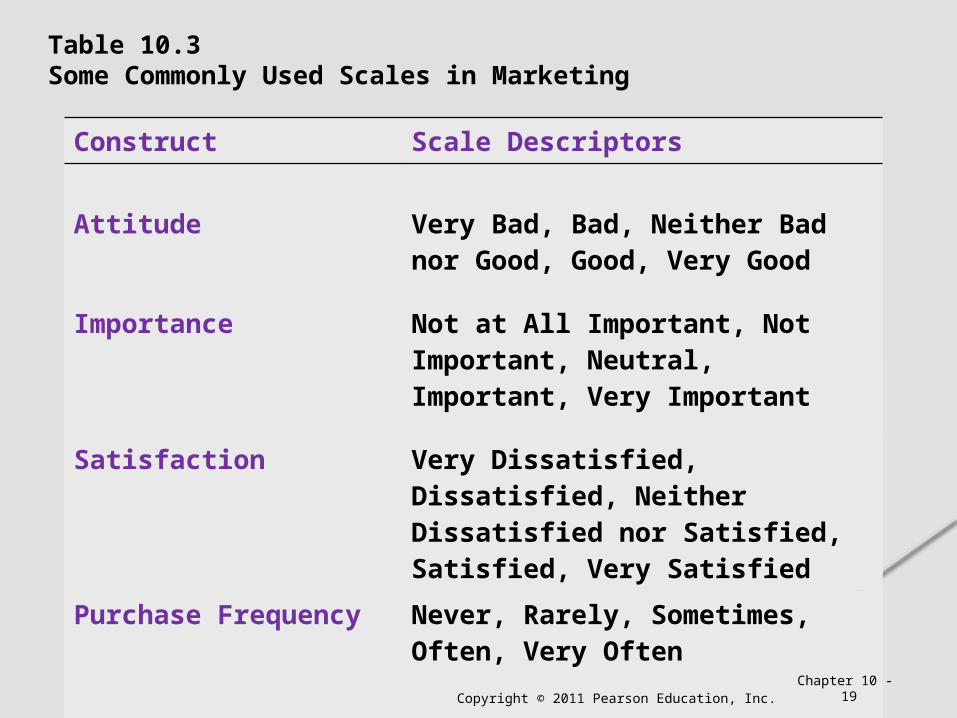
Table 10.3 Some Commonly Used Scales in Marketing
Construct Scale Descriptors
Attitude Very Bad, Bad, Neither Bad nor Good, Good, Very Good
Importance Not at All Important, Not Important, Neutral, Important, Very Important
Satisfaction Very Dissatisfied, Dissatisfied, Nei-ther Dissatisfied nor Satisfied, Sat-isfied, Very Satisfied
Purchase Frequency Never, Rarely, Sometimes, Often, Very Often
Chapter 10 - 19Copyright © 2011 Pearson Education, Inc.
Figure 10.6 Developing a Multi-Item Scale
Chapter 10 - 20Copyright © 2011 Pearson Education, Inc.
Copyright © 2011 Pearson Education, Inc. Chapter 10 - 21
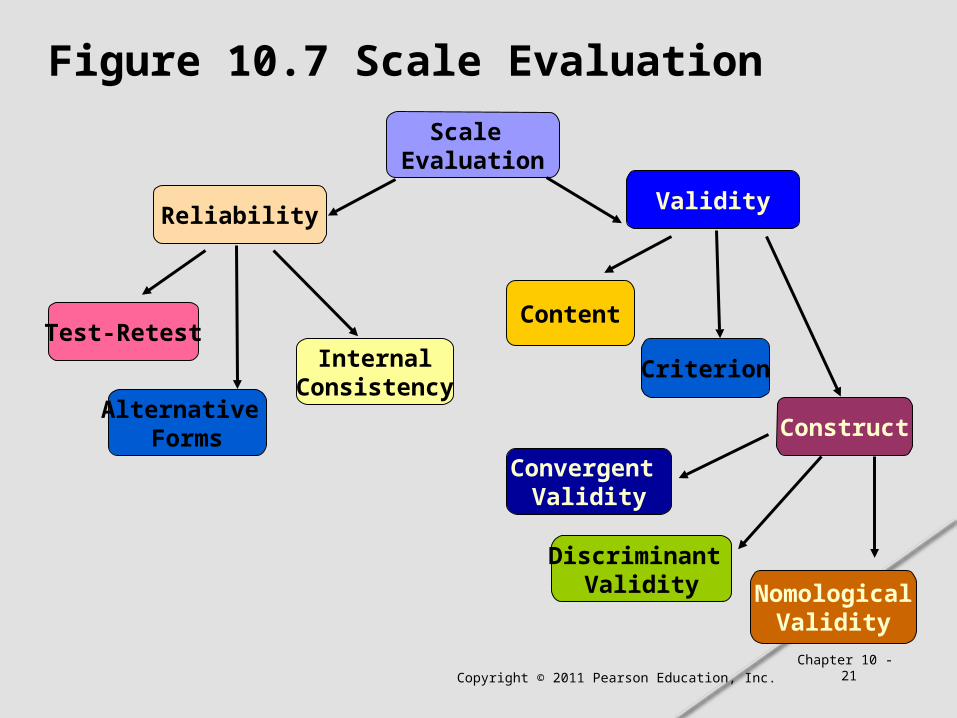
Figure 10.7 Scale Evaluation
Chapter 10 - 21
Scale Evaluation
ReliabilityValidity
Test-RetestInternal
ConsistencyAlternative
Forms Construct
Criterion
Content
Convergent Validity
Discriminant Validity Nomological
Validity
Copyright © 2011 Pearson Education, Inc.
Total Measurement Error
Chapter 10 - 22
Total measurement error is the sum of systematic error and random error.
Total measurement error = Systematic error + Random error
Systematic error affects the measurement in a constant way, that is, in the same way each time the measurement is made.
Random error, in contrast, arises from random changes and has a different effect each time the measurement is made.
Copyright © 2011 Pearson Education, Inc.
Reliability
Chapter 10 - 23
Reliability can be defined as the extent to which measures are free from random error.
In test-retest reliability, respondents are administered identical sets of scale items at two different times and the degree of similarity between the two measurements is determined.
In alternative-forms reliability, two equivalent forms of the scale are constructed and the same respondents are measured at two different times, with a different form being used each time.
Copyright © 2011 Pearson Education, Inc. Chapter 10 - 24
Reliability (Cont.)
Internal consistency reliability determines the extent to which different parts of a summated scale are consistent in what they indicate about the characteristic being measured.
In split-half reliability, the items on the scale are divided into two halves and the resulting half scores are correlated.
The coefficient alpha, or Cronbach's alpha, is the average of all possible split-half coefficients resulting from different ways of splitting the scale items. This coefficient varies from 0 to 1, and a value of 0.6 or less generally indicates unsatisfactory internal consistency reliability.
Copyright © 2011 Pearson Education, Inc.
Validity
Chapter 10 - 25
The validity of a scale may be defined as the extent to which differences in observed scale scores reflect true differences among objects on the characteristic being measured, rather than systematic or random error. Perfect validity requires that there be no measurement error.
Content validity is a subjective but systematic evaluation of how well the content of a scale represents the measurement task at hand.
Copyright © 2011 Pearson Education, Inc.
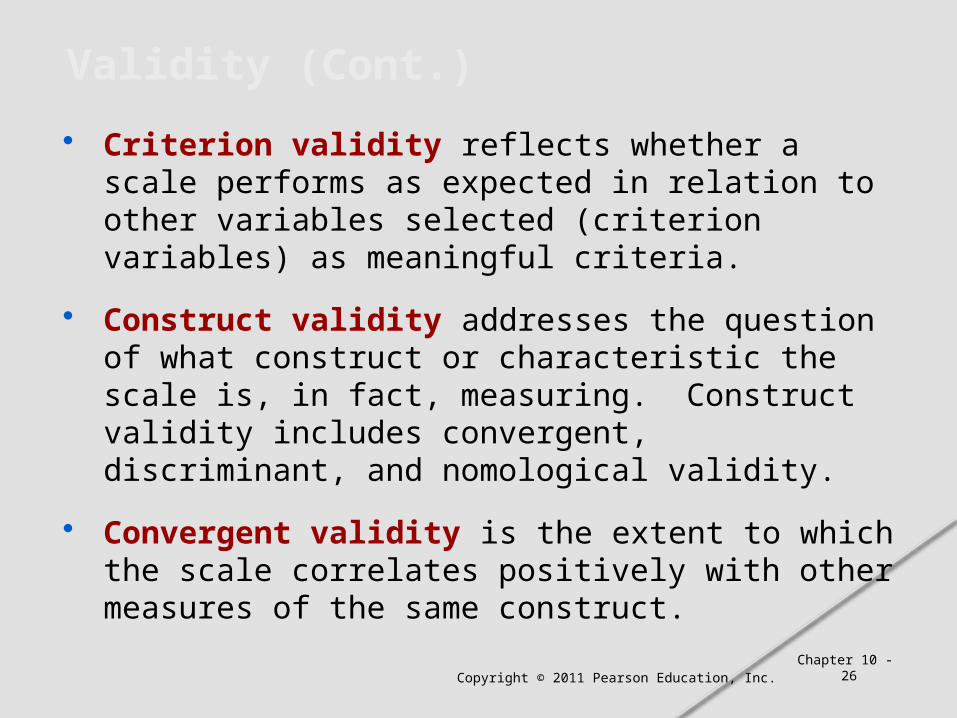
Criterion validity reflects whether a scale performs as expected in relation to other variables selected (criterion variables) as meaningful criteria.
Construct validity addresses the question of what construct or characteristic the scale is, in fact, measuring. Construct validity includes convergent, discriminant, and nomological validity.
Convergent validity is the extent to which the scale correlates positively with other measures of the same construct.
Chapter 10 - 26
Validity (Cont.)
Copyright © 2011 Pearson Education, Inc. Chapter 10 - 27
Validity (Cont.)
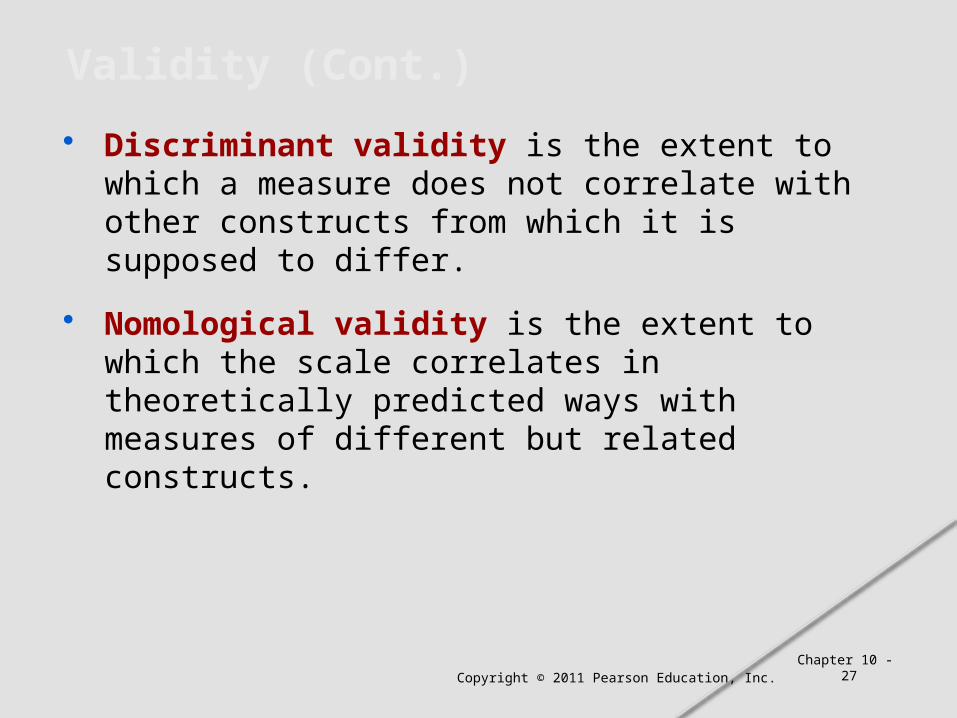
Discriminant validity is the extent to which a measure does not correlate with other constructs from which it is supposed to differ.
Nomological validity is the extent to which the scale correlates in theoretically predicted ways with measures of different but related constructs.
Copyright © 2011 Pearson Education, Inc. Chapter 10 - 28
Relationship Between Reliability and Validity
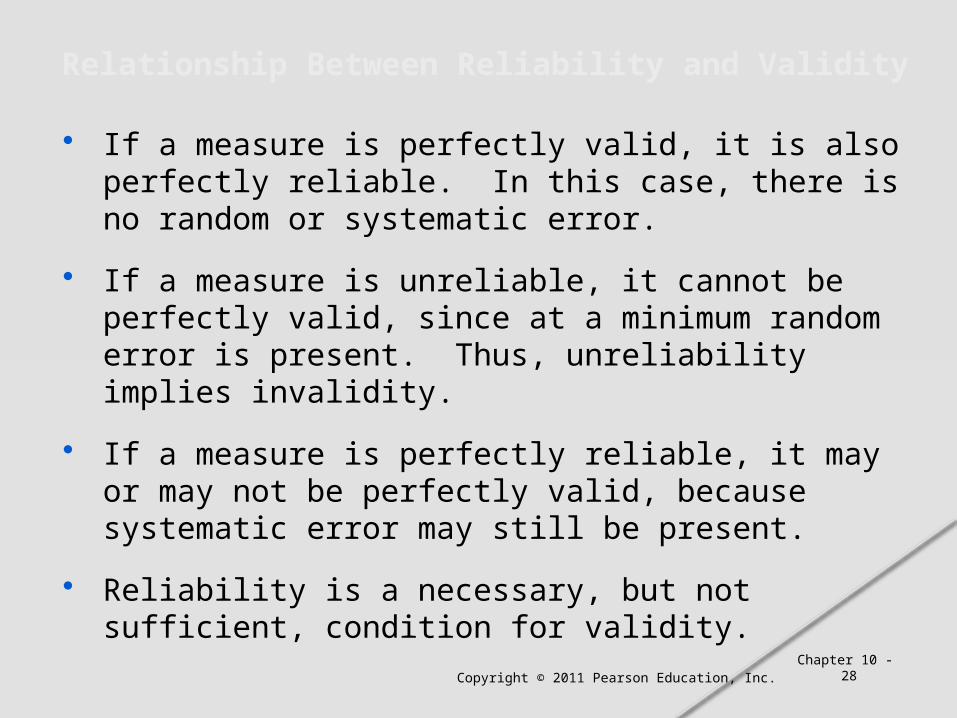
If a measure is perfectly valid, it is also perfectly reliable. In this case, there is no random or systematic error.
If a measure is unreliable, it cannot be perfectly valid, since at a minimum random error is present. Thus, unreliability implies invalidity.
If a measure is perfectly reliable, it may or may not be perfectly valid, because systematic error may still be present.
Reliability is a necessary, but not sufficient, condition for validity.
Chapter 10 - 29Copyright © 2011 Pearson Education, Inc.
Copyright © 2011 Pearson Education, Inc.
International Marketing Research
Pan-cultural scales, designed to be free of cultural biases, are used in international research.
An approach to developing pan-cultural scales is to use descriptors the respondents create themselves. The end descriptors used to anchor the scale are particularly prone to different interpretations.
Additionally, the scale numbering may have different meanings. In such cases, it might be desirable to avoid numbers and to just use boxes that respondent can check.
Chapter 10 - 30
Copyright © 2011 Pearson Education, Inc.
International Marketing Research (Cont.)
Of the scaling techniques considered, the semantic differential has been applied with the greatest consistency in results across countries.
Rating scales also are used to construct indexes used to make global comparisons.
Chapter 10 - 31
Copyright © 2011 Pearson Education, Inc.
Marketing Research & Social Media
All the noncomparative scales can be easily implemented in social media.
An analysis of social media content can provide guidance on whether continuous or itemized rating scales should be used. It can also aid the researcher in making appropriate rating scale decisions.
It is feasible to employ more than one scaling method to measure a given construct.
Chapter 10 - 32
Copyright © 2011 Pearson Education, Inc.
Ethics in Marketing Research
The researcher’s should not deliberately bias the results by building that bias into noncomparative scales.
The researcher should establish the reliability and validity of scales.
The researcher has a responsibility to both the client and respondents to ensure the applicability and usefulness of the scales.
Chapter 10 - 33
Copyright © 2011 Pearson Education, Inc.
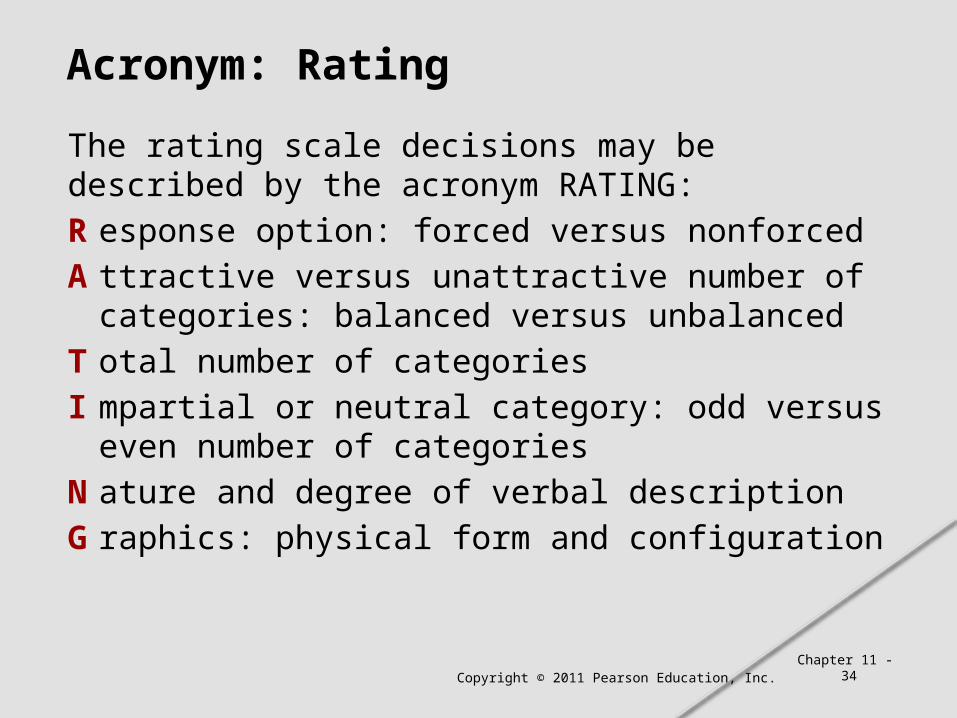
Acronym: Rating
The rating scale decisions may be described by the acronym RATING:
R esponse option: forced versus nonforced
A ttractive versus unattractive number of categories: balanced versus unbalanced
T otal number of categories
I mpartial or neutral category: odd versus even number of categories
N ature and degree of verbal description
G raphics: physical form and configuration
Chapter 11 - 34