Embed Size (px)
Citation preview
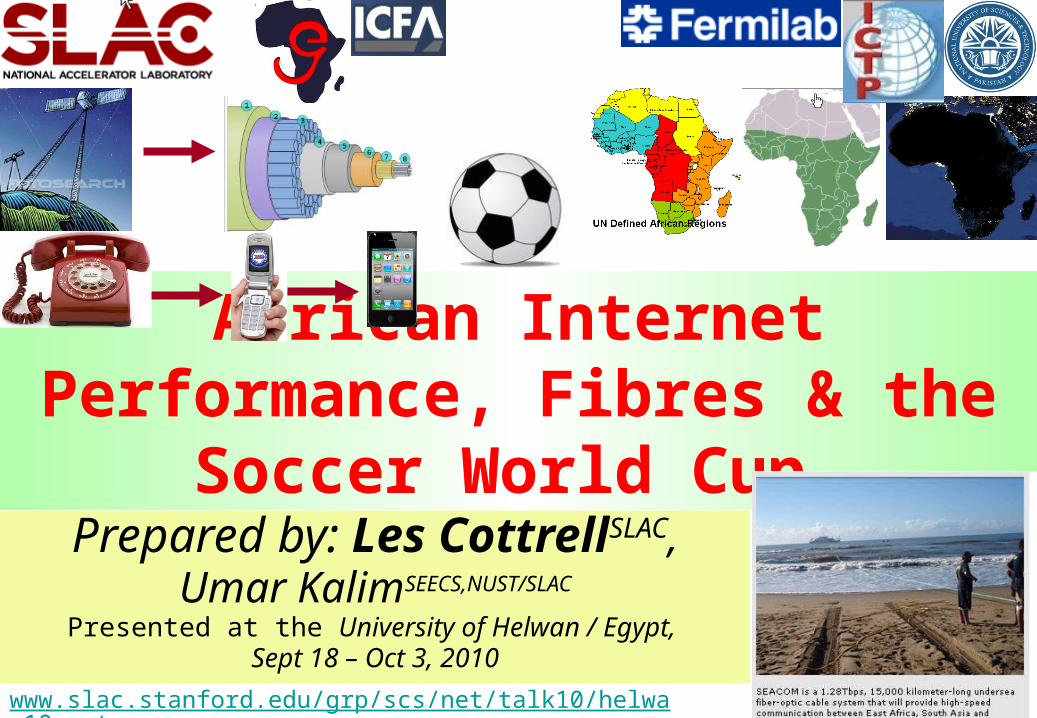
1www.slac.stanford.edu/grp/scs/net/talk10/helwan10.ppt
African Internet Performance, Fibres & the Soccer World Cup
Prepared by: Les CottrellSLAC,Umar KalimSEECS,NUST/SLAC
Presented at the University of Helwan / Egypt, Sept 18 – Oct 3, 2010
Outline• Why does it matter?• How do we measure?• What do we find?• What is happening and its impact• What’s next?• Conclusions
2
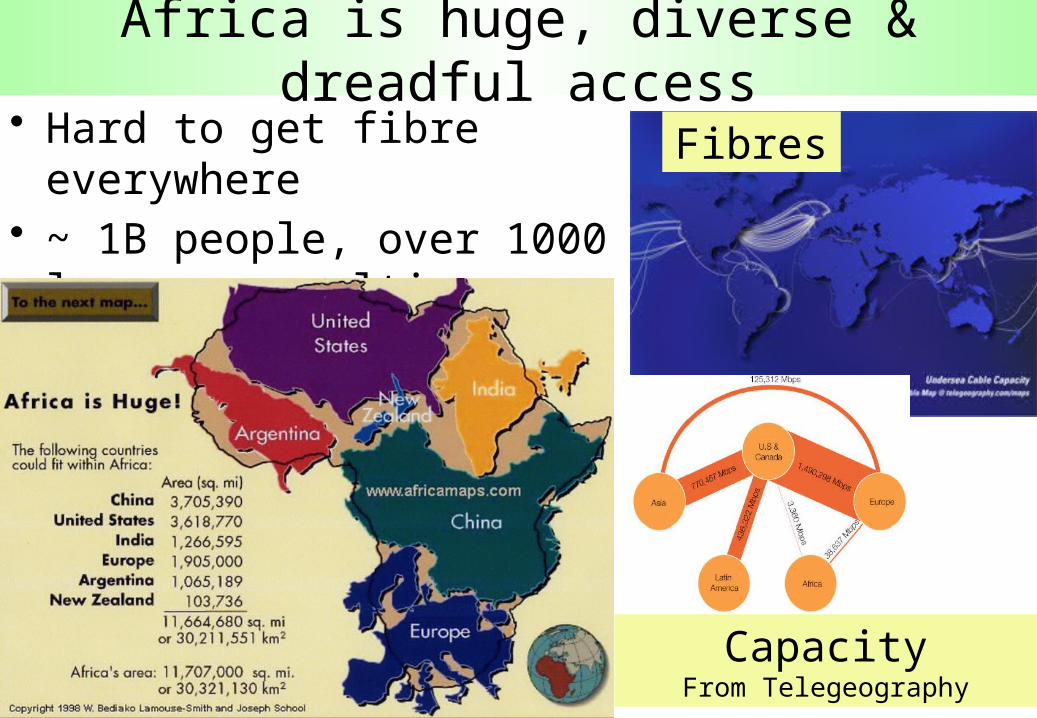
Africa is huge, diverse & dreadful access• Hard to get fibre everywhere• ~ 1B people, over 1000
languages,multi climates
3
Fibres
CapacityFrom Telegeography
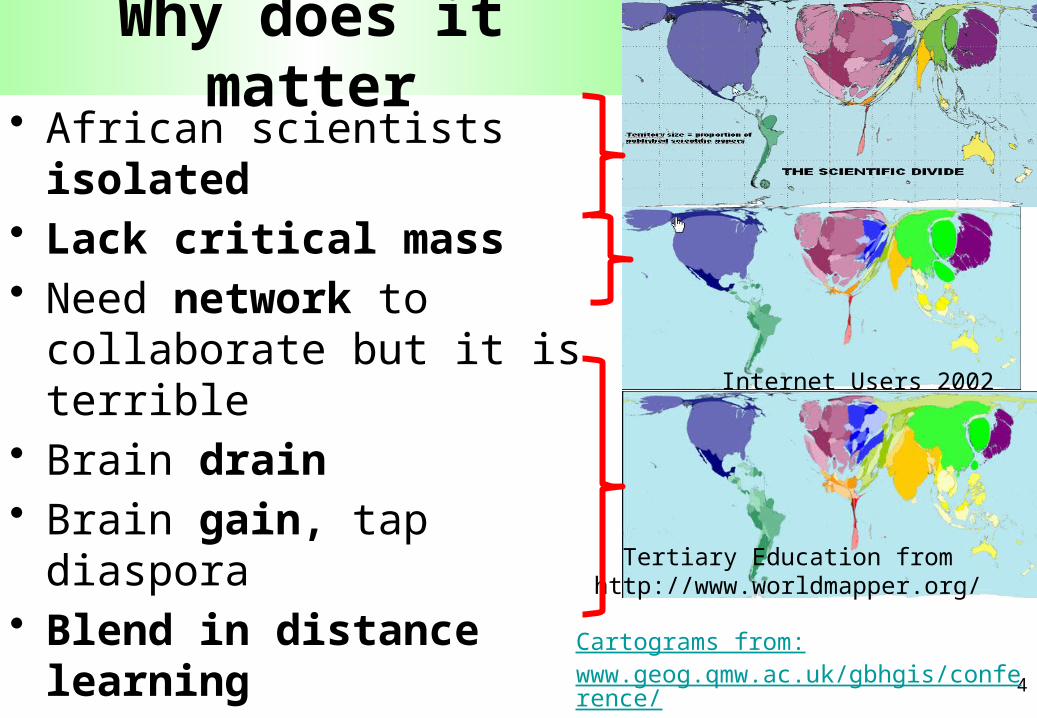
Why does it matter• African scientists isolated• Lack critical mass• Need network to collaborate
but it is terrible• Brain drain• Brain gain, tap diaspora• Blend in distance learning• Provide leadership, train
trainers
4
Internet Users 2002
Cartograms from:www.geog.qmw.ac.uk/gbhgis/conference/cartogram.html
Tertiary Education fromhttp://www.worldmapper.org/
55
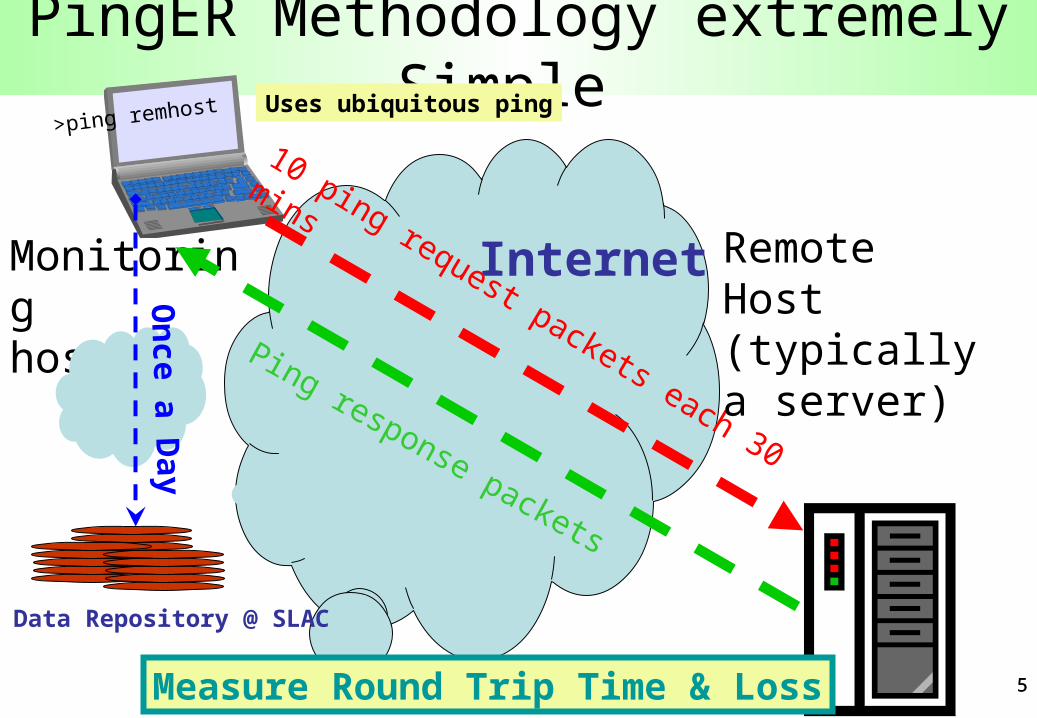
PingER Methodology extremely Simple
Internet
10 ping request packets each 30 mins
RemoteHost(typicallya server)
Monitoring host
>ping remhost
Ping response packets
Measure Round Trip Time & Loss
Data Repository @ SLAC
On
ce a Day
Uses ubiquitous ping
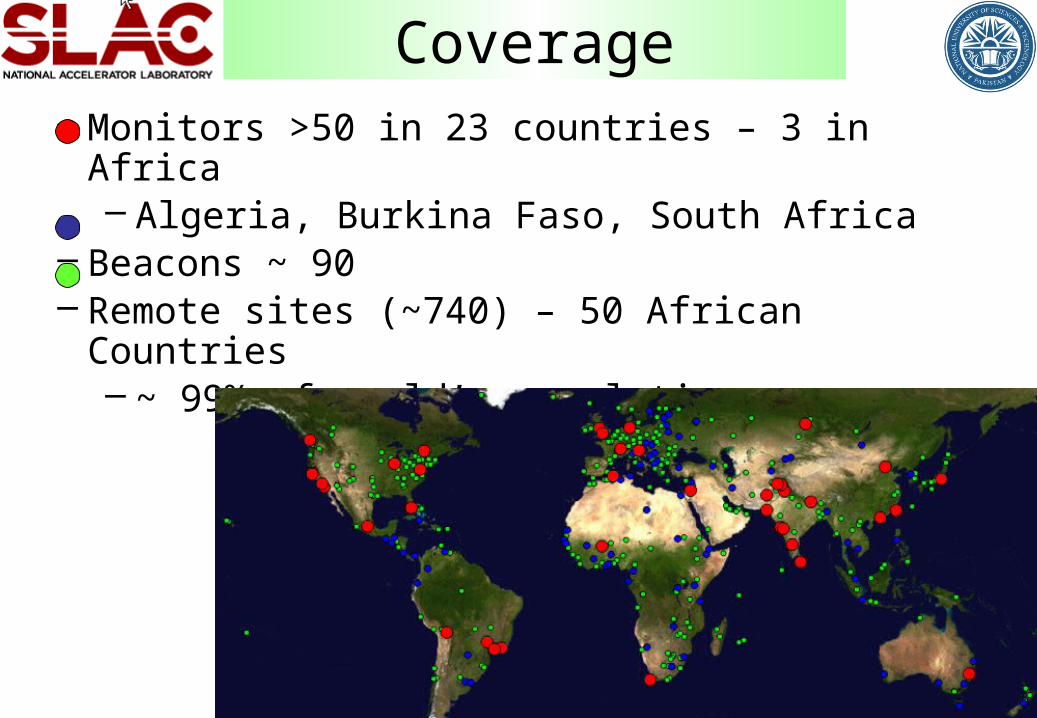
Coverage
6
6
– Monitors >50 in 23 countries – 3 in Africa – Algeria, Burkina Faso, South Africa
– Beacons ~ 90– Remote sites (~740) – 50 African Countries
– ~ 99% of world’s population
7
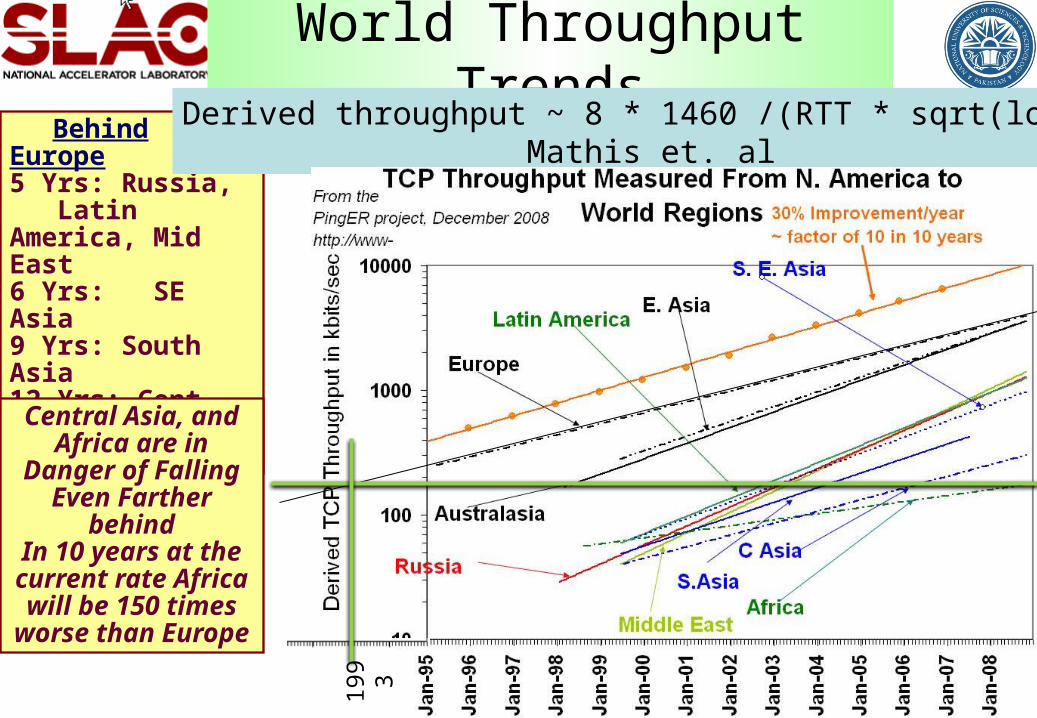
World Throughput Trends Behind Europe5 Yrs: Russia, Latin America, Mid East 6 Yrs: SE Asia9 Yrs: South Asia12 Yrs: Cent. Asia16 Yrs: Africa
Central Asia, and Africa are in
Danger of Falling Even Farther
behindIn 10 years at the current rate Africa will be 150 times
worse than Europe
Derived throughput ~ 8 * 1460 /(RTT * sqrt(loss))Mathis et. al
1993
Compare PingER with ICT Development Index (IDI) from ITU
• IDI = ICT readiness + usage + skills• Readiness (infrastructure access)
– phone (cell & fixed) subscriptions, international BW, %households with computers, and % households with Internet access
• Usage (intensity of current usage)– % population are Internet users, %mobile, and fixed
broadband users• Skills (capability)
– Literacy, secondary & tertiary education
8www.itu.int/ITU-D/ict/publications/idi/2009/material/IDI2009_w5.pdf
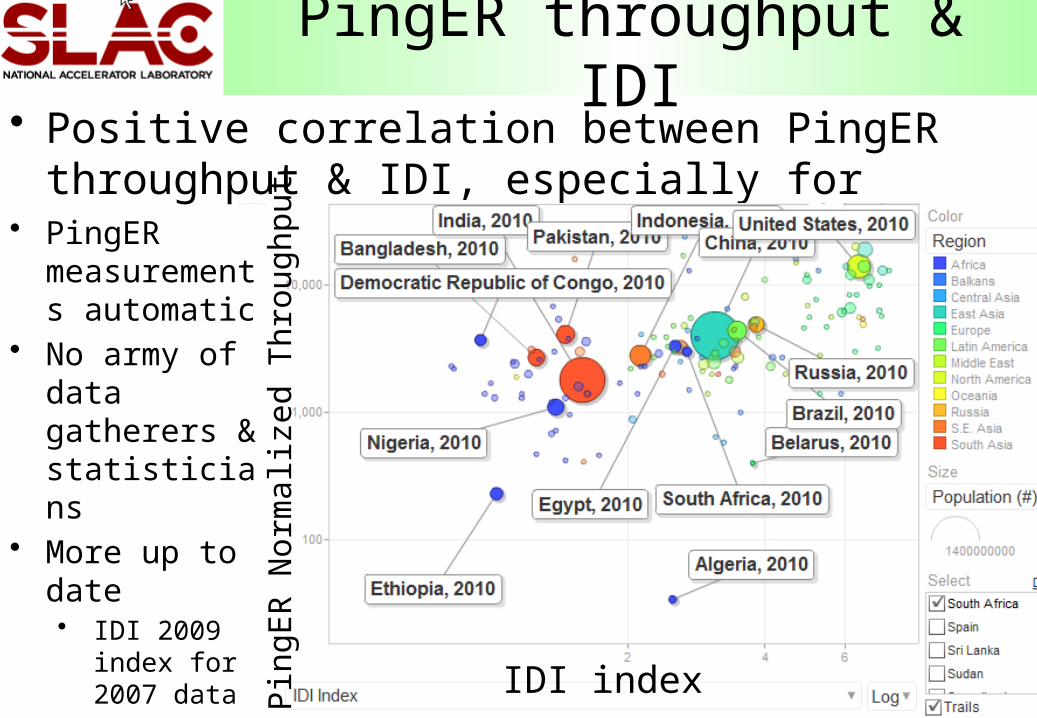
PingER throughput & IDI• Positive correlation between PingER throughput &
IDI, especially for populous countries
9
• PingER measurements automatic
• No army of data gatherers & statisticians
• More up to date• IDI 2009 index
for 2007 data
• Good validation• Anomalies
interesting IDI index
Pin
gER
Nor
mal
ized
Thr
ough
put
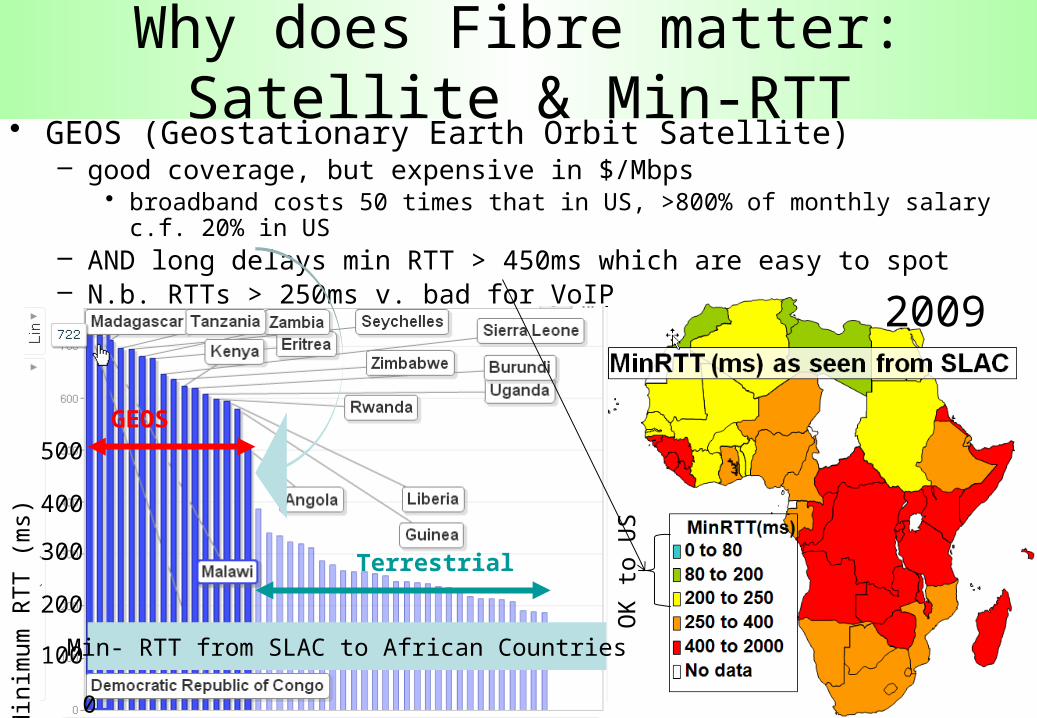
Why does Fibre matter: Satellite & Min-RTT
• GEOS (Geostationary Earth Orbit Satellite)– good coverage, but expensive in $/Mbps
• broadband costs 50 times that in US, >800% of monthly salary c.f. 20% in US– AND long delays min RTT > 450ms which are easy to spot– N.b. RTTs > 250ms v. bad for VoIP
Min
imum
RT
T (
ms)
Min- RTT from SLAC to African Countries
Terrestrial
GEOS
2009
OK
to
US
500
300
100
200
400
0
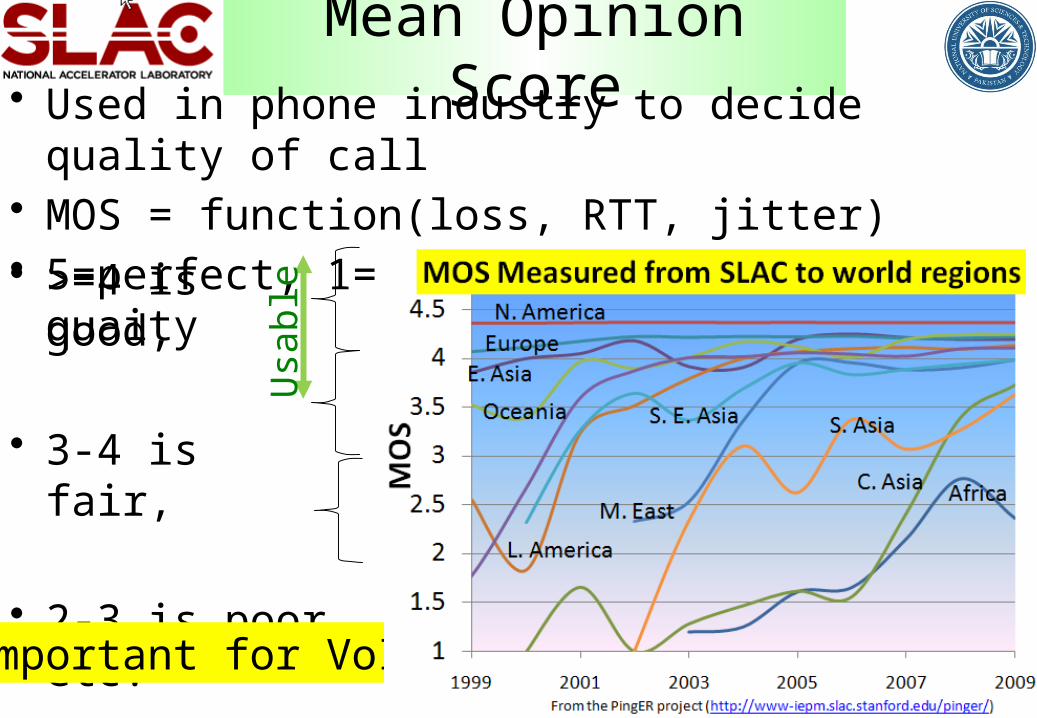
Mean Opinion Score• Used in phone industry to decide quality of call• MOS = function(loss, RTT, jitter)• 5=perfect, 1= lowest perceived audible quaity
11
• >=4 is good,
• 3-4 is fair,
• 2-3 is poor etc.
Important for VoIP
Usa
ble
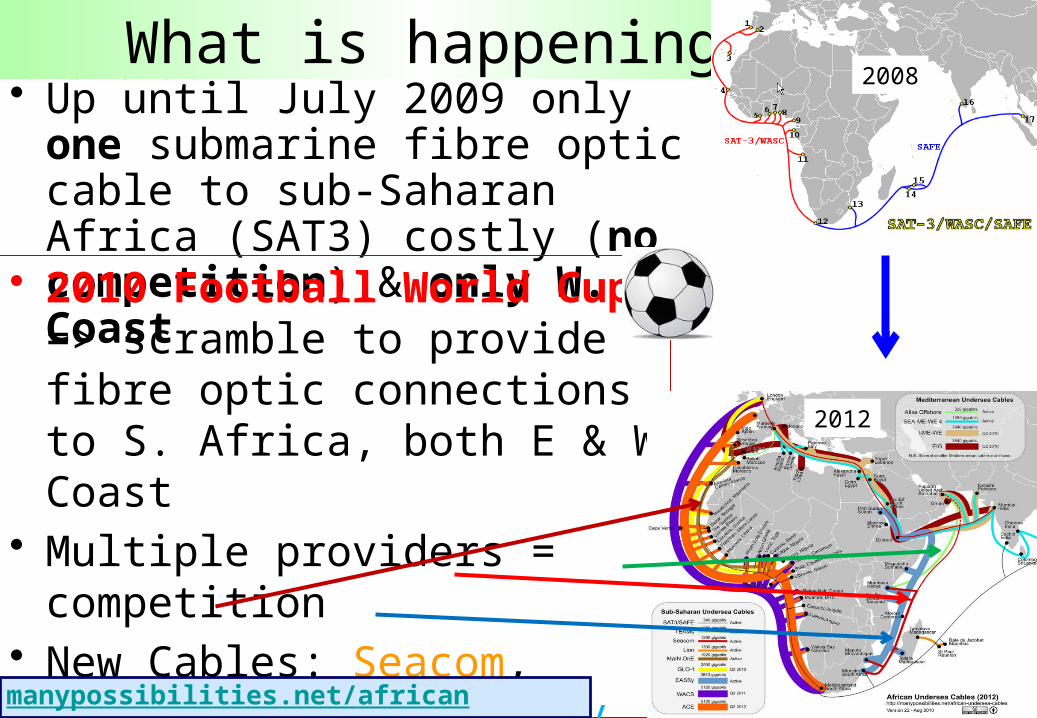
What is happening• Up until July 2009 only one
submarine fibre optic cable to sub-Saharan Africa (SAT3) costly (no competition) & only W. Coast
• 2010 Football World Cup => scramble to provide fibre optic connections to S. Africa, both E & W Coast
• Multiple providers = competition• New Cables: Seacom, TEAMs,
Main one, EASSy, already in production
2008
2012
manypossibilities.net/african-undersea-cables
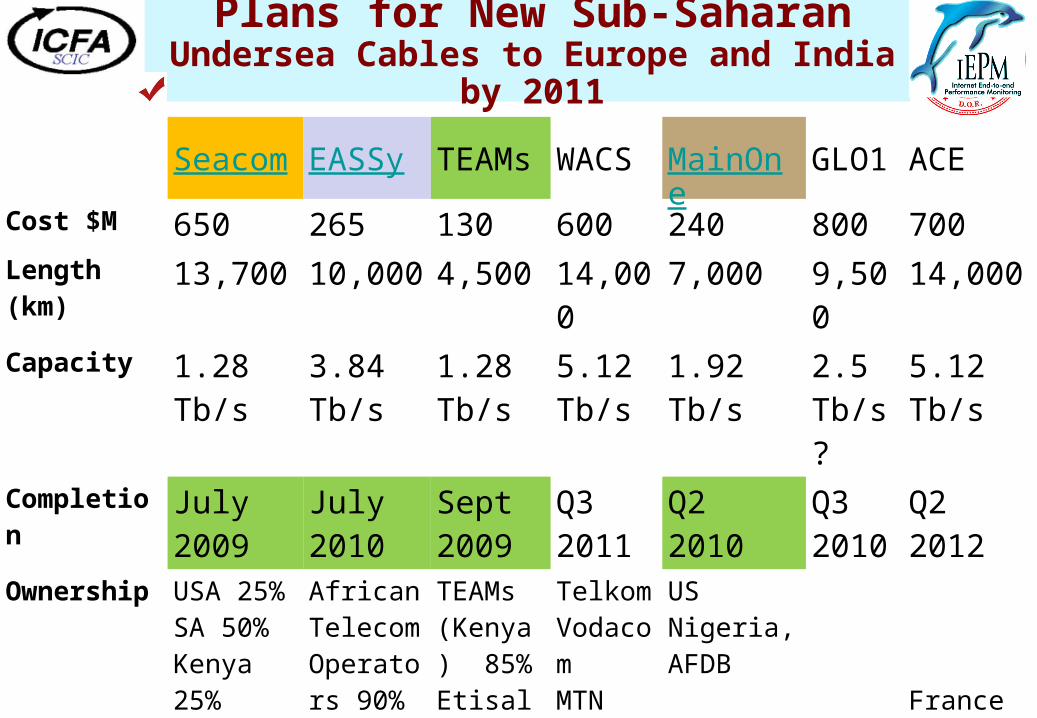
Plans for New Sub-SaharanUndersea Cables to Europe and India by 2011
Seacom EASSy TEAMs WACS MainOne GLO1 ACE
Cost $M 650 265 130 600 240 800 700Length (km) 13,700 10,000 4,500 14,000 7,000 9,500 14,000Capacity 1.28
Tb/s3.84 Tb/s
1.28 Tb/s
5.12 Tb/s
1.92 Tb/s 2.5 Tb/s?
5.12 Tb/s
Completion July 2009
July 2010
Sept 2009
Q3 2011
Q2 2010 Q3 2010
Q2 2012
Ownership USA 25%SA 50%Kenya 25%
AfricanTelecomOperators 90%
TEAMs (Kenya) 85%Etisalaat (UAE) 15%
TelkomVodacomMTNTata (Neotel)Infraco et al
US Nigeria, AFDB
FranceTelecom et al
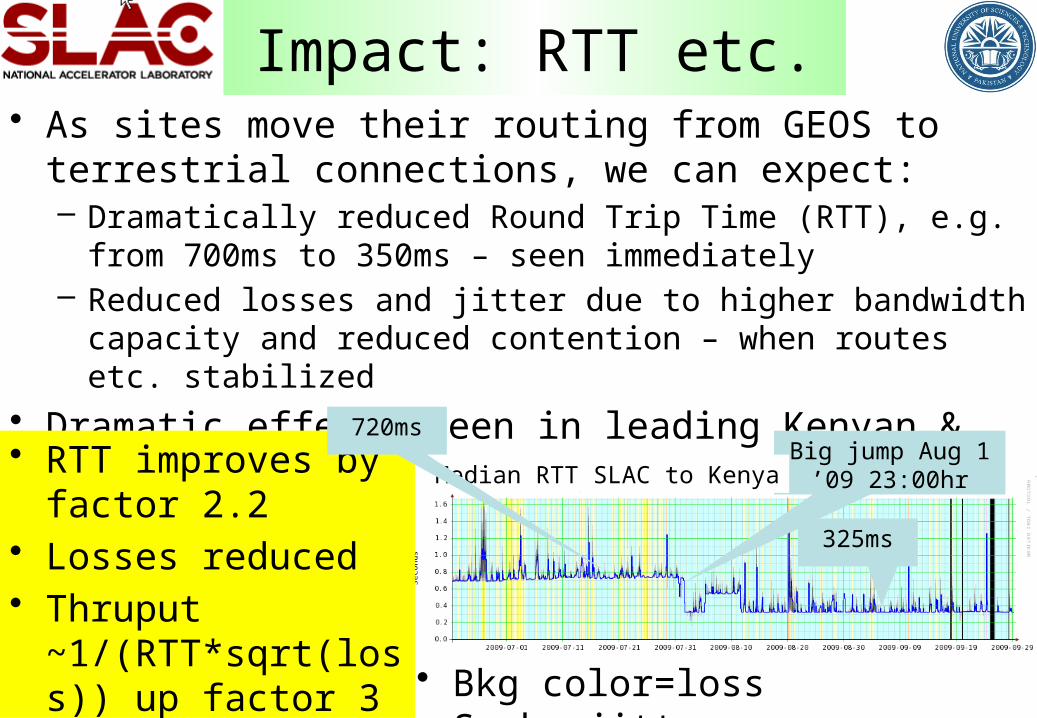
Impact: RTT etc.• As sites move their routing from GEOS to terrestrial
connections, we can expect:– Dramatically reduced Round Trip Time (RTT), e.g. from 700ms to
350ms – seen immediately– Reduced losses and jitter due to higher bandwidth capacity and
reduced contention – when routes etc. stabilized
• Dramatic effects seen in leading Kenyan & Ugandan hosts
325ms
Big jump Aug 1 ’09 23:00hrMedian RTT SLAC to Kenya
• Bkg color=loss Smoke=jitter
• RTT improves by factor 2.2
• Losses reduced• Thruput
~1/(RTT*sqrt(loss)) up factor 3
720ms
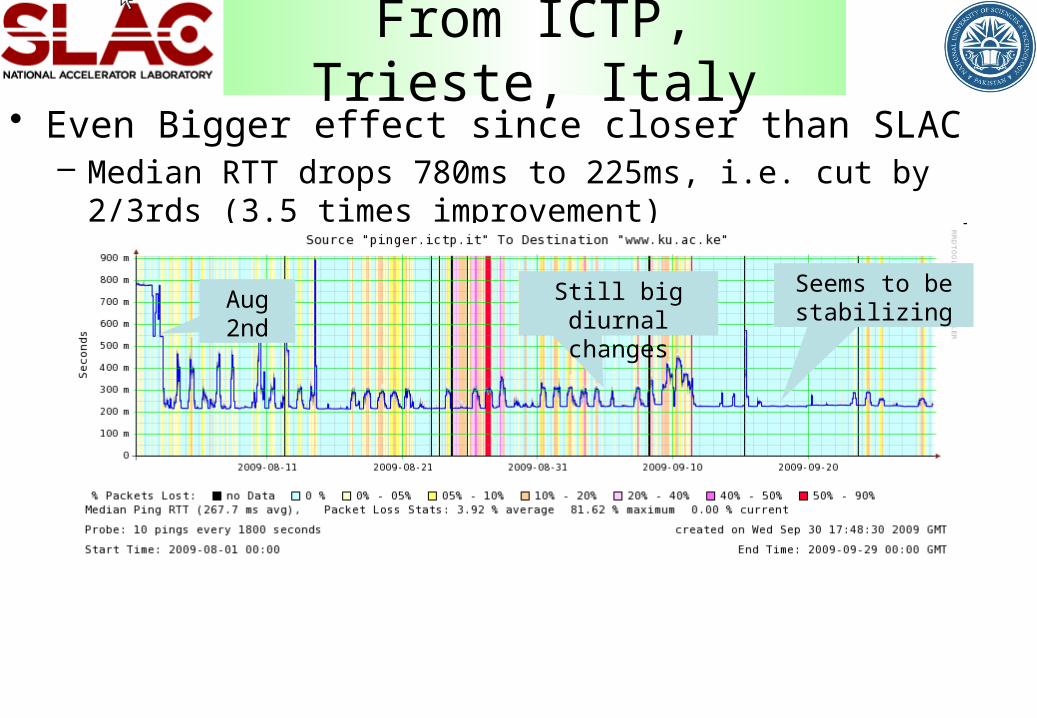
From ICTP, Trieste, Italy• Even Bigger effect since closer than SLAC
– Median RTT drops 780ms to 225ms, i.e. cut by 2/3rds (3.5 times improvement)
Aug 2nd
Seems to be stabilizing
Still big diurnal changes

Other countries• Angola step mid-May, more stable
• Zambia one direction reduce 720>550ms– Unstable, still
trying?• Tanzania, also
dramatic reduction in losses
• Uganda inland via Kenya, 2 step process
• Many sites still to connect
750ms 450ms
Aug 20
SLAC to Angola
SLAC to Zambia
SLAC to Tanzania
SLAC to Uganda
1 direction
Both directions
Sep 27
1 direction Both directions?

Next Steps: Going inland
Central
Northern
Southern
www.ubuntunet.net/fibre-map
Inter Africa fibre network
•Connect up the rest of the sites & countries•Extend coverage from landing points to capitals and major cites • Need fibre
connections inland
• They exist• Most universities
located nearby
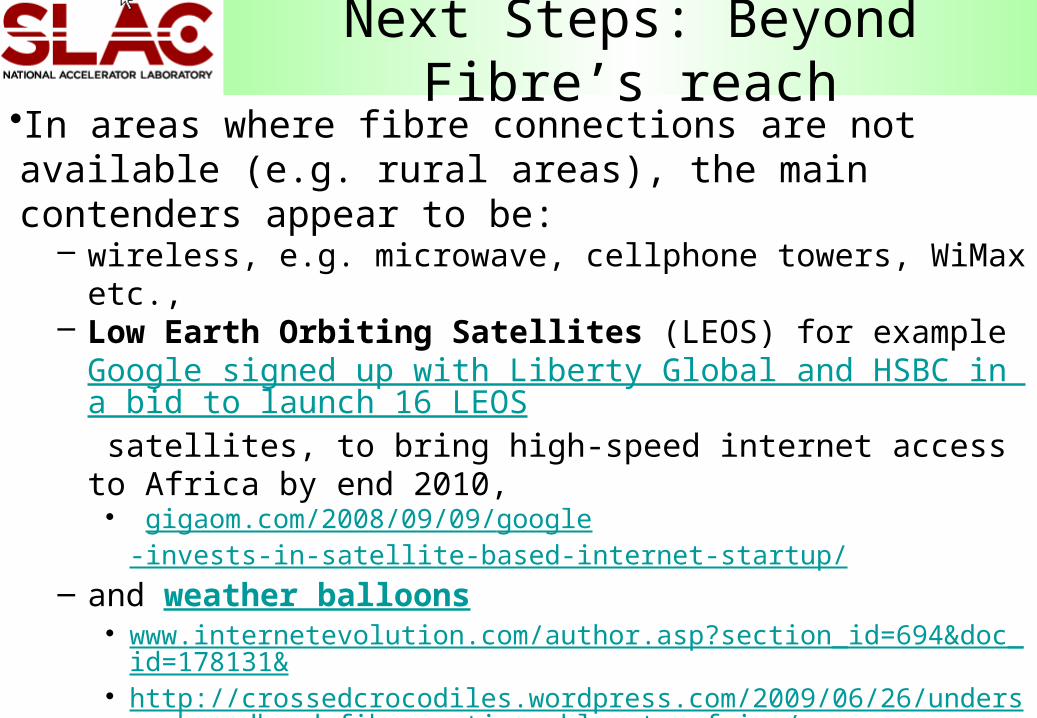
Next Steps: Beyond Fibre’s reach•In areas where fibre connections are not available (e.g. rural areas), the main contenders appear to be:
– wireless, e.g. microwave, cellphone towers, WiMax etc., – Low Earth Orbiting Satellites (LEOS) for example
Google signed up with Liberty Global and HSBC in a bid to launch 16 LEOS satellites, to bring high-speed internet access to Africa by end 2010,• gigaom.com/2008/09/09/google-invests-in-satellite-based-internet-startup/
– and weather balloons• www.internetevolution.com/author.asp?section_id=694&doc_id=178131&• http://crossedcrocodiles.wordpress.com/2009/06/26/undersea-broadband-fi
ber-optic-cables-to-africa/
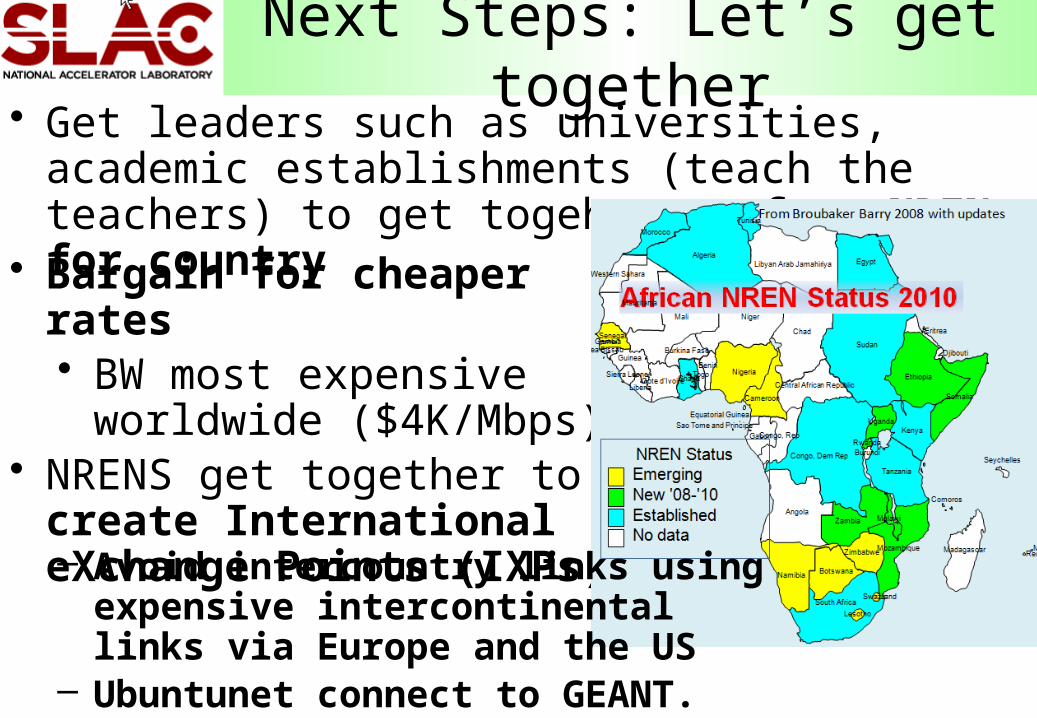
Next Steps: Let’s get together• Get leaders such as universities, academic
establishments (teach the teachers) to get togeher to form NRENs for country
• Bargain for cheaper rates• BW most expensive
worldwide ($4K/Mbps)• NRENS get together to
create International eXchange Points (IXPs)– Avoid intercountry links using
expensive intercontinental links via Europe and the US
– Ubuntunet connect to GEANT.
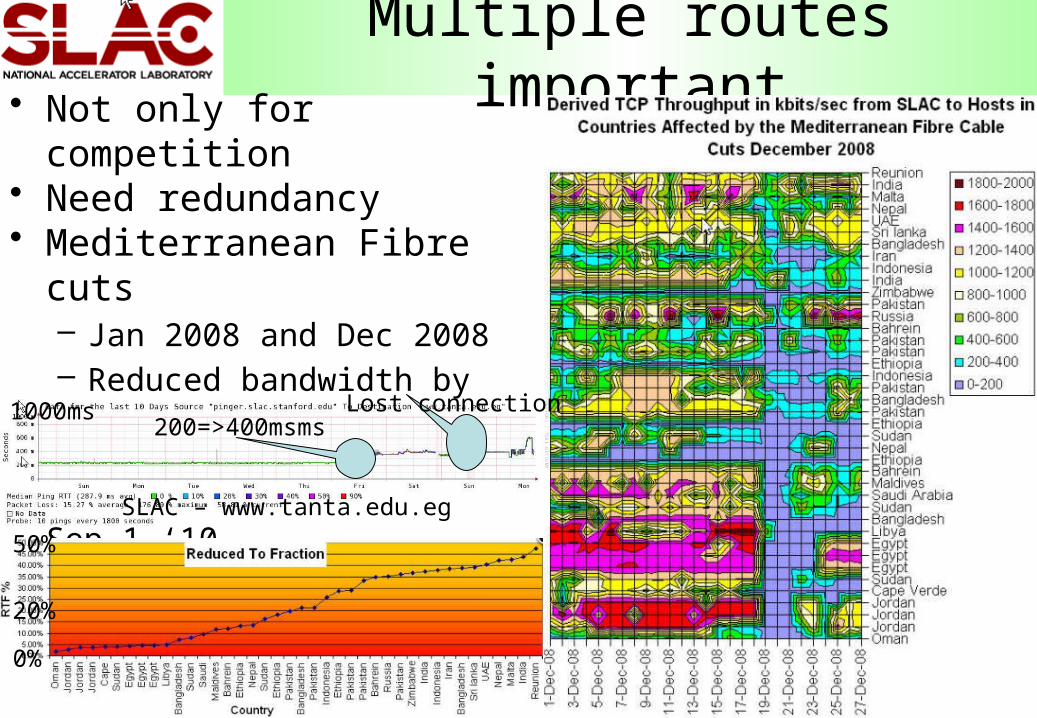
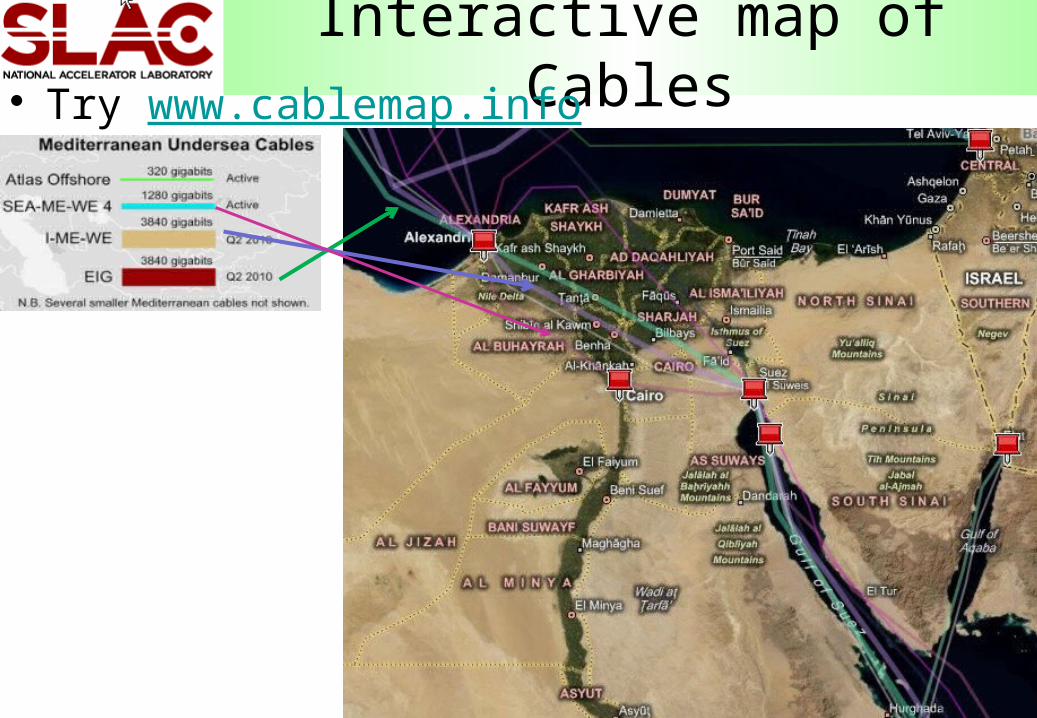
Multiple routes important• Not only for competition• Need redundancy• Mediterranean Fibre cuts
– Jan 2008 and Dec 2008– Reduced bandwidth by over
50% to over 20 countries • New cable France-Egypt Sep 1 ‘10
21
1000ms200=>400msms
Lost connection
SLAC – www.tanta.edu.eg
50%
20%
0%
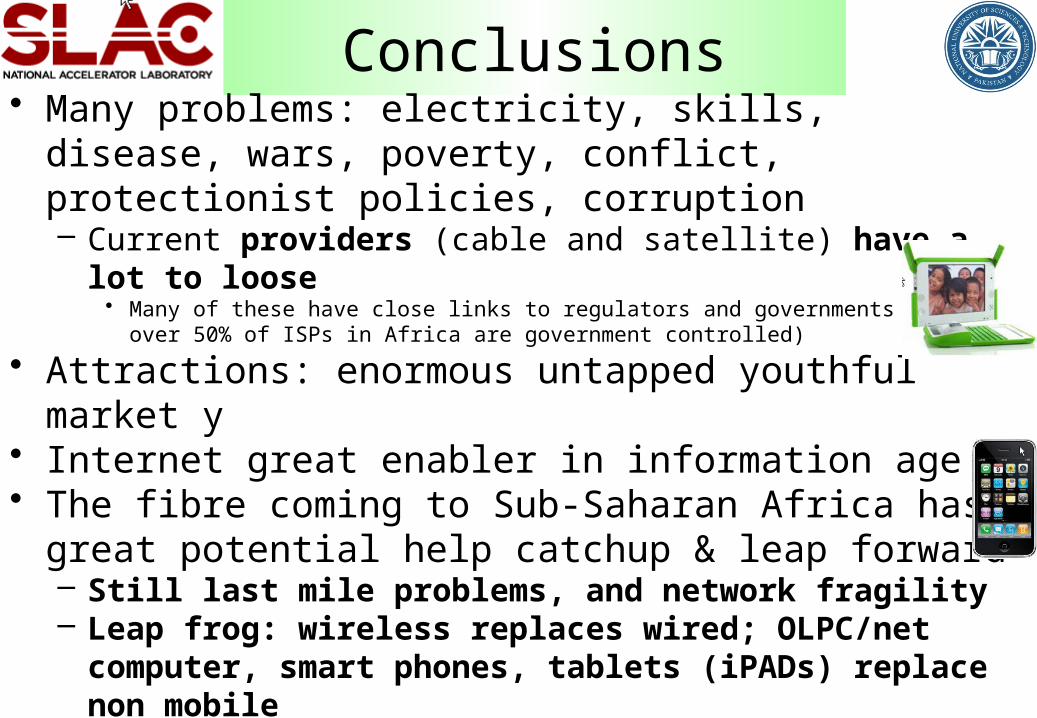
Conclusions• Many problems: electricity, skills, disease, wars, poverty,
conflict, protectionist policies, corruption – Current providers (cable and satellite) have a lot to loose
• Many of these have close links to regulators and governments (e.g. over 50% of ISPs in Africa are government controlled)
• Attractions: enormous untapped youthful market y• Internet great enabler in information age• The fibre coming to Sub-Saharan Africa has great potential
help catchup & leap forward– Still last mile problems, and network fragility– Leap frog: wireless replaces wired; OLPC/net computer,
smart phones, tablets (iPADs) replace non mobile• Africa international bandwidth capacity increased 14 fold
2006-2010– Yet still a long way to go: all Africa combined has less than one
third as much international capacity as Austria alone.

More Information• Case Study:
– confluence.slac.stanford.edu/display/IEPM/New+E.+Coast+of+Africa+Fibre
• Ubuntunet Alliance– www.ubuntunet.net/
• EU study on deploying regional backbone connecting NRENs– http://www.feast-project.org/documents/
• MANGO-NET (Made in Africa NGO NETwork)– www.isgtw.org/?pid=1001999
• Undersea fibre cables– manypossibilities.net/african-undersea-cables
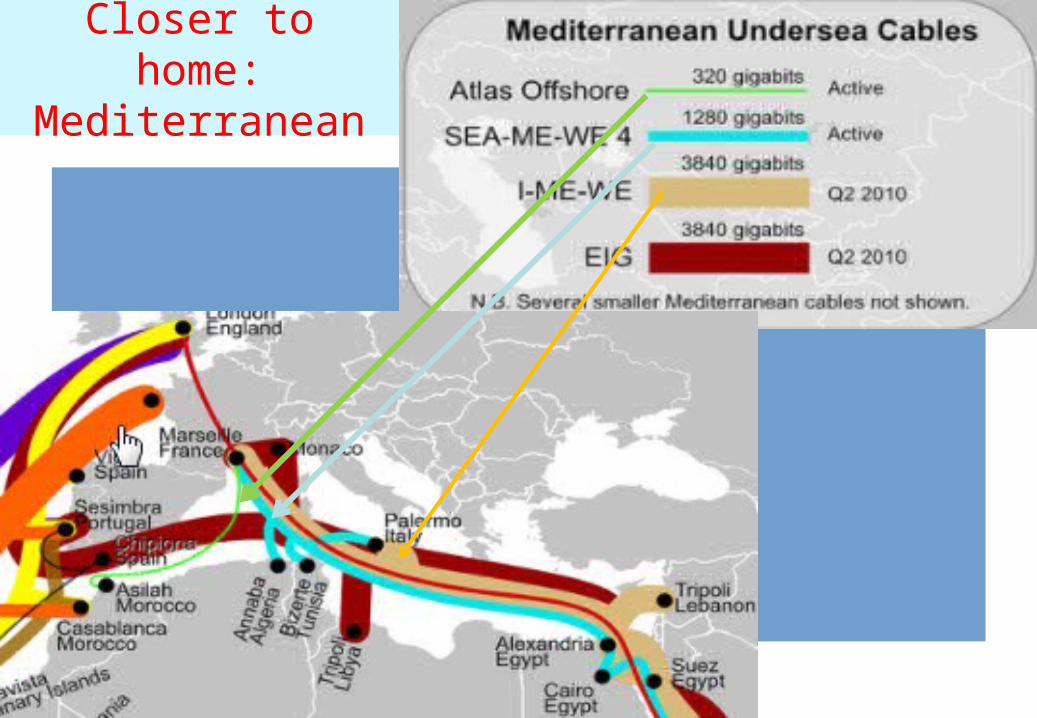
Closer to home:Mediterranean
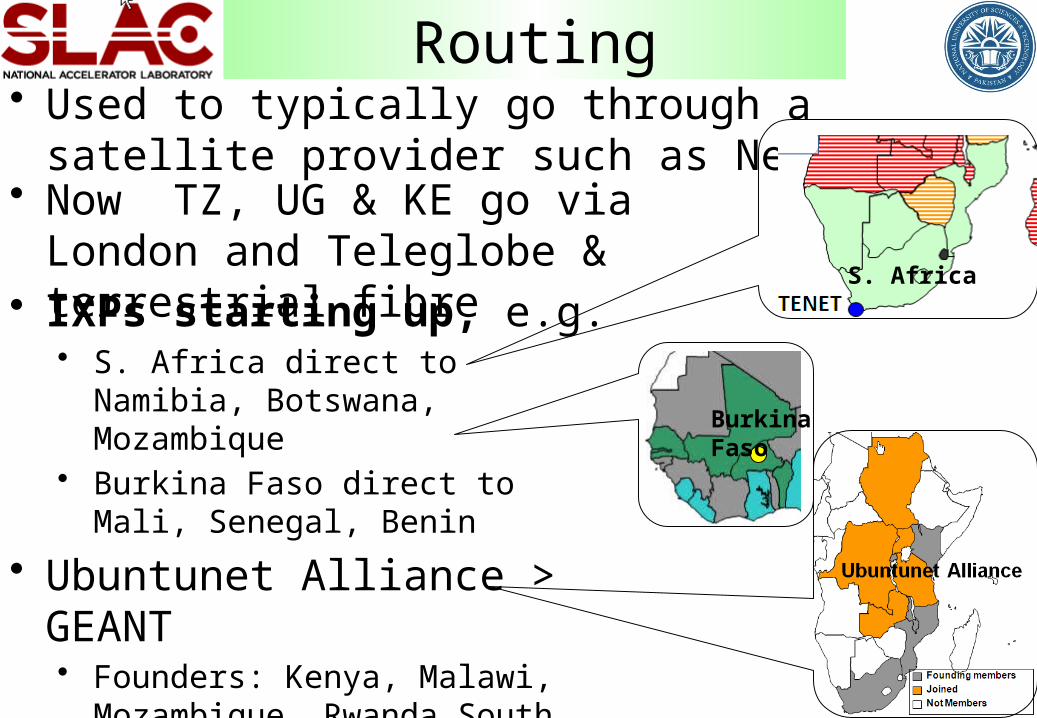
Routing• Used to typically go through a satellite provider
such as Newskies• Now TZ, UG & KE go via London
and Teleglobe & terrestrial fibre• IXPs starting up, e.g.
• S. Africa direct to Namibia, Botswana, Mozambique
• Burkina Faso direct to Mali, Senegal, Benin
• Ubuntunet Alliance > GEANT• Founders: Kenya, Malawi,
Mozambique, Rwanda South Africa• Joined by DRC, SD, TZ, UG
S. Africa
Burkina Faso