Embed Size (px)
Citation preview
John Reid Where are we on the scale of data, information, knowledge and wisdom?
AITPM 2017 National Conference
JOHN REID Managing Director
Austraffic & Global Counting Systems
1. Where are we on the scale of data, information, knowledge
and wisdom?
We must ensure that expertise, wisdom and understanding is not replaced with a plethora of
numbers.
With practical applications, this paper will challenge practitioners to consider:
• The concept of new data that is a kilometre wide but only a millimetre thick
• When a lot of information in a limited area may misdirect the whole focus of a project
• A mass of information that might tell us what people are doing but not why they are
doing it.
• Some think that much more data means we don't need to interpret so we do not need
professional expertise.
• Information that might accurately define the present but is not a good basis for
predicting the future.
• Data that confirms that several factors may be an important part of the issue but gives
no indication of the compounding of several factors together.
• Measuring short term changes when the long term effect is quite different
2. Introduction
“Where is the wisdom we have lost in knowledge? Where is the knowledge we have lost
in information?” T.S. Eliot – Choruses from The Rock
When Eliot published the play The Rock in 1934, he did so to raise funds to preserve London's
older churches. But his quest was more than buildings and he spoke of how our civilisation was
running back and forth, gaining knowledge, but never learning truths.
While we might not take such a mystical view as Eliot, his words ring true to us in a world
where technology is giving us much more information but this is not necessarily leading to
greater wisdom.
We might even add a line at the bottom of the quote "Where is the information we have lost in
data?".
We are being bombarded with data. Or is the word “swamped”?
What do the numbers mean? Are they credible numbers? Do they lead to wise, long-term
solutions?
Any AITPM conference will be full of numbers and results. This is a good start. But I wish to
take you on a quick journey of caution, and application of wisdom to big data.
John Reid Where are we on the scale of data, information, knowledge and wisdom?
AITPM 2017 National Conference
Wisdom in the traffic planning and management sense should be something that gives insight
and fosters processes that lead to the best community benefits, not just give an answer to satisfy
a short-term need.
As a profession, we have discussed the need for mentoring. But this must be much more than
just telling young people how we did it in “my day”. We are also faced with government
departments that are de-skilling their areas and replacing them with general managers. Good
management is important but if it is based on short-term expediency our future is in jeopardy.
We must ensure that expertise, wisdom and understanding are not all replaced with a plethora of
numbers.
For example, if we are to use a large amount of numbers, the first step is to make sure you have
clean data.
3. Cleaning up the data – specific examples
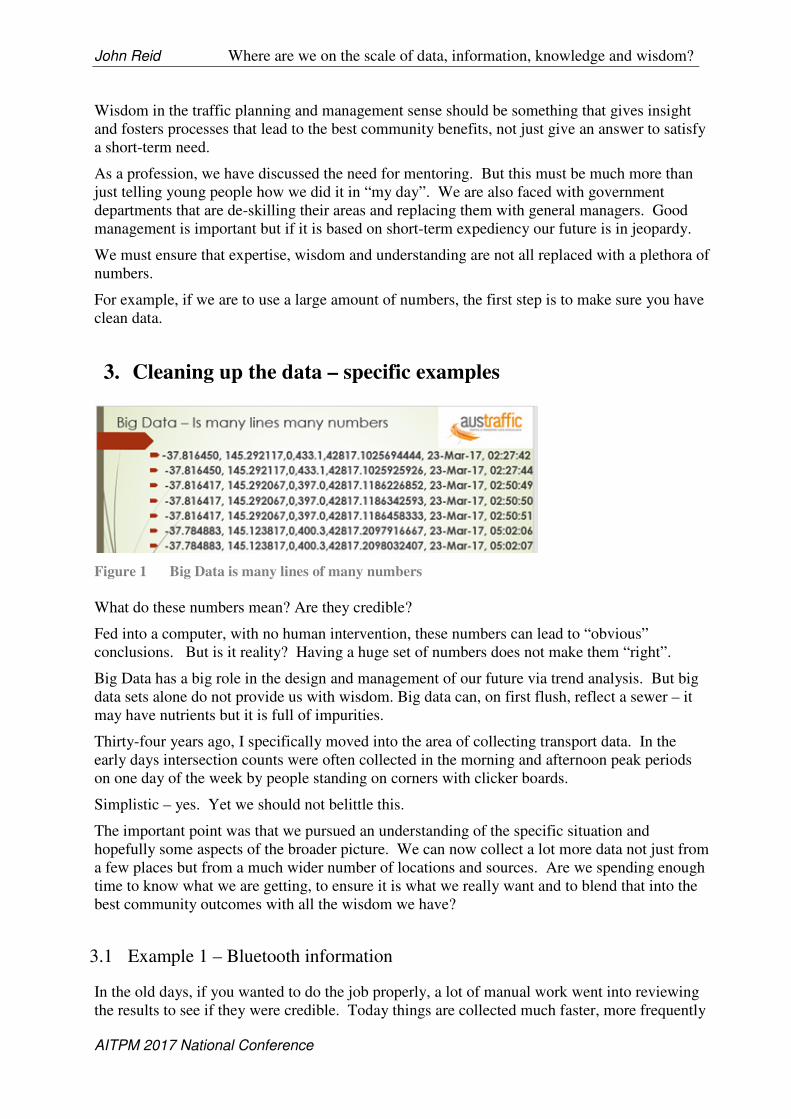
Figure 1 Big Data is many lines of many numbers
What do these numbers mean? Are they credible?
Fed into a computer, with no human intervention, these numbers can lead to “obvious”
conclusions. But is it reality? Having a huge set of numbers does not make them “right”.
Big Data has a big role in the design and management of our future via trend analysis. But big
data sets alone do not provide us with wisdom. Big data can, on first flush, reflect a sewer – it
may have nutrients but it is full of impurities.
Thirty-four years ago, I specifically moved into the area of collecting transport data. In the
early days intersection counts were often collected in the morning and afternoon peak periods
on one day of the week by people standing on corners with clicker boards.
Simplistic – yes. Yet we should not belittle this.
The important point was that we pursued an understanding of the specific situation and
hopefully some aspects of the broader picture. We can now collect a lot more data not just from
a few places but from a much wider number of locations and sources. Are we spending enough
time to know what we are getting, to ensure it is what we really want and to blend that into the
best community outcomes with all the wisdom we have?
3.1 Example 1 – Bluetooth information
In the old days, if you wanted to do the job properly, a lot of manual work went into reviewing
the results to see if they were credible. Today things are collected much faster, more frequently
John Reid Where are we on the scale of data, information, knowledge and wisdom?
AITPM 2017 National Conference
and in much greater volume. In the quest for efficiency and reduced costs. An era where
inadequate recognition of the time to review work and to commit time to reflect and consider
what the numbers really mean.
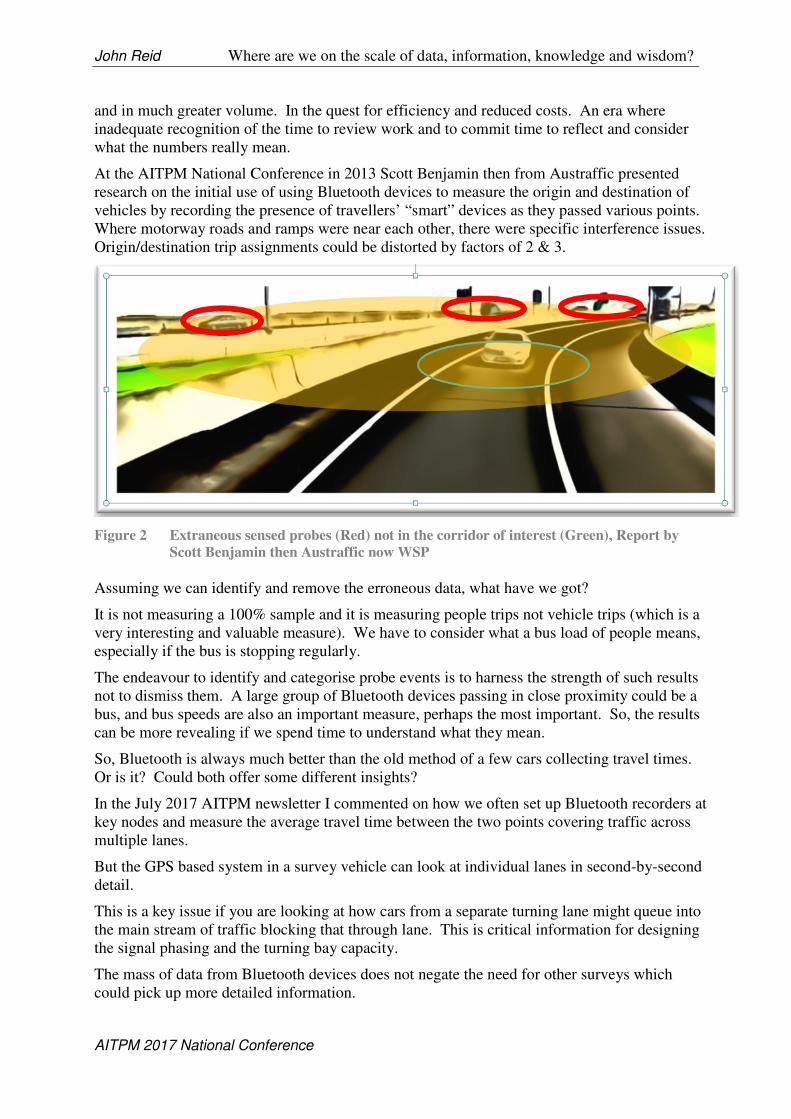
At the AITPM National Conference in 2013 Scott Benjamin then from Austraffic presented
research on the initial use of using Bluetooth devices to measure the origin and destination of
vehicles by recording the presence of travellers’ “smart” devices as they passed various points.
Where motorway roads and ramps were near each other, there were specific interference issues.
Origin/destination trip assignments could be distorted by factors of 2 & 3.
Figure 2 Extraneous sensed probes (Red) not in the corridor of interest (Green), Report by
Scott Benjamin then Austraffic now WSP
Assuming we can identify and remove the erroneous data, what have we got?
It is not measuring a 100% sample and it is measuring people trips not vehicle trips (which is a
very interesting and valuable measure). We have to consider what a bus load of people means,
especially if the bus is stopping regularly.
The endeavour to identify and categorise probe events is to harness the strength of such results
not to dismiss them. A large group of Bluetooth devices passing in close proximity could be a
bus, and bus speeds are also an important measure, perhaps the most important. So, the results
can be more revealing if we spend time to understand what they mean.
So, Bluetooth is always much better than the old method of a few cars collecting travel times.
Or is it? Could both offer some different insights?
In the July 2017 AITPM newsletter I commented on how we often set up Bluetooth recorders at
key nodes and measure the average travel time between the two points covering traffic across
multiple lanes.
But the GPS based system in a survey vehicle can look at individual lanes in second-by-second
detail.
This is a key issue if you are looking at how cars from a separate turning lane might queue into
the main stream of traffic blocking that through lane. This is critical information for designing
the signal phasing and the turning bay capacity.
The mass of data from Bluetooth devices does not negate the need for other surveys which
could pick up more detailed information.
John Reid Where are we on the scale of data, information, knowledge and wisdom?
AITPM 2017 National Conference
As with all data collection, regardless of technique, clearly identifying the sample size is
important, as well as knowing the calibre of the sample.
Control of the sample is important, as in most instances there is the desire to adjust the sample
to an absolute real number.
The folly of sampling is suitably told by the example of the historical white car technique with
its inherent control and a comparison with modern era probe sensed data that lacks perspective
of control.
White as a color for the chosen sample is controlled and easy to identify and to quantify using
registered vehicle statistics and a simple validation on the day of the survey to confirm the
sample size percentage (usually in the range of 28-32%).
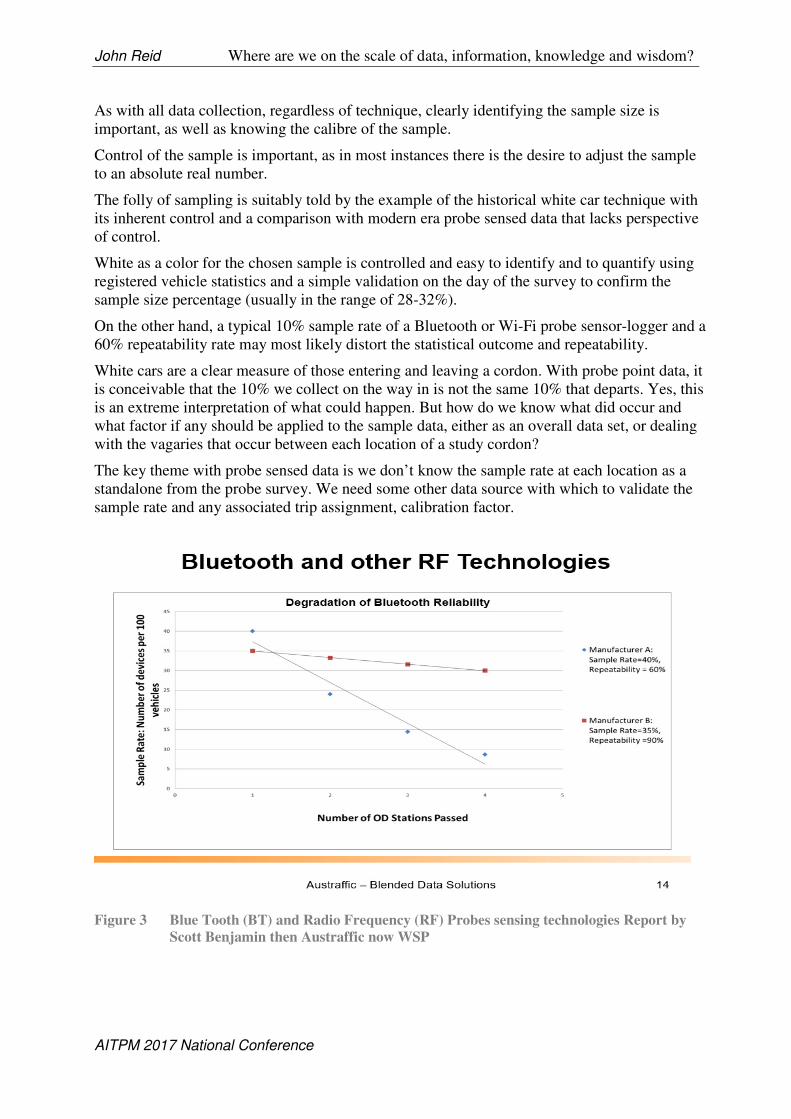
On the other hand, a typical 10% sample rate of a Bluetooth or Wi-Fi probe sensor-logger and a
60% repeatability rate may most likely distort the statistical outcome and repeatability.
White cars are a clear measure of those entering and leaving a cordon. With probe point data, it
is conceivable that the 10% we collect on the way in is not the same 10% that departs. Yes, this
is an extreme interpretation of what could happen. But how do we know what did occur and
what factor if any should be applied to the sample data, either as an overall data set, or dealing
with the vagaries that occur between each location of a study cordon?
The key theme with probe sensed data is we don’t know the sample rate at each location as a
standalone from the probe survey. We need some other data source with which to validate the
sample rate and any associated trip assignment, calibration factor.
Figure 3 Blue Tooth (BT) and Radio Frequency (RF) Probes sensing technologies Report by
Scott Benjamin then Austraffic now WSP
John Reid Where are we on the scale of data, information, knowledge and wisdom?
AITPM 2017 National Conference
4. Bluetooth (BT) and Radio Frequency (RF) probe sensing
technologies Identifying and filtering “Outliers”
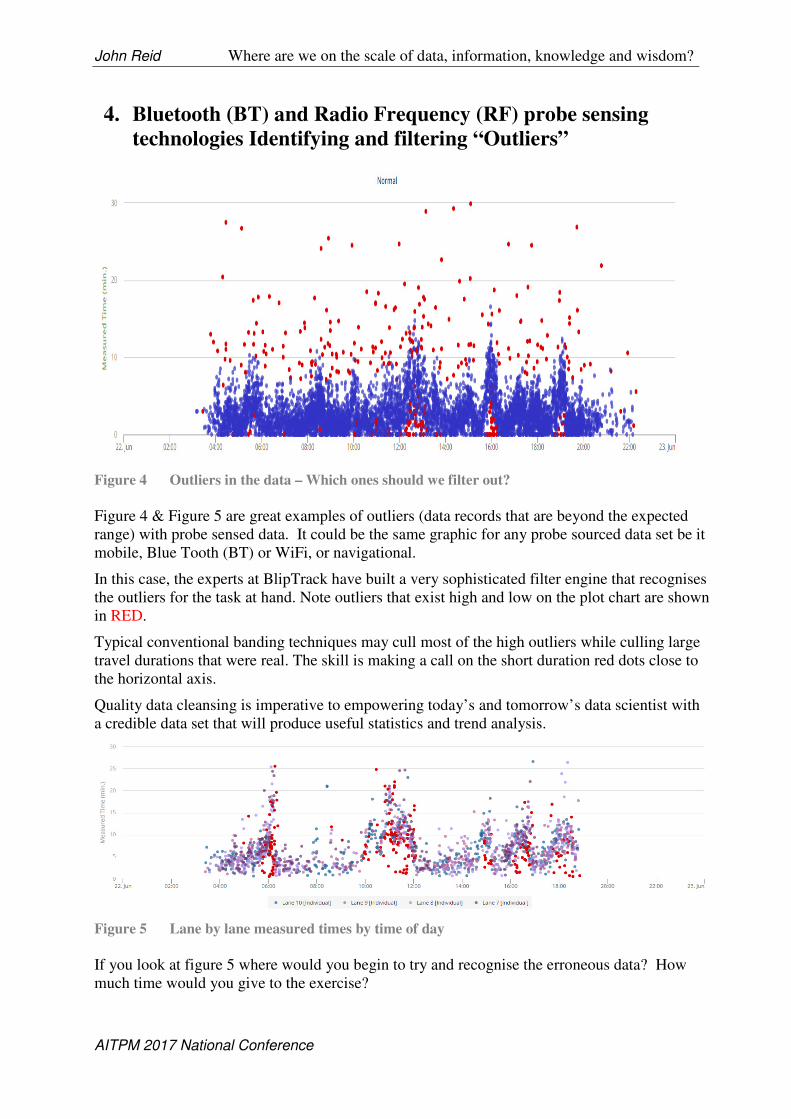
Figure 4 Outliers in the data – Which ones should we filter out?
Figure 4 & Figure 5 are great examples of outliers (data records that are beyond the expected
range) with probe sensed data. It could be the same graphic for any probe sourced data set be it
mobile, Blue Tooth (BT) or WiFi, or navigational.
In this case, the experts at BlipTrack have built a very sophisticated filter engine that recognises
the outliers for the task at hand. Note outliers that exist high and low on the plot chart are shown
in RED.
Typical conventional banding techniques may cull most of the high outliers while culling large
travel durations that were real. The skill is making a call on the short duration red dots close to
the horizontal axis.
Quality data cleansing is imperative to empowering today’s and tomorrow’s data scientist with
a credible data set that will produce useful statistics and trend analysis.
Figure 5 Lane by lane measured times by time of day
If you look at figure 5 where would you begin to try and recognise the erroneous data? How
much time would you give to the exercise?
John Reid Where are we on the scale of data, information, knowledge and wisdom?
AITPM 2017 National Conference
This data is from static Bluetooth sensors, pairs of sensors that form to provide bidirectional
zone based data along the corridor of interest
The Austraffic website has a video on BlipTrack titled “Bluetooth Devices and Driving
Behaviour Help Ease Traffic Congestion”.
https://austraffic.com.au/news/bluetooth-helping-manage-traffic-congestion
Additional reference items at
https://austraffic.com.au/news/bluetooth-tracking-system-review
https://austraffic.com.au/news/blip-systems-announces-bluetooth-partnership-austraffic
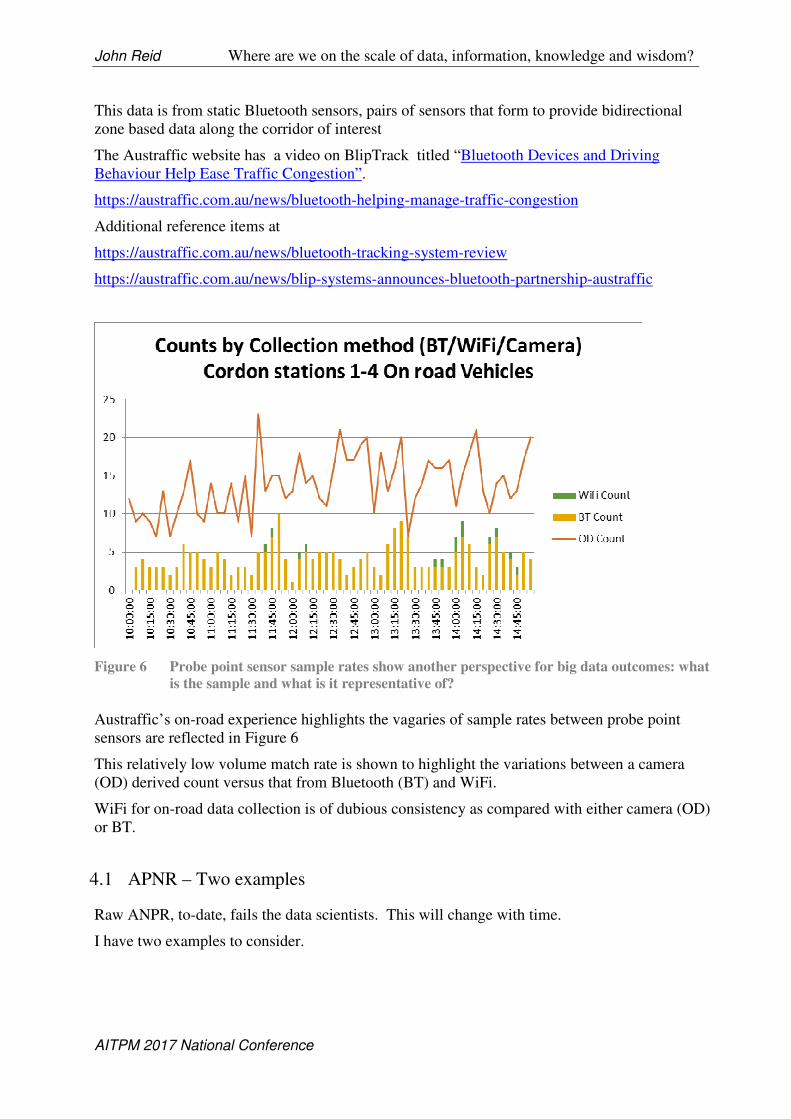
Figure 6 Probe point sensor sample rates show another perspective for big data outcomes: what
is the sample and what is it representative of?
Austraffic’s on-road experience highlights the vagaries of sample rates between probe point
sensors are reflected in Figure 6
This relatively low volume match rate is shown to highlight the variations between a camera
(OD) derived count versus that from Bluetooth (BT) and WiFi.
WiFi for on-road data collection is of dubious consistency as compared with either camera (OD)
or BT.
4.1 APNR – Two examples
Raw ANPR, to-date, fails the data scientists. This will change with time.
I have two examples to consider.
John Reid Where are we on the scale of data, information, knowledge and wisdom?
AITPM 2017 National Conference
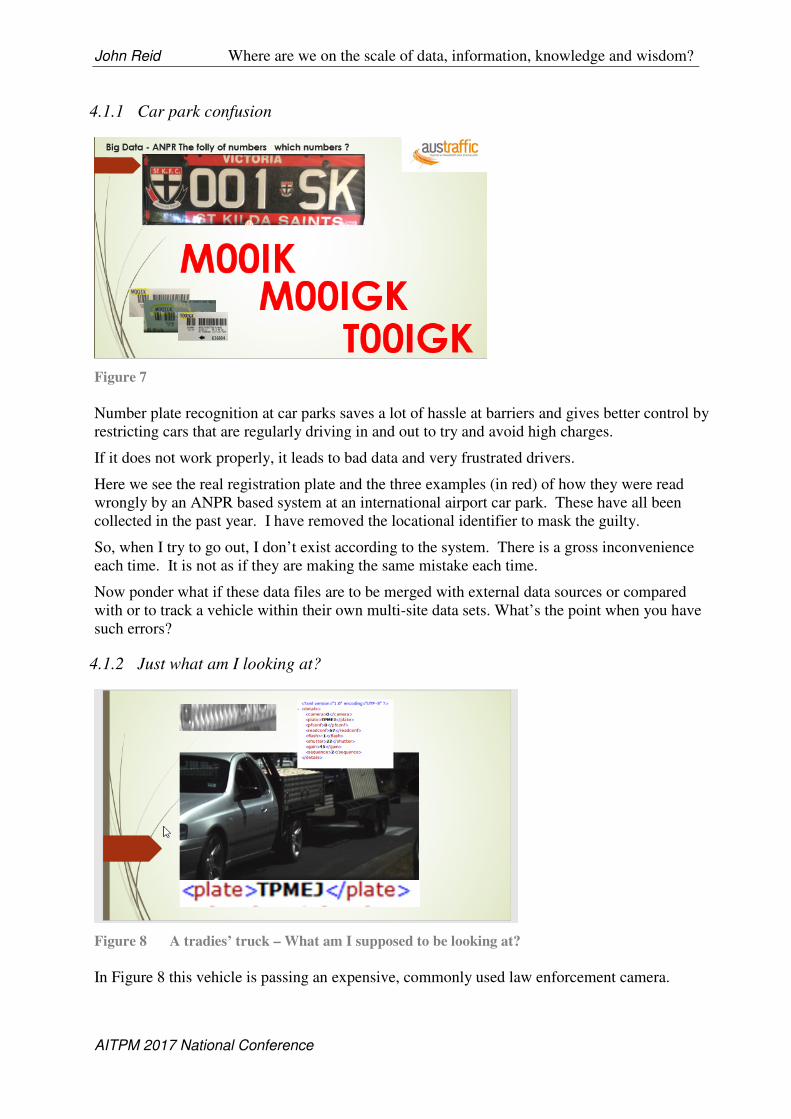
4.1.1 Car park confusion
Figure 7
Number plate recognition at car parks saves a lot of hassle at barriers and gives better control by
restricting cars that are regularly driving in and out to try and avoid high charges.
If it does not work properly, it leads to bad data and very frustrated drivers.
Here we see the real registration plate and the three examples (in red) of how they were read
wrongly by an ANPR based system at an international airport car park. These have all been
collected in the past year. I have removed the locational identifier to mask the guilty.
So, when I try to go out, I don’t exist according to the system. There is a gross inconvenience
each time. It is not as if they are making the same mistake each time.
Now ponder what if these data files are to be merged with external data sources or compared
with or to track a vehicle within their own multi-site data sets. What’s the point when you have
such errors?
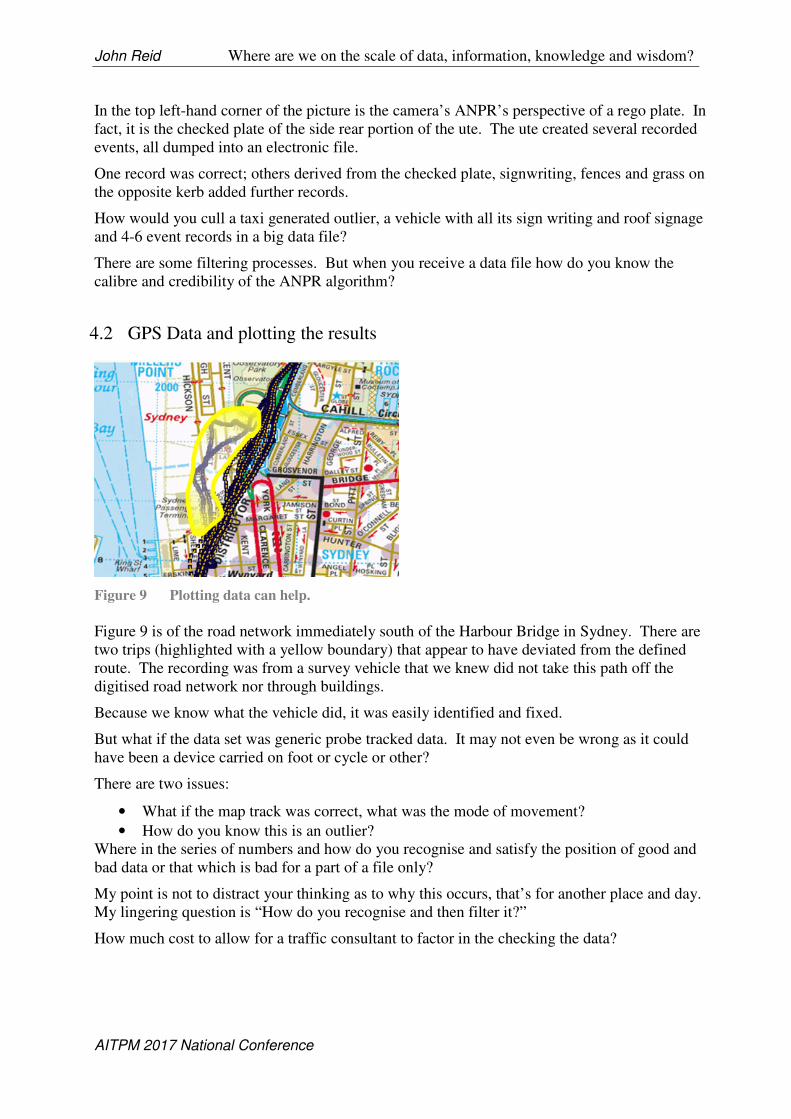
4.1.2 Just what am I looking at?
Figure 8 A tradies’ truck – What am I supposed to be looking at?
In Figure 8 this vehicle is passing an expensive, commonly used law enforcement camera.
John Reid Where are we on the scale of data, information, knowledge and wisdom?
AITPM 2017 National Conference
In the top left-hand corner of the picture is the camera’s ANPR’s perspective of a rego plate. In
fact, it is the checked plate of the side rear portion of the ute. The ute created several recorded
events, all dumped into an electronic file.
One record was correct; others derived from the checked plate, signwriting, fences and grass on
the opposite kerb added further records.
How would you cull a taxi generated outlier, a vehicle with all its sign writing and roof signage
and 4-6 event records in a big data file?
There are some filtering processes. But when you receive a data file how do you know the
calibre and credibility of the ANPR algorithm?
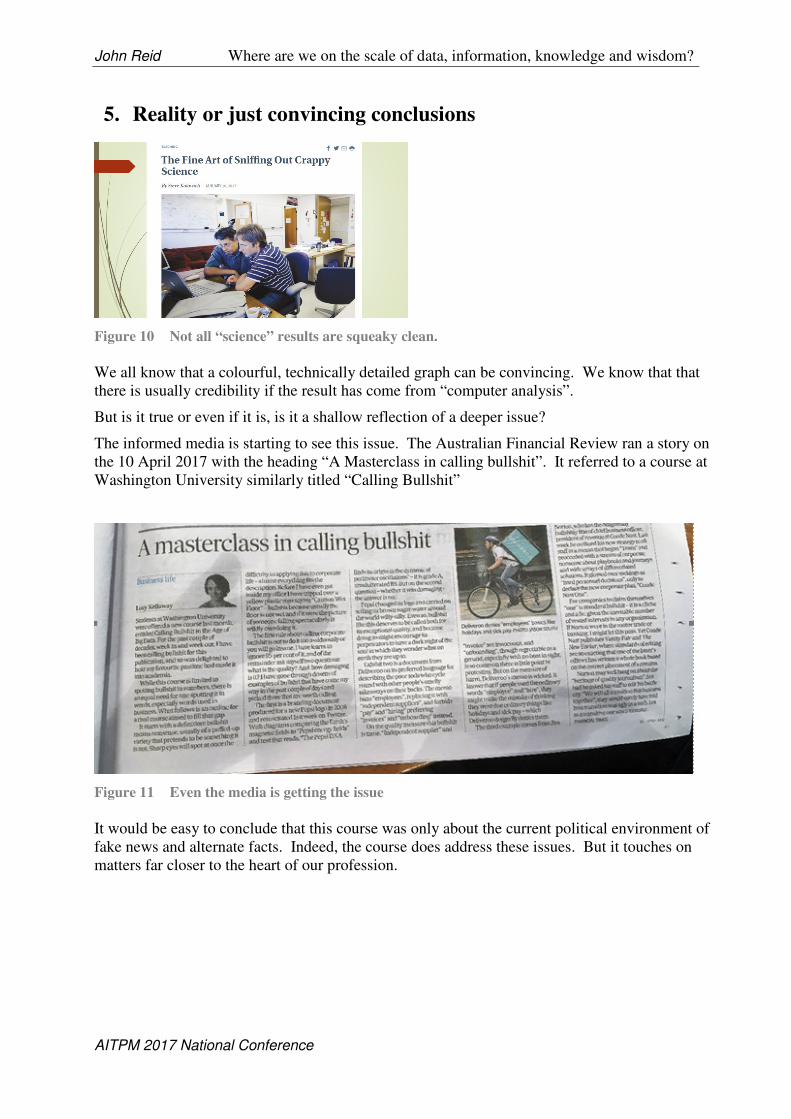
4.2 GPS Data and plotting the results
Figure 9 Plotting data can help.
Figure 9 is of the road network immediately south of the Harbour Bridge in Sydney. There are
two trips (highlighted with a yellow boundary) that appear to have deviated from the defined
route. The recording was from a survey vehicle that we knew did not take this path off the
digitised road network nor through buildings.
Because we know what the vehicle did, it was easily identified and fixed.
But what if the data set was generic probe tracked data. It may not even be wrong as it could
have been a device carried on foot or cycle or other?
There are two issues:
• What if the map track was correct, what was the mode of movement?
• How do you know this is an outlier?
Where in the series of numbers and how do you recognise and satisfy the position of good and
bad data or that which is bad for a part of a file only?
My point is not to distract your thinking as to why this occurs, that’s for another place and day.
My lingering question is “How do you recognise and then filter it?”
How much cost to allow for a traffic consultant to factor in the checking the data?
John Reid Where are we on the scale of data, information, knowledge and wisdom?
AITPM 2017 National Conference
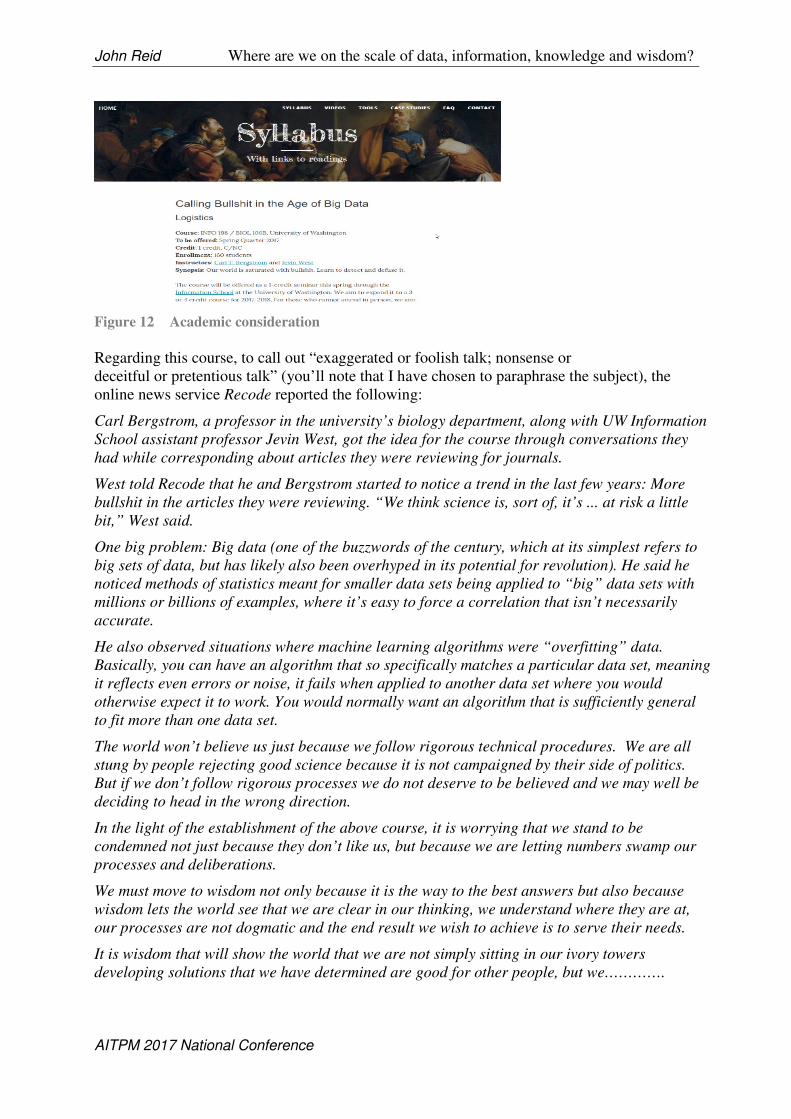
5. Reality or just convincing conclusions
Figure 10 Not all “science” results are squeaky clean.
We all know that a colourful, technically detailed graph can be convincing. We know that that
there is usually credibility if the result has come from “computer analysis”.
But is it true or even if it is, is it a shallow reflection of a deeper issue?
The informed media is starting to see this issue. The Australian Financial Review ran a story on
the 10 April 2017 with the heading “A Masterclass in calling bullshit”. It referred to a course at
Washington University similarly titled “Calling Bullshit”
Figure 11 Even the media is getting the issue
It would be easy to conclude that this course was only about the current political environment of
fake news and alternate facts. Indeed, the course does address these issues. But it touches on
matters far closer to the heart of our profession.
John Reid Where are we on the scale of data, information, knowledge and wisdom?
AITPM 2017 National Conference
Figure 12 Academic consideration
Regarding this course, to call out “exaggerated or foolish talk; nonsense or
deceitful or pretentious talk” (you’ll note that I have chosen to paraphrase the subject), the
online news service Recode reported the following:
Carl Bergstrom, a professor in the university’s biology department, along with UW Information
School assistant professor Jevin West, got the idea for the course through conversations they
had while corresponding about articles they were reviewing for journals.
West told Recode that he and Bergstrom started to notice a trend in the last few years: More
bullshit in the articles they were reviewing. “We think science is, sort of, it’s ... at risk a little
bit,” West said.
One big problem: Big data (one of the buzzwords of the century, which at its simplest refers to
big sets of data, but has likely also been overhyped in its potential for revolution). He said he
noticed methods of statistics meant for smaller data sets being applied to “big” data sets with
millions or billions of examples, where it’s easy to force a correlation that isn’t necessarily
accurate.
He also observed situations where machine learning algorithms were “overfitting” data.
Basically, you can have an algorithm that so specifically matches a particular data set, meaning
it reflects even errors or noise, it fails when applied to another data set where you would
otherwise expect it to work. You would normally want an algorithm that is sufficiently general
to fit more than one data set.
The world won’t believe us just because we follow rigorous technical procedures. We are all
stung by people rejecting good science because it is not campaigned by their side of politics.
But if we don’t follow rigorous processes we do not deserve to be believed and we may well be
deciding to head in the wrong direction.
In the light of the establishment of the above course, it is worrying that we stand to be
condemned not just because they don’t like us, but because we are letting numbers swamp our
processes and deliberations.
We must move to wisdom not only because it is the way to the best answers but also because
wisdom lets the world see that we are clear in our thinking, we understand where they are at,
our processes are not dogmatic and the end result we wish to achieve is to serve their needs.
It is wisdom that will show the world that we are not simply sitting in our ivory towers
developing solutions that we have determined are good for other people, but we………….
John Reid Where are we on the scale of data, information, knowledge and wisdom?
AITPM 2017 National Conference
6. What has history and our culture told us about wisdom?
6.1 Wisdom is more than just a few truisms
It would be easy to nod sagely at the need for wisdom without understanding what wisdom
really is.
We can paste a few clever comments as memes on Facebook, perhaps even put them in a frame
on your desk but we need to go much, much further than this.
A perceptive comment might be a place to start but not to finish.
In regard to transport planning and management it is hard to go past Isaac Asimov’s insightful
comment “The saddest aspect of life right now is that science gathers knowledge faster than
society gathers wisdom”.
The problem is that we may see wisdom as having a clever or convincing answer to every
problem. Wisdom, however, is much more about a process to deeper understanding which will
lead to better solutions rather than just a one-off suggestion. Reputable references have often
made the point that wisdom can include specifically a reduction in how much we say.
“He that hath knowledge spareth his words: and a man of understanding is of an excellent
spirit.” Proverbs 17:27
“Knowledge speaks, but wisdom listens” ― Jimi Hendrix
“It is better to keep your mouth closed and let people think you are a fool than to open it and
remove all doubt.” Mark Twain
6.2 Wisdom in Antiquity
The quest for wisdom is embedded in our culture.
A common expression for thinking that transcends the simplistic and embraces a process that
leads to a deeper meaning and understanding is to talk of “The Wisdom of Solomon”. The
biblical story tells of how Solomon proposed a solution that, on the face of it, is barbaric.
The story tells of how two women argued over the possession of a child. Because there was no
agreement, Solomon proposed that they cut the child in half. He did this to determine the true
motives of the women. One agreed showing that she was prepared to accept the unthinkable
just so the other person did not get a greater benefit. The other was horrified and said she would
readily give up custody to save the child’s life. This made Solomon’s decision easy and he gave
the child to the second woman.
Now the story of Solomon has been imbedded in our culture. For example, it is referenced in
Huckleberry Finn and more recently The Simpsons and Seinfeld.
There is a New Zealand Maori tradition where if someone has committed an offense in the
community they will hold a meeting where the offender is confronted with the error of the ways
and the victims are present to emphasise the hurt that has been caused.
The point of the meeting is not just for the head of the tribe to make a decision but that the
relevant members of the community have to interact to help identify a resolution. The
interaction is guided by the wisdom of the elders. It takes time, it is not just a self-satisfying
judgement and it may lead to some modification of the thinking of each party.
John Reid Where are we on the scale of data, information, knowledge and wisdom?
AITPM 2017 National Conference
We have seen this recently in victim statements in court cases yet this appears to be a more
formal process rather than the interaction that the Maori tradition which are more community
centred.
7. How does this affect our approach?
As a profession, we have discussed the need for mentoring.
But this has to be much more than just telling young people how we did it in “my day”.
We are also faced with government departments that are de-skilling their areas and replacing
technical staff with general managers.
Good management is important but if it is based on poorly developed conclusions (no matter
how much data is behind it) then we have lost the plot.
7.1 Never mind the quality just feel the width
Bulking up on the data we collect does not automatically take us from information to
knowledge let alone onto wisdom.
Consider the data we can collect from the digital ticketing systems now operating on our public
transport systems. It has long been the dream of getting every trip recorded from the start point
to the finish point, by time of day and by mode of travel.
But it is one thing to compile statistics on what trips are being made, it is quite another to
conclude the reasons behind any changes that you might detect, or to understand what it really
means for the future.
At the ARRB/ATRF conference in Melbourne in 2016, data were presented on the yearly
pattern of trips specifically looking at whether there was any shift to travel outside the peak
periods.
In December, there were more trips in the non-peak and slightly less in the peak period. This
was assumed to be people shifting their travel time. But it might be that some people are
choosing not to travel and others choosing to make a trip they do not normally take. This
doesn’t make the Opal data invalid or that the research presented at the conference as worthless.
It does mean that we could enhance our understanding by carrying out some complementary
surveys.
In the December 2016 AITPM newsletter I wrote an article that began with the words
Big data can be a kilometre wide but only a millimetre thick.
I referred to the first household travel surveys held in Australia with special reference to Liz
Ampt who has gone on to become a world expert in this area.
The household surveys, while representing a small sample, gave much more breadth to
understanding how and why trip decisions were being made and how they were affected by
things such as the interaction within a household.
In that article, I also referred to a research paper on the recent Fiji household survey which
among many things identified unexpected modes of transport. While many people used the
traditional modes of transport such as buses, cars, bikes and walking some entered their method
John Reid Where are we on the scale of data, information, knowledge and wisdom?
AITPM 2017 National Conference
of traveling as “Swimming”. Apparently, they lived on the one side of the river and their work
destination was on the other.
Another incredibly revealing thing was that many people did little or no travel during the
survey.
Just counting traffic volumes or passenger numbers would miss this critical social point
altogether.
Here is another example. Every city has problems with too many cars. We have committed
time and resources to try and maximise the flow of vehicles by using devices from coordinated
traffic lights to one-way streets. Furthermore, we have tried to discourage trips with cordon
charges.
But there is a very limited understanding of the nature of the volumes. Some research has
suggested that circulating traffic can account for 30% of the traffic volumes in a major city
centre, eg those looking for a park.
While not solving the whole issues of cars in the city centre, this can focus our attention on
ways to reduce this significant volume. For example, with the Uber style of calling up a ride,
might we remove taxis and other ride sharing vehicles from circulating and looking for fares; or
might we only allow vehicles into the centre that have a specific parking space to go to. The
point is that with a greater knowledge we can consider a much wider range of solutions that
might be more acceptable (and thus more readily adapted) to the user.
7.2 Information to knowledge – firstly it’s about people
Understanding the immediate reasons for our current trip making is still not going far enough.
If we are to move from information to knowledge then we must greatly increase our
understanding of people; their situations, their needs; their desires, their opportunities and how
this melds into a functioning community. Let us also not forget that to serve these needs we
need to cater for freight movements not just passenger trips.
I was encouraged to read a report in the AITPM newsletter and video news story about the
Young Professionals Network meeting where eminent transport planner Brian Smith spoke
about the need to not let numbers overpower our consideration and understanding of people.
In the video news story, he said
“So, transport planning and traffic engineering are full of numbers, levels of service,
demands, patronage flows, numerical warrants but we sometimes forget that behind
these numbers are people, real people whose lives are affected by the design and
planning decisions that we make.
“And so, there is a risk that these numbers that we use in transport planning, distance us
from the people that we're trying to plan for; and I think, the latest developments in big
data and digital, mean that there's a risk that we will be even further distanced from the
people whose lives we will affect.
We can, for example, get more and more effort in perfecting transport modelling of the exiting
situation but is that any indication that it will reflect what happens when things change? This is
not to say that we should stop modelling; but rather, pursuing just the technical complexity and
luxuriating in a veritable multitude of numbers is simply not enough. We need knowledge of
John Reid Where are we on the scale of data, information, knowledge and wisdom?
AITPM 2017 National Conference
people and their motivations that will enhance modelling of the future not just representations of
the present.
7.3 From Knowledge to Wisdom
Ultimately wisdom is not just having all the knowledge, if that were possible. It is certainly not
about pontificating on about your own ideas. It is not just about making perfect, snap decisions.
Wisdom has breadth. It is not one-dimensional.
Recently there has been a trend to believe that people are born with certain abilities and that
management’s role is to pick those people at an early age (a one off-decision) and expect them
to be accurate and productive from day one. This fails to encourage those who will have
untapped value and it confines those with an existing talent to just repeating what they can do.
Austraffic has recently supported a program that helps fund some young engineers to travel
overseas to gain some learning opportunities. We see this as much more than just helping them
understand what more senior professionals already think and do. Young professionals have
grown up in a different time and environment and amid a new wave of technological
development. Like everyone, they have their own perspectives that need to be nurtured so that
they will ultimately provide their own unique insights into the problems we face and the
solutions that can be envisaged and implemented.
This is, I hope, getting to the core of our profession showing and practicing wisdom.
I see this happening in the AITPM with things such as the Young Professionals Network; as we
hold meetings where interaction is encouraged; as we produce communications that are not just
definitive opinions but perceptions that are intended to prompt thoughts and discussions.
While public consultation and greater effort on presenting information is now a critical part of
government, I am not sure that this is always a reflection of real wisdom. If government
agencies are being de-skilled in technical knowledge and like many businesses start out being
forced to focus on short term issues and are expected to produce more and more outputs in the
time they have, then we do not have the environment to produce and benefit from wisdom.
7.4 What is data, information, knowledge and wisdom? And what is it not?
Numbers are not data if they are wrong. Data needs to be right, and it needs to reflect what we
think it is measuring.
Data compiled and presented fairly in graphs and tables and representing trends is information.
If it is distorted or represented in a way that tries to obscure its true meaning then it is
misinformation.
Knowledge is the theoretical or practical understanding of a subject. It is something that is
gained through experience or association. Knowledge is not just anything that supports your
opinion.
Wisdom needs knowledge and good judgement and an ability to know how to facilitate the
value of wisdom toward the right solutions being embraced and adapted. I consider the
following aspects to be pointers in how we might identify wisdom and apply it:
Measuring resultant activities never replaces the essential prerequisite to firstly understand
people and their needs.
John Reid Where are we on the scale of data, information, knowledge and wisdom?
AITPM 2017 National Conference
Technology is not wisdom. It is a tool for us to use wisely for our collective benefit.
Wisdom is not just an improved form of information or knowledge
Wisdom is rarely just a one-off judgement.
Wisdom includes the ability to know when to say nothing
Wisdom can provide guidance although may not give the ultimate answer
Wisdom is getting to the best answer by the best processes in a way that people who are
affected, own the solution.
7.5 We need time to perfect and practice wisdom.
If we have no time to think and ponder what we are doing and how we are doing it then we will
be overpowered by circumstances including new technologies.
At the AITPM Victorian branch 2016 end of year function I quoted a few verses from the
classic Australian poem “Clancy of the Overflow”. The verse that stands out the most for me is
as follows:
And the hurrying people daunt me, and their pallid faces haunt me
As they shoulder one another in their rush and nervous haste,
With their eager eyes and greedy, and their stunted forms and weedy,
For townsfolk have no time to grow, they have no time to waste.
But this is not, as I mentioned at the beginning of this paper, just a sentimental reference to
make us feel momentarily reflective. It is a core problem today.
Joe Wolfe, an Australian physicist turned comic poet, wrote a parody/homage to the classic
Paterson poem. As the narrator sits at his desk trying to answer all his emails he laments:
But the looming deadlines haunt me
And their harrying senders taunt me
That they need response this evening
For tomorrow is too late!
But their texts, too quickly ended,
Often can't be comprehended
For their writers have no time to think –
They have no time to wait.
8. Conclusion
We need to identify then spend time and resources on moving beyond just collecting data,
making diagrams and establishing a library of knowledge. We need to respect wisdom as a way
of bringing together an understanding from many sources, making wise decisions and
facilitating others to be a part of this effective process.
9. References:
Scott Benjamin, previously Austraffic now WSP [email protected]; 2013 presentation to AITPM National Conference and IPENZ
Transportation Group Conference, Shed 6, Wellington – 23 – 26 March, 2014,Practical Views on New Survey Technology; AFR, Australian
Financial Review, 10 April 2017 with the heading “A Masterclass in calling bullshit”. The Chronicle article- fine art of sniffing out crappy
sciencehttp://www.chronicle.com/article/The-Fine-Art-of-Sniffing-Out/238907; T.S. Eliot – Choruses from The Rock; Collecting transport
and travel data in the Pacific Islands – Fiji’s first national household travel survey Kate Mackay1 , Elizabeth Ampt2 , John Richardson3 , Lui
Naisara; “ “Knowledge speaks, but wisdom listens” ― Jimi Hendrix