Embed Size (px)
Citation preview

1 Coordinated Signal Software - Chris Wilson and Simon KinnearNovember 10
Coordinated Signal Software Evaluation
Offline Optimisation Tools for SCATS
Chris Wilson
Simon Kinnear

November 102 Coordinated Signal Software - Chris Wilson and Simon Kinnear
Background
• RTA appoints Halcrow to undertake an
assessment of RTA coordinated signal
software needs, Nov 08.
• Halcrow facilitate several workshops and
undertake some practical applications of
coordinated signal software, Dec 08-
Mar10.
• Based on study findings RTA begin
dialogue with JCT Consultancy
manufacturers of LinSig, Apr10 – ongoing.
• Aug 10, RTA issue letter stating:
“…LinSig v3.0 (SCATS) is most
appropriate alternative to SCATES for
coordinated signal operation.”
November 103 Coordinated Signal Software - Chris Wilson and Simon Kinnear
RTA Requirements
• Sydney Coordinated Adaptive Traffic Signals (SCATS) requires
offline offset optimisation and RTA responsible for growing number
of signals (3300+).
• RTA looking for modern, intuitive software to provide quick
assessments of offline coordination.
• RTA staff require understanding of linked signal operations to
assist:
• Network Operations; and
• Review Consultants’ DA Supporting Evidence.
• Simple model verification and flexible reporting.

November 104 Coordinated Signal Software - Chris Wilson and Simon Kinnear
Desirable Features of Replacement Software
• Simple conversion of SCATES data files into replacement
software’s format (large library of RTA files).
• Conversion of replacement software output into SCATS
data.
• Satisfaction that algorithms are as good or better than
SCATES.
• Model red arrows and trailing turns.
• Regional settings to adjust terminology if needed.
• Similar outputs to SCATES, e.g. stops, delays.
• Economic analysis capability.
• Visualisation of network operation as a check on the
model.

5 Coordinated Signal Software - Chris Wilson and Simon KinnearNovember 10
SCATESPrincipal Author: Arthur Sims
Commercial Development in 1980s at RTA
November 106 Coordinated Signal Software - Chris Wilson and Simon Kinnear
Background
• SCATES calculates optimum phasing designs, phase splits and cycle
lengths for traffic signals, and calculates optimum offsets for linear
and network coordinated traffic signal systems, providing offset and
split data for SCATS.
• Halcrow has extensive experience in the application of SCATES to
existing and proposed traffic signal systems, and can utilise the
SCATES program for:
• determination of warrants for signal co-ordination
• analysis of road design projects involving multiple signal controlled
intersections that interact
• hourly and annual delay, costs, fuel and total annual operating costs
• analysis of phasing designs for isolated or coordinated intersections.

November 107 Coordinated Signal Software - Chris Wilson and Simon Kinnear
SCATES did what it was asked to do…
SCATES -> SCATS Data Exchange Features:
• Stretch phase specification;
• LoS at each intersection and approach;
• Pre-defined intersection types
• Signal sequences from SCATS phase library;
• Delay to turning traffic due to pedestrians crossing explicitly modelled;
• Import LX (Cycle lengths, splits data, PP data and LP data);
• Turn bay length requirements;
• Mode for normal SCATS split plan or incremental splits operation;
• Pedestrian crossing Data (PX); and
• Annualised costs of intersection operation

November 108 Coordinated Signal Software - Chris Wilson and Simon Kinnear
SCATES GUI and Reporting

November 109 Coordinated Signal Software - Chris Wilson and Simon Kinnear
Simple Isolated Traffic Signal Concepts
1. Movements -> Phases
Movements Phases
Phase Time
(Green Time + Yellow Time + All Red Time)
Effective green time
Flo
w r
ate
pcu/h
r
Clearance
lost time
Time
Start Up lost time
Saturation
Flow Rate
@ Each Signal Head
SCATS GUI
2. Phase Times (splits)
3. Cycle Time

November 1010 Coordinated Signal Software - Chris Wilson and Simon Kinnear
Linked Traffic Signal Concepts
1. Time Distance Diagram
Time Distance Diagram
S1 S2
Start Green S1
Start Green S2
Offset (s)
2. Offsets

November 1011 Coordinated Signal Software - Chris Wilson and Simon Kinnear
3. Platoon Dispersion
0m 100m 300m 500m 700m 1000m
Time
Flo
w R
ate
as
% S
atu
rati
on
Saturation Profile Arrival Profile
4. Cyclic Flow Profiles
Departure Profile
Linked Traffic Signal Concepts contd.

November 1012 Coordinated Signal Software - Chris Wilson and Simon Kinnear
Signal Design - The RTA Way or the Highway
RTA objective is to promote safety and optimise capacity signalised
intersection design in the following way:
• Minimise no. of phases (make best use of time available)
• Minimise cycle time
• Run as many compatible movements as possible together
• Restrict each phase to non-conflicting movements
• Allow each movement to run in as many phases as possible
Source: RTA Traffic Signal Design – Section 7 Phasing & Signal Group Display Sequence
Other useful references:
•Traffic signal operation (New South Wales, Australia) RTA-TC-106
•Standard for Single Diamond Overlap Phasing-Guidelines for Developing, TS-TN-026, RTA
•Austroad Guide to Traffic Management Part 9: Traffic Operations
•General Principles of Traffic Control by Light Signals, Dept of Transp. Traffic Advisory Leaflet 1/06

November 1013 Coordinated Signal Software - Chris Wilson and Simon Kinnear
Consultants need to be aware of RTA preferences
When to introduce:
• Pedestrian protection
• Split approach
• Double Diamond Overlap
• Leading/Trailing/ Filtering/Non Filtering Turns
• LTOR
Design has to fit in with:
• Local timing settings
• Overall SCATS Network Settings

November 1014 Coordinated Signal Software - Chris Wilson and Simon Kinnear
3 Study Networks
1. Market Street, Sydney CBD
2. Parramatta Road, Haberfield
3. Spit-Military Road, Mosman

November 1015 Coordinated Signal Software - Chris Wilson and Simon Kinnear
Analytical Framework
Area of Assessment Assessment Criteria
Network
Description
Ability of software to deal with NSW road characteristics and signal control standards. Criteria will
include:
NSW terminology
left turns through pedestrians
Short Lane overspills
Left Turn on Red
Modelling of SCATS
Model
Complexity
Assessment of the detail to which each package models the network, including:
Qualitative assessment of the relative time required to build the model network
Input requirements
Practical network sizes
Model runtimes
Traffic Assignment
Congested
Conditions
The ability of each package to replicate the conditions associated with a congested network. This
includes:
Exit blocking at intersections
Saturation flow adjustments
‘Wasted’ green time (i.e. more green time than can be used, due to downstream congestion)
Journey TimesThe ability of each package to replicate actual network journey times. Travel times derived from
RTA E-Tag readers and in-car journey times from 2007 along the corridor will be used as a
comparison.
Reporting
A comparison of the model outputs, including:
Report formats
Level of Service outputs
Ease of manipulation of data tables

November 1016 Coordinated Signal Software - Chris Wilson and Simon Kinnear
Key Features Comparison
Network Feature
SCATES TRANSYT13 LinSig 3.0
CTM Model PDM Model
Exit blocking
Traffic assignment 4 2 2 1
Model runtimes 1 3 1 4
Practical network size limits 3 1 1 4
Automatic saturation flow adjustment
Report format 4 2 2 1
Use of Australian terminology
Short lane queue spill back
Left turn through Pedestrians
Short lanes
LOS
Specifically Modelled Not Modelled Can be Modelled With Some Effort
Ranking 1-4 (1 Best – 4 Worst)

November 1017 Coordinated Signal Software - Chris Wilson and Simon Kinnear
Spit-Military Road
13
2
4
5
7
6
8
14
15
9 10 11
12
13
16
17
12 Signalised Intersections
5 Pedestrian Crossings
5 km of Arterial Road

November 1018 Coordinated Signal Software - Chris Wilson and Simon Kinnear
13
2
4
5
7
6
8
14
15
9 10 11
12
13
16
17
Study Results
Inbound E-Tag Journey Time Comparison (Medusa St to Belmont St)
Observed
RR67 Un-calibrated Model
Journey Times (mins:secs)
SCATS Calibrated Model Journey
Times (mins:secs)
SCATES LinSig TRANSYT SCATES LinSig TRANSYT
Inbound In-Car Journey Time Comparison (Parriwi Rd to Ben Boyd Rd)
9:47 7:05 8:16 7:00 7:32 11:15 9:19
Outbound In-Car Journey Time Comparison (Ben Boyd Rd to Parriwi Rd)
9:03 8:26 7:31 7:37 10:26 8:54 8:08
5:38 4:32 5:26 4:32 4:55 6:17 5:25

19 Coordinated Signal Software - Chris Wilson and Simon KinnearNovember 10
TRANSYT13
TRL, Crewthorne, UK since 1967
November 1020 Coordinated Signal Software - Chris Wilson and Simon Kinnear
Background
• The grandfather of coordinated signal software – pedigree in academic
research
• Large networks easily modelled (up to 200 nodes, 1000 links)
• 2 traffic models – Platoon Dispersion Model, Cell Transmission Model
• Most widely adopted throughout the world
• Formed the basis for TRANSYT-7F (US)
• Was academically driven, now commercial product

November 1021 Coordinated Signal Software - Chris Wilson and Simon Kinnear
• Complex flared approaches and adjacent lane blocking
• Explicit identification of pedestrian and tram links
• Ability to enter custom parameters for bus and tram links
Key Features
Bus Parameters
85300.471570
Travel Time
Coefficient2
Travel Time
Coefficient1
Acceleration
(ms^[-2])
Dispersion
Coefficient2Dispersion
Coefficient1
Tram Parameters
85300.47070
Travel Time
Coefficient2
Travel Time
Coefficient1
Acceleration
(ms^[-2])
Dispersion
Coefficient2Dispersion
Coefficient1
• Intuitive network building
• Cell-transmission model (CTM) enables specific analysis of blocking
• Time-varying flows
• Analysis sets and multiple demand sets

November 1022 Coordinated Signal Software - Chris Wilson and Simon Kinnear
Cell Transmission Model
• Models spatial as well as temporal extent of queues
• Divide road space into “cells”, and time into steps
• “Transmit” traffic from cell to cell at each time step
cell 1 2 3 4 5 ... ...
Cell Flows and Occupancy from CTM
Visual Display of CTM

November 1023 Coordinated Signal Software - Chris Wilson and Simon Kinnear
TRANSYT User Interface

November 1024 Coordinated Signal Software - Chris Wilson and Simon Kinnear
TRANSYT14
• Isolated signal controlled
intersections
• Degree of saturation
penalties
• New lane and traffic stream
structure
• New signal timings mode
• Controller stream (separates
signal groups from network
structure)
• Phase or signal group
optimisation
• RR67 saturation flow
estimation by lane

25 Coordinated Signal Software - Chris Wilson and Simon KinnearNovember 10
LinSig 3.0
JCT Consultancy, Lincoln, UK since 1980s
November 1026 Coordinated Signal Software - Chris Wilson and Simon Kinnear
Background
• Controller specific limitations placed on phasing.
• Individual lanes (not links) modelled.
• Intuitive to use for the traffic engineer/modeller.
• Only small networks can be modelled (up to 20 nodes, 100 links).
• Calculates vehicle routing over entire network.
• Undertakes matrix estimation.
• Now direct competitor to TRANSYT .

November 1027 Coordinated Signal Software - Chris Wilson and Simon Kinnear
SCATS Based Terminology
Phases View
SCATS Based
Terminology
Mode Indicator
Signal Groups

November 1028 Coordinated Signal Software - Chris Wilson and Simon Kinnear
LinSig User Interface

November 1029 Coordinated Signal Software - Chris Wilson and Simon Kinnear
LinSig Reporting and Model Verification
• Print user definable areas,
labelling, notes etc.
• Report Builder (RTF
format) allows user
defined tables, graphics to
be presented together.
• Export graphics to CAD,
Word etc.
• Cyclic Flow profile graphs.
• Queue and Storage graphs.
Flow Deficit due to
insufficient flow on
a route between B-A

30 Coordinated Signal Software - Chris Wilson and Simon KinnearNovember 10
SCATS Opportunities
Using SCATS data to calibrate models
November 1031 Coordinated Signal Software - Chris Wilson and Simon Kinnear
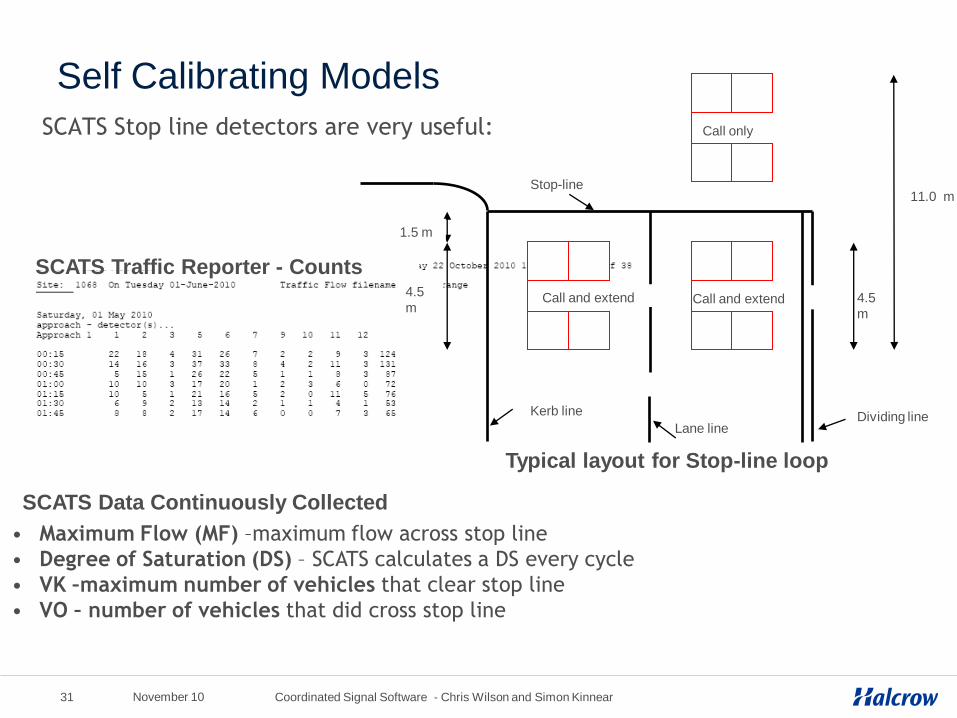
SCATS Traffic Reporter - Counts
Self Calibrating Models
SCATS Stop line detectors are very useful:
4.5
m
1.5 m
4.5
m
11.0 m
Typical layout for Stop-line loop
Call only
Call and extendCall and extend
Dividing line
Stop-line
Lane line
Kerb line
• Maximum Flow (MF) –maximum flow across stop line
• Degree of Saturation (DS) – SCATS calculates a DS every cycle
• VK –maximum number of vehicles that clear stop line
• VO – number of vehicles that did cross stop line
SCATS Data Continuously Collected

November 1032 Coordinated Signal Software - Chris Wilson and Simon Kinnear
Variation of ratio of Vo/Vk as Degree of Saturation Increases
Large vehicles or fast moving traffic
Practical range up to DS 100%
Lane Blocking for DS>100%
and Ratio Vo/Vk < 1

November 1033 Coordinated Signal Software - Chris Wilson and Simon Kinnear
Variation of Vo and Vk over 24 hour period
Variation of Degree of Saturation over 24 hour period
Vo, Original Volume
Vk, Reconstituted Volume
Due to exit blocking

November 1034 Coordinated Signal Software - Chris Wilson and Simon Kinnear
Summary & Conclusions
• RTA have adopted LinSig 3.0 software for analysis of coordinated
signal operation.
• RTA have their own unique requirements for software that can be
utilised with SCATS.
• SCATES has all the necessary features but has not moved on in
recent years.
• UK software (TRANSYT and LinSig) has a long pedigree of
application and research that can be modified for Australian
terminology and signal operation.
• Like any model the skill of the modeller is paramount as default
settings are NEVER adequate and RTA need calibrated models.